Abstract
Protecting the environment by improving the crop-system nitrogen (N) use efficiency (NUE) while maximising yield and quality is a primary challenge for modern agriculture, and under-standing the processes that govern N fluxes in the plant-soil sys-tem is essential to improve NUE. An on-farm study was conducted over two fall-winter seasons to evaluate the NUE, agronomical and physiological response of romaine (var. longifolia, cv Manavert) and red oak-leaf (var. crispa, cv Aruba) lettuce (Lactuca sativa L.) to different N-rates (0, 60, 120, 180 kg ha–1 of N). Nitrogen rate influenced all tested parameters, including plant fresh and dry weight, N accumulation, leaf NO3–and dry matter content, NUE indices, N nutrition index (NNI), soil residual N and the estimated N losses at the end of the crop season. Fresh yield, dry weight and N-accumulation response to N rate were influ-enced by lettuce genotype. Manavert had higher N recovery, NUE, and lower leaf NO3–concentration than Aruba. Analysing the NNI overtime, 120 kg ha–1of N assured an optimal N status in both Manavert and Aruba, while N deficiency and excess were observed at lower and higher N-rates, respectively. An empirical
relationship was observed between NNI and leaf NO3– concentra-tion, suggesting that leaf NO3–concentration may be used to pre-dict NNI and thus the crop N status. The relationship between NNI and leaf NO3–concentration may be used to define optimal leaf NO3–concentration ranges for the rapid and site-specific assess-ment of the crop N status, and the dynamic adjustassess-ment of N-fertil-isation, contributing to improve crop NUE, minimise N-losses, and optimise yield and quality of lettuce crops.
Introduction
Matching temporal and spatial nitrogen (N) supply with N demand in vegetable crops, without incurring in excess or defi-ciency is still a challenging task for growers. Especially when dealing with crops like lettuce, characterised by shallow roots, high sensitivity to N deficiency (Broadley et al., 2000), relatively low N uptake efficiency (Greenwood et al., 1989), and high nitrate-accumulation capacity (Santamaria, 2006).
In spite of the relatively low N demand, during the early growth stage, lettuce crops require the maintenance of adequate levels of N in the root zone, because N shortage, even if tempo-rary, can permanently compromise the final yield (Broadley et al., 2000). Nitrogen demand in lettuce crops is particularly high in the last third of the growing cycle, and sub-optimal N supply may lead to N deficiency with consequent yield reduction, poor quality and maturity delay (Salomez and Hofman, 2009). On the other hand, over applications of N, exceeding crop N demand, may cause N luxury consumption with consequent nitrate accumulation (Di Gioia et al., 2013), and increase the risks of N losses, causing environmental pollution and contamination of water bodies and drinking water.
Vegetables are considered one of the major sources of human nitrate intake (Santamaria, 2006; Di Gioia et al., 2013). Despite there are increasing evidences that nitrate and nitrite may have a beneficial action against cardiovascular diseases (Hord et al., 2009), nitrates are considered anti-nutrients. Lettuce commercial-isation is in fact subject to limits of the nitrate concentration set by the EC Regulation No. 194/97 (European Commission, 1997), recently amended and integrated by the EC Regulation No. 1258/2011 (European Commission, 2011), or to limits imposed by importing Countries and food-chain stores (Di Gioia et al., 2013). Attempting to protect public health and environment, govern-ments have implemented regulatory or volunteer measures and monitoring programmes aimed at reducing water pollution from agricultural sources. In Europe, with the Nitrates Directive (91/676/EEC), about 39.6% of the European Union (27 Member States) area has been designated as nitrate vulnerable zone (NVZ), and all Member States have defined good agricultural practices Correspondence: Maria Gonnella, Institute of Sciences of Food
Production, National Research Council, via Amendola, 122/O, 70126 Bari, Italy.
E-mail: [email protected]
Key words: EU Regulation No. 1258/2011; Lactuca sativa; Nitrate con-centration; Nitrogen nutrition index; Nitrogen recovery.
Acknowledgments: this research was funded by the Inter-Regional research and innovation project AZORT. The authors wish to thank Nicola Gentile and Mina Florio for field and laboratory technical assis-tance.
Received for publication: 30 June 2016. Revision received: 7 October 2016. Accepted for publication: 15 October 2016.
©Copyright F. Di Gioia et al., 2017 Licensee PAGEPress, Italy
Italian Journal of Agronomy 2017; 12:806 doi:10.4081/ija.2017.806
This article is distributed under the terms of the Creative Commons Attribution Noncommercial License (by-nc 4.0) which permits any non-commercial use, distribution, and reproduction in any medium, provid-ed the original author(s) and source are crprovid-editprovid-ed.
Agronomic, physiological and quality response of romaine
and red oak-leaf lettuce to nitrogen input
Francesco Di Gioia,
1,2Maria Gonnella,
3Vito Buono,
1Osman Ayala,
3Pietro Santamaria
11
Department of Agro-Environmental and Territorial Sciences, University of Bari, Bari, Italy;
2Institute of
Food and Agricultural Sciences, South West Florida Research and Education Center, University of Florida,
Immokalee, FL, USA;
3Institute of Sciences of Food Production, National Research Council, Bari, Italy
Non
commercial
use
(GAPs) and have established action programmes in their NVZs (European Commission, 2010). Similarly, in the United States, with the definition of the Federal Total Maximum Daily Load man-date described in the Federal Clean Water Act (US Environmental Protection Agency, 2010), best management practices (BMPs) have been developed and implemented in each state, providing tools and important practices – including irrigation and fertilisation management practices aimed at reducing crop environmental impact while assuring optimal yields (Simonne et al., 2010).
The increased awareness of the potential impact of agricultural activities on the environment and on public health, and the manda-tory or volunteer adoption of GAPs and/or BMPs is leading farm-ers to a more attentive approach to crop fertiliser management. Protecting the environment by improving crops nitrogen use effi-ciency (NUE) has become one of the primary and most challeng-ing goals for farmers (Hirel et al., 2007).
Crop NUE, yield and quality are the result of a complex inter-action between plant genotype, management practices and several environmental factors, and understanding the processes that gov-ern N fluxes in the plant-soil system is of major importance in any attempt to improve NUE (Lemaire et al., 2008). A better knowl-edge of the factors that determine plant N uptake, accumulation and use efficiency during the crop cycle may enable the develop-ment of more rational fertiliser managedevelop-ment strategies and tech-nologies, thereby minimising the risks of N losses into the environ-ment (Good et al., 2004).
The optimal N rate for a given crop is not constant, but can vary considerably from cultivar to cultivar, site to site, and season to season (Ozores-Hampton et al., 2015). Therefore, practical on farm management tools are required to rationalise crop N fertilisa-tion. An approach to optimise crop N fertiliser management con-sists in implementing modern site-specific management strategies, which may involve the use of diagnostic tools for the assessment of the crop or soil N status during the growing season (Peña-Fleitas
et al., 2015), or the use of models and decision support systems
(Conversa et al., 2015). Nevertheless, the implementation of site-specific N management strategies requires knowledge and basic information on N crop demand and accumulation, soil N mineral-isation, potential N losses and residue, and crop NUE. Such basic information may be used to develop, calibrate and update predic-tive models, and to develop monitoring techniques and indicators of the soil-crop system N status, capable of detecting or predicting both N deficiency and excesses. Moreover, established indicators of the crop nutrient status, such as the N nutrition index (NNI) pro-posed by Lemaire et al. (1989) may be used to define optimal N rates, and test monitoring techniques and the reliability of diagnos-tic tools and indicators of the plant and soil N status.
Given the importance of lettuce crops, grown at global level on over a million of hectares every year (FAOSTAT, 2016), a field study was conducted to analyse and compare the agronomic, phys-iological and quality response of romaine (heading) and red
oak-leaf (non-heading) lettuce to N inputs. Specific objectives of the
study were: i) evaluate N rate effects on yield, N, nitrate and dry matter accumulation of both genotypes; ii) estimate their N recov-ery and utilisation efficiency, and potential soil N losses; iii) analyse a posteriori the crop N status and the optimal N rate for both genotypes using the NNI; and iv) evaluate the possibility to predict the NNI, and thus, the crop N status through the leaf NO3– concentration.
Materials and methods
Plant material, growing conditions and experimental
design
Two field experiments were conducted on-farm at Conversano (40° 58’ N, 17° 7’ E; 140 m asl) and Polignano a Mare (40° 59’ N, 17° 13’ E; 40 m asl), in Southern Italy, during the fall-winter sea-son of 2006-2007 (Exp-1) and 2007-2008 (Exp-2), respectively. In both sites the soil was a typical Mediterranean Terra Rossa (red
earth) clay soil, classified as Alfisols according to the U.S.
Department of Agriculture soil taxonomy (USDA, 2003), or as Luvisols according to the World Reference Base for soil resources (WRB, 2006). Soil chemical properties were as follows (for Exp-1 and Exp-2, respectively): organic matter 14.4 and 14.7 g kg–1, total N 1.02 and 1.35 g kg–1, organic carbon 8.4 and 8.5 g kg–1, C/N 8.13 and 6.3, P2O5364.7 and 688.3 mg kg–1, K2O 130.6 and 196.9 mg kg–1, cation exchange capacity 291.9 and 258.8 meq kg–1, pH 7.8 and 7.0, electrical conductivity 0.5 and 1.1 dS m–1.
On 3 November of 2006 and 30 October of 2007, romaine (var.
longifolia, cv Manavert; Enza Zaden Italia s.r.l., Tarquinia, Italy)
and red oak-leaf (var. crispa, cv Aruba; Enza Zaden Italia s.r.l.) let-tuce (Lactuca sativa L.) were transplanted at the third true-leaf stage in rows 0.35 m apart, establishing a density of 9.5 plants m– 2. Both cultivars were harvested at 105 and 94 days after trans-planting (DAT), in Exp-1 and Exp-2, respectively.
In both experiments, four N rates [0 (N0), 60 (N60), 120 (N120), and 180 (N180) kg ha–1of N] were applied through side-dressing, 50% as ammonium sulphate in pre-transplanting and 50% as ammonium nitrate in post transplanting at 48 and 40 DAT in Exp-1 and Exp-2, respectively. An unfertilised control was included to calculate the crop NUE, and estimate N soil mineralisation. Treatments were arranged according to a split plot experimental design with three replicates in both experiments. The cultivars (Manavert and Aruba) were arranged in the main plots, while N rates were randomised in subplots of 21 m2(3.5 m wide and 6 m long). Crop water requirements were satisfied by rainfall events (about 64.6 mm in Exp-1 and 144 mm in Exp-2) and supplemental irrigation (about 85 mm and 50 mm, respectively) applied using low-pressure mini-sprinkler irrigators, which represents the most common irrigation method used in the area for leafy vegetables. An integrated crop protection management approach was used to control weeds, pests, and main diseases. Meteorological data for both seasons were recorded and provided by the local public serv-ice, considering the closest weather station of the existing network. Mean daily air temperature was on average 10.3 and 9.1°C in Exp-1 and Exp-2, respectively. In Exp-Exp-1, daily minimum and maximum air temperature ranged from 0 to 9.1°C and from 12.3 to 22.4°C, respectively (Figure 1). In Exp-2, daily minimum and maximum air temperature ranged from -4.7 to 2.4°C and from 15.8 to 23.4°C, respectively. Temperatures below 0°C reduced plant growth but did not damage both lettuce genotypes. During the growing sea-son, cumulative solar radiation was 978 and 503 MJ m–2in Exp-1 and Exp-2, respectively.
Plant growth analysis, tissue and soil laboratory analysis
Total aboveground fresh weight (FW) was measured on a sam-ple of six plants per plot, at 20, 47, 61, 75 and 105 DAT in Exp-1, and 28, 49, 66 and 94 DAT in Exp-2. Plant samples were oven-dried at 65°C until constant weight to determine dry weight (DW) and dry matter (DM) content. Oven-dried plant samples were fine-ly ground through a mill (IKA; Labortechnik, Staufen, Germany)
Non
commercial
use
and used for quantitative chemical analyses. Total N was deter-mined by Kjeldahl method (2300 Kjeltec Auto Analyser) with the addition of salicylic acid for the recovery of the NO3-N (Simonne
et al., 1997). Nitrates, previously extracted from dry matter
sam-ples of 0.5 g with 50 mL of sodium carbonate (3.5 mM) and sodi-um bicarbonate (1.0 mM) solution, were determined by ion chro-matography (model Dionex DX500; Dionex Corp., Sunnyvale, CA, USA) as described by Boari et al. (2013).
Only for the cv Manavert, soil samples were collected before N treatment (N0, N60, N120and N180) application and at harvest, 105 and 94 DAT for Exp-1 and Exp-2, respectively, to monitor the soil mineral N (NO3–and NH4+) content. Using an Eijkelkamp soil auger with a diameter of 5 cm, four borings per plot were taken at 30 cm depth, excluding border rows. Subsamples were combined in a single bulk sample per plot. Soil samples were stored in freez-er (-18°C) pending analysis, then wfreez-ere defrosted at 4°C and extrac-tion was conducted on two subsamples within 24 hours with a 1:4 ratio (w/w) soil: 0.025 M KCl solution. The filtered solution was then analysed to determine NO3-N and NH4-N content by ion chro-matography (model QIC; Dionex Corp.). Values of NH4-N were negligible or below detection limit during both seasons (data not shown).
Soil core subsamples collected in pre-transplanting were air-dried, sieved to 2 mm, and used for soil physical and chemical characterisation.
Nitrogen use efficiency indices and nitrogen nutrition
index calculation
Total N accumulation (Nacc; kg·ha–1) was calculated multiply-ing the aboveground DW by the total N concentration. In corre-spondence of each sampling date, the critical nitrogen (Ncrit) con-tent, which is defined as the minimum N concentration in the aboveground biomass required for maximum growth, was calcu-lated as proposed by Justes et al. (1994) according to the equation parametrised by Tei et al. (2003) for lettuce:
Ncrit=4.56×DW–0.357 (Eq. 1) The NNI was calculated as proposed by Lemaire et al. (1989), dividing the measured N concentration of the aboveground bio-mass (%NDW) by the predicted %Ncrit:
NNI=%NDW/Ncrit (Eq. 2) At final harvest NUE indices were calculated for each N rate according to Elia and Conversa (2012) as follows.
First, apparent N fertiliser recovery efficiency (RECN) by the crop, which represents the kg increase in Naccper kg of applied N: RECN=(AF–A0)/NF (Eq. 3) Second, partial factor productivity of applied N (PFPN), which rep-resents the kg of product harvested per kg of applied N:
PFPN=YF/NF (Eq. 4) Third, agronomic efficiency of applied N (AEN), which represents the kg of yield increase per kg of applied N:
AEN=(YF–Y0)/NF (Eq. 5) Fourth, physiological efficiency of applied N (PEN), which
repre-sents the kg of yield increase per kg increase in Naccfrom fertiliser: PEN=YF–N0/AF–A0 (Eq. 6) where: YFis the crop yield (kg ha–1) obtained with the application of a determinate N-fertiliser (NF) rate (kg ha–1); Y0is the crop yield obtained in the unfertilised control; AFis the total plant Nacc(kg ha–
1) in aboveground biomass at maturity when an amount of NFis applied, and A0is the corresponding total plant Nacc(kg ha–1) in aboveground biomass at maturity when no N-fertiliser is applied. Nitrogen use efficiency indices were calculated both on fresh and dry weight basis.
Soil nitrogen mineralisation and losses estimate
Nitrogen derived from the mineralisation of the soil organic matter (Norganic) in each growing season was estimated by subtracting the initial soil inorganic N (Nmin) content of the top 30-cm soil layer in unfertilised control (0 kg ha–1of N) from the sum of aboveground Naccand residual soil Nminat harvest in the same soil layer accord-ing to Cui et al. (2010):
Norganic=(soilNmin (residual) + cropNacc) – soilNmin (initial) (Eq. 7) Nitrogen losses were estimated as difference between N inputs (initial soil Nmin, apparent N mineralisation, applied NF), and out-puts (aboveground Nacc, residual soil Nmin):
Figure 1. Daily minimum and maximum temperature and rainfall recorded at Conversano and Polignano a Mare (Southern Italy), during the fall-winter season of 2006-2007 (Exp-1; A) and 2007-2008 (Exp-2; B), respectively.
Non
commercial
use
Nlosses=(soilNmin (initial) + Norganic+ NF) – (Eq. 8) (soilNmin (residual) + cropNacc) where: soil Nmin(initial) and (residual) were the inorganic N content of the top 30-cm soil layer, before pre-planting fertiliser application and at harvest, respectively.
Statistical analysis
Statistical analysis was performed separately for each experi-ment. Analysis of variance (ANOVA) was performed using the GLM procedure of SAS software package (SAS Institute Inc., Cary, NC, USA). Linear and quadratic regression analyses were performed using PROC REG of SAS to estimate the parameters of the relationships between N rate and FW, DW, and Naccat harvest. All means were compared by the least significant difference (LSD) test, at 5% level of probability.
Results
Effect of nitrogen supply on fresh yield, dry biomass
and nitrogen accumulation
Nitrogen rate and lettuce genotype influenced plant FW, DW and Nacc(Figure 2). In both experiments, at harvest (105 and 94 DAT in Exp-1 and Exp-2, respectively) FW, DW and Naccwere on average 2.2, 1.8 and 1.5 times higher in Manavert than in Aruba (Figure 2), respectively.
Except for the Naccresponse to N rate of the cv Manavert in Exp-2 (Figure 2C), a second order polynomial function showed always a better fit than the linear function, as demonstrated by the higher adjusted R2(AdjR2) coefficient (Table 1). Nevertheless, the quadratic coefficients were very low, especially in the case of the relationship between N rate and DW (Table 1).
Based on the estimated quadratic functions the optimal N rates to achieve the maximum fresh yield were 182 and 148 kg ha–1for Manavert, and 160 and 169 kg ha–1of N for Aruba, in Exp-1 and Exp-2, respectively (Figure 2A). Considering the DW, estimated optimal N rates ranged between 145 and 160 kg ha–1of N for both cultivars and experiments (Figure 2B).
Effect of nitrogen supply on nitrate and dry matter
plant content
Leaf NO3–concentration was higher in Aruba than in Manavert in both experiments (Figure 3A and B). In both experiments, Aruba increased the leaf NO3– concentration with increasing N rate, whereas Manavert increased the leaf NO3– concentration only when grown with N120and N180. Maximum leaf NO3–concentration values achieved with N180were on average 1534 and 1881 mg kg–
1of FW for Aruba, and 1042 and 685 mg kg–1of FW for Manavert, in Exp-1 and Exp-2, respectively (Figure 3A and B). In Exp-1, the DM percentage was not different between the two cultivars at N60. When non-fertilised (N0) Manavert had a higher DM content com-pared to Aruba, while when fertilised with the highest N rates (N120 and N180) Manavert DM content was lower than in Aruba. Instead, in Exp-2 the DM content was consistently higher (P=0.01) in Aruba than in Manavert regardless the N rate (Figures 3C and D). The DM content was higher in unfertilised plants than in fertilised ones, in both experiments, except for Aruba grown with N60that in Exp-2 had DM values similar to the unfertilised plants. In Exp-1 only for Manavert, DM content was higher with N60 than in plants grown at higher N rate (Figure 3C).
An inverse relationship was observed between DM and leaf NO3–concentration: with increasing the N fertiliser rate the leaf NO3–concentration increased, while the DM content decreased in both cultivars and experiments (Figure 4).
Nitrogen use efficiency and its components
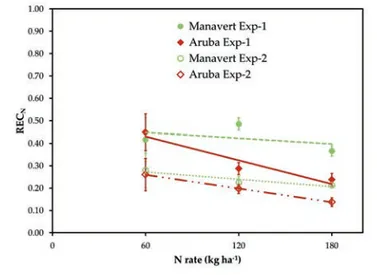
In Exp-1, RECN was lower (P=0.02) in Aruba than in Manavert (32% vs 42%, respectively), while in Exp-2 it was on average 22% and was not different between cultivars (Figure 5). In both experi-ments the RECN was not significantly influenced by N rate in Manavert, while it decreased with the highest N rate in Aruba
Figure 2. Final aboveground fresh weight (A), dry weight (B), and N accumulation (C) as functions of nitrogen fertiliser rates in
romaine (cv Manavert) and red oak-leaf (cv Aruba) lettuce grown
at Conversano and Polignano a Mare (Southern Italy), during the fall-winter season of 2006-2007 (Exp-1) and 2007-2008 (Exp-2), respectively. Vertical bars represent±standard error (n=3).
Non
commercial
use
(Figure 5). The PFPNdecreased (P<0.001) as the N rate increased in both cultivars and experiments (Figure 6A). In both experiments the PFPNwas higher (P<0.001) in Manavert than in Aruba, howev-er, PFPNvalues were lower in Exp-2 than in Exp-1. The AEN was lower (P<0.001) in Aruba (on average 4.2 kg of DW kg–1of N) than in Manavert (on average 9.3 kg of DW kg–1of N) in Exp-1, whereas no differences were found in Exp-2, AENwas on average
2.8 and 3.6 kg of DW kg–1of N in Aruba and Manavert, respec-tively (Figure 6C). The PENranged on average between 13 and 14 kg of DW per kg of increased Nacc, in both cultivars and experi-ments regardless the level of N supply, except for the cv Manavert that in Exp-1 had higher (P<0.001) PENvalues with N60(32.5 kg of DW kg–1N) than with N120(17.8 kg of DW kg–1N) and N180 (16.4 kg of DW kg–1N).
Figure 3. Effect of nitrogen fertiliser rate on nitrate accumulation (A and B) and dry matter content (C and D) observed at final harvest in cv Aruba (red oak-leaf) and cv Manavert (romaine), grown at Conversano and Polignano a Mare, during the fall-winter season of 2006-2007 (Exp-1) and 2007-2008 (Exp-2), respectively. Vertical bars represent±standard error (n=3). Different letters indicate signif-icant differences at P=0.05.
Table 1. Parameter estimates, their significance, and adjusted R2for the function representing the fresh weight-, dry weight- and nitro-gen uptake-nitronitro-gen rate relationships in lettuce cv Aruba and Manavert grown with different levels of nitronitro-gen supply in two Mediterranean locations in 2006-2007 and 2007-2008 fall-winter cropping seasons.
Experiment Cultivar Intercept° Slope° Quadratic Adjusted R2 Adjusted R2 coefficient° quadratic linear Estimate P Estimate P Estimate P function function FW-N rate relationship Exp-1 Aruba 10.02 0.01 0.12 0.01 -0.00036 0.03 0.81 0.71
Manavert 15.56 0.01 0.33 0.01 -0.00090 0.01 0.92 0.85 Exp-2 Aruba 9.25 0.01 0.08 0.01 -0.00024 0.12 0.71 0.65 Manavert 21.93 0.01 0.21 0.01 -0.00071 0.01 0.85 0.69 DW-N rate relationship Exp-1 Aruba 0.83 0.01 0.006 0.01 -0.000020 0.07 0.72 0.63 Manavert 1.49 0.01 0.015 0.01 -0.000053 0.01 0.83 0.66 Exp-2 Aruba 0.67 0.01 0.005 0.04 -0.000015 0.17 0.51 0.44 Manavert 1.27 0.01 0.006 0.04 -0.000019 0.21 0.55 0.51 N uptake-N rate Exp-1 Aruba 22.15 0.01 0.46 0.01 -0.00130 0.04 0.85 0.78 relationship Manavert 23.20 0.01 0.60 0.01 -0.00121 0.08 0.92 0.90 Exp-2 Aruba 21.13 0.01 0.32 0.01 -0.00100 0.05 0.76 0.67 Manavert 35.92 0.01 0.28 0.01 -0.00038 0.44 0.85 0.86 FW, fresh weight; N, nitrogen; DW, dry weight; Exp-1, field experiment 1 conducted on-farm at Conversano (40° 58' N, 17° 7' E; 140 m asl) during the fall-winter season of 2006-2007; Exp-2, field experiment 2 conducted on-farm at Polignano a Mare (40° 59' N, 17° 13' E; 40 m asl) during the fall-winter season of 2007-2008. °Intercepts, slopes and quadratic coefficients in italics are not significantly different from zero at the 5% level.
Non
commercial
use
Calculated on FW basis PFPN, AENand PENassumed a differ-ent trend as compared to the same indices calculated on DW basis: PFPN, AENand PEN values were consistently higher in Manavert than in Aruba in both experiments (Figure 6B, D, F).
Soil nitrate residual and nitrogen losses estimate
In Exp-1, at harvest, residual soil NO3-N content in the top 30-cm of soil in plots of Manavert was not influenced by N rates and was on average 26.8 kg ha–1(Figure 7A). In Exp-2, residual soil NO3-N content was on average 15.0 kg ha–1, ranging from 6.6 kg ha–1 in treatment N60to 29.0 kg ha–1in treatment N180. Residual soil NO3-N was higher (P=0.003) with N180than with lower N rates (Figure 7A). In both experiments, estimated N losses from the top 30-cm of soil in plots of Manavert increased (P<0.001) with increasing the N rate (Figure 7B). Estimated N losses for treat-ments N60, N120and N180were 32, 55 and 111 kg ha–1in Exp-1, and 44, 83 and 125 kg ha–1in Exp-2, respectively (Figure 7B).
Nitrogen nutrition index and relationship with nitrate
content
Analysing the NNI time course during the crop cycle, for each level of N supply, it was observed that in both genotypes and experiments, the N status of plant grown at different N rates started to diverge at 60 DAT. After 60 DAT, the NNI was always lower than 1.0 (optimal N status) in unfertilised plants or in those grown at lower N rate (N60), proving the occurrence of N deficiency. In plants grown at higher N rates (N120and N180) the NNI remained close to 1.0 during the entire crop cycle, and only at harvest, plants fertilised with N180had NNI values above 1.0, revealing the occur-rence of N luxury consumption (Figure 8). Based on the NNI time-course, in both cultivars and experiments, only the application of 120 kg ha–1of N assured the maintenance of an optimal crop N sta-tus during the entire crop cycle, while N deficiency or luxury con-sumption were observed at lower and higher N rates, respectively. Analysing the variation of the leaf NO3-N (g 100 g–1of DW) to total-N (g 100 g–1of DW) ratio in relation to the NNI, in both cultivars and experiments, it was observed that the fraction of NO3
-N in the leaves markedly increases with increasing the -N-NI (Figure 9A). Considering as optimal NNI values of one, with a tol-erance of ±15%, the fraction of NO3-N ranged from 0.1 to 20% when the NNI was lower than 0.85 (N deficiency), from 14 up to 72% when the NNI was close to 1 (optimal N status) and was detected only one point at 55% of NO3-N when the NNI was high-er than 1.15 (N excess).
Examining the relationship between NNI and the leaf NO3– concentration (mg kg–1 of FW) of both cultivars (Figure 9B), it was observed that the leaf NO3–concentration ranged from 0 to 520 mg kg–1of FW when the NNI was lower than 0.85, from 230 up to 2170 mg kg–1of FW when the NNI was within the optimal interval (0.85<NNI<1.15), and the leaf NO3– concentration was about 1870 mg kg–1of FW in the only point with value of NNI above 1.15.
Discussion
Agronomic and physiological response of lettuce to
nitrogen input
The variability of the crop response to N supply, observed in this study (Figure 2), confirms the existence of a complex interac-tion between plant genotype and several environmental factors (Ozores-Hampton et al., 2015; Di Gioia et al., 2017), which makes the prediction of crop N fertiliser requirement a difficult task.
The most common method used to define the optimal crop N requirements is based on the estimate of the maximum yield, or the maximum economical return (Ozores-Hampton et al., 2012), using response curves to increasing N rates as shown in Figure 2A and B. However, data collected from N rate studies can be fitted to sev-eral statistical models, and the choice of the most appropriate model in each particular cropping situation is not obvious (Cerrato and Blackmer, 1990; Bélanger et al., 2000). In this study the quad-ratic terms were very low and in some cases not significantly dif-ferent from zero. When in doubt, the adjusted coefficient of
deter-Figure 4. Variation of the dry matter content (%) in function of nitrate concentration in cv Manavert (romaine) and cv Aruba (red oak-leaf), grown at Conversano and Polignano a Mare, dur-ing the fall-winter season of 2006-2007 (Exp-1) and 2007-2008 (Exp-2), respectively. Regression lines are negative power func-tions representing the specific relafunc-tionships between the two vari-ables in both cultivars and experiments (n=3).
Figure 5. Effect of nitrogen fertiliser rate on apparent recovery of applied nitrogen at final harvest for cv Manavert (romaine) and cv Aruba (red oak-leaf), grown at Conversano and Polignano a Mare, during the fall-winter season of 2006-2007 (Exp-1) and 2007-2008 (Exp-2), respectively. Vertical bars represent±standard error (n=3).
Non
commercial
use
mination (AdjR2) was used as discriminant between different mod-els. Nevertheless, different models with similar R2may give differ-ent optimal fertiliser rates (Cerrato and Blackmer, 1990). Moreover, response curves are usually quite flat around the maxi-mum point (Burns, 2006), and quadratic models tend to overesti-mate the response, if the maximum point on the curve is taken as optimal fertiliser rate (Cerrato and Blackmer, 1990). Although sim-ple, as observed in this study, the major limit of this method is the variability of the estimated optimal N fertiliser rate between years, seasons and locations. Such variability may be explained in part by the variability of the amount of N available in the soil, deriving from different sources, other than the fertiliser applications. Available N in the soil is in fact the result of a complex balance, in which inputs (N deriving from mineralisation) and outputs
(leach-ing, volatilisation) of N in the root-zone are determined by several variable and interacting factors (soil type, soil organic matter con-tent, soil temperature, climatic conditions, microbiological fertili-ty). Finally, comparing the N response of two different lettuce types, it was observed that despite the higher fresh yield and dry biomass produced by Manavert as compared to Aruba (Figure 2A and B), the optimal N rates estimated for the two cultivars using the yield curve-response method were similar. Moreover, in Exp-2 the estimated optimal N rate was higher in Aruba than in Manavert. These results further support the hypothesis that the quadratic model overestimates the optimal N rate (Cerrato and Blackmer, 1990). The lower response to N fertilisation of the aboveground DW biomass compared to the fresh biomass (Figure 2A and B) may be explained by the lower DM content observed in plants
Figure 6. Effect of nitrogen fertiliser rate on partial factor productivity (A, B), agronomic efficiency (C, D), and physiological efficiency (E, F) of applied nitrogen, calculated on dry (A, C, E) and fresh (B, D, F) weight basis, at final harvest for cv Manavert (romaine) and cv Aruba (red oak-leaf), grown at Conversano and Polignano a Mare, during the fall-winter season of 2006-2007 (Exp-1) and 2007-2008 (Exp-2), respectively. Vertical bars represent±standard error (n=3).
Non
commercial
use
grown at higher N rate (Figure 3C and D). Likely, the lower DM content of plants grown at higher N rate was determined by the higher nitrate accumulation. Nitrates, exerting an osmotic effect, increase the capacity of the plant to retain water, and cause a decrease of DM content, which is consistent with the negative rela-tionship observed between nitrates and DM content, in both culti-vars and experiments (Figure 4), as well as in other studies (Reinink et al., 1987; Cárdenas-Navarro et al., 1999). At the same time, the osmotic effect of nitrate can explain the positive relation-ship observed between nitrate content and fresh yield (data not shown).
As hypothesised by Tei et al. (2000), the nitrate accumulation in leafy vegetables is not useful to plant growth and dry biomass accumulation, and therefore it is considered the result of N luxury consumption. However, the nitrate accumulation may cause an increase in water content, and thus, in fresh biomass, which may be not important in cereal and pulse crops, harvested with a low water content, but it assumes a significant role in leafy vegetables like lettuce, which are harvested fresh. The results of this study were in agreement with the findings of other authors (Tei et al., 2000; Dapoigny et al., 1996), who observed a relationship between plant N content and relative growth rate, only when both water contribution (fresh weight) in biomass and reduced-N (total-N minus nitrate-N) were taken into account.
These results should be duly considered in both, empirical and mechanistic crop models, currently proposed to predict crop growth, crop N uptake and crop water requirement (Cárdenas-Navarro et al., 1999). The inverse relationship between nitrate and DM content was in part considered by Seginer et al. (2004) who modified the NICOLET model, used to predict the crop N uptake, on the assumption that because of the high nitrate-N content of let-tuce, N uptake depends on plants water content.
From a quality perspective, although at harvest, leaf NO3– con-tent significantly increased with increasing N rate, the levels of NO3–accumulated in the edible portion were always lower than maximum limits set by the EC Regulation No. 1258/2011 for let-tuce grown in open field and harvested from October 1stto the end of March (4000 mg kg–1of FW). The relatively low nitrate accu-mulation observed in both cultivars and experiments may be due to the high levels of solar radiation that characterise the Mediterranean area, even during the fall-winter season. In fact, high levels of solar radiation can substantially reduce the crop nitrate accumulation by enhancing the plant nitrate-reductase activity (Weightman et al., 2012; Di Gioia et al., 2013).
The higher leaf NO3– accumulation capacity consistently observed in Aruba (non-heading) as compared to Manavert (head-ing lettuce), for two years, despite N input, highlights the impor-tance of the genotype in determining the level of leaf NO3– mulation, and the possibility to select lettuce genotypes that accu-mulate less nitrates (Burns et al., 2011).
Nitrogen recovery and utilisation efficiency of lettuce
crops
The NUE of a crop may be considered as the product of two components: i) the N uptake efficiency (NupE), that expresses the ability of a genotype to acquire nitrogen from the soil; and ii) the N utilisation efficiency (NutE), that expresses the ability of a geno-type to use N taken up to produce plant biomass. In this study, the N uptake efficiency expressed as RECNwas on average 37% and 22% in Exp-1 and Exp-2, respectively (Figure 5). According to Greenwood et al. (1989), RECN should remain constant with increasing the N rate, until N supply exceeds the crop N demand,
after which RECNshould start decreasing with increasing the N rate. In both experiments, Manavert RECNvalues remained con-stant with increasing the N rate from 60 to 180 kg ha–1, while Aruba RECNvalues decreased with increasing the N rate, suggest-ing that the two genotypes had different N requirements. The decline of RECNobserved in Aruba N180compared to Aruba N60in both experiments, indicates that the higher N rate tested exceeded the crop N demand. Therefore, in the case of Aruba N rate should not exceed 120 kg ha–1. The same N rates did not exceed the N demand of Manavert, suggesting that applications of N within the range 120-180 kg ha–1may be adequate for Manavert.
Values of RECN observed in these experiments were similar to those observed on lettuce in previous studies (Greenwood et al., 1989; Tei et al., 1999, 2000), however, were lower than those observed by Karam et al. (2002), confirming that lettuce crops are characterised by a low efficiency in recovering applied N.
Manavert was more efficient than Aruba also in terms of NutE, as expressed by the indices PFPN, AENand PEN, calculated both on dry (Figure 6A, C, E) and fresh weight basis (Figure 6B, D, F).
Proposed primarily to evaluate the efficiency of grain and pulse crops characterised by low water content, NutE indices are usually calculated on DW basis, also to enable the comparison between different species and environments. Nevertheless, the
Figure 7. Effect of nitrogen rate on residual soil nitrate-nitrogen (A) (in the top 30 cm) and apparent soil nitrogen losses (B) determined at harvest in plots of the cv Manavert (romaine), grown at Conversano and Polignano a Mare during the fall-win-ter season of 2006-2007 (Exp-1) and 2007-2008 (Exp-2), respec-tively. Vertical bars represent±standard error (n=3). Different let-ters within each experiment indicate significant differences at P=0.05.
Non
commercial
use
results of this study suggest that for lettuce crops, characterised by relatively high water content, considering that the N rate may affect the water content, it may be meaningful to express the NutE indices also on FW basis.
As expected, PFPN, which represents the yield per unit of N fertiliser applied, significantly decreased with increasing N fertilis-er rate, and was highfertilis-er in Manavfertilis-ert than in Aruba. Obsfertilis-erved PFPN values were comparable to those reported by Conversa et al. (2004) on hydroponically-grown butterhead lettuce. The scarce influence of N rate on AENin both cultivars and experiments, was mainly due to the high variability observed between replications at N60(Figure 6C), which may be explained by the fact that at lower N rates, crop yield performances are more susceptible to variations depending on the amount of N available in the soil, deriving from alternative sources, other than the fertiliser. The PENwhich repre-sents the ability of a plant to transform N acquired from fertiliser into yield, and depends mostly on the genotype characteristics and only in part on environmental factors (Dobermann, 2005), was not influenced by N supply, either when expressed in terms of DW and FW basis, except in the case of Manavert N60in Exp-1. The higher PENvalue observed in Exp-1 in plants of Manavert grown at lower N rate (N60) in comparison to those grown at higher N rates, was due to environmental factors rather than to genotype traits, as demonstrated by the variability observed between replications for
both DW and Naccin treatment N60.
Values of NutE estimated in this study were lower than those observed from other authors in cereal crops (Cassman et al., 2002; Dobermann, 2005), while were comparable to those observed by Lòpez-Bellido et al. (2005) on rainfed wheat under Mediterranean environment.
Soil nitrogen losses estimate
At the end of the crop cycle, although some residual NO3-N was found in the top 30-cm of soil in both experiments, estimated N loss from the same soil layer were high, and in treatment N180 reached 111 and 125 kg ha–1of N in Exp-1 and Exp-2, respectively, further proving the low N recovery efficiency of lettuce crops (Figure 7). Moreover, in absence of a catch crop, also soil residual NO3-N may be subject to environmental losses.
The variability of climatic conditions, soil texture, biological and chemical properties makes it difficult any kind of comparison with other situations; however, these results may be considered normal for lettuce crops, and suggest that under the specific condi-tions, the mineralisation of the soil organic matter may provide substantial amounts of N for the crop. Therefore, to improve crop NUE and minimise the risks of N losses, the amount of N poten-tially deriving from mineralisation process should be accounted in the fertilisation programme.
Figure 8. Effect of nitrogen rate on the nitrogen nutrition index time course in cv Aruba (A, C) and cv Manavert (B, D) grown at Conversano and Polignano a Mare during the fall-winter season of 2006-2007 (Exp-1) and 2007-2008 (Exp-2), respectively. Nitrogen nutrition index was calculated according to Lemaire et al. (1989) using the critical nitrogen dilution curve proposed by Tei et al. (2003) for lettuce. Standard error bars were smaller than the symbols used in the graphs (n=3).
Non
commercial
use
Nitrogen nutrition index and nitrate content as
indica-tors of the crop nitrogen status
The NNI represents an indicator of the crop N status and may be used as a guide to optimise the N fertilisation programme in terms of timing and N application rate, enabling the adjustment of N fertiliser applications to N demand and corresponding target yield, in any moment of the crop growth cycle (Lemaire et al., 2008).
Analysing a posteriori the NNI time course of a crop is possi-ble to define when N-deficiency and/or N-excess occurred, and thus, when and how much N fertiliser should be applied to the crop. In this study, the NNI analysis revealed that in both cultivars and experiments, only the application of 120 kg ha–1of N ensured the maintenance of an optimal crop N status during the entire crop cycle, while N deficiency or excess were observed at lower and at higher N rates, respectively. These results further confirm that yield N response quadratic models overestimate the optimal N rates. Examining the NNI pattern, it was observed that at lower N rates, N deficiency occurred only after 60 DAT in correspondence of the maximum crop growth rate (Figure 9); while, N excess occurred at the highest N rate, either at the beginning of the crop cycle in Exp-2, or at the end of the crop cycle. These results high-light the importance of splitting N fertiliser applications to avoid both N excess and deficiency.
Although the NNI is an established and reliable indicator of the crop N status, its determination is time consuming and requires laboratory equipment and expertise that farmers usually do not have. For this reason, it is necessary to develop methods to indi-rectly estimate the NNI (Lemaire et al., 2008). Pooling the data of the two experiments and lettuce genotypes, an empirical relation-ship was found between leaf NO3-N to total-N ratio and NNI (Figure 9A), and an equivalent relationship was observed between NNI and leaf NO3–concentration expressed on FW basis (mg kg–1 of FW; Figure 9B). Although the equivalence of the two relation-ships may appear obvious, it is of fundamental importance for the practical application of NNI as a diagnostic tool of the crop N sta-tus. In fact, while it is difficult to analyse the fraction of NO3-N on the total-N, the leaf NO3–concentration, may be easily determined on-farm, directly by growers, using ion selective electrodes or other rapid methods (Di Gioia et al., 2010; Peña-Fleitas et al., 2015).
Despite the great variability of the NO3-N to total-N ratio and leaf NO3–concentration for a given N level, as observed also by Justes et al. (1994), examining the variation of the leaf NO3– con-centration in relation to the NNI, it was possible to associate N deficiency or N excess crop status to specific leaf NO3– concentra-tion levels for both cultivars. In both cultivars and experiments, leaf NO3–values below 500 mg kg–1of FW were consistently asso-ciated to N deficiency, suggesting that to assure an optimal N sta-tus the leaf NO3– content should be above this threshold. Moreover, considering as optimal the status of plants grown at the rate of 120 kg ha–1 of N, to assure an optimal N status with a toler-ance of ±15%, the leaf NO3–concentration should range between 600 and 1000 mg kg–1of FW in Manavert, and between 600 and 1500 mg kg–1of FW in Aruba, which showed a tendency to accu-mulate more NO3–.
These results suggest that, although empirical, the relationship between leaf NO3–content and NNI may be used to define the leaf NO3–range associated to an optimal N status, or threshold limits to avoid N deficiency and/or luxury consumption for specific crops and growth stages. Developing these specific leaf NO3– concentra-tion thresholds for different crops and using rapid and low cost methods such as NO3–ion-selective electrodes, growers may be able to monitor directly the nutritional status of their crops and dynamically adjust the N fertilisation programme according to the actual crop demand.
Conclusions
Fresh and dry biomass of romaine (cv Manavert) and red
oak-leaf (cv Aruba) lettuce varied in response to N inputs according to
a quadratic model in both fall-winter seasons. Nevertheless, the response varied from year to year and was different for the two let-tuce genotypes. Manavert had higher N recovery and utilisation efficiency as compared to Aruba, suggesting that heading lettuce genotypes are more efficient than non-heading lettuce types. Therefore, NUE may be substantially improved by selecting more efficient lettuce genotypes.
Plants grown at higher N rates accumulated more NO3–in the leaves and a negative relationship was observed between leaf NO3– and DM content. Such interesting relationship characterise lettuce from other crops harvested at relatively higher DM content, and should be properly considered in the N fertilisation management.
The analysis of the NNI time course of the two genotypes revealed that only the application of 120 kg ha–1of N assured an Figure 9. Relationship between nitrogen nutrition index and
plant nitrate-nitrogen to total-nitrogen ratio (A) and between nitrogen nutrition index and nitrate concentration (B) in cv Aruba and Manavert, grown with different nitrogen rates, at Conversano and Polignano a Mare during the fall-winter season of 2006-2007 (Exp-1) and 2007-2008 (Exp-2), respectively.
Non
commercial
use
optimal crop N status, while N deficiency and excess were observed at lower and higher N rates, respectively. An empirical relationship was found between leaf NO3–concentration and NNI, which may be used to define optimal leaf NO3–ranges for specific lettuce crops and growth stages. Using the NNI-NO3–relationship growers may be able to predict and indirectly monitor the NNI, and the crop N status, on site-specific basis, by measuring the leaf NO3– concentration with simple rapid on-farm tests.
Combining the selection of more efficient lettuce genotypes with the dynamic and site-specific adjustment of the N fertilisation programme based on the actual crop N status may contribute to improve the crop NUE, minimise the risks of N losses and the crop environmental impact, while maintaining high yields and quality standards.
References
Bélanger G, Walsh JR, Richards JE, Milburn PH, Ziadi N, 2000. Comparison of three statistical models describing potato yield response to nitrogen fertilizer. Agron. J. 92:902-8.
Boari F, Cefola M, Di Gioia F, Pace B, Serio F, Cantore V, 2013. Effect of cooking methods on antioxidant activity and nitrate content of selected wild Mediterranean plants. Int. J. Food Sci. Nutr. 64:870-6.
Broadley MR, Escobar-Gutierrez AJ, Burns A, Burns IG, 2000. What are the effects of nitrogen deficiency on growth compo-nents of lettuce? New Phytol. 147:519-26.
Burns IG, 2006. Assessing N fertiliser requirements and the relia-bility of different recommendation systems. Acta Hort. 700:35-48.
Burns IG, Zhang K, Turner MK, Lynn J, McClement S, Hand P, Pink D, 2011. Genotype and environment effects on nitrate accumulation in a diversity set of lettuce accessions at com-mercial maturity: the influence of nitrate uptake and assimila-tion, osmotic interactions and shoot weight and development. J. Sci. Food Agr. 91:2217-33.
Cárdenas-Navarro R, Adamowicz S, Robin P, 1999. Nitrate accu-mulation in plants: a role for water. J. Exp. Botany 50:613-24. Cassman KG, Dobermann A, Walters DT, 2002. Agroecosystems,
nitrogen-use efficiency and nitrogen management. Ambio 31:132-40.
Cerrato ME, Blackmer AM, 1990. Comparison of models for describing corn yield response to nitrogen fertilizer. Agron. J. 82:138-43.
Conversa G, Bonasia A, Di Gioia F, Elia A, 2015. A decision sup-port system (GesCoN) for managing fertigation in vegetable crops. Part II. Model calibration and validation under different environmental growing conditions on field grown tomato. Front. Plant Sci. 6:495.
Conversa G, Gonnella M, Santamaria P, 2004. Growth, yield, and mineral content of butterhead lettuce (Lactuca sativa var. cap-itata) grown in NFT. Acta Hort. 659:621-8.
Cui Z, Zhang F, Chen X, Dou Z, Li J, 2010. In-season nitrogen management strategy for winter wheat: maximizing yields, minimizing environmental impact in an over-fertilization con-text. Field Crop Res. 116:140-6.
Dapoigny L, Robin P, Raynal-Lacroix C, Fleury A, 1996. Relation entre le vitesse relative de croissance et la teneur en azote chez la laitue (Lactuca sativa L.). Effets de l’ombrage et du niveau de l’alimentation minérale. Agronomie 16:529-39.
Di Gioia F, Gonnella M, Buono V, Ayala O, Cacchiarelli J,
Santamaria P, 2017. Calcium cyanamide effects on nitrogen use efficiency, yield, nitrates and dry matter content of lettuce. Agron. J. 109:354-62.
Di Gioia F, Gonnella M, Santamaria P, 2013. Contribution of leafy vegetables to dietary nitrate intake and regulations. In: S. Umar, N.A. Anjum, N.A. Khan (eds.) Nitrate in leafy vegeta-bles: toxicity and safety measures. I.K. International Publishing House Pvt. Ltd., New Delhi, India, pp 2-16. Di Gioia F, Simonne EH, Gonnella M, Santamaria P, Gazula A,
Sheppard Z, 2010. Assessment of ionic interferences to nitrate and potassium analyses with ion-selective electrodes. Commun. Soil Sci. Plan. 41:1750-68.
Dobermann A, 2005. Nitrogen use efficiency: state of the art. pp 1-16 in Proc. IFA Int. Workshop on Enhanced-Efficiency Fertilizers, Frankfurt, Germany, 28-30 June 2005. Available from: http://digitalcommons.unl.edu/agronomyfacpub/316 Elia A, Conversa G, 2012. Agronomic and physiological responses
of a tomato crop to nitrogen input. Eur. J. Agron. 40:64-74. European Commission, 1997. Commission Regulation of 31
January 1997 setting maximum levels for certain contaminants in foodstuffs, 194/97/EC. In: Official Journal, L 31, pp. 48-50. European Commission, 2010. Report from the Commission to the Council and the European Parliament on implementation of Council Directive 91/676/EEC concerning the protection of waters against pollution caused by nitrates from agricultural sources based on Member State reports for the period 2004-2007. Document 52013DC0683. European Commission, Brussels, Belgium.
European Commission, 2011. Regulation of 2 December 2011 amending Regulation (EC) No. 1881/2006 as regards maxi-mum levels for nitrates in foodstuffs, 1258/2011/EC. In: Official Journal, L 320, pp. 15-17.
FAOSTAT, 2016. Food and Agriculture Organization of the United Nations, Statistic Division. Available from: http://faostat3.fao.org/
Hirel B, Le Gouis J, Ney B, Gallais A, 2007. The challenge of improving nitrogen use efficiency in crop plants: towards a more central role for genetic variability and quantitative genet-ics within integrated approaches. J. Exp. Bot. 58:2369-87. Hord NG, Tang Y, Bryan NS, 2009. Food sources of nitrates and
nitrites: the physiologic context for potential health benefits. Am. J. Clin. Nutr. 90:1-10.
Good AG, Shrawat AK, Muench DG, 2004. Can less yield more? Is reducing nutrient input into the environment compatible with maintaining crop production? Trends Plant Sci. 9:597-605.
Greenwood DJ, Kubo KI, Burns IG, Draycott A, 1989. Apparent recovery of fertilizer N by vegetable crops. Soil Sci. Plant Nutr. 35:367-81.
Justes E, Mary B, Meynard JM, Machet JM, Thelier-Huché L, 1994. Determination of a critical nitrogen dilution curve for winter wheat crops. Ann. Bot. 74:397-407.
Karam F, Mounzer O, Sarkis F, Lahoud R, 2002. Yield and nitro-gen recovery of lettuce under different irrigation regimes. J. Appl. Hort. 4:70-6.
Lemaire G, Gastal F, Salette J, 1989. Analysis of the effect of N nutrition on dry matter yield of a sward by reference to poten-tial yield and optimum N content. pp 179-180 in Proc. XVI Int. Grassland Congress, Nice, France.
Lemaire G, Jeuffroy M-H, Gastal F, 2008. Diagnosis tool for plant and crop N status in vegetative stage. Theory and practices for crop N management. Eur. J. Agron. 28:614-24.
Lòpez-Bellido L, Lòpez-Bellido RJ, Redondo R, 2005. Nitrogen
Non
commercial
use
efficiency in wheat under rainfed Mediterranean conditions as affected by split nitrogen application. Field Crop Res. 94:86-97.
Ozores-Hampton M, Di Gioia F, Sato S, Simonne E, Morgan K, 2015. Effects of nitrogen rates on nitrogen, phosphorous, and potassium partitioning, accumulation, and use efficiency in seepage-irrigated fresh market tomatoes. HortScience 50:1636-43.
Ozores-Hampton M, Simonne E, Roka F, Morgan K, Sargent S, Snodgrass C, McAvoy E, 2012. Nitrogen rates effects on the yield, nutritional status, fruit quality, and profitability of toma-to grown in the spring with subsurface irrigation. HortScience 47:1129-33.
Peña-Fleitas MT, Gallardo M, Thompson RB, Farneselli M, Padilla FM, 2015. Assessing crop N status of fertigated veg-etable crops using plant and soil monitoring techniques. Ann. Appl. Biol. 167:387-405.
Reinink K, Groenwold R, Bootsma A, 1987. Genotypical differ-ences in nitrate content in Lactuca sativa L. and related species and correlation with dry matter content. Euphytica 63:11-8. Salomez J, Hofman G, 2009. Nitrogen nutrition effects on nitrate
accumulation of soil-grown greenhouse butterhead lettuce. Comm. Soil Sci. Plan. 40:620-32.
Santamaria P, 2006. Nitrate in vegetables: toxicity, content, intake and EC regulation. J. Sci. Food Agr. 86:10-7.
Seginer I, Bleyaert P, Breugelmans M, 2004. Modelling ontogenet-ic changes of nitrogen and water content in lettuce. Ann. Bot. 94:393-404.
Simonne AH, Simonne EH, Eitenmiller RR, Mills HA, Cresman CP, 1997. Could the Dumas method replace the Kjeldahl
diges-tion for nitrogen and crude protein determinadiges-tions in foods? J. Sci. Food Agr. 73:39-45.
Simonne E, Hutchinson C, De Valerio J, Hochmuth R, Treadwell D, Wright A, Bielinski S, Whidden A, McAvoy E, Zhao X, Olczyk T, Gazula A, Ozores-Hampton M, 2010. Current knowledge, gaps, and future needs for keeping water and nutri-ents in the root zone of vegetables grown in Florida. HortTechnology 20:143-52.
Tei F, Benincasa P, Guiducci M, 1999. Nitrogen fertilization of let-tuce, processing tomato and sweet pepper: yield, nitrogen uptake and the risk of nitrate leaching. Acta Hort. 506:61-7. Tei F, Benincasa P, Guiducci M, 2000. Effect of nitrogen
availabil-ity on growth and nitrogen uptake in lettuce. Acta Hort. 533:385-92.
Tei F, Benincasa P, Guiducci M, 2003. Critical nitrogen concentra-tion in lettuce. Acta Hort. 627:187-94.
USDA, 2003. Soil taxonomy: keys to soil taxonomy. United States Department of Agriculture, Natural Resources Conservation Service, Washington, DC, USA.
US Environmental Protection Agency, 2010. Clean water act. Available from: http://www.epa.gov/agriculture/lcwa.html Weightman RM, Huckle AJ, Roques SE, Ginsburg D, Dyer CJ,
2012. Factors influencing tissue nitrate concentration in field-grown wild rocket (Diplotaxis tenuifolia) in southern England. Food Add. Contam. 29:1425-35.
WRB, 2006. World reference base for soil resources: a framework for international classification, correlation and communica-tion. International Union of Soil Sciences, World Soil Information and Food and Agriculture Organization of the United Nations, Rome, Italy.