Volume 2012, Article ID 890875,8pages doi:10.1155/2012/890875
Research Article
Time-Qualified Patterns of Variation of PPAR
γ, DNMT1, and
DNMT3B Expression in Pancreatic Cancer Cell Lines
Valerio Pazienza,
1Francesca Tavano,
2Massimo Francavilla,
3Andrea Fontana,
4Fabio Pellegrini,
4Giorgia Benegiamo,
1Vincenzo Corbo,
5Fabio Francesco di Mola,
2Pierluigi Di Sebastiano,
2Angelo Andriulli,
1and Gianluigi Mazzoccoli
61Research Laboratory and Gastroenterology Unit, Scientific Institute and Regional General Hospital “Casa Sollievo della Sofferenza”, 71013 San Giovanni Rotondo, Italy
2Research Laboratory and Surgery Unit, Scientific Institute and Regional General Hospital “Casa Sollievo della Sofferenza”, 71013 San Giovanni Rotondo, Italy
3Computing Unit, Scientific Institute and Regional General Hospital “Casa Sollievo della Sofferenza”, 71013 San Giovanni Rotondo, Italy
4Unit of Biostatistics, Scientific Institute and Regional General Hospital “Casa Sollievo della Sofferenza”, 71013 San Giovanni Rotondo, Italy
5ARC-NET Miriam Cherubini Centre for Applied Research on Cancer, University and Hospital Trust of Verona, 37100 Verona, Italy 6Division of Internal Medicine and Chronobiology Unit, Department of Medical Sciences, Scientific Institute and
Regional General Hospital “Casa Sollievo della Sofferenza”, 71013 San Giovanni Rotondo, Italy
Correspondence should be addressed to Gianluigi Mazzoccoli,[email protected]
Received 7 June 2012; Accepted 16 July 2012 Academic Editor: Manlio Vinciguerra
Copyright © 2012 Valerio Pazienza et al. This is an open access article distributed under the Creative Commons Attribution License, which permits unrestricted use, distribution, and reproduction in any medium, provided the original work is properly cited.
Carcinogenesis is related to the loss of homeostatic control of cellular processes regulated by transcriptional circuits and epigenetic mechanisms. Among these, the activities of peroxisome proliferator-activated receptors (PPARs) and DNA methyltransferases (DNMTs) are crucial and intertwined. PPARγ is a key regulator of cell fate, linking nutrient sensing to transcription processes, and its expression oscillates with circadian rhythmicity. Aim of our study was to assess the periodicity of PPARγ and DNMTs in pan-creatic cancer (PC). We investigated the time-related patterns of PPARG, DNMT1, and DNMT3B expression monitoring their mRNA levels by qRT-PCR at different time points over a 28-hour span in BxPC-3, CFPAC-1, PANC-1, and MIAPaCa-2 PC cells after synchronization with serum shock. PPARG and DNMT1 expression in PANC-1 cells and PPARG expression in MIAPaCa-2 cells were characterized by a 24 h period oscillation, and a borderline significant rhythm was observed for the PPARG, DNMT1, and
DNMT3B expression profiles in the other cell lines. The time-qualified profiles of gene expression showed different shapes and
phase relationships in the PC cell lines examined. In conclusion, PPARG and DNMTs expression is characterized by different time-qualified patterns in cell lines derived from human PC, and this heterogeneity could influence cell phenotype and human disease behaviour.
1. Introduction
Cancer statistics rank pancreatic cancer as the fourth leading cause of malignancy-related death worldwide [1], and
inci-dence and mortality rates are very similar, due to difficult
early diagnosis, elevated aggressiveness, and chemotherapy resistance. Bad prognosis and lack of effective treatment are responsible for high lethality, so that there is pressing need
to identify molecular biomarkers for prognostic assessment and target therapy. The preservation of tissue integrity is critical for organism survival and relies on tissue renewal, driven by stem cells that are capable of responding to injury and repairing tissue damage, caused by physical, chemicals, microbial, and mutagenic agents. Transcriptional mecha-nisms regulate cell processes underlying cell renewal and
apoptosis. Carcinogenesis relies on the loss of homeostatic mechanisms regulating cell proliferative, differentiative, and survival processes. Among the transcriptional regulators an important role is played by the peroxisome proliferator-activated receptors (PPARs), ligand-proliferator-activated transcription factors belonging to the superfamily of nuclear hormone receptors, which are considered to be involved in the regu-lation of nutrient metabolism and energy homeostasis, and in various pathophysiological processes, such as metabolic derangement, inflammation, and cancerogenesis [2]. PPARs are crucial for the transduction of metabolic and nutritional signals into transcriptional responses and comprise three
iso-forms, PPARα, PPARβ/δ, and PPARγ, with a high degree of
homology but with distinct biological activities [3]. PPARα
is mainly involved in lipid metabolism, the function of
PPARβ/δ is not entirely clear, and PPARγ regulates cell fate
and differentiation decisions, as well as adipogenesis and fat
storage [4–7]. PPARγ expression oscillates over a 24-hour
span, and its circadian rhythmicity is crucial in the crosstalk between feeding/fasting cycles, nutrient sensing, metabolic pathways and transcriptional processes. The derangement of
this crosstalk is involved in cancer development [8,9].
High-affinity synthetic ligands, the thiazolidinedione, prompted
the study of PPARγ signalling pathways in the regulation
of metabolic processes and are currently evaluated as possible
therapeutic tools to take advantage of PPARγ
prodifferentia-tive effects in cancer treatment [10].
Transcriptional processes are regulated also by epigenetic mechanisms, such as acetylation/deacetylation and methyla-tion/demethylation. DNA methyltransferases (DNMTs) play a critical role in epigenetic mechanisms attaching methyl groups to DNA, and in particular DNMT1 keeps up the methylation pattern during DNA replication, whereas DNMT3a and DNMT3b primarily catalyze de novo
methyla-tion [11–13]. An intriguing interacmethyla-tion between PPARγ and
DNMTs has been recently suggested by the downregulation of DNA methyltransferases evidenced in immune cells
following ligand-dependent PPARγ activation [14].
The aim of our study was to assess the time-related
pat-terns of variation of PPARγ and DNMTs in pancreatic cancer
using in vitro models represented by pancreatic cancer cell lines evaluated after synchronization.
2. Material and Methods
2.1. Cell Culture and Serum Shock Procedures. BxPC-3,
CFPAC-1, PANC-1, and MIA PaCa-2 cells were cultured
at 37◦C in 5% CO2 atmosphere in DMEM medium
sup-plemented with 10% fetal bovine serum (FCS), 100 U/mL penicillin, and 100 ng/mL streptomycin (Invitrogen Life Technologies, Milan, Italy) while CFPAC-1 and MIA PaCa-2 were maintained in RPMI medium (Invitrogen Life Tech-nologies, Milan, Italy). Cell synchronization was obtained by means of serum shock performed as follows: approximately
5×10⁵cells/6 wells were plated the day before the
experi-ments. At the day of the experiments, culture medium was exchanged with serum-rich medium with 50% FBS, and after 2 hours this medium was replaced as described [15]. The cells
were harvested over 28 hours at the indicated time points after serum shock.
2.2. Quantitative Real-Time Polymerase Chain Reaction.
Total RNA was extracted from BxPC-3, CFPAC-1, PANC-1, and MIA PaCa-2 cells at the indicated time points after serum shock using the RNeasy Mini Kit (Qiagen S.P.A. Milano Italy) and subsequently digested by DNase I. cDNA was synthe-sized from 50 ng total RNA, and quantitative Real-Time PCR (qRT-PCR) was performed using QuantiFast Sybr Green PCR kit following the one-step protocol. For real-time RT-PCR, we used the following SYBR Green QuantiTect Primer purchased from Qiagen: PPARG (QT00029841), human
DNMT1 (QT00034335) and DNMT3B (QT00032067).
Reac-tions were set up in 96-well plates using a 7700 Real-Time PCR System (Applied Biosystems, Foster City, CA), and all samples were assayed in triplicate. Optical data obtained were analyzed using the default and variable parameters available in the SDS software package (version 1.9.1; Applied Bio-systems, Foster City, CA). Expression levels of target gene were normalized using the housekeeping control gene TATA-binding protein (TBP, QT00000721).
2.3. Statistical Analysis. Gene expression values were
nor-malized, for each variable for each cell line, to the expression value of the first time point (T0) of sample collection after serum shock to reduce interassay level variability. Analysis of periodicity patterns was performed, for each time series of the normalized gene expression values, by fitting a least-squares linear regression of a single component (24 h) cosine waveform [16], using the MATLAB statistical package (MathWorks, Natick, Massachusetts, USA). The following parameters were estimated: “mesor” (the overall mean level
of the wave); the “amplitude” (A, the range from the
maxi-mum and the minimaxi-mum peaks of the best-fitted curve), and
the “acrophase” (aØ, the time in angular degrees, from the
local midnight Ø, of the wave peak: acro= peak).P-values
fromF-statistics were reported for each fitted single cosinor
model, to test the null hypothesis of zero amplitude (where the wave has no periodicity). Furthermore, a novel statistical
approach was employed to compare the evolution of different
time qualified profiles of gene expression in the cell lines, by means of suitable statistical contrasts from a multivariate periodic linear mixed model. In particular, for each compar-ison, two statistical contrasts were assessed, testing whether the rhythms have an identical or opposing waveform, res-pectively [17]. The periodic linear mixed model can be thought as the join assessment of many different cosinor models (each one including a specific number of harmonic terms). With respect to cosinor analysis, this novel statistical approach enables the comparison of the evolution of mul-tiple biological rhythms by jointly representing all of them in terms of sine and cosine series into a multivariate linear mixed model, taking into account all their interdependencies (intra- and interoutcome correlation structures), as well as the collection of unequally spaced measures over time and heterogeneity between gene expressions. Moreover, any specific pairwise comparison between the biological rhythms
BxPC3 PPARγ 3 2.5 2 1.5 1 0.5 0 T1 T2 T3 T4 T5 T1 T2 T3 T4 T5 T1 T2 T3 T4 T5 T1 T2 T3 T4 T5 T1 T2 T3 T4 T5 T1 T2 T3 T4 T5 Time after serum shock T1 T2 T3 T4 T5
T1 T2 T3 T4 T5
T1 T2 T3 T4 T5 Time after serum shock T1 T2 T3 T4 T5
T1 T2 T3 T4 T5
T1 T2 T3 T4 T5 Time after serum shock
CFPAC PPARγ mRN A r elati ve e xpr ession mRN A r elati ve e xpr ession BxPC3 DNMT1 2 1.5 1 0.5 BxPC3 DNMT3B 2 1.8 1.6 1.4 1.2 1 0.8 BxPC3 2.5 2 1.5 1 0.5 0 CFPAC DNMT1 2.6 2.4 2.2 2 1.8 1.6 1.4 1.2 1 0.8 mRN A r elati ve e xpr ession mRN A r elati ve e xpr ession mRN A r elati ve e xpr ession mRN A r elati ve e xpr ession 2.6 2.4 2.2 2 1.8 1.6 1.4 1.2 1 0.8 CFPAC DNMT3B 4.5 4 3.5 3 2.5 2 1.5 1 0.5 CFPAC
PANC1 PPARγ PANC1 DNMT1 2 1.9 1.8 1.7 1.6 1.5 1.4 1.3 1.2 1.1 1 PANC1 DNMT3B 2.5 2 1.5 1 PANC1 MIAPACA PPARγ 1.3 1.2 1.1 1 0.9 0.8 0.7 0.6 0.5 0.4 MIAPACA DNMT1 2.2 2 1.8 1.6 1.4 1.2 1 0.8 MIAPACA DNMT3B 2 1.5 1 0.5 MIAPACA 0◦ 15◦ 30◦ 45◦ 60◦ 75◦ 90◦ 105◦ 120◦ 135◦ 150◦ 165◦ 180◦ 195◦ 210◦ 225◦ 240◦ 255◦ 270◦ 285◦ 300◦ 315330◦ ◦345◦ 0◦ 15◦ 30◦ 45◦ 60◦ 75◦ 90◦ 105◦ 120◦ 135◦ 150◦ 165◦ 180◦ 195◦ 210◦ 225◦ 240◦ 255◦ 270◦ 285◦ 300◦ 315330◦ ◦345◦ 0◦ 15◦ 30◦ 45◦ 60◦ 75◦ 90◦ 105◦ 120◦ 135◦ 150◦ 165◦ 180◦ 195◦ 210◦ 225◦ 240◦ 255◦ 270◦ 285◦ 300◦ 315330◦ ◦345◦ 0◦ 15◦ 30◦ 45◦ 60◦ 75◦ 90◦ 105◦ 120◦ 135◦ 150◦ 165◦ 180◦ 195◦ 210◦ 225◦ 240◦ 255◦ 270◦ 285◦ 300◦ 315330◦ ◦345◦ PPARγ DNMT1 DNMT3B PPARγ DNMT1 DNMT3B PPARγ DNMT1 DNMT3B PPARγ DNMT1 DNMT3B
Figure 1: Chronograms displaying time qualified variations of PPARG, DNMT1, and DNMT3B expression level in pancreatic cancer cell lines. Original units standardized to T0 and combined for analyses. Polarograms of cosinor analysis showing the acrophases for the expression values of PPARG, DNMT1, and DNMT3B. Radial axis represents the time point (in degrees) after serum shock corresponding to the acme and vector length represents the amplitude of the oscillation.
can be performed by means of proper statistical contrasts.
P-values <0.05 were considered for statistical significance.
Statistical analyses were performed using MATLAB and SAS Release 9.1.3 (SAS Institute, Cary, NC).
3. Results
Results from cosinor analysis were reported inTable 1 and
evidence a clear 24 h periodicity for the time-qualified
varia-tions of expression of PPARG (P = 0.016) and DNMT1
(P = 0.024) in PANC-1 cells and PPARG (P = 0.010) in
MIA PaCa-2 cells, whereas a borderline significant rhythm was observed for the other PPARG, DNMT1, and DNMT3B expression profiles in the examined cell lines (Figure 1).
Results from multivariate periodic regression analysis
were reported in Table 2. Pairwise comparisons suggested
that in BxPC-3 cells the time profiles of both PPARG and
DNMT1 showed flat shapes, whereas the time profiles of PPARG and DNMT3B, as well as those of DNMT1 and DNMT3B, were opposing. In CFPAC-1 cells the time profiles
Table 1: Rhythm parameters from fitted single cosinor models for mRNA expression calculated on original values normalized to the first time point of sample collection after serum shock.
BxPC3 PPARG DNMT1 DNMT3B Mesor 1.22 0.94 1.24 Amplitude 0.33 0.20 0.16 Acrophase 325.32 342.87 225.6 P-value 0.780 0.430 0.722 CFPAC PPARG DNMT1 DNMT3B Mesor 1.18 1.71 2.42 Amplitude 0.40 0.14 0.57 Acrophase 47.58 151.69 127.57 P-value 0.446 0.839 0.753 PANC1 PPARG DNMT1 DNMT3B Mesor 1.58 1.36 1.65 Amplitude 0.62 0.33 0.39 Acrophase 129.72 251.25 272.44 P-value 0.016 0.024 0.630 MIAPACA PPARG DNMT1 DNMT3B Mesor 0.81 1.21 1.39 Amplitude 0.17 0.45 0.14 Acrophase 261.86 245.4 136.43 P-value 0.010 0.067 0.933
Overall gene expression levels were analyzed for time effect across the timepoints by single cosinor: fit of 24 h cosine to all data by least squares linear regression. Acrophase, the crest time of rhythm, is expressed in degrees.P-values refer to test for time effect (zero amplitude).
of all the expressions of PPARG, DNMT1, and DNMT3B
were different (neither identical nor opposing). In PANC-1
cells the time profiles of PPARG and DNMT1 were different,
the time profiles of PPARG and DNMT3B were opposing, and the time profiles of DNMT1 and DNMT3B had flat shapes. In MIA PaCa-2 cells the time profiles of all the expres-sions of PPARG, DNMT1, and DNMT3B were different (neither identical nor opposing) (Figure 2).
4. Discussion
Nycthemeral variations with a 24 h periodicity (circadian, from the Latin circa and dies) characterize behavior and physiology in the greater part of living organisms and contribute to homeostasis maintenance ensuring optimal timing of cellular phenomena in body systems, orchestrated by a complex network of transcriptional circuits [18–20]. Circadian rhythmicity is driven at the body level by a central pacemaker and master oscillator located in the hypothalamic suprachiasmatic nuclei (SCN) entrained by the light/dark cycle via the retinohypothalamic tract [21]. At the tissue-specific and single-cell levels the circadian rhythmicity is driven by molecular clocks ticked by transcription/transla-tion feedback loops operated by a set of genes (so-called clock genes: BMAL1, CLOCK, PER 1–3, CRY 1-2) and their coded proteins, entrained by the SCN via humoral and neural
outputs, and in a tissue-specific manner by other factors, such as feeding and temperature fluctuations [22–28]. The biological clocks control cell processes and tissue/organ functions driving the expression of genes coding for tran-scriptional factors, such as DBP (albumin D-site binding protein) and E4BP4 (adenoviral E4 protein-binding protein), which steer the expression of so-called clock controlled genes and tissue-specific output genes. The transcription factors DBP and E4BP4 among other processes control the circadian
rhythmicity of PPARγ by binding to PPARG first exon D-sites
with functional promoter activity [9].
Disruption of the circadian clock circuitry and alteration of the physiological circadian rhythmicity are considered to be involved in the processes underlying tumorigenesis [29– 36].
Considering the important role played in the transcrip-tional processes by epigenetic mechanisms such as reversible or irreversible attachment of methyl groups to DNA cat-alyzed by DNMTs [37] and the recently evidenced interaction
between PPARγ and DNMTs [14], we sought to evaluate if
PPARγ and DNMTs show correspondent oscillation in
pan-creatic cancer, analyzing their time-related patterns of varia-tion in synchronized pancreatic cancer cell lines.
Our data put in evidence important differences in the periodicity and in the phase relationships of PPARG,
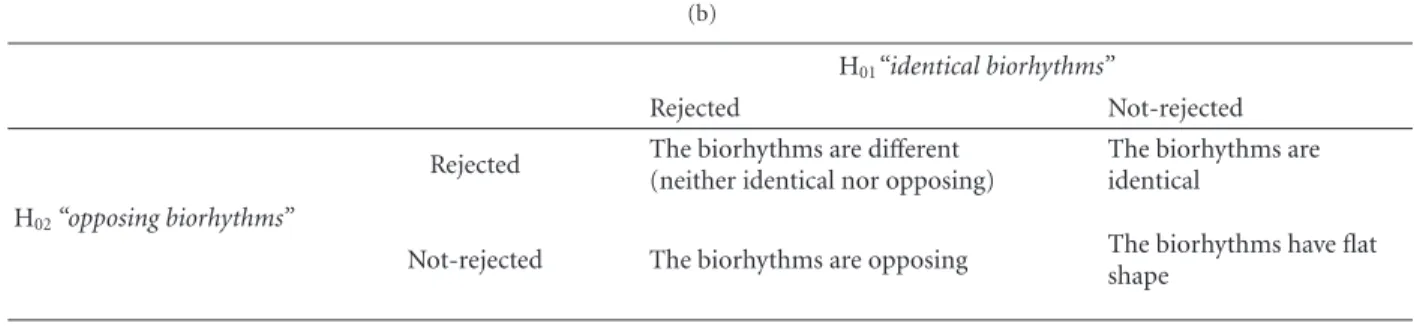
Table 2: (a) Statistical contrasts from multivariate periodic regression analysis, along with a summarization of the decision to be drawn for each comparison, (b) interpretation rules: conclusions to be drawn from the joint hypotheses testing “identical biorhythms” (H01) and
“opposing biorhythms” (H02).
(a)
BxPC3 statistical contrasts
Hypotheses F-value P-value
H01: Biorhythms of PPARG and DNMT1 are identical 0.57 0.695
H02: Biorhythms of PPARG and DNMT1 are opposing 2.11 0.189
H01: Biorhythms of PPARG and DNMT3B are identical 4.16 0.039
H02: Biorhythms of PPARG and DNMT3B are opposing 0.46 0.764
H01: Biorhythms of DNMT1 and DNMT3B are identical 11.67 0.001
H02: Biorhythms of DNMT1 and DNMT3B are opposing 1.61 0.246
Decisions derived from statistical contrasts
(1) Biorhythms of PPARG and DNMT1 have flat shapes, although statistical tests slightly suggest that they could be identical (i.e., no sufficient statistical power). (2) Biorhythms of PPARG and DNMT3B are opposing. (3) Biorhythms of DNMT1 and DNMT3B are opposing
CFPAC statistical contrasts
Hypotheses F-value P-value
H01: Biorhythms of PPARG and DNMT1 are identical 7.82 0.003
H02: Biorhythms of PPARG and DNMT1 are opposing 6.70 0.021
H01: Biorhythms of PPARG and DNMT3B are identical 43.78 <0.001
H02: Biorhythms of PPARG and DNMT3B are opposing 22.68 <0.001
H01: Biorhythms of DNMT1 and DNMT3B are identical 28.98 <0.001
H02: Biorhythms of DNMT1 and DNMT3B are opposing 38.02 <0.001
Decisions derived from statistical contrasts
(1) Biorhythms of PPARG and DNMT1 are different (neither identical nor opposing). (2) Biorhythms of PPARG and DNMT3B are different (neither identical nor opposing). (3) Biorhythms of DNMT1 and DNMT3B are different (neither identical nor opposing)
PANC1 statistical contrasts
Hypotheses F-value P-value
H01: Biorhythms of PPARG and DNMT1 are identical 52.22 <0.001
H02: Biorhythms of PPARG and DNMT1 are opposing 5.78 0.010
H01: Biorhythms of PPARG and DNMT3B are identical 16.14 0.002
H02: Biorhythms of PPARG and DNMT3B are opposing 3.16 0.070
H01: Biorhythms of DNMT1 and DNMT3B are identical 1.96 0.196
H02: Biorhythms of DNMT1 and DNMT3B are opposing 3.57 0.063
Decisions derived from statistical contrasts
(1) Biorhythms of PPARG and DNMT1 are different (neither identical nor opposing). (2) Biorhythms of PPARG and DNMT3B are opposing, although statistical tests slightly suggest that they could be different at all. (3) Biorhythms of DNMT1 and
DNMT3B have flat shapes, although statistical tests slightly suggest that they could be identical
MIAPACA statistical contrasts
Hypotheses F-value P-value
H01: Biorhythms of PPARG and DNMT1 are identical 11.63 <0.001
H02: Biorhythms of PPARG and DNMT1 are opposing 7.23 0.018
H01: Biorhythms of PPARG and DNMT3B are identical 9.89 0.001
H02: Biorhythms of PPARG and DNMT3B are opposing 8.52 0.003
H01: Biorhythms of DNMT1 and DNMT3B are identical 17.71 <0.001
(a) Continued.
Decisions derived from statistical contrasts
Hypotheses F-value P-value
(1) Biorhythms of PPARG and DNMT1 are different (neither identical nor opposing). (2) Biorhythms of PPARG and DNMT3B are different (neither identical nor opposing). (3) Biorhythms of DNMT1 and DNMT3B are different (neither identical nor opposing)
(b)
H01“identical biorhythms”
Rejected Not-rejected
Rejected The biorhythms are different (neither identical nor opposing)
The biorhythms are identical
H02“opposing biorhythms”
Not-rejected The biorhythms are opposing The biorhythms have flat shape 0 0.5 1 1.5 2 2.5 3 1 4 10 16 22 28
Time after serum shock (h)
PPARγ R elati ve e xpr ession 0 0.5 1 1.5 2 2.5 1 4 10 16 22 28
Time after serum shock (h) DNMT1 R elati ve e xpr ession 0 0.5 1 1.5 2 2.5 3 3.5 4 4.5 1 4 10 16 22 28
Time after serum shock (h) DNMT3B BxPC3 CFPAC PANC-1 MiaPaCa R elati ve e xpr ession
Figure 2:x-y plots showing the time-related profiles of expression level changes of PPARG, DNMT1, and DNMT3B in pancreatic can-cer cell lines. Original units standardized to T0 and combined for analyses. Gene expression data assigned to actual collection time after serum shock.
cell lines examined, maybe related to a different genetic back-ground in the diverse pancreatic cancer cells [38].
In the BxPC-3 cell line, mucin-producing cells derived from a human primary pancreatic adenocarcinoma, a bor-derline significant 24 h periodicity was evidenced for the
PPARG, DNMT1, and DNMT3B expression patterns, and the
time-qualified profiles of PPARG and DNMT3B, as well as the time qualified profiles of DNMT1 and DNMT3B, were opposing.
In CFPAC-1 cells, derived from a pancreatic ductal ade-nocarcinoma liver metastasis of a patient with cystic fibrosis, a borderline significant rhythmicity with a 24 h period was found for the PPARG, DNMT1, and DNMT3B expression patterns, and the time-qualified profiles showed different shapes.
In PANC-1 cells, an epithelial-like cell line derived from a human pancreatic carcinoma, a clear 24 h periodicity was observed for the time qualified variations of PPARG and
DNMT1 expression, a borderline significant rhythmicity
with a 24 h period was observed for the DNMT3B expression pattern, and the time qualified profiles of PPARG and
DNMT3B were opposing, whereas those of PPARG and
DNMT1 were different, and the time qualified profiles of
DNMT1 and DNMT3B showed flat shapes.
In the MIA PaCa-2 cell line, established from a human pancreatic adenocarcinoma, a clear 24-h periodicity was observed for the time qualified variations of expression of
PPARG, and a borderline significant rhythmicity with a
24 h period was observed for the DNMT1 and DNMT3B expression patterns, and the time qualified profiles of PPARG and DNMT1 as well as those of PPARG and DNMT3B and the time qualified profiles of DNMT1 and DNMT3B were different (neither identical nor opposing).
The different time qualified profiles and phase relation-ships evidenced in the pancreatic cancer cell lines examined suggest that they rely on a dissimilar temporal architecture of transcriptional circuits and epigenetic mechanisms, which may influence cancer cell behavioral phenotype and possibly response to therapy.
Normal pancreatic duct epithelial cells do not seem to
express the nuclear receptor, and drugs of the thiazolidine-dione class transactivate the transcription of a peroxisome proliferator response element-driven promoter in a dose-dependent fashion [39]. Besides, immunohistochemical staining of resected specimens by means of a polyclonal
PPARγ antibody has evidenced PPARγ protein expression
in the nuclei of carcinoma cells in 90% of human
pancre-atic adenocarcinomas [40]. Selective PPARγ ligands inhibit
pancreatic cancer cell growth in a dose-dependent manner and reduce the invasiveness of the tumor cells, suggesting a potential role for these agents in the adjuvant treatment of pancreatic cancer [41]. Furthermore, the first-line drug for the treatment of unresectable pancreatic cancer is
rep-resented by the nucleoside analog gemcitabine, and PPARγ
ligands potentiate its cytotoxic action on human pancreatic cancer cells in a dosage-dependent manner and are tested to improve the prognosis of pancreatic cancer patients [42].
Inactivation of tumor suppressor genes is central to the development of all common forms of human cancer, and this inactivation often results from epigenetic silencing rather than intragenic mutations. A prevalent mechanism of tumor-suppressor gene inactivation in neoplastic disease is repre-sented by transcriptional silencing by CpG island methyla-tion, and the prototypic DNA methyltransferase, DNMT1, accounts for most methylation in mouse cells, but human cancer cells lacking DNMT1 retain significant genomic methylation and associated gene silencing [11]. In human cells, the mechanisms underlying locus-specific or global methylation patterns remain unclear, but genetic disruption of both DNMT1 and DNMT3b nearly eliminates methyl-transferase activity and reduces genomic DNA methylation by greater than 95%. The importance of the DNA methyl-transferase DNMT1 for the maintenance of cell methylation and its role in tumorigenesis have been highlighted by genetic experiments. DNMT1 is necessary and sufficient to maintain global methylation and aberrant CpG island methylation in human cancer cells, and selective depletion of DNMT1 with antisense inhibitors has been shown to induce demethylation and reactivation of silenced tumor-suppressor genes such as CDKN2A. Inactivation of both DNMT1 and DNMT3B induces low levels of DNA methylation, whereas selective deletion of DNMT1 alleles in cancer cells produces clones that retain CpG island methylation and associated tumor-suppressor gene silencing, suggesting that the two DNMTs cooperatively maintain DNA methylation and gene silencing in human cancer cells, providing convincing support that such methylation is indispensable for best possible neoplastic
proliferation [11,35].
In conclusion, the cell lines derived from human
pan-creatic cancers are characterized by different arrays of time
qualified profiles of gene expression and epigenetic modi-fications, which could be related to particular genetic back-grounds and could impinge on cancer cell phenotype, sug-gesting variable temporal organization of cell processes that could conditionate disease behaviour and response to timed delivery of conventional chemotherapy.
Conflict of Interests
The authors declare that there is no conflict of interests with respect to the authorship and/or publication of this paper.
Acknowledgments
The authors are grateful to Professor Aldo Scarpa for pro-viding them the pancreatic cancer cell lines. The study was supported by a grant from the Italian Ministry of Health through Department of Medical Sciences, Research Lab-oratory and Division of Gastroenterology (RC1203GA58) and Division of Internal Medicine and Chronobiology Unit (RC1203ME46), IRCCS Scientific Institute and Regional General Hospital “Casa Sollievo della Sofferenza,” Opera di Padre Pio da Pietrelcina, San Giovanni Rotondo (FG), Italy
and by the “5×1000” voluntary contributions.
References
[1] A. Jemal, R. Siegel, E. Ward, Y. Hao, J. Xu, and M. J. Thun, “Cancer statistics, 2009,” CA Cancer Journal for Clinicians, vol. 59, no. 4, pp. 225–249, 2009.
[2] P. Charoensuksai and W. Xu, “PPARs in rhythmic metabolic regulation and implications in health and disease,” PPAR
Research, vol. 2010, Article ID 243643, 9 pages, 2010.
[3] P. Lefebvre, G. Chinetti, J. C. Fruchart, and B. Staels, “Sorting out the roles of PPARα in energy metabolism and vascular homeostasis,” Journal of Clinical Investigation, vol. 116, no. 3, pp. 571–580, 2006.
[4] M. H. Hsu, U. Savas, K. J. Griffin, and E. F. Johnson, “Identification of peroxisome proliferator-responsive human genes by elevated expression of the peroxisome proliferator-activated receptorα in HepG2 cells,” Journal of Biological
Che-mistry, vol. 276, no. 30, pp. 27950–27958, 2001.
[5] J. K. Reddy, “Nonalcoholic steatosis and steatohepatitis III. Peroxisomalβ-oxidation, PPARα, and steatohepatitis,”
Amer-ican Journal of Physiology, vol. 281, no. 6, pp. G1333–G1339,
2001.
[6] E. Ip, G. C. Farrell, G. Robertson, P. Hall, R. Kirsch, and I. Leclercq, “Central role of PPARα-dependent hepatic lipid turnover in dietary steatohepatitis in mice,” Hepatology, vol. 38, no. 1, pp. 123–132, 2003.
[7] S. Yu, K. Matsusue, P. Kashireddy et al., “Adipocyte-specific gene expression and adipogenic steatosis in the mouse liver due to peroxisome proliferator-activated receptor γ1 (PPARγ1) overexpression,” Journal of Biological Chemistry, vol. 278, no. 1, pp. 498–505, 2003.
[8] P. Ferr´e, “The biology of peroxisome proliferator-activated receptors: relationship with lipid metabolism and insulin sensitivity,” Diabetes, vol. 53, no. 1, supplement, pp. S43–S50, 2004.
[9] S. Takahashi, I. Inoue, Y. Nakajima et al., “A promoter in the novel exon of hPPARγ directs the circadian expression of PPARγ,” Journal of Atherosclerosis and Thrombosis, vol. 17, no. 1, pp. 73–83, 2010.
[10] B. Farrow, K. L. O’Connor, K. Hashimoto, T. Iwamura, and B. M. Evers, “Selective activation of PPARγ inhibits pancreatic cancer invasion and decreases expression of tissue plasmino-gen activator,” Surgery, vol. 134, no. 2, pp. 206–212, 2003.
[11] I. Rhee, K. E. Bachman, B. H. Park et al., “DNMT1 and DNMT3b cooperate to silence genes in human cancer cells,”
Nature, vol. 416, no. 6880, pp. 552–556, 2002.
[12] M. Ripoli, R. Barbano, T. Balsamo et al., “Hypermethylated levels of E-cadherin promoter in Huh-7 cells expressing the HCV core protein,” Virus Research, vol. 160, no. 1-2, pp. 74– 81, 2011.
[13] G. Benegiamo, M. Vinciguerra, G. Mazzoccoli, A. Piepoli, A. Andriulli, and V. Pazienza, “DNA methyltransferases 1 and 3b expression in Huh-7 cells expressing HCV core protein of different genotypes,” Digestive Disease Science, vol. 57, no. 6, pp. 1598–1603, 2012.
[14] J. Lei, H. Hasegawa, T. Matsumoto, and M. Yasukawa, “Per-oxisome proliferator-activated receptor α and γ agonists together with TGF-β convert human CD4+CD25- T cells into functional Foxp3+ regulatory T cells,” Journal of Immunology, vol. 185, no. 12, pp. 7186–7198, 2010.
[15] A. Balsalobre, F. Damiola, and U. Schibler, “A serum shock induces circadian gene expression in mammalian tissue cul-ture cells,” Cell, vol. 93, no. 6, pp. 929–937, 1998.
[16] W. Nelson, Y. L. Tong, J. K. Lee, and F. Halberg, “Methods for cosinor-rhythmometry,” Chronobiologia, vol. 6, no. 4, pp. 305– 323, 1979.
[17] G. Mazzoccoli, A. Fontana, M. Copetti et al., “Stage dependent destructuration of neuro-endocrine-immune system compo-nents in lung cancer patients,” Biomedicine and
Pharmacother-apy, vol. 65, no. 1, pp. 69–76, 2011.
[18] I. Edery, “Circadian rhythms in a nutshell,” Physiol Genomics, vol. 3, no. 2, pp. 59–74, 2000.
[19] T. Matsuo, S. Yamaguchi, S. Mitsui, A. Emi, F. Shimoda, and H. Okamura, “Control mechanism of the circadian clock for timing of cell division in vivo,” Science, vol. 302, no. 5643, pp. 255–259, 2003.
[20] G. Mazzoccoli, V. Pazienza, and M. Vinciguerra, “Clock genes and clock controlled genes in the regulation of metabolism rhythms,” Chronobiology International, vol. 29, no. 3, pp. 227– 251, 2012.
[21] M. H. Hastings, A. B. Reddy, and E. S. Maywood, “A clockwork web: circadian timing in brain and periphery, in health and disease,” Nature Reviews Neuroscience, vol. 4, no. 8, pp. 649– 661, 2003.
[22] F. Damiola, N. Le Minli, N. Preitner, B. Kornmann, F. Fleury-Olela, and U. Schibler, “Restricted feeding uncouples circadian oscillators in peripheral tissues from the central pacemaker in the suprachiasmatic nucleus,” Genes and Development, vol. 14, no. 23, pp. 2950–2961, 2000.
[23] R. Hara, K. Wan, H. Wakamatsu et al., “Restricted feeding entrains liver clock without participation of the suprachias-matic nucleus,” Genes to Cells, vol. 6, no. 3, pp. 269–278, 2001. [24] K. A. Stokkan, S. Yamazaki, H. Tei, Y. Sakaki, and M. Menaker, “Entrainment of the circadian clock in the liver by feeding,”
Science, vol. 291, no. 5503, pp. 490–493, 2001.
[25] U. Schibler and P. Sassone-Corsi, “A web of circadian pace-makers,” Cell, vol. 111, no. 7, pp. 919–922, 2002.
[26] G. Mazzoccoli, “The timing clockwork of life,” Journal of
Bio-logical Regulators and Homeostatic Agents, vol. 25, no. 1, pp.
137–143, 2011.
[27] E. Filipski, V. M. King, M. C. Etienne et al., “Persistent twenty-four hour changes in liver and bone marrow despite suprachiasmatic nuclei ablation in mice,” American Journal of
Physiology, vol. 287, no. 4, pp. R844–R851, 2004.
[28] E. Nagoshi, C. Saini, C. Bauer, T. Laroche, F. Naef, and U. Schibler, “Circadian gene expression in individual fibroblasts: cell-autonomous and self-sustained oscillators pass time to daughter cells,” Cell, vol. 119, no. 5, pp. 693–705, 2004. [29] E. Filipski, V. M. King, X. Li et al., “Host circadian clock as
a control point in tumor progression,” Journal of the National
Cancer Institute, vol. 94, no. 9, pp. 690–697, 2002.
[30] L. Fu and C. C. Lee, “The circadian clock: pacemaker and tumour suppressor,” Nature Reviews Cancer, vol. 3, no. 5, pp. 350–361, 2003.
[31] J. J. Wille Jr., “Circadian rhythm of tumor promotion in the two-stage model of mouse tumorigenesis,” Cancer Letters, vol. 190, no. 2, pp. 143–149, 2003.
[32] G. Mazzoccoli, A. Panza, M. R. Valvano et al., “Clock gene expression levels and relationship with clinical and patho-logical features in colorectal cancer patients,” Chronobiology
International, vol. 28, no. 10, pp. 841–851, 2011.
[33] G. Mazzoccoli, V. Pazienza, A. Panza et al., “ARNTL2 and SERPINE1: potential biomarkers for tumor aggressiveness in colorectal cancer,” Journal of Cancer Research and Clinical
Oncology, vol. 138, no. 3, pp. 501–511, 2012.
[34] G. Mazzoccoli, A. Piepoli, M. Carella et al., “Altered expression of the clock gene machinery in kidney cancer,” Biomedicine &
Pharmacotherapy, vol. 66, pp. 175–179, 2012.
[35] G. Mazzoccoli, R. B. Sothern, G. Greco et al., “Time-related dynamics of variation in core clock gene expression levels in tissues relevant to the immune system,” International Journal
of Immunopathology and Pharmacology, vol. 24, no. 4, pp. 869–
879, 2011.
[36] V. Pazienza, A. Piepoli, and A. Panza, “SIRT1 and the clock gene machinery in colorectal cancer,” Cancer Investigation, vol. 30, no. 2, pp. 98–105, 2012.
[37] M. F. Robert, S. Morin, N. Beaulieu et al., “DNMT1 is required to maintain CpG methylation and aberrant gene silencing in human cancer cells,” Nature Genetics, vol. 33, no. 1, pp. 61–65, 2003.
[38] E. L. Deer, J. Gonz´alez-Hern´andez, J. D. Coursen et al., “Phenotype and genotype of pancreatic cancer cell lines,”
Pan-creas, vol. 39, no. 4, pp. 425–435, 2010.
[39] W. Motomura, T. Okumura, N. Takahashi, T. Obara, and Y. Kohgo, “Activation of peroxisome proliferator-activated receptorγ by troglitazone inhibits cell growth through the increase of p27(Kip1) in human pancreatic carcinoma cells,”
Cancer Research, vol. 60, no. 19, pp. 5558–5564, 2000.
[40] A. Elnemr, T. Ohta, K. Iwata et al., “PPARgamma ligand (thiazolidinedione) induces growth arrest and differentiation markers of human pancreatic cancer cells,” International
Journal of Oncology, vol. 17, no. 6, pp. 1157–1164, 2000.
[41] K. Hashimoto, R. T. Ethridge, and B. M. Evers, “Peroxisome proliferator-activated receptor γ ligand inhibits cell growth and invasion of human pancreatic cancer cells,” International
Journal of Gastrointestinal Cancer, vol. 32, no. 1, pp. 7–22,
2002.
[42] H. Koga, K. Selvendiran, R. Sivakumar et al., “PPARγ poten-tiates anticancer effects of gemcitabine on human pancreatic cancer cells,” International Journal of Oncology, vol. 40, no. 3, pp. 679–685, 2012.
Submit your manuscripts at
http://www.hindawi.com
Stem Cells
International
Hindawi Publishing Corporation
http://www.hindawi.com Volume 2014
Hindawi Publishing Corporation
http://www.hindawi.com Volume 2014
INFLAMMATION
Hindawi Publishing Corporation
http://www.hindawi.com Volume 2014
Behavioural
Neurology
Endocrinology
International Journal of Hindawi Publishing Corporationhttp://www.hindawi.com Volume 2014
Hindawi Publishing Corporation
http://www.hindawi.com Volume 2014
Disease Markers
Hindawi Publishing Corporation
http://www.hindawi.com Volume 2014
BioMed
Research International
Oncology
Journal ofHindawi Publishing Corporation
http://www.hindawi.com Volume 2014
Hindawi Publishing Corporation
http://www.hindawi.com Volume 2014 Oxidative Medicine and Cellular Longevity Hindawi Publishing Corporation
http://www.hindawi.com Volume 2014
PPAR Research
The Scientific
World Journal
Hindawi Publishing Corporation
http://www.hindawi.com Volume 2014
Immunology Research
Hindawi Publishing Corporation
http://www.hindawi.com Volume 2014
Journal of
Obesity
Journal ofHindawi Publishing Corporation
http://www.hindawi.com Volume 2014
Hindawi Publishing Corporation
http://www.hindawi.com Volume 2014 Computational and Mathematical Methods in Medicine
Ophthalmology
Journal of Hindawi Publishing Corporationhttp://www.hindawi.com Volume 2014
Diabetes Research
Journal ofHindawi Publishing Corporation
http://www.hindawi.com Volume 2014
Hindawi Publishing Corporation
http://www.hindawi.com Volume 2014
Research and Treatment
AIDS
Hindawi Publishing Corporation
http://www.hindawi.com Volume 2014 Gastroenterology Research and Practice
Hindawi Publishing Corporation
http://www.hindawi.com Volume 2014