R E S E A R C H
Open Access
Correlation analysis of the transcriptome of
growing leaves with mature leaf parameters
in a maize RIL population
Joke Baute
1,2, Dorota Herman
1,2, Frederik Coppens
1,2, Jolien De Block
1,2, Bram Slabbinck
1,2, Matteo Dell
’Acqua
3,
Mario Enrico Pè
3, Steven Maere
1,2, Hilde Nelissen
1,2and Dirk Inzé
1,2*Abstract
Background: To sustain the global requirements for food and renewable resources, unraveling the molecular networks underlying plant growth is becoming pivotal. Although several approaches to identify genes and networks involved in final organ size have been proven successful, our understanding remains fragmentary. Results: Here, we assessed variation in 103 lines of the Zea mays B73xH99 RIL population for a set of final leaf size and whole shoot traits at the seedling stage, complemented with measurements capturing growth dynamics, and cellular measurements. Most traits correlated well with the size of the division zone, implying that the molecular basis of final leaf size is already defined in dividing cells of growing leaves. Therefore, we searched for association between the transcriptional variation in dividing cells of the growing leaf and final leaf size and seedling biomass, allowing us to identify genes and processes correlated with the specific traits. A number of these genes have a known function in leaf development. Additionally, we illustrated that two independent mechanisms contribute to final leaf size, maximal growth rate and the duration of growth. Conclusions: Untangling complex traits such as leaf size by applying in-depth phenotyping allows us to define the relative contributions of the components and their mutual associations, facilitating dissection of the biological processes and regulatory networks underneath.
Background
Leaves are the main organs for photosynthesis of the plant and thus have an indispensable role in the gener-ation of metabolic energy and organic compounds [1]. The typical laminar and flat morphology of leaves is ideally suited to capture light energy during photosyn-thesis. Leaf size is an important component of plant architecture that determines in part the amount of energy that can be captured, and as such has a pro-found effect on productivity. Therefore, understanding the molecular mechanisms underlying plant leaf growth and final size is a major goal for plant science. The monocotyledonous plant Zea mays (maize) shows a
high level of intraspecific phenotypic variation, making it excellently suited for genomic approaches and to study complex phenotypes such as leaf size. Further-more, the large size of the maize leaf makes it easier to dissect specific organ domains [2, 3].
At the cellular level, leaf size is determined by two processes, cell proliferation and cell expansion, which are highly coordinated [3]. In maize, growing leaves show a developmental gradient from base to tip, mak-ing the maize leaf an interestmak-ing model to study growth [3, 4]. The different phases of maize leaf development have been described in detail [5]. In the first phase after emergence of the leaf primordium from the shoot apical meristem, cell division and expansion take place simultaneously so that the mean cell size remains constant and the complete leaf consists of dividing cells in the so-called division zone (DZ). In the next phase, cells stop dividing at the tip of the leaf, but continue to expand post-mitotically, giving rise to the expansion * Correspondence:[email protected]
1
Department of Plant Systems Biology, Vlaams Instituut voor Biotechnologie, Technologiepark 927, 9052 Ghent, Belgium
2
Department of Plant Biotechnology and Bioinformatics, Ghent University, Technologiepark 927, 9052 Ghent, Belgium
Full list of author information is available at the end of the article
© 2015 Baute et al.Open Access This article is distributed under the terms of the Creative Commons Attribution 4.0 International License (http://creativecommons.org/licenses/by/4.0/), which permits unrestricted use, distribution, and reproduction in any medium, provided you give appropriate credit to the original author(s) and the source, provide a link to the Creative Commons license, and indicate if changes were made. The Creative Commons Public Domain Dedication waiver (http://creativecommons.org/publicdomain/zero/1.0/) applies to the data made available in this article, unless otherwise stated.
Baute et al. Genome Biology (2015) 16:168 DOI 10.1186/s13059-015-0735-9
zone, distal to the DZ. In the third phase, cells enter the mature zone at the tip of the leaf where cells stop expanding. In this phase of development, the leaf appears from the sheath of the surrounding older leaves and shows a developmental gradient from base to tip, with dividing, expanding and mature cells [3, 4]. Also, the size of the DZ remains constant during this phase as well as the elong-ation rate of the leaf [5]. Finally, the elongelong-ation rate decreases due to a regression of the growth zone.
Although leaf development is well described at the cellular level, knowledge on the molecular mechanisms that determine leaf growth and final size is still frag-mentary, due to the complex polygenic control of these traits (e.g., [3, 6–12]). Several approaches have been followed to dissect the genetic circuits that underlie leaf growth. Forward genetics screens have proven to be useful in the identification of genes that have the potential to contribute to natural variation of phenotypic traits and their specific function [13]. However, the majority of the mutant screens have been limited to a small number of laboratory strains, which harbor only a small portion of the natural variation [14]. Therefore, exploring natural variation provides a complementary resource to identify novel genes and allelic variants, especially for quantitative traits [15]. Typically, linkage analysis is performed using recombinant inbred line (RIL) populations to identify genomic regions with at least one gene controlling part of the phenotypic variability (e.g., [16–19]). Alternatively, genome-wide association analysis in natural populations identifies causative single nucleotide polymorphisms (SNPs) for specific traits [20]. However, these approaches are time consuming and the regions identified by linkage mapping and the SNPs detected using genome-wide asso-ciation analysis often contain a large number of candidate genes that need to be further narrowed down using com-plementary analyses or a priori knowledge [21, 22].
A complementary approach that became available thanks to the recent development of new“-omics” tools is high throughput profiling of large mapping populations, offering new perspectives for genetic integration of several levels of molecular regulation of phenotypic trait variation [23]. In maize, differences in gene expression patterns are suggested to be a more important cause of subtle changes in quantitative traits than alterations in protein sequences causing defective proteins [24–27]. Therefore, exploring transcriptome variation in mapping populations has great potential to characterize the regulatory mecha-nisms and candidate genes that are at the basis of phenotypic differences [28].
Gene expression analyses in growing tissues have re-vealed that the transition from dividing and expanding to mature tissue coincides with vast transcriptional changes and differences in protein levels [2, 29–32]. In the leaf basal region, transcripts and proteins related to
primary cellular metabolism, such as DNA/RNA-related processes, cell growth and regulation/signaling, are more abundant, transitioning to enrichment in transcripts and proteins for secondary cell wall biosynthesis and photo-synthetic development towards the mature region of the leaf. Thus, to study the molecular mechanisms underlying leaf growth, it is important to focus on the growth zone. More specifically, since the majority of the growth regula-tory genes that have been described so far affect the final number of cells rather than the final size of the cells [3, 10, 33], focusing on transcriptional changes in the DZ is expected to have the largest potential for finding new regulatory genes for final leaf size.
The use of new transcriptomics tools has resulted in the generation of large amounts of tissue-specific ex-pression data that have led to new insights into the molecular basis of leaf development [2, 30]. However, the number of studies that link differences in expres-sion levels to phenotypic measurements on a large scale remains limited up to now [34–36]. On the other hand, approaches such as genome-wide association and link-age mapping typically use measurements at the whole-organ or whole-organismal scale, resulting in information that is often too complex to dissect out the biological pro-cesses and regulatory interactions involved [37]. In this study we combined a detailed phenotypic analysis of maize seedlings, focusing on leaf size, with transcript profiling of dividing leaf tissue of the B73xH99 recom-binant inbred line population [38] to further unravel the molecular basis of leaf development. Phenotyping included a set of final leaf measurements, i.e., leaf length, leaf width, leaf area and leaf weight, and whole-shoot measurements at the seedling stage, i.e., fresh weight, dry weight, leaf number and V-stage. These end-point measurements were combined with measure-ments that capture growth dynamics, i.e., maximal growth rate of the leaf and traits related to timing of leaf development. The latter concern emergence of the fourth leaf above the pseudostem cylinder made by sheaths of previously emerged leaves and duration of elongation. Finally, leaf development was partially assessed at the cellular level by determining the size of the DZ during steady state growth of the fourth leaf in all RILs. Capturing dynamic and cellular measurements could reveal new regulatory genes related to more spe-cific processes compared with only considering end point measurements [37, 39]. Correlation analysis be-tween these phenotypic traits revealed that the size of the DZ is positively correlated with most of the final size traits, supporting the hypothesis that the molecular basis underlying final leaf size is already determined in dividing cells of a growing leaf. To further decipher these molecular networks, we captured the transcriptional dif-ferences in dividing cells early during leaf development in
a RIL population and combined this with the detailed phe-notyping. Several genes and processes were identified that show an association between phenotype and expression levels in dividing cells in this RIL population, and that have orthologs in other species with known leaf size phe-notypes upon perturbation. We focused on some specific associations between the rate and duration of elongation and final organ size and the association between maximal growth rate and seedling biomass. The identification of candidate genes — novel genes as well as known growth regulators — not only ameliorates our knowledge of the gene network underlying leaf development but also pro-vides a framework to identify transcriptional markers for breeding new varieties and offers opportunities for genetic modification approaches.
Results and discussion
The size of the DZ correlates with final leaf size, shoot and growth parameters
We phenotyped an established F12 RIL population de-rived from the inbred parents B73 and H99 [40] for leaf-and shoot-related traits at the seedling stage (Table 1; Fig. S1 in Additional file 1). The majority of the traits are linked to the final size of the fourth leaf: final leaf length (LL), final leaf width (Lwi), final leaf area (LA) and final leaf weight (Lwe). In addition, we determined the size of the DZ and leaf elongation rate (LER) — the estimation of the growth of an individual leaf in a given time frame— during the steady state growth phase [41] (see "Material and methods"). To complement final size measurements and further capture leaf growth dynam-ics, we measured some timing-related traits for leaf 4
using LEAF-E [42]: (i) time point of emergence of leaf 4 from the whorl; (ii) time between sowing and reaching final length (Te); (iii) time between sowing and reaching
maximal growth rate (Tm); and (iv) leaf elongation
dur-ation from a leaf of 5 mm until final length (LED5-e).
Together these traits provide an estimate of how long the plant needs to fully expand leaf 4. In addition to these leaf size-related traits, we determined fresh weight (FW) and dry weight (DW) of the above soil-grown plant parts at 27 days after sowing, i.e., when leaf 4 had reached its final size in all lines, and we counted leaf number (LN) and V-stage at this time point.
For the majority of the traits, the two parental lines clearly differed and encompassed the RIL average values (Table 1; Fig. S1 in Additional file 1), but the average of the two parents did not differ significantly from the average over all RILs (p > 0.05). In general, B73 plants were larger than H99 at the seedling stage: FW and DW were higher for B73 than for H99 (p < 0.05), which was in part due to the larger number of leaves (and corresponding V-stage; p < 0.05) (Fig. S2 in Additional file 1). In agreement, timing traits showed that B73 leaves de-veloped faster (emergence, Te, Tmand LED5-eare smaller,
p< 0.05). The fourth leaf of B73 grew faster during steady state and was longer and larger when fully grown than that of H99, but was somewhat narrower (p < 0.05). None-theless, DZ size was not significantly different between B73 and H99 (p > 0.05). In previous reports on the B73-H99 RIL population, traits were measured for fully grown plants, e.g., flowering and yield components, and a trend was also observed for higher values for B73 than for H99 [38, 43, 44].
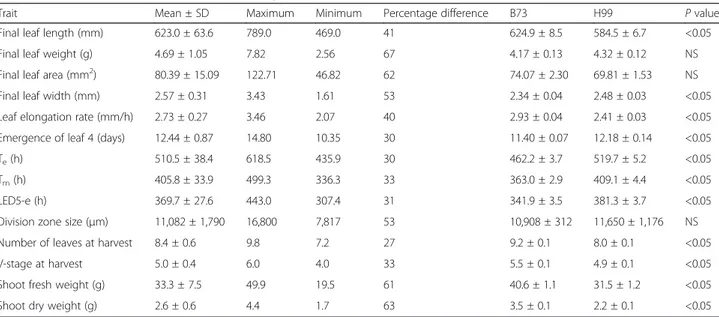
Table 1 Mean, maximum, minimum and percentage differences of the traits determined for the 103 RILs
Trait Mean ± SD Maximum Minimum Percentage difference B73 H99 P value
Final leaf length (mm) 623.0 ± 63.6 789.0 469.0 41 624.9 ± 8.5 584.5 ± 6.7 <0.05
Final leaf weight (g) 4.69 ± 1.05 7.82 2.56 67 4.17 ± 0.13 4.32 ± 0.12 NS
Final leaf area (mm2) 80.39 ± 15.09 122.71 46.82 62 74.07 ± 2.30 69.81 ± 1.53 NS Final leaf width (mm) 2.57 ± 0.31 3.43 1.61 53 2.34 ± 0.04 2.48 ± 0.03 <0.05 Leaf elongation rate (mm/h) 2.73 ± 0.27 3.46 2.07 40 2.93 ± 0.04 2.41 ± 0.03 <0.05 Emergence of leaf 4 (days) 12.44 ± 0.87 14.80 10.35 30 11.40 ± 0.07 12.18 ± 0.14 <0.05
Te(h) 510.5 ± 38.4 618.5 435.9 30 462.2 ± 3.7 519.7 ± 5.2 <0.05
Tm(h) 405.8 ± 33.9 499.3 336.3 33 363.0 ± 2.9 409.1 ± 4.4 <0.05
LED5-e (h) 369.7 ± 27.6 443.0 307.4 31 341.9 ± 3.5 381.3 ± 3.7 <0.05
Division zone size (μm) 11,082 ± 1,790 16,800 7,817 53 10,908 ± 312 11,650 ± 1,176 NS Number of leaves at harvest 8.4 ± 0.6 9.8 7.2 27 9.2 ± 0.1 8.0 ± 0.1 <0.05
V-stage at harvest 5.0 ± 0.4 6.0 4.0 33 5.5 ± 0.1 4.9 ± 0.1 <0.05
Shoot fresh weight (g) 33.3 ± 7.5 49.9 19.5 61 40.6 ± 1.1 31.5 ± 1.2 <0.05
Shoot dry weight (g) 2.6 ± 0.6 4.4 1.7 63 3.5 ± 0.1 2.2 ± 0.1 <0.05
Measurements are averages of 18–20 plants per RIL for leaf 4 emergence, of three plants per RIL for division zone size, and of six plants per RIL for all other traits. P values are for differences between B73 and H99 parents. LED5-eleaf elongation duration from a leaf of 5 mm until final length, NS not significant, Tetime between sowing and reaching final length, Tmtime between sowing and reaching maximal growth rate
Screening 103 RIL lines showed that the weight-related parameters (FW, DW and Lwe) displayed the largest vari-ation (about 65 %), while the smallest varivari-ation (about 30 %) was seen for the timing parameters emergence, Tm, Te
and LED5-e(Table 1; Fig. S3 in Additional file 1).
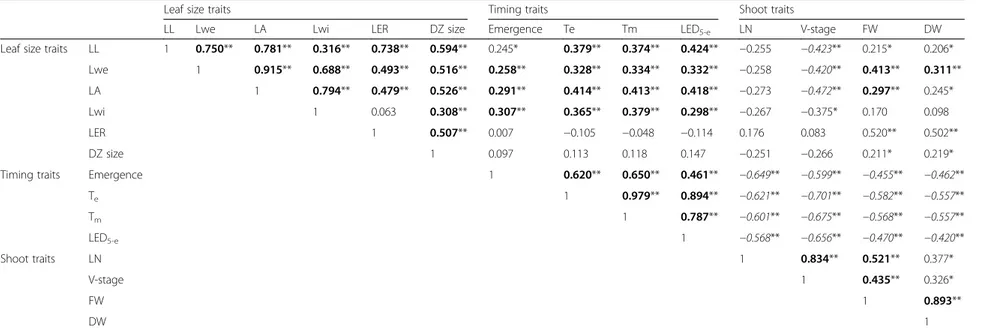
Next, Pearson correlation coefficients (PCCs) were de-termined between all traits obtained for all RILs and the parental lines (Table 2). Traits related to final leaf size (Lwe, LA, LL and Lwi) correlated well, and the shoot traits (DW, FW, LN and V-stage) also showed a positive correlation, as did the timing traits (emergence, Tm, Te
and LED5-e). DZ size correlated positively with the final
leaf size traits and LER. Also, DZ size correlated to some extent with FW and DW, while no significant correlation between DZ size and timing traits was observed. LER correlated positively with most of the final leaf size traits and with FW and DW, but with none of the timing traits. We also performed a principal component ana-lysis (PCA) to validate the relationships between the phenotypic traits; we focused on the first two principal components, which explain most variance within the data (Fig. S4 in Additional file 1). Based on PCA and correlation analysis, phenotypic traits were separated into three groups (Table 2; Fig. S4 in Additional file 1): leaf size traits (final size traits LL, Lwe, LA and Lwi, and in addition LER and DZ size), shoot traits (FW, DW, LN and V-stage) and timing traits (emergence, Tm, Te and
LED5-e).
The leaf size traits Lwe and LER correlated well with the shoot traits FW and DW. In agreement, co-localization of quantitative trait loci (QTL) for leaf growth rate and growth of other organs suggests that the growth rates in different organs share a part of their genetic control [16], implying that similar genes and networks of genes affect organ growth and, as a consequence, also biomass accu-mulation. In wheat and tall fescue, leaf area expansion rate also correlated positively with above-ground biomass and grain yield [45, 46]. V-stage showed a negative correlation with the final leaf size traits, suggesting that plants with larger leaves were generally slower in producing new leaves. Accordingly, timing traits showed a positive correl-ation with traits related to final leaf size, implying that larger leaves needed more time to obtain their final size compared with smaller leaves. In agreement, there was a negative correlation between whole shoot traits and tim-ing traits, also illustrated in the biplot of the PCA (Fig. S4 in Additional file 1). This implies that if it takes longer for a plant to obtain its final leaf size, this generally results in fewer leaves and smaller shoot biomass when leaf 4 stops growing.
The positive correlation between DZ size and the final leaf size parameters confirmed the importance of the number of dividing cells in determination of final organ size. Previously, it was shown that cell proliferation, and
more specifically the transition between cell division and cell expansion, is an important contributing factor to final organ size in different plant species [3, 47, 48]. Additionally, perturbation of most leaf size regulatory genes primarily affects cell number rather than cell size [3, 33, 49, 50]. This suggests that focusing on transcrip-tional differences between RILs in the DZ may provide deeper insight into the molecular networks behind final leaf size traits. Since the DZ size varied considerably between RILs (Table 1) and we wanted to avoid sam-pling expanding tissue, we restricted our analysis to the most basal 0.5 cm of the DZ, which contained only pro-liferating cells in all analyzed RILs.
Transcriptome analysis of proliferative tissue confirms the correlation between leaf size, growth and shoot
parameters
We performed RNA sequencing to profile transcrip-tional changes in proliferative leaf tissue of 103 lines of the B73xH99 RIL population. To this end, the most basal 0.5 cm of the fourth leaf was sampled during the steady state growth phase, i.e., three days after the tip of the fourth leaf emerged from the pseudostem cylinder. The B73 maize reference genome [51] was used to align the RNA sequencing data. As variations on the sequence level can affect the alignment of reads to the reference genome, differences in the genetic background of the two parental lines could affect gene expression quantification differently in different RILs. Therefore, we focused on conserved genes, selecting expressed genes with a low per-centage of SNPs across maize inbred lines (see "Material and methods"). This resulted in a filtered set of 15,051 genes that were used for all further analyses.
The expression data and the phenotypic data were combined after normalization by calculating PCCs be-tween transcript expression values and trait values across all RILs. From the probability plots, the q0.99 and q0.01
correlation coefficients were determined, i.e., the 1 % best correlating and anti-correlating transcripts. The q0.99
and q0.01 correlation coefficients were also determined
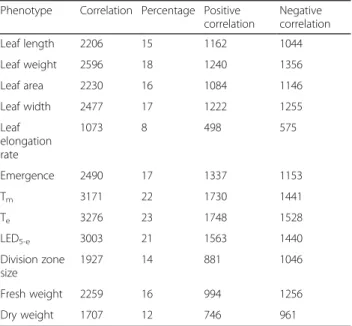
after permutation of the phenotypic data over the RILs (Fig. 1), revealing that we could identify genes correlated higher than expected with a certain phenotype compared with a random gene set. The number of genes correlating better than random, indicated further as the qrandom
cor-relating gene sets, varied between 1073 and 3276 depend-ing on the phenotype (Table 3). The maximal correlation coefficients were rather low, ranging from 0.456 for DZ size to 0.617 for Te, which is not unexpected since the
traits under study are polygenic [6, 19, 52] and known to be controlled by a large number of small-effect genes [53]. For all traits, the numbers of positively and negatively cor-relating genes in the qrandom correlating gene sets were
Table 2 Pearson correlation coefficients for the different traits analyzed
Leaf size traits Timing traits Shoot traits
LL Lwe LA Lwi LER DZ size Emergence Te Tm LED5-e LN V-stage FW DW
Leaf size traits LL 1 0.750** 0.781** 0.316** 0.738** 0.594** 0.245* 0.379** 0.374** 0.424** −0.255 −0.423** 0.215* 0.206* Lwe 1 0.915** 0.688** 0.493** 0.516** 0.258** 0.328** 0.334** 0.332** −0.258 −0.420** 0.413** 0.311** LA 1 0.794** 0.479** 0.526** 0.291** 0.414** 0.413** 0.418** −0.273 −0.472** 0.297** 0.245* Lwi 1 0.063 0.308** 0.307** 0.365** 0.379** 0.298** −0.267 −0.375* 0.170 0.098 LER 1 0.507** 0.007 −0.105 −0.048 −0.114 0.176 0.083 0.520** 0.502** DZ size 1 0.097 0.113 0.118 0.147 −0.251 −0.266 0.211* 0.219* Timing traits Emergence 1 0.620** 0.650** 0.461** −0.649** −0.599** −0.455** −0.462**
Te 1 0.979** 0.894** −0.621** −0.701** −0.582** −0.557** Tm 1 0.787** −0.601** −0.675** −0.568** −0.557** LED5-e 1 −0.568** −0.656** −0.470** −0.420** Shoot traits LN 1 0.834** 0.521** 0.377* V-stage 1 0.435** 0.326* FW 1 0.893** DW 1
Significant correlations are indicated by **p < 0.01 and *p < 0.05; highly significant positive correlations are indicated in bold; highly significant negative correlations are indicated in italics. LL leaf length, Lwe leaf weight, LA leaf area, Lwi leaf width, LER leaf 4 elongation rate, DZ division zone, Tmtime to maximal LER, Tetime to final leaf length, LED5-eleaf elongation duration, FW shoot fresh weight, DW shoot dry weight, LN leaf number Baute et al. Genome Biology (2015) 16:168 Page 5 of 26
gene sets for FW and DW were comparable to the num-bers found for leaf size traits, which was unexpected since DW and FW are believed to be more complex traits than the others. Although we cannot exclude that additional and/or partially different diagnostic transcriptional vari-ation would be captured in the complete DZ, our results imply that the transcriptome of the most basal part of the DZ during steady state growth of a leaf at least partly re-flects final organ size and even more distant phenotypic traits such as FW and DW.
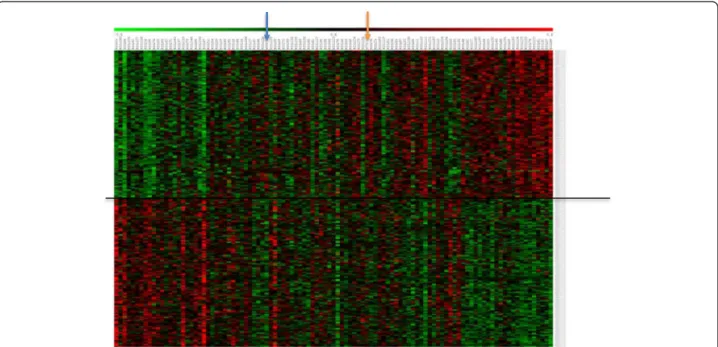
For the remaining analyses, we focused on the 1 % best correlating and anti-correlating genes for each of the traits, further indicated as the correlated and anti-correlated gene sets. These gene sets are for each trait subsets of the qrandom correlated gene sets discussed
above (Fig. 1). Visualization of the expression pattern of these anti-correlating/correlating genes in the 103 RILs and the parents is exemplified in Fig. 2 for leaf length (and for other traits in Fig. S5 in Additional file 1). When the RILs were ordered according to phenotype from smallest to largest RIL, a clear correlation with gene expression was observed. The observed gradient became, as expected, less clear for the traits for which the correlation coefficients were lower, such as for LER and DW (Fig. S5 in Additional file 1). Although we could identify individual genes for which expression level is clearly associated with one or more of the traits we analyzed, the low correlation levels and the observation that no single gene was for all RILs associated with a particular trait across all RILs suggests that not one gene but a network of multiple genes is underlying the traits under study.
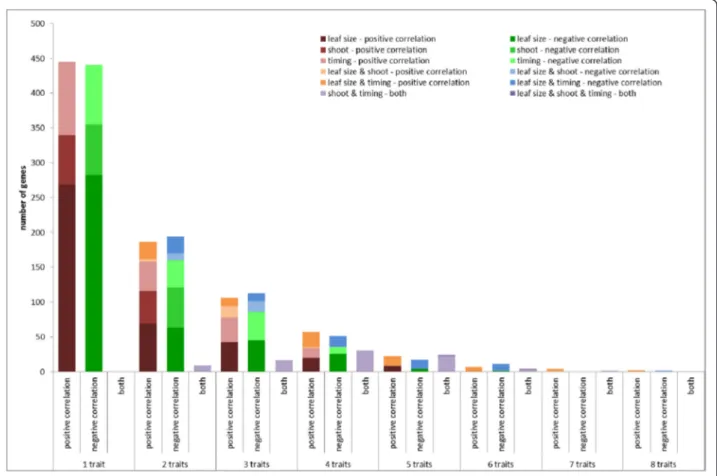
In total, 1740 genes are part of the (anti-)correlating gene sets of at least one of the traits (Additional file 2). Approximately half of these genes— 886 genes or 51 % — were specific for one trait, while three genes (anti-)corre-lated with eight traits, the maximum number of traits for which there were genes in common (Fig. 3). These genes have no immediate known link with leaf develop-ment (GRMZM2G166713, which shows homology to a methionine tRNA synthetase; GRMZM2G471142, which shows homology to barley MLO genes; and a third gene,
Fig. 1 Correlation coefficients of the top 1 % (anti-)correlating genes. The q0.99and q0.01quantiles of the distributions of PCCs between transcript
expression levels and phenotypes, for real data (q0.99in dark grey and q0.01quantile in light grey) and permuted data (black line). LL leaf 4 final
length, Lwe leaf 4 final weight, LA leaf 4 final area, Lwi leaf 4 final width, LER leaf 4 elongation rate, Tmtime to maximal LER, Tetime to final leaf
length, LED5-eleaf elongation duration, DZS leaf 4 DZ size, FW fresh weight 27 days after sowing, DW dry weight 27 days after sowing
Table 3 Number of genes that correlate with a certain phenotypic trait higher than random
Phenotype Correlation Percentage Positive correlation Negative correlation Leaf length 2206 15 1162 1044 Leaf weight 2596 18 1240 1356 Leaf area 2230 16 1084 1146 Leaf width 2477 17 1222 1255 Leaf elongation rate 1073 8 498 575 Emergence 2490 17 1337 1153 Tm 3171 22 1730 1441 Te 3276 23 1748 1528 LED5-e 3003 21 1563 1440 Division zone size 1927 14 881 1046 Fresh weight 2259 16 994 1256 Dry weight 1707 12 746 961
GRMZM2G389768, which shows homology to cold shock domain-containing proteins). The numbers of genes (anti-)correlating with from one to eight traits were comparable for positive and negative correlation. Comparing the num-bers of genes (anti-)correlating with two or more traits within and between the three phenotype classes defined based on their correlation (leaf size, timing and shoot traits) showed that this number is higher within groups than between groups (this is illustrated in Fig. 3; compare the size of the red bars versus the orange bars and the green bars versus the blue bars). The number of common genes between leaf size traits and shoot traits was limited — just 50 genes. Furthermore, only a minority of the genes— 84 genes or 5 % — correlated with one or more traits and anti-correlated with one or more other traits (purple bars in Fig. 3). This opposite correlation for differ-ent traits was exclusively observed for timing traits versus shoot traits; strikingly, there was not one (anti)-correlating gene in common between shoot and timing traits. Thus, the (anti-)correlation between traits on a phenotypic level was fully supported by the correlations between expres-sion levels of the selected genes and traits.
In a next step we evaluated if the correlated genes for the different traits were enriched in comparable pro-cesses (Fig. S6 in Additional file 1). Enrichment for spe-cific processes was calculated based on MapMan gene function annotations [54]. For positively correlated gene sets, there was an enrichment in six categories: “regulation of transcription”, “hormone metabolism”,
“protein modifications”, “protein degradation” “carbohy-drate metabolism” and “transport”. Negatively correlated gene sets were enriched for the categories“regulation of transcription”, “cell wall synthesis and degradation” and “protein synthesis”. Most of the enriched categories were not specific for one trait, with the exception of the cat-egory “transport” for genes correlating with leaf emer-gence, although no specificity for transport of certain compounds was found. Furthermore, we found that traits were enriched for the same processes not only when they have a large number of correlating genes in common (e.g., FW and DW), but also when only a limited number of genes was shared (e.g., the shoot traits and final leaf size traits). Functional categories “carbohydrate metabolism” and“transport” were specific for the timing related traits.
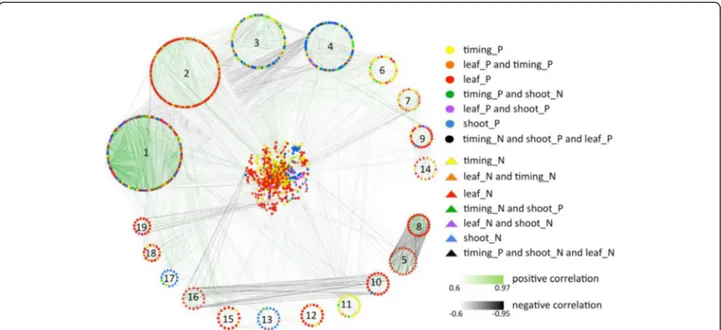
To visualize the co-expression of the genes correlating with the traits, we generated a correlation network start-ing from the 1740 genes that (anti-)correlated to at least one of the traits. The network was based on correlation coefficients between the transcripts (nodes) higher than 0.6 or lower than −0.6, and as such 1459 transcripts were connected by 23,363 edges. The network was clus-tered using the Markov cluster algorithm (MCL) [55] (see "Materials and methods" for details). The algorithm differentiated 155 clusters encompassing all but 81 tran-scripts (Fig. 4). For 19 clusters containing more than 15 nodes, we calculated enrichment for specific processes in a comparable way as for the trait-specific gene sets [54]. Eight of the 19 clusters were significantly enriched
Fig. 2 Expression patterns of the top 1 % genes (anti-)correlated with leaf length. Columns represent the 103 RILs and parental lines B73 and H99, organized from small (left) to large (right) leaf length; rows represent gene expression profiles. Genes above the line are significantly correlated with leaf length; genes below the line are significantly anti-correlated with leaf length. Parental lines H99 and B73 are indicated by the blue arrow and orange arrow, respectively. Green indicates low expression, red indicates high expression
for one or more functional categories (clusters 1, 2, 3, 4, 6, 7, 9, and 14). Cluster 1 was enriched for protein-related processes, i.e., “amino acid activation” and “pro-tein degradation and pro“pro-tein targeting”, and for “cell vesicle transport”, although the genes in this cluster were not associated with any specific trait (Fig. 4). Cluster 2, with mainly genes anti-correlated to leaf size and timing traits, was found to be enriched for the functional cat-egories “protein synthesis”, “regulation of transcription”, “photosynthesis” and “tetrapyrrole synthesis” (Fig. 4). Clusters 3 and 4 consisted primarily of nodes positively correlating with shoot traits or negatively correlating with timing traits. Cluster 3 was enriched for functional categories“protein synthesis” and “DNA synthesis/chro-matin structure”. Cluster 4 was found to be enriched in “hormone metabolism” and “regulation of transcription”, both functional categories positively correlated with shoot traits, in accordance with the predominantly shoot trait-correlating gene content of this cluster (Fig. 4). Cluster 6, representing predominantly genes correlated with timing traits, was enriched in the functional category
“major carbohydrate metabolism” (Fig. 4). Clusters 7 and 14, containing nodes anti-correlated with leaf size and timing traits, were enriched in the category“cell wall deg-radation and synthesis” (Fig. 4). Cluster 9, positively corre-lated with leaf size traits, was enriched in “regulation of transcription” (Fig. 4).
Taken together, some of the gene expression-based clusters associated with certain traits or combination of traits contain genes assigned to functional categories found in the overall enrichment results. Most of the gene clusters and most of the categories found enriched in those clusters are not specific for one trait group, but for a combination. This is not unexpected given the correlations we find between the traits on the pheno-type level. Also, some functional categories were found enriched in several clusters associated with uncorre-lated trait groups, or inversely correuncorre-lated with a par-ticular trait group, e.g., “regulation of transcription” in clusters 2 (negatively correlated with leaf size traits), 4 (positively correlated with shoot traits) and 9 (positively correlated with leaf size traits).
Fig. 3 Number of genes correlating or anti-correlating with one or multiple traits. Traits were separated into three groups: leaf size traits (leaf elongation rate, leaf length, leaf weight, leaf area, leaf width and DZ size), shoot traits (fresh weight and dry weight) and timing traits (emergence, Tm, Teand leaf elongation duration). Positive correlation is colored red (traits of the same group) and orange (traits of different groups), negative
correlation is colored green (traits of the same group) and blue (traits of different groups), while purple bars indicate genes that show positive correlation with one trait and negative correlation with another trait
Phenotypic components and genes contributing to final leaf size
To decipher the complexity of final leaf biomass, this trait was dissected in different components. In general, correlation analysis showed significant positive correla-tions between the different components, consisting of leaf length, leaf weight, leaf area and leaf width (LL, Lwe, LA and Lwi), although the strength of the relationships differed considerably (Table 2). The PCC between LA and Lwe was high (0.915), implying that the contribution of leaf thickness to Lwe is negligible. This is in agree-ment with currently used models for leaf and crop growth, where leaf thickness is not taken into consider-ation [56]. Comparable PCCs between LL–LA/Lwe and Lwi–LA/Lwe (0.781/0.750 and 0.794/0.688, respectively), while correlation between Lwi and LL was only limited (0.316), suggest an equal contribution of LL and Lwi to final LA and Lwe. Comparably, the overlap between LL and Lwi at the genetic level in the nested association mapping population in maize was very restricted [18], and meta-analysis of several populations also confirmed a low correlation coefficient between LL and Lwi [57].
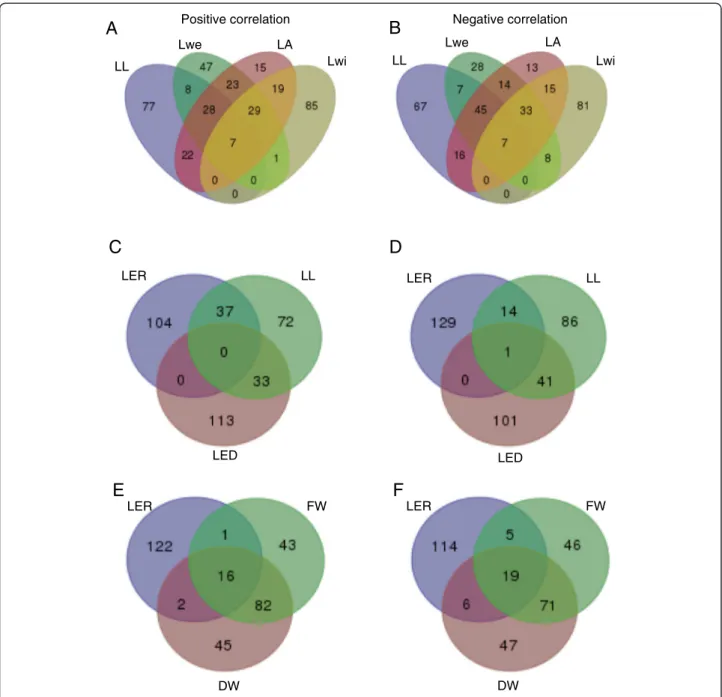
The diversity in associations between the final leaf size traits was also reflected in the transcriptome data. Figure 5a and b represent the intersections between the genes correlating and anti-correlating, respectively, with the final leaf size traits. Of the in total 361 and 334 genes correlating and anti-correlating, respectively, with at least one of the final leaf size traits, 224 and 189 were specific
for one particular trait. Lwi in particular only shared a lim-ited number of genes with the other traits, suggesting that this trait is under different genetic control than the other final leaf size traits.
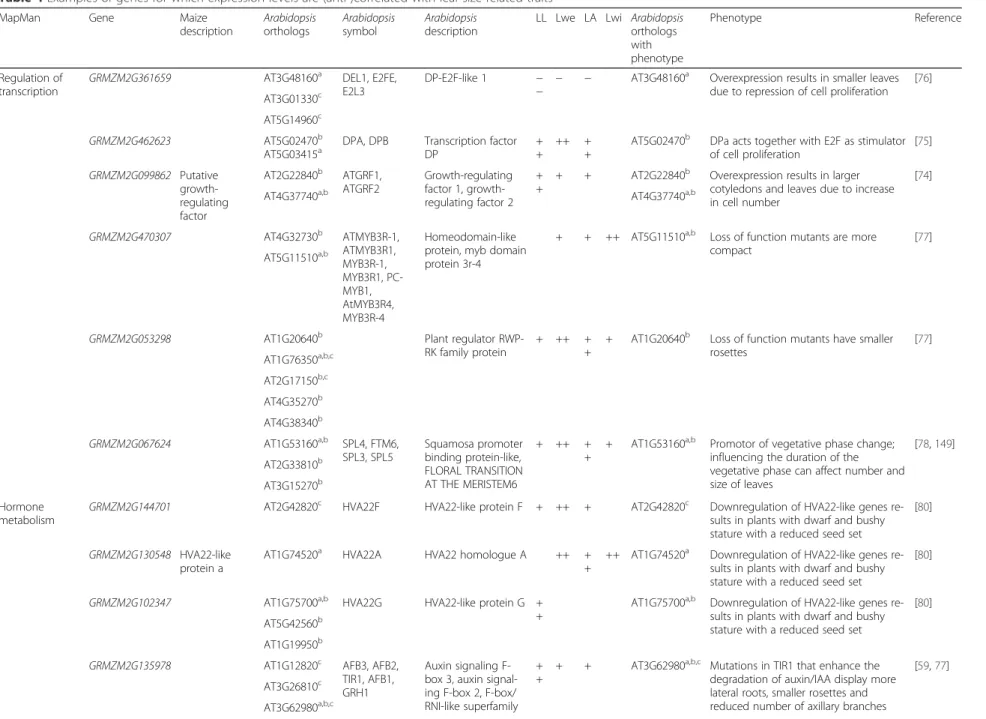
Consistent with the co-expression network and en-richment analysis for separate traits (Fig. 4; Fig. S6 in Additional file 1), the genes positively correlating with the final leaf size traits were enriched for four functional categories of genes: “regulation of transcription”, “protein degradation”, “protein modifications” and “hormone me-tabolism”. Negatively correlating transcripts were enriched for the categories “cell wall synthesis and degradation”, “protein synthesis”, “tetrapyrrole synthesis”, and “photo-synthesis” (Fig. S7 in Additional file 1). The biological significance of the major categories of positively and nega-tively correlating transcripts is discussed below and exam-ples of (orthologous) genes with a known function in leaf development are summarized in Table 4.
Of the 15,051 genes in the filtered gene set, 1433 genes are part of the MapMan category “regulation of transcription”, and for 82 of these genes expression levels in the RILs were positively or negatively corre-lated with at least one of the final leaf size traits. These 82 genes were separated over 32 different families of transcription factors, although no clear trends of speci-ficity of certain families for certain traits could be ob-served (Additional file 2). The Arabidopsis homologs of several of these genes are involved in hormone regula-tion, such as ARFs and AUX/IAA in auxin signaling
Fig. 4 Transcript co-expression network based on Pearson correlation. The network of transcript co-expression links with correlation coefficients higher than 0.6 or lower than−0.6 as visualized in Cytoscape [148]. A circular layout is used for 19 clusters that contain at least 15 nodes. The remaining transcripts are displayed in the middle with a prefuse force directed layout. Node colors and shapes represent the associations of transcripts with the traits (in the figure legend, _P stands for positive and _N for negative correlation with the trait concerned), whereby similarly colored circles and triangles depict opposite associations with the same traits. The strength of the correlations between transcripts is reflected in the hue of the edges
[58, 59], ARR in cytokinin signaling [60] and GRAS in gib-berellin signaling [61]. Some genes are homologs of the Alfin-like family, SET-domain family and DNA methyl-transferases, all involved in regulation of chromatin struc-ture in Arabidopsis [62–67], which is essential for normal cell functioning, development and leaf growth [50]. Other genes belong to (super)families of transcription factors that are functionally very diverse, e.g., the B3 superfamily [68],
bHLH family [69], bZIP family [70], MYB family [71], NAC family [72] and Trihelix family [73]. Many of these families contain transcription factors with a clear role in leaf development; some examples are summarized in Table 4. For instance, GRMZM2G099862 shows homology to the Arabidopsis transcriptional activators GROWTH REGULATING FACTOR 1 (GRF1) and GRF2 [74]; two E2F/DP transcription factors, GRMZM2G462623 and
LL Lwe LA Lwi LER FW DW LER FW DW LL Lwe LA Lwi
A
C
D
E
F
LER LL LED LER LL LEDPositive correlation Negative correlation
B
Fig. 5 Venn diagrams of the top 1% transcripts that correlate positively or negatively with selected phenotypic traits. a Transcripts positively correlated with final leaf size traits (leaf length, leaf weight, leaf area and leaf width). b Transcripts negatively correlated with final leaf size traits (leaf length, leaf weight, leaf area and leaf width). c Transcripts positively correlated with leaf elongation rate, leaf elongation duration and leaf length. d Transcripts negatively correlated with leaf elongation rate, leaf elongation duration and leaf length. e Transcripts positively correlated with fresh weight, dry weight and leaf elongation rate. f Transcripts negatively correlated with fresh weight, dry weight and leaf elongation rate
Table 4 Examples of genes for which expression levels are (anti-)correlated with leaf size-related traits
MapMan Gene Maize description Arabidopsis orthologs Arabidopsis symbol Arabidopsis description
LL Lwe LA Lwi Arabidopsis orthologs with phenotype Phenotype Reference Regulation of transcription
GRMZM2G361659 AT3G48160a DEL1, E2FE,
E2L3
DP-E2F-like 1 −
− − − AT3G48160
a Overexpression results in smaller leaves
due to repression of cell proliferation [76] AT3G01330c
AT5G14960c
GRMZM2G462623 AT5G02470b
AT5G03415a
DPA, DPB Transcription factor DP
+ +
++ + +
AT5G02470b DPa acts together with E2F as stimulator
of cell proliferation [75] GRMZM2G099862 Putative growth-regulating factor AT2G22840b ATGRF1, ATGRF2 Growth-regulating factor 1, growth-regulating factor 2 + +
+ + AT2G22840b Overexpression results in larger cotyledons and leaves due to increase in cell number
[74] AT4G37740a,b AT4G37740a,b
GRMZM2G470307 AT4G32730b ATMYB3R-1, ATMYB3R1, MYB3R-1, MYB3R1, PC-MYB1, AtMYB3R4, MYB3R-4 Homeodomain-like protein, myb domain protein 3r-4
+ + ++ AT5G11510a,b Loss of function mutants are more
compact
[77] AT5G11510a,b
GRMZM2G053298 AT1G20640b Plant regulator
RWP-RK family protein
+ ++ + +
+ AT1G20640b Loss of function mutants have smaller
rosettes [77] AT1G76350a,b,c AT2G17150b,c AT4G35270b AT4G38340b GRMZM2G067624 AT1G53160a,b SPL4, FTM6, SPL3, SPL5 Squamosa promoter binding protein-like, FLORAL TRANSITION AT THE MERISTEM6 + ++ + +
+ AT1G53160a,b Promotor of vegetative phase change;
influencing the duration of the vegetative phase can affect number and size of leaves [78,149] AT2G33810b AT3G15270b Hormone metabolism
GRMZM2G144701 AT2G42820c HVA22F HVA22-like protein F + ++ + AT2G42820c Downregulation of HVA22-like genes
re-sults in plants with dwarf and bushy stature with a reduced seed set
[80] GRMZM2G130548 HVA22-like
protein a
AT1G74520a HVA22A HVA22 homologue A ++ +
+
++ AT1G74520a Downregulation of HVA22-like genes
re-sults in plants with dwarf and bushy stature with a reduced seed set
[80] GRMZM2G102347 AT1G75700a,b HVA22G HVA22-like protein G +
+
AT1G75700a,b Downregulation of HVA22-like genes
re-sults in plants with dwarf and bushy stature with a reduced seed set
[80] AT5G42560b
AT1G19950b
GRMZM2G135978 AT1G12820c AFB3, AFB2,
TIR1, AFB1, GRH1
Auxin signaling F-box 3, auxin signal-ing F-box 2, F-box/ RNI-like superfamily
+ +
+ + AT3G62980a,b,c Mutations in TIR1 that enhance the
degradation of auxin/IAA display more lateral roots, smaller rosettes and reduced number of axillary branches
[59,77] AT3G26810c AT3G62980a,b,c Baute et al. Genome Biology (2015) 16:168 Page 11 of 26
biosynthesis-like protein DIM1, DWF1, EVE1 protein/DWARF1/ DIMINUTO (DIM)
− roundish, dark green leaves next to short, robust inflorescence and reduced fertility
GRMZM2G125943 Histidine kinase AT1G27320c AHK3, HK3,
AHK4, ATCRE1, CRE1, WOL, WOL1, AHK2, HK2 Histidine kinase 3, CHASE domain containing histidine kinase protein, histidine kinase 2 + ++ + +
+ AT1G27320c Ectopic expression of ZmHK6 in
Arabidopsis results in strongly enhanced shoot development, next to smaller seeds and a smaller root system; loss of function mutants in Arabidopsis orthologs have severe phenotypes, including smaller leaves due to a strong reduction in the number of cells
[150,151] AT2G01830a,b AT2G01830a,b
AT5G35750c AT5G35750c
GRMZM2G158252 Histidine kinase 3
AT1G27320c
AT5G35750a,b,c AHK3, HK3,AHK4, ATCRE1,
CRE1, WOL, WOL1, AHK2, HK2 Histidine kinase 3, CHASE domain containing histidine kinase protein, histidine kinase 2 + + ++ + + + AT1G27320c
AT5G35750a,b,c Ectopic expression of ZmHK1 inArabidopsis results in strongly enhanced
shoot development, next to smaller seeds and a smaller root system; loss of function mutants in Arabidopsis orthologs have severe phenotypes, including smaller leaves due to a strong reduction in the number of cells
[150,151]
GRMZM2G067225 Allene oxide synthase
AT5G42650a,b,c DDE2, AOS,
CYP74A DELAYED DEHISCENCE 2, allene oxide synthase, CYTOCHROME P450 74A − − − − − AT5G42650
a,b,c aos mutants have larger leaves and
rosettes [83,152] Protein degradation GRMZM2G041561 BRCA1-associated protein
AT2G26000a,b,c BRIZ2 Zinc finger (C3HC4-type RING finger) family protein
+ +
++ + +
++ AT2G26000a,b,c Loss of function mutants show severe phenotype; genes involved in seed germination and early seedling growth
[91] GRMZM2G120408 AT3G61590a,b HWS, HS HAWAIIAN SKIRT +
+
+ + AT3G61590a,b Loss of function mutants display increased growth of leaves and roots, while overexpression reduces rosette size
[92]
GRMZM2G116314 AT1G17110a,b,c UBP15 Ubiquitin-specific
protease 15
+ ++ + AT1G17110a,b,c Overexpression results in plants with
larger rosettes due to increase in leaf weight and number of leaves, while mutants display opposite phenotypes
[90] Posttranslational modifications GRMZM2G054634 ATP binding protein AT1G01740c BSK3, BSK1, BSK2 BR-signaling kinase + + + + +
AT1G01740c Triple, quadruple and pentuple loss of function mutants show a reduced rosette size [153] AT1G50990c AT1G50990c AT1G63500c AT1G63500c AT3G54030c AT3G54030c AT4G00710c AT4G00710c Biology (2015) 16:168 Page 12 of 26
Table 4 Examples of genes for which expression levels are (anti-)correlated with leaf size-related traits (Continued)
AT4G35230c AT4G35230c
AT5G41260c AT5G41260c
AT5G46570a,b,c AT5G46570a,b,c
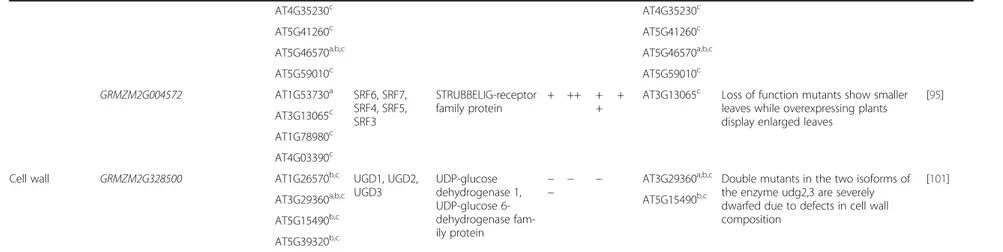
AT5G59010c AT5G59010c GRMZM2G004572 AT1G53730a SRF6, SRF7, SRF4, SRF5, SRF3 STRUBBELIG-receptor family protein + ++ + +
+ AT3G13065c Loss of function mutants show smaller
leaves while overexpressing plants display enlarged leaves
[95] AT3G13065c
AT1G78980c
AT4G03390c
Cell wall GRMZM2G328500 AT1G26570b,c UGD1, UGD2,
UGD3 UDP-glucose dehydrogenase 1, UDP-glucose 6-dehydrogenase fam-ily protein − − − − AT3G29360
a,b,c Double mutants in the two isoforms of
the enzyme udg2,3 are severely dwarfed due to defects in cell wall composition
[101] AT3G29360a,b,c AT5G15490b,c
AT5G15490b,c
AT5G39320b,c Arabidopsis orthologs were determined using PLAZA3.0 web resource [147].a
Best hit family ortholog.b
Tree-based ortholog.c
Orthologous gene family. Double plus signs ("++") indicate transcript levels positively cor-related with phenotypic trait (q0.99). Single plus signs ("+") indicate transcript levels positively correlated with phenotypic trait (qrandom). Double minus signs ("−−") indicate transcript levels negatively correlated with phenotypic trait (q0.01). Single minus signs ("−") indicate transcript levels negatively correlated with phenotypic trait (qrandom). IAA indole-3-acetic acid
Baute et al. Genome Biology (2015) 16:168 Page 13 of 26
GRMZM2G361659, showed an opposed correlation with leaf size traits, in agreement with the function of their puta-tive homologs in Arabidopsis [75, 76]; GRMZM2G470307 shows homology to Arabidopsis MYB domain protein 3r-4 [77]; GRMZM2G053298 encodes a transcription factor with homology to an Arabidopsis plant regulator RWP-RK family protein [77]; GRMZM2G067624 encodes a squa-mosa promoter binding protein with homology to Arabi-dopsisSPL4, which promotes vegetative phase change [78].
A second functional category, next to“regulation of tran-scription”, in which gene sets positively correlate with sev-eral of the final leaf size traits was enriched in “hormone regulation” (Fig. S7 in Additional file 1). Plant hormones regulate diverse processes in plant development and are suggested to play an important role in the balance between cell division and differentiation to modulate growth [79]. Sixteen genes encoding proteins for auxin, cytokinin, bras-sinosteroid, ethylene, abscisic acid, gibberellin and jasmo-nate biosynthesis and signaling correlated with final leaf size traits (Table 4; Additional file 2). Some of these genes have homologs in Arabidopsis which are known to function in leaf development and/or display defects in leaf morph-ology when perturbed and some examples are summarized in Table 4. For instance, GRMZM2G135978 shows hom-ology to the family of Arabidopsis TIR1/AFB auxin recep-tors [59]; GRMZM2G130548, GRMZM2G144701 and GRMZM2G102347 are putative HVA22-like genes [80]; GRMZM2G057000 is the maize ortholog of Arabidopsis DWARF1, a brassinosteroid biosynthetic enzyme [81]; histi-dine kinase receptors (HK) ZmHK1 (GRMZM2G158252) and ZmHK6 (GRMZM2G125943) result in enhanced shoot development when ectopically expressed in Arabidopsis [82]; GRMZM2G067225 is a homolog of the Arabidopsis jasmonate biosynthesis gene ALLENE OXIDE SYNTHASE (AOS) [83].
The functional category “protein degradation” was enriched in all gene sets positively correlated with a final leaf size trait (Fig. S6 in Additional file 1). Con-trolled proteolysis is an important layer of regulation, next to (post-)transcriptional and (post-)translational regulation. For instance, progression through the cell cycle requires tight control of the involved regulatory pro-teins and depends on a precise temporal and spatial prote-olysis of these proteins through the ubiquitin-mediated pathway, next to other regulatory mechanisms such as phosphorylation/dephosphorylation and specific protein– protein interactions [84, 85]. Several genes that are part of the ubiquitin-mediated pathway display an altered final leaf size when perturbed, e.g., APC10, SAMBA, DA1 and BIG BROTHER [86–89]. GRMZM2G116314 is a maize homolog of Arabidopsis UBIQUITIN-SPECIFIC PROTE-ASE 15 (UBP15), involved in protein de-ubiquitination [90]; GRMZM2G041561 encodes a RING finger domain E3 ligase with homology to Arabidopsis BRAP2 RING
ZNF UBP DOMAIN-CONTAINING PROTEIN 2(BRIZ2), essential for seed germination and for post-germination growth [91]; GRMZM2G120408 is a maize homolog of the Arabidopsis F-box E3 ligase HAWAIIAN SKIRT (HWS) [92] (Table 4).
Besides the positive correlation with “protein degrad-ation”, Lwe and LA were also positively correlated with genes involved in“protein modifications”, including post-translational modifications and glycosylation. Because these modifications are essential to rapidly transduce inter- and intracellular information, they are important for regulation of plant growth and development [93]. GRMZM2G054634shows homology to Arabidopsis BR-SIGNALING KINASES (BSK) [94]; GRMZM2G004572 is related to the STRUBBELIG-receptor family (SRF) in Arabidopsis[95] (Table 4).
The category “protein synthesis”, and more specifically synthesis of ribosomal proteins, was overrepresented in the anti-correlating gene sets for all final leaf size traits (Fig. 4; Fig. S6 in Additional file 1). Protein synthesis is one of the most energy consuming processes in the cell and a major component of cell growth. An indirect cost of protein synthesis is to synthesize and maintain the structural constituents of the ribosomes, the ribosomal proteins. A more efficient translational machinery can minimize these indirect costs and result in more energy available for growth [96–98], which might explain the anti-correlation we observed between ribosomal protein synthesis transcript levels and leaf size and timing traits. The fact that the translation machinery also plays a role in leaf development is supported by the many mutations in ribosomal proteins that have been reported to affect leaf morphology (reviewed in [99, 100]).
Genes negatively correlating with leaf size traits were also enriched for the functional category “cell wall syn-thesis and degradation” (Fig. 4; Fig. S6 in Additional file 1). Cell wall expansion is essential to allow cell growth and is thus pivotal for plant growth and development. GRMZM2G328500is a homolog of the Arabidopsis gene encoding UDP-glucose dehydrogenase 2 (UDG2), which is a key enzyme in primary cell wall formation [101] (Table 4).
The multitude of genes with expression levels correlat-ing with final leaf size traits in this RIL population that have homologs in Arabidopsis showing altered leaf sizes upon perturbation implies that these genes are part of molecular networks in the most basal part of the DZ that are associated with final leaf size traits. For some genes (e.g., GRMZM2G120408 and GRMZM2G120408), correlation in our dataset does not reflect the anticipated variation based on phenotypes of the Arabidopsis homo-logs. This is possibly due to comparing subtle variation in expression and allelic effects and combination of these within the RIL population with more abrupt effects
of complete knock-out or strong overexpression, often in one or a limited number of genetic backgrounds in Arabidopsis.
Both maximal growth rate and duration of growth independently determine final leaf length
The final length of a monocot leaf depends on the rate and duration of elongation of the leaf, represented here by the parameters LER and LED5-e. LER and LED5-e showed
no correlation on the phenotype level (Table 2), in con-trast to the positive correlation between final size-related traits and timing traits on the one hand and LER on the other hand. A comparable correlation between LER and LL was reported for the sixth leaf in greenhouse and field conditions, and was supported by the co-location of QTL for LER and LL in several populations [16]. For Lolium perennegrown in the field, correlation between LER and LED was limited, while there was a high positive correl-ation between LER and LL, and between LED and LL. LER and LED were also not correlated in wheat (Triticum aestivum) and its wild relative Aegilops [102].
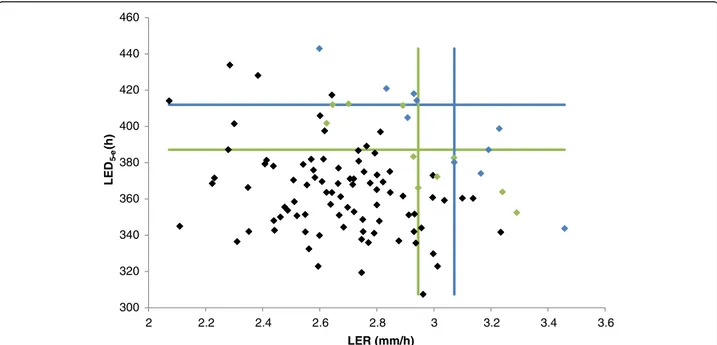
Figure 6 represents a scatter plot of LER and LED5-e,
with the blue and green lines indicating the borders of the 10 % and 20 % largest RILs for the two traits, re-spectively. This figure illustrates that there is only a very limited number of lines that have both a high LER and LED5-e, supporting an idea of phenotypic tradeoff. Thus,
a better insight into these two traits on the molecular level can provide useful information for selecting or engineering plants with increased biomass.
The fact that there is no correlation on the phenotype level between LER and LED5-e is also reflected on the
molecular level: no (anti-)correlating genes are shared between LER and LED5-e (Fig. 5c, d), pointing to
separ-ate, independent molecular mechanisms that determine final leaf length. Given the high PCC (0.738) between LER and LL on the phenotype level, the number of genes specifically correlating with one of the traits was rather high — more than two-thirds of the LER-correlating genes were specific for LER (Table 2; Fig. 5c, d). Despite the lower PCC between LED5-e and LL than
between LER and LL, this was not reflected in the num-ber of genes in these intersections (Fig. 5c, d). This is possibly due to the lower values for the 0.99 and 0.01 quantiles of Pearson correlation distributions for LER than for the other traits (Fig. 1). The limited overlap in (anti-)correlating genes between LL and LER or LED5-e
suggests that the molecular networks underlying elong-ation rate, elongelong-ation durelong-ation and final size are only partially shared and other additional mechanisms are also possibly involved.
On the gene level, the intersection between LER and LL represents genes functioning in hormone signal transduction and metabolism (auxin, brassinosteroid and ethylene), protein degradation machinery (E3 RING proteins), transcription factors (bZIP and E2F/ DP) and genes related to transport, calcium and light signaling (Additional file 2). Some of these genes have Arabidopsis homologs that are possibly involved in regulation of leaf development, given that perturbation
300 320 340 360 380 400 420 440 460 2 2.2 2.4 2.6 2.8 3 3.2 3.4 3.6 LE D 5-e (h) LER (mm/h)
Fig. 6 Scatter plot of the measurements for the leaf elongation rate (LER) and leaf elongation duration (LED5-e) traits. Blue dots indicate the 10 %
of RILs with the largest leaf length; green dots the 20 % of RILs with largest leaf length. Blue lines represent the borders of the 10 % of RILs with largest LED5-eand LER; green lines represent the borders of the 20 % of RILs with largest LED5-eand LER
results in altered leaf and rosette sizes (Table 5). Examples are GRMZM2G462623 and GRMZM2G361659, two E2F/ DP transcription factors showing homology to DPa and DEL1, respectively [75, 76], GRMZM2G135978, a putative ortholog of TRANSPORT INHIBITOR RESPONSE 1 (TIR1) [59, 77], and GRMZM2G445905, a cellulose syn-thase showing homology to IRREGULAR XYLEM 5 (IRX5) [103].
In the intersection between LED5-eand LL, we found
genes related to entirely different processes than in the intersection between LER and LL, namely genes related to primary metabolism — amino acid synthesis and lipid metabolism— cell wall proteins, genes involved in cell vesicle transport, hormone signal transduction, subtilases, receptor kinases and stress-related genes. In addition, several transcription factors were identified that are commonly correlated with LL and LED5-e, belonging
to the bHLH, HSF, NAC, SBP, SET and Trihelix families. Some examples of genes in the intersection of LL and LED5-e (Table 4) are GRMZM2G074267, which shows
homology to the auxin efflux carriers or PINs [77, 104], GRMZM2G015295, a S-adenosyl-L-homocysteine hydro-lase showing homology to cytokinin binding protein HOG1 [105] and GRMZM2G702026, a homolog of AUXIN RESPONSE FACTOR 1(ARF1) [77].
LED5-e and the other timing traits were positively
correlated with “carbohydrate metabolism” (Fig. S6 in Additional file 1); accordingly, cluster 6 of the co-expression network, consisting predominantly of genes positively correlated with timing traits, was also enriched in this MapMan category (Fig. 4). The corresponding genes were mainly involved in starch biosynthesis. Avail-ability of starch in leaves is a major determinant of plant growth since it provides a supply of carbon during the night, when no photosynthesis takes place but growth is nevertheless continuing [106, 107]. Our data suggest that RILs that have the potential to maintain high growth rates for longer periods of time have a modified balance be-tween carbon supply and growth compared with other RILs. Tight regulation of starch biosynthesis is required to determine how much carbohydrate can be used during the day for growth and how much starch should be synthesized to provide the plant with carbon during the subsequent night [108]. The flux of carbon into starch is governed largely by regulation of the enzyme ADP-glucose pyrophosphorylase (AGPase). Transcript levels of one of the subunits of this enzyme [109, 110], GRMZM2G106213, showed a correlation in our dataset with the timing traits (Additional file 2), consistent with an increase in yield and biomass in several crops when altering AGPase activity [111–115]. Another example is a sucrose-phosphate synthase, GRMZM2G055331 (Additional file 2). Sucrose-phosphate synthase enzymes catalyze the rate limiting steps in the biosynthesis of sucrose and play an
important role in carbon partitioning in the regulation of starch production versus sugar accumulation in many de-velopmental processes [116]. In several species, increased or ectopic expression of sucrose-phosphate synthases resulted in an increase in plant size [117–119], while down-regulation resulted in a strong decrease in plant growth [120, 121].
Which cellular mechanism was affected in the mutant phenotype was not examined for the majority of the genes with a known role in leaf development, impeding further validation of a specific role of the (anti-)correlating genes in leaf growth rate or duration of leaf elongation. Our analysis, however, provides a potential framework to start deciphering the molecular networks underlying the trait LL and provides evidence that there are at least two mechanisms regulating leaf size.
Leaf as an organ contributing to biomass
The shoot parameters FW and DW showed a strong correlation on the phenotypic level — a PCC of 0.893 (Table 2)— and this was also reflected by the high frac-tion of genes that (anti-)correlated with both traits: approximately two-thirds of the genes were commonly (anti-)correlated (Fig. 5e, f ). In addition, seedling bio-mass showed a significant positive correlation with LER and Lwe, and to a lesser extent with LA, LL and DZ size, but not with Lwi, indicating that the majority of the final leaf size traits are important contributors to seedling biomass, next to leaf number and V-stage. The highest correlation was observed between seedling weight and LER and this was also observed in the PCA biplot (Fig. S4 in Additional file 1). This suggests that LER can be used as a proxy for seedling biomass. At the molecular level, 19 genes correlated with both LER and seedling bio-mass and 30 genes anti-correlated with both (Fig. 5e, f ). These genes are involved in a variety of processes, such as cell organization, protein degradation and post-translational modifications, transcriptional regulation (e.g., C2H2 zinc finger family protein, MYB domain
protein and methyl-binding domain protein) and sig-naling. However, the numbers were too small to iden-tify enriched processes.
Some genes in the intersections between LER and FW and/or DW have homologs in Arabidopsis for which perturbation mutants have phenotypes that hint at a role in shoot development (summarized in Table 6). For in-stance, GRMZM2G091715 encodes an acyl carrier pro-tein involved in de novo synthesis of fatty acids [122]; GRMZM2G092595 shows homology to FAB genes en-coding a phosphatidylinositol-3P 5-kinase important for endomembrane homeostasis [123]; ZmCCD8/MAX4 (GRMZM2G446858) is a strigolactone biosynthetic gene [124]; GRMZM2G149224 encodes a 3β-hydroxysteroid-dehydrogenase/decarboxylase required for plant sterol
Table 5 Examples of genes for which expression levels are (anti-)correlated with leaf length, LER or LED5-e
MapMan Gene Maize description
Arabidopsis orthologs
Arabidopsis symbol
Arabidopsis description LER LL LED5_e Arabidopsis
orthologs with phenotype Phenotype Reference Regulation of transcription GRMZM2G702026 Auxin response factor 1
AT1G59750a,b ARF1 Auxin response factor 1
−
− −− AT1G59750
a,b arf1 mutations enhance arf2
phenotype, i.e., delayed leaf senescence resulting in more and larger leaves
[77,154]
GRMZM2G361659 AT3G48160a DEL1, E2FE, E2L3
DP-E2F-like 1 −− −
− AT3G48160
a
Overexpression results in smaller leaves due to repression of cell proliferation
[76] AT3G01330b
AT5G14960b GRMZM2G462623 AT5G02470b
AT5G03415a DPA, DPB Transcription factor DP ++ ++ + AT5G02470 b
DPa acts together with E2F as stimulator of cell proliferation
[75] Hormone
metabolism
GRMZM2G135978 AT1G12820c AFB3, AFB2,
TIR1, AFB1, GRH1
Auxin signaling F-box 3, auxin signaling box 2, F-box/RNI-like superfamily protein, GRR1-like protein 1
++ + +
AT3G62980a,b,c Mutations in TIR1 that enhance the
degradation of auxin/IAA display more lateral roots, smaller rosettes and reduced number of axillary branches
[59,77] AT3G26810c AT3G62980a,b,c AT4G03190b,c GRMZM2G074267 Putative auxin efflux carrier
AT1G23080c PIN7, PIN3,
PIN1, PIN4, AGR, AGR1, EIR1, MM31, PIN2WAV6
Auxin efflux carrier family
protein −− −−
AT1G70940c T-DNA insertion line has serrated
leaves
[77,104] AT1G70940c AT1G73590a,b,c Mutants have fewer leaves with
distorted shape AT1G73590a,b,c
AT2G01420c AT5G57090c
Cell wall GRMZM2G445905 AT5G44030a CESA4, IRX5, NWS2
Cellulose synthase-like −− −
− AT5G44030
a
T-DNA insertion line grows slower, plants are darker green and leaves are more narrow [103] Unknown GRMZM2G015295 Adenosylhomo-cysteinase AT3G23810b,c SAHH2, EMB1395HOG1, MEE58, SAHH1, S-adenosyl-l-homocysteine (SAH) hydrolase 2, S-adenosyl-L-homocysteine hydrolase − − −− AT4G13940 a,b,c
Loss of function mutants show increased leaf size, higher seed yields and delayed flowering, while overexpression plants show opposite phenotypes
[105] AT4G13940a,b,c
Arabidopsis orthologs were determined using PLAZA3.0 web resource [147].a
Best hit family ortholog.b
Tree-based ortholog.c
Orthologous gene family. Double plus signs ("++") indicate transcript levels positively cor-related with phenotypic trait (q0.99). Single plus signs ("+") indicate transcript levels positively correlated with phenotypic trait (qrandom). Double minus signs ("−−") indicate transcript levels negatively correlated with phenotypic trait (q0.01). IAA indole-3-acetic acid
Baute et al. Genome Biology (2015) 16:168 Page 17 of 26
Hormone metabolism GRMZM2G446858 Carotenoid cleavage dioxygenase AT4G32810a,b,c CCD8, MAX4
Carotenoid cleavage dioxygenase 8 ++ ++ ++ AT4G32810a,b,c ZmCCD8/MAX4 is a stringolactone
biosynthetic gene of which the knockout mutant shows a branching phenotype, comparable to the Arabidopsis orthologous mutant, and in addition shorter stature and smaller ears
[124,155]
Protein degradation
GRMZM2G704093 AT5G46210a,b CUL4 Cullin4 −− − −− AT5G46210a,b CUL4 is part of an E3 ubiquitin
ligase complex. Loss of function mutants display reduced growth and aberrant leaf phenotypes
[127] At4G12100b AT3G46910b Lipid metabolism GRMZM2G149224 Sterol-4-alpha-carboxylate 3-dehydrogenase, decarboxylating AT1G47290b,c 3βHSD/D1, AT3βHSD/ D1, 3βHSD/ D2, AT3βHSD/ D2 3β-Hydroxysteroid-dehydrogenase/ decarboxylase
−− −− −− AT1G47290b,c Overexpression of this 3
β-hydroxysteroid dehydrogenase/de-carboxylase required for plant sterol activation results in growth defects, such as shorter internodes
[125] AT2G26260a,b,c GRMZM2G091715 Acyl carrier protein AT4G25050c ACP4, ACP1, ACP2, ACP3, ACP5
Acyl carrier protein ++ ++ ++ AT4G25050c Reduced ACP4 levels result in a decreased lipid content and varying degrees of a bleached phenotype, smaller size and shorter bolts
[122] AT3G05020a
AT1G54580c AT1G54630c AT3G17790c
Signaling GRMZM2G094951 AT2G37290c Ypt/Rab-GAP domain of gyp1p
superfamily protein −− −− −− AT2G37290
c
T-DNA line shows pale green leaves [77] AT2G39280c
AT3G55020a,b,c GRMZM2G092595 AT1G71010a,b,c FAB1C,
FAB1B, FAB1A
FORMS APLOID AND BINUCLEATE CELLS 1C, phosphatidylinositol-4-phosphate 5-kinase family protein, 1-phosphatidylinositol-4-phosphate 5-kinases, zinc ion binding, 1-phosphatidylinositol-3-phosphate 5-kinases
++ ++ + AT3G14270c Loss of function and gain of function mutants display pleiotropic phenotypes primarily related to auxin signaling, including dwarfism and root growth inhibition
[123] AT4G33240c
AT3G14270c AT4G33240c AT1G34260c
Development GRMZM2G170567 AT5G18410a,b KLK, PIR, PIR121, PIRP, SRA1
Transcription activators −− − −− AT5G18410a,b Downregulation results in larger rosettes that are epinastic and paler
[126] Biology (2015) 16:168 Page 18 of 26
Table 6 Examples of genes for which expression levels are (anti-)correlated with fresh/dry weight and LER (Continued)
green, next to additional developmental phenotypes RNA
processing
GRMZM2G346639 AT5G53770a,b,c Nucleotidyl-transferase family
protein −− −− −− AT5G53770
a,b,c
T-DNA line shows smaller, more compact rosette with more roundish leaves
[77] Unknown GRMZM2G406043 AT3G04490a,c −− −− −− AT3G04490a,c Smaller rosette size due to smaller
leaves in T-DNA line
[77]
Arabidopsis orthologs determined using PLAZA3.0 web resource [147].a
Best hit family ortholog;b
Tree-based ortholog;c
Orthologous gene family. Double plus signs ("++") indicate transcript levels positively correlated with phenotypic trait (q0.99). Single plus signs ("+") indicate transcript levels positively correlated with phenotypic trait (qrandom). Double minus signs ("−−") indicate transcript levels negatively correlated with phenotypic trait (q0.01). Single minus signs ("−") indicate transcript levels negatively correlated with phenotypic trait (qrandom)
Baute et al. Genome Biology (2015) 16:168 Page 19 of 26
activation [125]; GRMZM2G170567 is a transcriptional activator [126]; GRMZM2G704093 is a homolog of Arabi-dopsisCUL4, part of an E3 ubiquitin ligase complex [127]. Also, for Arabidopsis homologs of GRMZM2G406043, GRMZM2G346639 and GRMZM2G094951 (At3g04490, At5g53770 and At2g37290, respectively) a leaf or whole rosette phenotype was recently described in the corre-sponding T-DNA insertion mutants [77].
The positive correlations between final leaf size traits and seedling biomass indicated that these traits are important contributors to seedling biomass. Since LER showed the highest correlation with FW and DW, LER measurements that take place early in development might allow to identify subsets of plants in populations with high or low biomass. The identification of a num-ber of genes in the intersection of LER and FW/DW for which a link with growth and development is shown further supports this hypothesis.
Conclusions
In this study, we could successfully correlate variation in transcript levels in growing leaf tissue with variation for traits measured at later stages of development. This implies that dividing cells of a growing leaf already con-tain the molecular information underpinning the final phenotypes. Furthermore, we illustrate that breaking down complex traits such as leaf and seedling biomass into their components aids in determination of the most important contributors and their mutual associ-ation and facilitates the dissection of regulatory interac-tions. The relevance of our approach is also reflected by the presence of genes for which Arabidopsis homo-logs have a known function in leaf development or genetic perturbations display anticipated variation in leaf size in our gene sets correlating with the final leaf and shoot traits. Next to these known genes involved in leaf development, a large set of novel genes were also identified. In future studies, integration of phenotyping and transcriptomics data of additional mapping popula-tions— since the mapping population used determines to a large extent the genetic variation that can be captured — and the combination with other forward genetic approaches, such as QTL and expression QTL analysis, will allow for selection of putative regulators of leaf growth that can be used for further analysis in genetic modification approaches or as biomarkers for leaf size traits.
Materials and methods Genetic material
The RIL population used in this study is derived from a cross between parental lines B73 and H99, followed by 12 generations of self-pollination. In total, 142 RILs were generated and 223 markers were used for mapping these
RILs [40]. A randomly chosen subset of 103 RILs was analyzed in this study.
Growth conditions, measured traits and sampling
All traits were measured in a series of experiments in a single growth chamber. RILs were grown in a random-ized design each time along with their respective par-ents. Experiments were conducted under controlled growth chamber conditions (24 °C, 55 % relative hu-midity, light intensity of 170 mmol m−2 s−1 photosyn-thetic active radiation, in a 16 h/8 h day–night cycle). Since the focus of our research was on leaf develop-ment, primarily leaf size traits were determined. The traits measured for leaf 4 were: final leaf 4 area (LA), final leaf 4 width (Lwi), final leaf 4 weight (Lwe), final leaf 4 blade weight, final leaf 4 length (LL), leaf 4 elong-ation rate (LER), DZ size of leaf 4 at steady state growth, time point of leaf 4 emergence, time point of maximal LER (Tm), time point when leaf 4 reaches its
final length (Te) and leaf elongation duration (LED5-e).
Since results for Lwe and leaf 4 blade weight were highly correlated, only results for Lwe are shown. LER and DZ size were determined as described previously by Rymen et al. [41]. Briefly, LER was determined by measuring the leaf length, using the soil level as a refer-ence point, on a daily basis from the time of emergrefer-ence of leaf 4 until the leaf was fully grown and calculating the average growth rate during the steady state growth phase. DZ size was estimated as the distance between the base of the leaf and the most distal mitotic cell in the epidermis that could be visualized after staining with 4′,6-diamidino-2-phenyindole (DAPI). Tm, Teand LED5-e
were determined as described before [42]. Additionally, at a fixed time point after sowing (after 27 days), fresh weight, dry weight, V-stage and total number of leaves of the whole seedling were determined. V-stage and total number of leaves were not determined for all RILs, but for a selection of 42. All traits were determined for six plants per RIL, except for DZ size (three plants per RIL) and time point of leaf 4 emergence (19 plants per RIL). Simultan-eously with phenotyping, plants were sampled for RNA sequencing. Since we preferred to grow plants for pheno-typic analysis, including determination of DZ size, and RNA sequencing simultaneously, it was not feasible to sample the total DZ. Therefore, we sampled the first 0.5 cm of the most basal part of leaf 4 three days after appear-ance, always at the same time of the day to minimize diur-nal effects. This zone of the leaf is at that stage fully proliferative for all RILs we examined. For each parent we had three biological and three technical replicates, each pool consisting of proliferative tissue of four plants. For the RILs, one biological replicate, consisting of prolifera-tive tissue of four plants, was sampled for RNA sequen-cing. Total RNA was extracted using Trizol (Invitrogen)