CLUSTERING METHODS FOR MODE S STATIONS: EVALUATION
AND PERSPECTIVES
Massimiliano Caramia1 , Emilio G. Piracci1, Stefano Gelli2, Gaspare Galati1 1: University of “Tor Vergata”, Roma, Italy
{caramia, piracci, galati}@disp.uniroma2.it 2: Selex S.I. S.p.A. - [email protected]
Abstract
Grouping of a set of Secondary Surveillance Radar (SSR) Mode S stations into functional entities called
clusters has significant operational facets; it calls for a constrained optimization, an important significant
constraint being the scarcity of Interrogation Identifier (II) codes. This clustering problem can be approached by two ways, i.e., integer programming methods and heuristic approaches. The definition of a general, usable decision support tool to build up and evaluate clustering strategies in any operational airspace, e.g. the one of a nation or, even more complicated, of a system such as the European one, is a very challenging task. This paper describes some steps toward this envisaged result proposing a mathematical formulation and a heuristic approach for the problem.
Keywords: Surveillance, Mode S, Sensors networks, Clustering, Optimization on graph.
1. The Operational Problem
ATM capacity improvement by enhancing the cooperating surveillance with networks of Mode S systems is one of the objectives of the "Mode S & ACAS programme" in the context of the EUROCONTROL 2000+ strategy. This programme involves the participation of ECAC (European Civil Aviation Conference) member states to optimize their airspace traffic management.
It is well known (see, e.g., [Stevens, 1998, ICAO, 2002]) that SSR Mode S operation is based upon addressed interrogations/replies between ground stations and cooperating aircraft. This selective interrogation mode, as compared with the older, unaddressed Mode A/C, reduces the rate of replies (i.e. the pollution in the downlink channel) and their overlapping (garble) by scheduling the transactions (interrogation/reply pairs) with the aircraft under surveillance. For an aircraft still to be acquired by the surveillance system (typically, at the borders of the coverage) all-call unaddressed interrogations are needed. In its addressed, or roll-call, mode, the Mode S ground station transmits a selective interrogation including the unique 24 bit aircraft identifier
and the 4-bit Interrogator Identifier (II) field. In the world’s areas with high traffic density, such as the European Core Area, there are many Mode S ground stations with a fairly large overlapping of electromagnetic coverage, i.e. a single aircraft can be surveyed by, and exchange data with, as many as ten, fifteen, or more ground stations at the same time, depending on its particular position and height.
The effective use of the Mode S transmission channel (up-down link) is obtained, inter alia, by a locking mechanism. This means that each aircraft can be locked to a ground station, with a given II code known to its transponder, in order to avoid unnecessary replies to the all-call interrogations from that station. The aircraft, however, will reply to the all-call interrogations from other stations with different II codes.
Figure 1 shows the evolution of an aircraft flying through an airspace controlled by two Mode S stations with partly-overlapping coverage. After take off the aircraft is in the surveillance airspace of ground station 1 (GS1) from point 1 until point 2. From point 2 the aircraft goes into the surveillance airspace in which there is overlapping coverage between GS1 and a second ground station (GS2). As the aircraft is locked (more exactly, is in the “lock-out” condition) to GS1, GS2 can acquire and survey the aircraft only if its II is different from the II used by GS1. Conversely, when GS1 and GS2 are clustered, i.e. have the same II code, the pertaining all call interrogations are avoided as the aircraft surveillance data are shared between GS1 and GS2.
Figure 1. Overlapping coverage of Mode S ground stations
Unfortunately there are only 16 possible different II's (13 discarding the reserved II = 0, the one reserved for military operation and the other one reserved for test equipment), thereby a code allocation problem arises. In fact, in order to allow effective operation of Mode S ground sensors with overlapping coverage areas, a different II is needed for each station.
Within the European airspace, the allocation process is necessarily coordinated, first to respect the number of the II available for each member state and, second, to solve potential problems at the member state boundaries. This situation is managed by clustering two or more Mode S ground stations.
From the airborne point of view, each cluster is seen as a single surveillance entity, with shared information (aircraft tracks) between ground stations belonging to a cluster; the clustered ground stations are interfaced as a single entity with a single II code, similar to a virtual single Mode S station with a (possibly) very wide coverage. In the European airspace, when the available II code number is insufficient, EUROCONTROL [EUROCONTROL, 2005] proposes interrogator coverage optimization. The creation of suitable clusters is an element of this optimization.
In this paper, the Italian scenario is considered, where some high level airspace portions are under the surveillance of more than 10 Mode S stations. In such an airspace, without clustering, there would need to be more than 10 different II codes. This is of the same order of magnitude as the total number of II codes that can be reasonably allocated to a nation such as Italy. Therefore, the number of available II codes is a main constraint.
Our approach to clustering optimization permits to avoid significant reductions of the radars coverage in dense airspaces with scarcity of the II codes.
For a given number N of Mode S stations the decision of how to aggregate them, that is from a single cluster with N stations to the limit case of N independent stations (i.e. no clustering at all), is driven by many factors, the most important being the following:
(+) Minimization of the number of II codes used
(+) Minimization of All Call replies (with less electromagnetic pollution of the Mode S channel)
(-) Cost of the instability problems of the cluster in the case of failure of a station (-) Cost of the data transmission between the ground stations within a cluster.
In the above list, (+) indicates a factor driving to extend clustering, (-) indicates a factor to limit clustering, and the term “cost” has a wide meaning of reliability/availability/life cycle costs. Therefore, from an operational point of view there is a need to try to put Mode S stations whose coverages overlap in the same cluster, in particular when the overlapped area contains much traffic. Therefore, the input to a clustering strategy, is (a) the set of Mode S stations, each one with its coverage area at a given altitude (e.g. FL 400), and (b) the network of airways with the related traffic density. The model as described in the following section builds up a graph from the network of stations and defines as “adjacent” a pair of stations with some overlap in coverage. In the heuristic approach, treated in the section after the next, the airways structure is taken into account in a coverage-airways graph.
The solution to the scarcity of II codes was planned to be the use of Surveillance Identifier codes (SI). These 63 additional codes have the same functional capability of surveillance as the II codes, but this functionality limits the range of air-ground protocols that can be supported by a ground interrogator. In addition, the SI codes cannot be used in an airspace until almost all of the transponders are equipped to recognize and process them (the initial implementation of Mode S transponders did not consider SI codes). In order to use SI codes in core Europe (principally in the UK, Germany and France) mandates have been established that, among other requirements, requires the carriage of Mode S transponders with SI code capability; however an efficient allocation using only II codes would be desirable if it could be achieved rapidly.
2. The Mathematical Model Description
The starting point of the model is the definition of a graph G(V,E), where V represents the set of the Mode S stations, i.e. the nodes, and E is the set of edges. An edge exists if two stations are adjacent. Upon this graph, the solution is characterized by a set of complete node induced sub-graphs, i.e., cliques. Each sub-graph represents a cluster and it is a clique of nodes.
In order to model such a clustering problem, we need the following binary variables 1 if stations and are in the same cluster
0 otherwise ij
i j
y = ⎨⎧ ⎩
Besides, we define parameters aij and sij as the density of common airways between a pair of stations and the degree of overlapping in their coverage, respectively. Moreover, let δa be a threshold on the common number of airways and let δs be a limit on the coverage overlapping area between radar stations i and j.
We have the following constraints (M is a large number):
(1 ) ( ), : (1 ) ( ), : a ij ij s ij ij M y a i, j V i j M y s i, j V i j δ δ − ≥ − ∀ ∈ ≠ − ≥ − ∀ ∈ ≠
If the right hand side of the first constraint is positive, i.e., the density of common airways between stations i and j is lower than the threshold, then the left hand side must be equal to M, and therefore yij is forced to be zero, i.e., i and j cannot be in the same cluster. A similar consideration can be done for the second constraint.
The following constraint imposes that if stations i and j are in the same cluster and, at the same time, stations j and p stay in the same cluster, then, stations i and p are forced to stay in the same cluster too, i.e.,
1 , , ,
ij jp ip
y +y ≤ +y ∀i j p V∈
The last constraint limits the number of stations in a cluster, i.e., a cluster cannot contain more than δr stations.
: 1, r ij j V i j y δ i V ∈ ≠ ≤ − ∀ ∈
∑
Simultaneously to the definition of clusters, we have to consider the problem of the II code allocation. The II code allocation problem can be interpreted as a graph coloring problem (see, e.g., [Diestel, 2005]). A graph coloring is a function c that assigns a label (color) to each node in a graph such that no two adjacent nodes receive the same color; c(i) is called the color of node i. The graph coloring problem asks for a coloring of a graph that minimises the number of different labels used. In the II code allocation problem a color is a code and we want to assign a color to each node (station) such that each node in the same cluster has the same color (II code) and two clusters that share at least one edge are assigned different colors (II codes). Furthermore, the number of II codes used should be the minimum possible.
1 if color is assigned to node 0 otherwise hi h i x = ⎨⎧ ⎩
Let C be an upper bound on the number of colors (II codes) available, and assume that colors are number from 1 to |C|. First of all, we have to consider that it is not possible to assign more than one color to a node, i.e., to a station. So we have:
V i x C h hi = ∀ ∈
∑
∈ , 1Then we have to impose that two stations belonging to the same cluster should be colored with the same color.
V j i C h x x y V j i C h x x y hi hj ij hj hi ij ∈ ∀ ∈ ∀ − ≥ − ∈ ∀ ∈ ∀ − ≥ − , , , 1 , , , 1
Finally, we have to consider that two adjacent clusters cannot be colored with the same color; hence, we have: E j i C h x x yij ≥ hi + hj ∀ ∈ ∀ ∈ + , , (, ) 1
As aforementioned, the objective function is the minimization of the number of colors (II codes) used. To this aim we introduce an integer variable K such that
V i hx K C h hi ∀ ∈ ≥
∑
∈ ,In this way, K is greater than or equal to the highest color used. At this point it is enough to minimise K. Therefore, the whole integer program is:
: min subject to (1 ) ( ), : (1 ) ( ), : 1 , , , 1, 1, 1 , , , 1 , a ij ij s ij ij ij jp ip r ij j V i j hi h C ij hi hj ij hj hi K M y a i, j V i j M y s i, j V i j y y y i j p V y i V x i V y x x h C i j V y x x h δ δ δ ∈ ≠ ∈ − ≥ − ∀ ∈ ≠ − ≥ − ∀ ∈ ≠ + ≤ + ∀ ∈ ≤ − ∀ ∈ = ∀ ∈ − ≥ − ∀ ∈ ∀ ∈ − ≥ − ∀
∑
∑
{ }
{ }
, , 1 , , ( , ) , 0,1 , , 0,1 . ( , ) ij hi hj hi h C hi ij C i j V y x x h C i j E K hx i V x h C i V y i j E ∈ ∈ ∀ ∈ + ≥ + ∀ ∈ ∀ ∈ ≥ ∀ ∈ ∈ ∀ ∈ ∀ ∈ ∈ ∀ ∈∑
3. The Heuristic Approach
Since the II code allocation problem and the graph coloring problem in the general case belong to the set of NP-Hard problems, we focus our attention also on developing a heuristic for large size instances of the problem. The latter is based on a two-step process. In the first step, the algorithm solves a clustering problem and, in the second step, the coloring problem.
In the first step the objective is to form groups of Mode S stations that can use the same II code in the second step. Geographic adjacency among stations and the airways visibility are the principles on which the first step is defined.
The algorithm starts with the definition of a graph G(V,E), where E represents the set of the edges, defined by the set of the main airways on the studied area. Every edge e∈E is characterized by a weight that represents air traffic. Every edge is covered by the visibility of a certain number of stations.
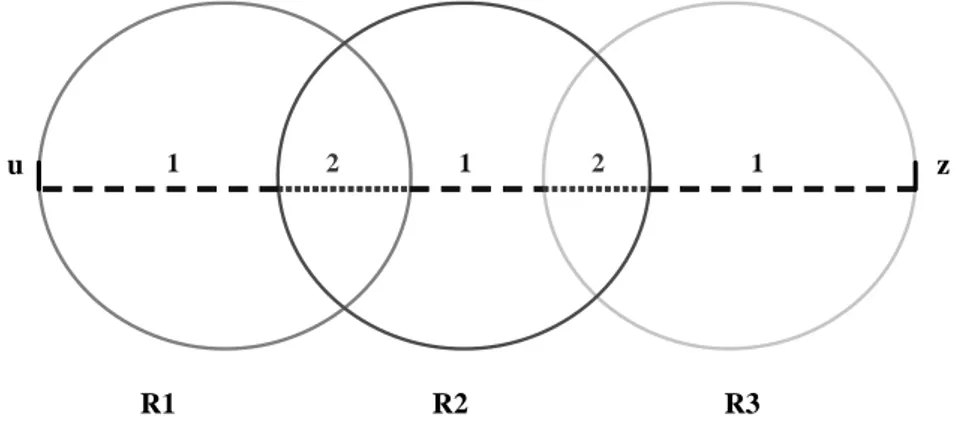
The set of nodes V is defined both by the airways intersection and by the coverage areas of the radar stations. As we can see in Figure 2, there is an edge (u,z) surveyed by R1, R2 and R3 stations. Hence, it can be necessary to define other nodes where there is an intersection in Mode S coverage areas, as shown in Figure 3.
After the definition of the graph, the algorithm calculates the number of airways covered by two Mode S stations and chooses pairs of stations that have the maximum shared area. It is necessary to define a binary matrix, called stations-airways matrix. Each airway segment so identified is represented by a row in the matrix. On the other hand, columns represent radar stations considered in the analysis. The generic element of the binary matrix, SA(i,j), is equal to 1 if airway segment i is covered by the radar station in the j-th column, and it is 0 otherwise.
Figure 2: Stations visibilities on airway u-z
1 2 1 2 1 z u R3 R2 R1
Figure 3: Definition of nodes v, w, x, y as airway-coverage intersection
Therefore, each cluster is created by grouping columns of the SA-matrix. In particular, the algorithm calculates a sort of correlation index. We can define three criteria by means of which clusters are generated:
• Average-OR criterion, that does not consider weights associated with airway segments. • Average-sum criterion, that clusters radar stations covering the same airways.
• Mixed-criterion, that uses both the previous criteria: first it applies the average-OR criterion and then it performs updating by means of the average-sum policy.
Once one of these criteria has been selected, the SA-matrix undergoes to an updating process. The latter process consists in replacing the columns representing stations that form a cluster by a new column that represents the created cluster. Rows still represent airway segments. At this point we execute the second step, i.e., we color the graph G, imposing that nodes belonging to the same cluster must receive the same color. In other words, nodes in different clusters are colored respecting the classical coloring formulation (if they are adjacent they must be colored differently); if the nodes belong to the same cluster, then they must be assigned the same color independently of whether they are adjacent or not. To color the graph we used the algorithm in [Caramia and Dell’Olmo, 2001].
4. Experimental Analysis
In the previous sections, we introduced both an integer linear program and a heuristic approach to solve the II code allocation problem. Here we present results obtained by these approaches. A first test was conducted on a case study concerning the Italian area, where we considered the Italian Mode S radar network and airways scenario. Even though Italy extends its geographic limits in a small area, 24 Mode S stations are present. Figure 4 shows the stations’ location over the Italian territory, while their corresponding labels are reported in Table 1. Many of these 24 Mode S radars are adjacent, and Figure 5 shows the overlapping coverage at FL300. All these sensors should be colored with at most eight colors. Figure 6 shows the airways scenario taken into account for the tests.
1 2 1 2 1 w x y z u v R3 R2 R1
Figure 4: Italian SSR stations location 1 Pantelleria 7 Bari 13 Cima Canestreddu 19 Monte Lesima 2 Catania 8 Colle Marmo 14 Poggio Lecceta 20 Bergamo 3 Ustica 9 Fiumicino 15 Firenze 21 Peschiera 4 Crotone 10 Maccarese 16 Ravenna 22 Lambro 5 Monte Stella 11 Monte Codi 17
Ronchi dei Legionari
23 Milano 6 Masseria Orimini 12 Olbia 18 Venezia 24 Torino Table 1: Italian SSR stations labels
Figure 5: Coverage overlapping at FL300
In order to test the integer linear model described in the previous section, we use the AMPL language and the CPLEX solver [ILOG, 2002]. We considered all the 24 Italian stations, and data about radar coverage areas refers to a selected altitude of FL400. At this altitude, many stations are adjacent.
For the simulations, we choose a minimum overlapping coverage area threshold among radar stations equal to 30%. The common airways density threshold has been varied to capture the algorithm behavior. The results we obtain show that, as long as the number of airways threshold is equal to small values, all the stations considered are clustered all together. Only when this value tends to grow, some of the stations remain as standalone stations. We can see simulation results in Table 2 and Table 3.
1. Bari, Colle Marmo, Crotone, Masseria Orimiri, Monte Stella 2. Bergamo, Firenze, Lambro, Milano, Torino, Venezia
3. Catania, Pantelleria, Ustica
4. Cima Canistreddu, Fiumicino, Maccarese, Olbia, Poggio Lecceta 5. Monte Codi
6. Monte Lesima, Peschiera, Ravenna, Ronchi dei Legionari
Table 2: The integer model solution with a 30% threshold of overlapping area , and an airways overlapping threshold equal to 10
1. Bari, Colle Marmo, Masseria Orimiri, Monte Stella
2. Bergamo, Firenze, Lambro, Milano, Monte Lesima, Torino 3. Catania, Monte Codi, Ustica
4. Cima Canistreddu, Fiumicino, Maccarese, Olbia, Poggio Lecceta 5. Pantelleria
6. Peschiera, Ravenna 7. Ronchi dei Legionari 8. Venezia
9. Crotone
Table 3: The integer model solution with overlapping area threshold equal to 30 % and an airways overlapping threshold greater than 30
Another test was devoted to the heuristic algorithm that has been implemented in the Visual Basic language. The test involves 14 Mode S stations. We considered data about radar coverage areas at a selected altitude of FL500, and the following Mode S stations: Bergamo, Colle Marmo, Firenze, Fiumicino, Lambro, Milano, Monte Lesima, Olbia, Peschiera, Poggio Lecceta, Ravenna, Ronchi, Torino, and Venezia. The results obtained using the three criteria in every case lead to three-cluster solutions, each with different allocations of the Mode S stations, as shown in Table 4.
Average-OR Average-sum Mixed
Cluster 1 Colle marmo, Fiumicino, Lambro, Peschiera and Ronchi dei Legionari
Milano, Olbia, Torino and Venezia
Firenze, Poggio Lecceta, Colle Marmo, Monte Lesima, Fiumicino and Ravenna
Cluster 2 Bergamo, Milano, Monte Lesima, Ravenna and Torino
Colle Marmo, Firenze, Fiumicino, Monte Lesima, Poggio Lecceta and Ravenna
Lambro, Peschiera, Bergamo, Venezia, Milano and Torino
Cluster 3 Firenze, Olbia, Poggio Lecceta and Venezia
Bergamo, Lambro Peschiera and Ronchi dei legionari
Olbia and Ronchi dei Legionari
Table 4: Cluster generated by the heuristic approach
A final test was performed to evaluate the integer linear model with large input synthetic data. We generated a scenario with 100 Mode S stations with uniform probability distribution on an area of 50° latitude and 50° longitude, using the radar coverage of Fiumicino ground station as the standard coverage of each station. The scenario was completed with 300 airways segments with uniform probability distribution.
Table 5 shows the test results. The minimum overlapping coverage area threshold between radar stations was chosen equal to 30%. Varying the common airways density threshold, we test the integer linear model setting the maximum color number equal to 8 and to 10. The results show that for a large common airways threshold no solution is obtained, as it can be expected considering the low number of colors (8 or 10) compared with the large (100) ground station number. Edges Maximum number of available colors Common airways threshold Number of generated clusters Average number of radar stations in a cluster 100 8 10 21 4.8 100 8 20 No solution No solution 100 10 10 21 4 100 10 20 19 3.68 100 10 30 No solution No solution
We conclude this experimental section, noting that there are some key indicators that can help a decision maker to choose one of the solutions presented here.
In particular, we could consider mainly three factors: 1. The number of colors that each solution uses;
2. All Call Cost: this factor is strictly related to Mode S radar. In fact, acquisition of Mode S transponders is based on All Call interrogation/replies. The higher the number of radar stations in a cluster, the lower the All Call interrogation/replies that are necessary to acquire an aircraft.
3. Stability Cost: stability cost is properly related to cluster cardinality. Therefore, the higher the cluster cardinality the higher the stability cost.
5. Conclusions and future work
In this paper, we presented two approaches to solve the clustering problem for Mode S stations. Experimental results have been shown for the case of the Italian network Mode S stations.
We believe that effective clustering solutions cannot be obtained without the contribution of human experts: therefore we consider the presented clustering methods are a first approach to the design of a building block of a decision support system for Air Navigation Services Providers. As a matter of fact, ANSPs have a strong commitment to optimize the operation of their Mode S network by defining clusters suited to their own particular airspace respecting the international agreements and rules for the Interrogation Identifier codes allocation and the interface requirements with nearby foreign systems. The tool they will likely need is a Multi-Criteria Decision Support System [Roy, 1996] of which clustering methods are a part. This trend can be the subject of future research, as well as the extension of the clustering strategies to the incoming networks for ADS (Automatic Dependent Surveillance) stations.
Acknowledgement
The authors wish to thank SELEX-S.I. SpA Roma Italy, and CRR (Centro Ricerche Radar) for supplying the relevant operational information and, more important, for the development of the heuristic model. Moreover the authors wish to thank the anonymous referees for their helpful contribution.
References
Stevens, M.C. (1988), “Secondary Surveillance Radar”, Artech House London.
ICAO, “Annex 10 to the Convention on International Civil Aviation, Volume IV”, July 2002. “Mode S Interrogator Codes Allocation Process”, EUROCONTROL 2005.
Diestel, R. (2005), “Graph Theory”, Springer-Verlag, Heidelberg, Third Edition.
Caramia, M., and Dell’Olmo, P. (2001), “Iterative coloring extension of a maximum clique”, Naval Research Logistics, 48, pp. 501-535.
“ILOG AMPL CPLEX System version 8.0 user’s guide”, ILOG, France September 2002. Roy, B. (1996), “Multicriteria methodology for decision analysis “, Kluwer Academic.
List of acronyms
SSR Secondary Surveillance Radar II Interrogator Identifier
ATM Air Traffic Management
ACAS Airborne Collision Avoidance System ECAC European Civil Aviation Conference ICAO International Civil Aviation Organization FL Flight Level
SI Surveillance Identifier
ANSP Air Navigation Services Providers ADS Automatic Dependent Surveillance
Biographies
Massimiliano Caramia: He is a Professor of Operations Research at the University of Rome “Tor Vergata”. He received his Ph.D. degree in Operations Research from the University of Rome “La Sapienza”. His main research interests are scheduling, graph theory, optimization, logistics, transportation and production systems.
Emilio G. Piracci: He received his telecommunication engineering M.S. degree in 2005 from
the University of Rome “Tor vergata”, actually is PhD student at the same University, his main research interests are in Radar techniques and Radar signal processing.
Stefano Gelli: He received his telecommunication engineering M.S. degree from the University
of Rome “La Sapienza”. Actually he is with the company Selex S.I., where he is involved in radar systems analysis and design
Gaspare Galati: He is full professor of Radar Theory and Techniques at the Tor Vergata
University of Rome.He received the Dr. Ing. degree (Laurea) in 1970 at the University of Rome “La Sapienza”. His main interests are in Radar theory and techniques, Detection and estimation, Navigation and Air Traffic Management. He is author/co-author of over 200 papers, 13 patents and two international books on these topics.