TECHNOLOGY FORECASTING,
INNOVATION AND FIRM PERFORMANCE
IN NEW MATERIALS INDUSTRIES
Tutor:
Tesi di dottorato di:
Chiar.mo Prof. Marco Cucculelli
Dott. Raoul Cafrullo
Coordinatore del Dottorato di Ricerca:
Chiar.mo Prof. Enrico Cori
UNIVERSITÀ POLITECNICA DELLE MARCHE
FACOLTÀ DI ECONOMIA “GIORGIO FUÀ”
_______________________________________________________________
Dottorato di Ricerca in Management and Law Curriculum Economia Aziendale
- TABLE OF CONTENTS -
Acknowledgements 1
CHAPTER ONE
INNOVATION AND TECHNOLOGY FORECAST
1.1 The importance of innovation technology 5
1.2 The impact of technology innovation on society 7
1.3 Sources of innovation 9
1.3.1 The role of creativity 10
1.3.2 Actors of innovation 14
1.3.3 Collaborative networks 20
1.3.4 Technological spillovers 25
1.4 Types of innovation 26
1.4.1 Product innovation or process innovation 27
1.4.2 Radical innovation or incremental innovation 28
1.4.3 Architectural innovation or component innovation 30
1.5 Patterns of performance and technology innovation 33
1.5.1 Patterns S-curves in Technological development 35
1.5.2 Patterns S-curves in Technology expansion 38
1.5.3 Patterns S-curves as a predicting tool 40
1.5.4 Cyclical changes 42
1.6 Timing of adoption 46
1.6.1 First-mover advantages 48
1.6.2 First-mover disadvantages 50
1.6.3 Remarks on timing of entry 53
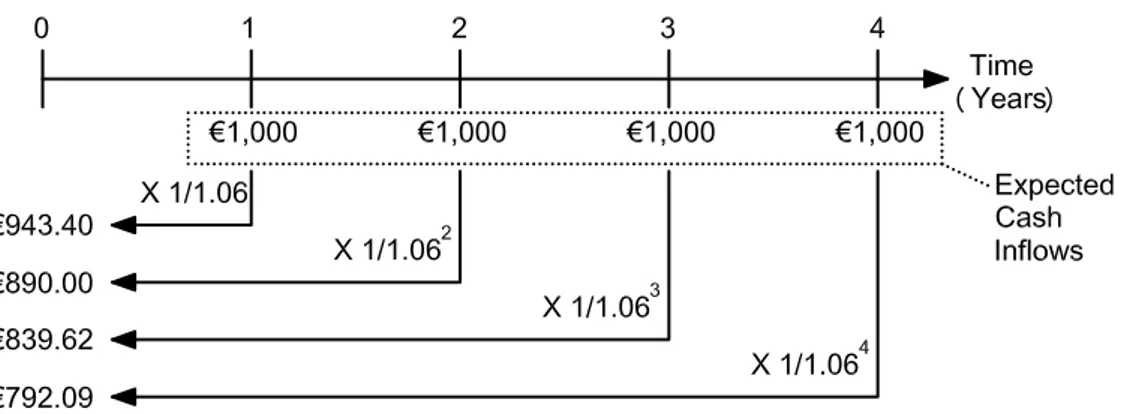
1.7 Evaluating innovation projects 59
1.7.2 Qualitative methods 69
1.8 Technological innovation in material science 75
1.8.1 Classification of materials 77
1.8.2 Technology forecast 87
1.8.3 Patent analysis in forecasting new materials 90
CHAPTER TWO
PATENT ANALYSIS IN FORECASTING NEW MATERIALS SUCCESS
2.1 Introduction 95
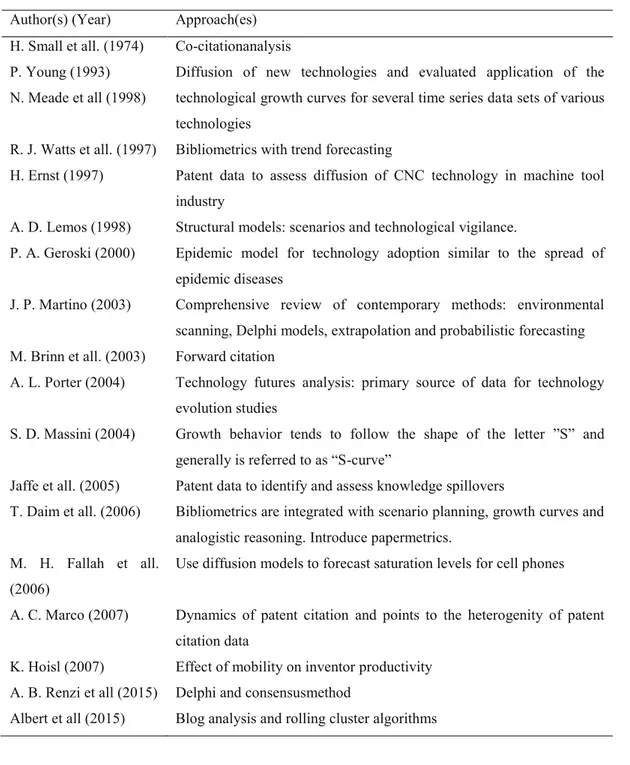
2.2 Literature review 96
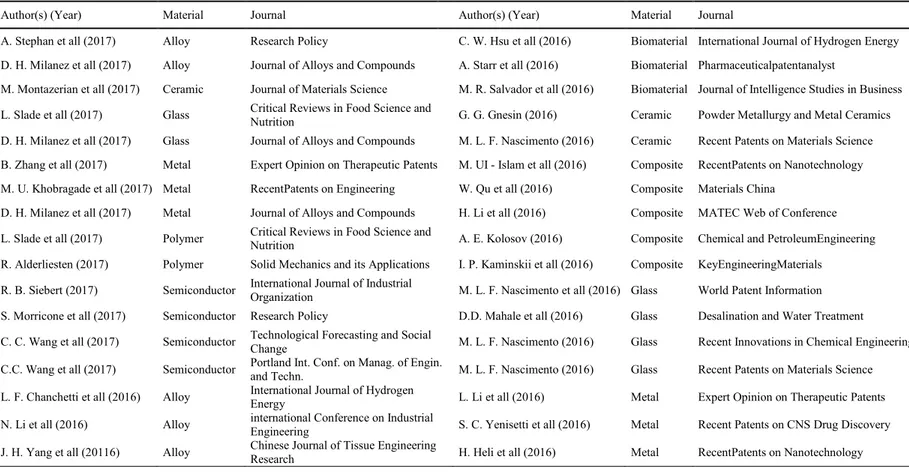
2.3 Sample 101
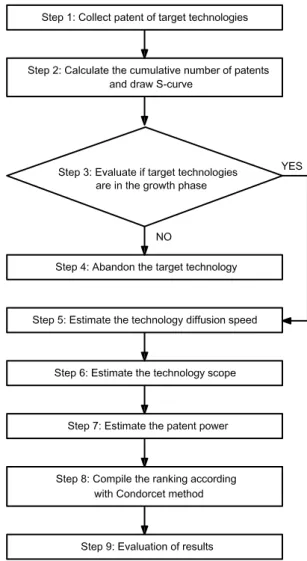
2.4 Proposed method 104
2.5 Variable definitions 106
2.5.1 Technology life cycle 107
2.5.2 Technology diffusion speed 109
2.5.3 Technology scope 110
2.6 Analysis 112
2.7 Discussion 127
CHAPTER THREE
MULTITECHNOLOGY FIRMS, AGE AND PERFORMACE IN NEW MATERIALS SECTORS
3.1 Introduction 131
3.2 Sample 134
3.4 Analytic strategy 140
3.5 Results 142
3.6 Discussion 146
CHAPTER FOUR
APPROACHING NEW MARKET NICHES: MULTI-TECHNOLOGY CAPABILITIES AND THE INFLUENCE ON INNOVATIVE OUTPUT
4.1 Introduction 149 4.2 Theory 151 4.3 Sample 155 4.4 Variable definitions 158 4.5 Results 162 4.6 Discussion 167 Conclusions 171 Bibliography 177
Acknowledgements
Innovation is an intriguing process, a force that is able to exercise aesthetic and pragmatic appeal that triggers the creative spirit and opens the mind to opportunities unknown until a new idea become reality, boosting economic growth and making it a protagonist of progress in key areas for human development.
Innovation offers companies, which represent the primary engine of economic progress, extraordinary opportunities, and poses serious challenges. Improvements, in addition to being a powerful means of competitive differentiation, enable firms to approach new markets and reach higher profit and is also a competitive race that requires rapidity, skill and precision. Being innovative is not enough; to be successful companies have to be able to innovate better than the competitors. In many economic fields, technological innovation has become the determining factor in competitive success: for most companies, innovation is now a key strategic imperative to maintain and acquire leadership positions in the market as well as recovering competitive disadvantages. In this work, the process of innovation is considered as a strategic process.
In the first part we analyze how creativity converts into innovative products, made by the individual elements of the innovation system, such as companies, as well as through links between the actors involved, such as business and customer relations.
Then are described some commonly accepted criteria used to distinguish the technological innovation forms and later the S-curve patterns that occur very often when observing the trend of technological performance and the process of disseminating technology in the market. Afterword the advantages and disadvantages of the first mover are described and, at a later stage, the factors influencing the time of entry and its reflections on the company’s strategy are more closely observed. Work continues with the presentation of key evaluation and selection methods for innovation projects, ranging from strictly quantitative to qualitative and mixed methods approaches.
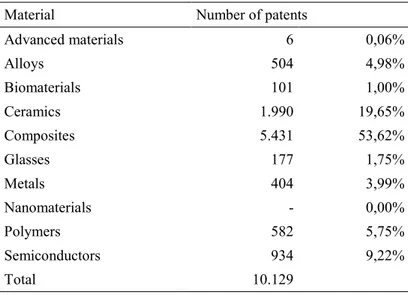
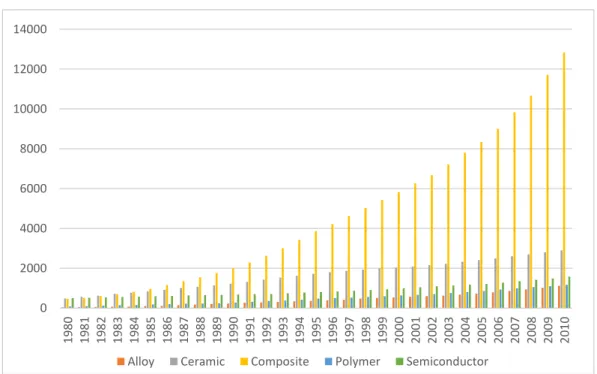
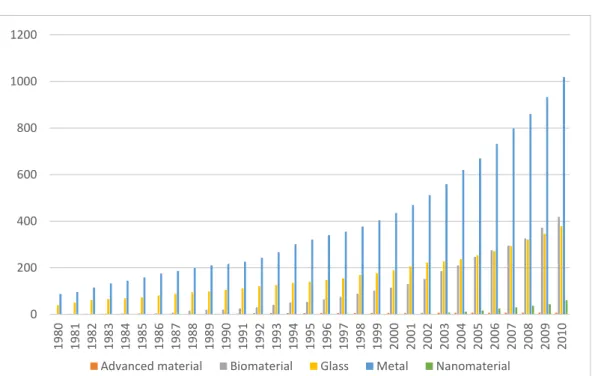
Recent advances in technologies rely on sophisticated materials: all of them used devices, products, and systems that consist of materials. With the rapid advances in computer technology, design engineering has become quite sophisticated. Thus, it has been shown that depending on the selection criterion there are different types of materials. Based on chemical make up and atomic structure, solid materials have been grouped into three basic categories: metals, ceramics and polymers; between the engineering materials there are three other important groups: composites, semiconductors and biomaterials; then, in high-technology sectors, has been developed the advanced materials and recently, a group of new and state-of-the-art materials called as “smart materials” is under development. In the second part is being proposed a method for forecasting technology success based on patent data. Four criteria, technology life cycle, diffusion speed, patent
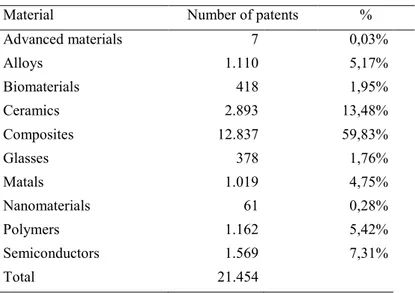
power, and expansion potential are considered for technology forecasting. Patent power and expansion potential are considered as technology scope indicators. At the end of the estimating process a data fusion algorithm is applied to combine the results obtained from different criteria. The proposed forecasting approach usefulness and potential has been demonstrated using 21.454 patents related to the following types of material: Advanced Materials, Alloys, Biomaterials, Ceramics, Composites, Gases, Metals, Nanomaterials, Polymers, Semiconductors.
In the third chapter the proposed study aims to assess how far and under which conditions granted patents provide economic advantage over companies. Based on a set of 21.545 patents held by European companies, the impact on Return on Assets index (Roa) was estimated. This part investigates how the granted patents, firm age and technology domains of new materials firms affect company performance in the time windows 2007-2015.
Finally, in the last chapter, the research examines the role of entering into new technology sectors and how the effects of the ramifications on innovative activity vary according to the number of sectors. Then, in a second step, the firm performance effect is estimated on the model. To assess whether the technological expansion is affected by the number of sectors, a dataset of 9,917 companies, operating in the advanced materials sector, over the period 1995 to 2016 is examined. Investigating companies patent portfolios and their compositions, it was possible to establish whether the firm is operating in one or more
technological field. After explaining the results, some possible policy implications are described.
CHAPTER ONE
THE INNOVATION TECHNOLOGY
1.1 The importance of innovation technology
In many industries technological innovation is now the most important driver of competitive success. Firms in a wide range of industries rely on products developed within the past five years for almost one-third (or more) of their sales and profits1. The increasing importance of innovation is due in part to the globalization of markets: foreign competition has put pressure on firms to continuously innovate in order to produce differentiated products and services. Introducing new products helps companies protect their margins, while investing in process innovation helps firms lower their costs. Advances in information technology also have played a role in speeding the pace of innovation. Computer-aided design and computer-Computer-aided manufacturing have made it easier and faster for firms to design and produce new products, while flexible manufacturing technologies have made shorter production runs economical and have reduced the importance of production economies of scale2. These technologies help firms develop and produce more product variants that closely meet the needs of narrowly defined customer groups, thus achieving differentiation from
1
Barczak G., Griffin A., Kahn K. B., “Trends and drivers of success in npd practices: results of the 2003 pdma best practices study” Journal of Product Innovation Management 26, (2009).
2
Womack J. P., Jones D. T., Roos D., “The machine that changed the world” Rawson Associates, (1990).
competitors. While producing multiple product variations used to be expensive and time consuming, flexible manufacturing technologies now enable firms to seamlessly transition from producing one product model to the next, adjusting production schedules with real-time information on demand. Firms further reduce production costs by using common components for many of the models.
Many firms such as Toyota, Samsung, and Sony adopt these new technologies and increase their pace of innovation, they raise the bar for competitors, triggering an industrywide shift to shortened development cycles and more rapid new product introductions. The net results are greater market segmentation and rapid product obsolescence3. Product life cycles have become as short as 4 to 12 months for software, 12 to 24 months for computer hardware and consumer electronics, and 18 to 36 months for large home appliances4. This spurs firms to focus increasingly on innovation as a strategic imperative: a firm that does not innovate quickly gets its margins diminishing as its products become obsolete5.
3
Qualls W., Olshavsky R. W., Michaels R. E. “Shortening of the plc—an empirical test” Journal of Marketing 45, (1981).
4
Schilling M. A., Vasco C. E. “Product and process technological change and the adoption of modular organizational forms” Winning Strategies in a Deconstructing World, John Wiley & Sons, (2000).
5
Schilling M. A. “Strategic management of technological innovation”, McGraw-Hill Education, 4th edition, (2012)
1.2 The impact of technology innovation on society
If pushing for innovation has raised the competitive bar for industries, arguably making success just that much more complicated for organizations, its net effect on society is more clearly positive. Innovation enables a wider range of goods and services to be delivered to people worldwide. It has made the production of food and other necessities more efficient, yielded medical treatments that improve health conditions, and enabled people to travel to and communicate with almost every part of the world. In a series of economic growth studies conducted by the National Bureau of Economic Research, economists showed that the historic rate of economic growth in GDP could not be accounted for entirely by growth in labor and capital inputs. Economist Robert Merton Solow argued that this unaccounted-for residual growth represented technological change: Technological innovation increased the amount of output achievable from a given quantity of labor and capital. This explanation was not immediately accepted; many researchers attempted to explain the residual away in terms of measurement error, inaccurate price deflation, or labor improvement. But in each case the additional variables were unable to eliminate this residual growth component. A consensus gradually emerged that the residual did in fact capture technological change. Solow received a Nobel Prize for his work in 1981, and the residual became
known as the Solow Residual6. While GDP has its shortcomings as a measure of standard of living, it does relate very directly to the amount of goods consumers can purchase. Thus, to the extent that goods improve quality of life, we can ascribe some beneficial impact of technological innovation.
Sometimes technological innovation results in negative externalities. Production technologies may create pollution that is harmful to the surrounding communities; agricultural and fishing technologies can result in erosion, elimination of natural habitats, and depletion of ocean stocks; medical technologies can result in unanticipated consequences such as antibiotic resistant strains of bacteria or moral dilemmas regarding the use of genetic modification. However, technology is, in its purest essence, knowledge-knowledge to solve our problems and pursue our goals7. Technological innovation is thus the creation of new knowledge that is applied to practical problems. Sometimes this knowledge is applied to problems hastily, without full consideration of the consequences and alternatives, but overall it will probably serve us better to have more knowledge than less.
6
Crafts N., “The first industrial revolution: a guided tour for growth economists,” The American Economic Review 86, (1996).
7
1.3 Sources of innovation
Innovation can arise from many different sources. One primary engine of innovation is firms. Firms are well suited to innovation activities because they typically have greater resources than individuals and a management system to marshal those resources toward a collective purpose. Firms also face strong incentives to develop differentiating new products and services, which may give them an advantage over non-profit or government-funded entities.
An even more important source of innovation, however, does not arise from any one of these sources, but rather the linkages between them. Networks of innovators that leverage knowledge and other resources from multiple sources are one of the most powerful agents of technological advance. We can thus think of sources of innovation as composing a complex system wherein any particular innovation may emerge primarily from one or more components of the system or the linkages between them.
1.3.1 The role of creativity
Innovation begins with the generation of new ideas. The ability to generate new and useful ideas is termed creativity. Creativity is defined as the ability to produce work that is useful and novel. Novel work must be different from work that has been previously produced and surprising in that it is not simple the next logical step in a series of known solutions8. The degree to which a product is novel is a function both of how different it is from prior work (e.g., a minor deviation versus a major leap) and of the audience’s prior experiences9. A product could be novel to the person who made it, but known to most everyone else. In this case, we would call it reinvention. A product could be novel to its immediate audience, yet be well known somewhere else in the world. The most creative works are novel at the individual producer level, the local audience level, and the broader societal level10. An individual’s creative ability is a function of his or her intellectual abilities, knowledge, style of thinking, personality, motivation, and environment11. The most important intellectual abilities for creative thinking include the ability to look at problems in unconventional ways, the ability to analyze which ideas are worth pursuing and which are not, and the ability to articulate those ideas to
8
Lubart T. I. “Creativity” Thinking and Problem Solving, R. J. Sternberg, (1994)
9
Boden M. “The creative mind: myths and mechanisms” Basic Books, (1992).
10
Schilling M. A. “Strategic management of technological innovation” McGraw-Hill Education, 4th edition, (2012)
11
Sternberg R. J., Lubart T. I. “The concept of creativity: prospects and paradigms” Cambridge University Press, (1999)
others and convince others that the ideas are worthwhile. The impact of knowledge on creativity is somewhat double-edged. If an individual has too little knowledge of a field, he or she is unlikely to understand it well enough to contribute meaningfully to it. On the other hand, if an individual knows a field too well, that person can become trapped in the existing logic and paradigms, preventing him or her from coming up with solutions that require an alternative perspective. Thus, an individual with only a moderate degree of knowledge of a field might be able to produce more creative solutions than an individual with extensive knowledge of the field12. The personality traits deemed most important for creativity include self-efficacy, tolerance for ambiguity, and a willingness to overcome obstacles and take reasonable risks13. Intrinsic motivation has also been shown to be very important for creativity14. That is, individuals are more likely to be creative if they work on things they are genuinely interested in and enjoy. Finally, to fully unleash an individual’s creative potential often requires an environment that provides support and rewards for creative ideas.
The creativity of the organization is a function of the individuals within the organization and a variety of social processes and contextual factors that shape the
12
Frensch P. A., Sternberg R. J. “Expertise and intelligent thinking: when is it worse to know better?” in advances in the psychology of human intelligence 5, (1989)
13
Lubart T. I. “Product-centered self-evaluation and the creative process” unpublished doctoral dissertation, Yale University Press, (1994)
14
way those individuals interact and behave15. An organization’s overall creativity level is thus not a simple aggregate of the creativity of the individuals it employs. The organization’s structure, routines, and incentives could thwart individual creativity or amplify it.
The most familiar method of a company tapping the creativity of its individual employees is the suggestion box. In 1895, John Patterson, founder of National Cash Register (NCR), created the first sanctioned suggestion box program to tap the ideas of the hourly worker16.The program was considered revolutionary in its time. The originators of adopted ideas were awarded $1. In 1904, employees submitted 7,000 ideas, of which one-third were adopted. Other firms have created more elaborate systems that not only capture employee ideas, but incorporate mechanisms for selecting and implementing those ideas. Idea collection systems, such as suggestion boxes, are relatively easy and inexpensive to implement, but are only a first step in unleashing employee creativity. Today many companies go to much greater lengths to tap the creative potential embedded in employees, including investing in creativity training programs. Such programs encourage managers to develop verbal and nonverbal cues that signal employees that their thinking and autonomy are respected. These cues shape the culture of the firm and
15
Woodman R. W., Sawyer J. E., Griffin R. W. “Toward a theory of organizational creativity” Academy of Management Review 18, (1993)
16
Gorski C., Heinekamp E. “Capturing employee ideas for new products” John Wiley & Sons, (2002)
are often more effective than monetary rewards and, sometimes, monetary rewards undermine creativity by encouraging employees to focus on extrinsic rather than intrinsic motivation17. The programs also often incorporate exercises that encourage employees to use creative mechanisms such as developing alternative scenarios, using analogies to compare the problem with another problem that shares similar features or structure, and restating the problem in a new way18.
17
Woodman R. W., Sawyer J. E., Griffin R. W. “Toward a theory of organizational creativity” Academy of Management Review 18, (1993)
18
Schilling M. A. “Strategic management of technological innovation” McGraw-Hill Education, 4th edition, (2012)
1.3.2 Actors of innovation
Innovation can arise from many different sources. It can originate with individuals, as in the familiar image of the lone inventor or users who design solutions for their own needs. Innovation can also come from the research efforts of universities, government laboratories and incubators, or private non-profit organizations. One primary engine of innovation is firms. Firms are well suited to innovation activities because they typically have greater resources than individuals and a management system to marshal those resources toward a collective purpose. Firms also face strong incentives to develop differentiating new products and services, which may give them an advantage over nonprofit or government funded entities.
An even more important source of innovation, however, does not arise from any one of these sources, but rather the linkages between them. Networks of innovators that leverage knowledge and other resources from multiple sources are one of the most powerful agents of technological advance19. We can thus think of sources of innovation as composing a complex system where in any particular innovation may emerge primarily from one or more components of the system or the linkages between them.
19
Doerr L. S., Smith J. O., Koput K. W., Powell W. W. “Networks and knowledge production: collaboration and patenting in biotechnology” Corporate Social Capital, (1999)
Fig. 1.1 S-curve of technology life cycle
Below are summarized the main sources of innovation20:
a) The Inventor: The familiar image of the inventor as an eccentric and doggedly persistent scientist may have some basis in cognitive psychology. Analysis of personality traits of inventors suggests these individuals are likely to be interested in theoretical and abstract thinking, and have an unusual enthusiasm for problem solving. Their tendency toward introversion may cause them to be better at manipulating concepts than at interacting socially21. Such individuals may spend a lifetime developing numerous creative new devices or processes, though they may patent or commercialize few. The qualities that make people inventive do not necessarily make them
20
Schilling M. A. “Strategic management of technological innovation” McGraw-Hill Education, 4th edition, (2012)
21
Church A. H., Waclawski J. “The relationship between individual personality orientation and executive leadership behavior” Journal of Occupational and Organizational Psychology 71, (1998)
entrepreneurial; many inventors do not actively seek to patent or commercialize their work. Many of the most well-known inventors (e.g., Alexander Graham Bell, Thomas Alva Edison, Albert Einstein, and Benjamin Franklin), however, had both inventive and entrepreneurial traits.
b) Innovation by Users: Innovation often originates with those who create solutions for their own needs. Users often have both a deep understanding of their unmet needs and the incentive to find ways to fulfill them22. While manufacturers typically create new product innovations in order to profit from the sale of the innovation to customers, user innovators often have no initial intention to profit from the sale of their innovation––they create the innovation for their own use23. Users may alter the features of existing products, approach existing manufacturers with product design suggestions, or develop new products themselves. User innovations can also blossom into new industries.
c) Research and Development by firms: Though the terms research and development are often lumped together, they actually represent different kinds of investment in innovation related activities. Research can refer to both basic research and applied research. Basic research s effort directed at increasing
22
Von Hippel E. “Innovation by user communities: learning from open-source software,” Sloan Management Review 42, (2001)
23
Shah S. K., “Motivation, governance, and the viability of hybrid forms in open source software development,” Management Science 52, (2006)
understanding of a topic or field without a specific immediate commercial application in mind. This research advances scientific knowledge, which may turn out to have long-run commercial implications. Applied research is directed at increasing understanding of a topic to meet a specific need. In industry, this research typically has specific commercial objectives.
Development refers to activities that apply knowledge to produce useful
devices, materials, or processes. Thus, the term research and development refers to a range of activities that extend from early exploration of a domain to specific commercial implementations.
d) Linkages to an external network of firms: Firms often form alliances with customers, suppliers, and even competitors to jointly work on an innovation project or to exchange information and other resources in pursuit of innovation. Collaboration might occur in the form of alliances, participation in research consortia, licensing arrangements, contract research and development, joint ventures, and other arrangements. Collaborators can pool resources such as knowledge and capital, and they can share the risk of a new product development project. Critics have often charged that firms are using external sources of technological innovation rather than investing in original research. But empirical evidence suggests that external sources of information are more likely to be complements to rather than substitutes for in-house research and development. Researches indicate that firms who had their own
research and development were also the heaviest users of external collaboration networks. Presumably doing in-house R&D helps to build the firm’s absorptive capacity, enabling it to better assimilate and utilize information obtained externally24. Absorptive capacity refers to the firm’s ability to understand and use new information.
e) Universities, government laboratories, and incubators: Many universities
encourage their faculty to engage in research that may lead to useful innovations. Typically the intellectual property policies of a university embrace both patentable and unpatentable innovations, and the university retains sole discretion over the rights to commercialize the innovation. If an invention is successfully commercialized, the university typically shares the income with the individual inventors25. Governments of many countries actively invest in research through their own laboratories, the formation of science parks and incubators, and grants for other public or private research entities. These parks create fertile hotbeds for new start-ups and a focal point for the collaboration activities of established firms. Their proximity to university laboratories and other research centers ensures ready access to
24
Cohen W. M., Levinthal D. A. “Absorptive capacity: a new perspective on learning and innovation,” Administrative Science Quarterly, (1990)
25
scientific expertise. Such centers also help university researchers implement their scientific discoveries in commercial applications26.
f) Private Nonprofit Organizations: Private non-profit organizations, such as private research institutes, non-profit hospitals, private foundations, professional or technical societies, academic and industrial consortia, and trade associations, also contribute to innovation activity in a variety of complex ways. Many non-profit organizations perform their own research and development activities, some fund the research and development activities of other organizations but do not do it themselves, and some non-profit organizations do both in-house research and development and fund the
development efforts of others.
26
Colombo M., Delmastro M. “How effective are technology incubators? evidence from Italy” Research Policy 31, (2001)
1.3.3 Collaborative networks
There is a growing recognition of the importance of collaborative research and development networks for successful innovation27. Such collaborations include joint ventures, licensing and second sourcing agreements, research associations, government-sponsored joint research programs, value added networks for technical and scientific interchange, and informal networks28. Collaborative research is especially important in high-technology sectors, where it is unlikely that a single individual or organization will possess all of the resources and capabilities necessary to develop and implement a significant innovation29.
As firms forge collaborative relationships, they weave a network of paths between them that can act as conduits for information and other resources. By providing member firms access to a wider range of information than individual firms possess, interfirm networks can enable firms to achieve much more than they could achieve individually30. Thus, interfirm networks are an important engine of innovation. Furthermore, the structure of the network is likely to influence the flow of information and other resources through the network.
27
Ahuja G., Lampert C. M. “Entrepreneurship in the large corporation: a longitudinal study of how established firms create breakthrough inventions” Strategic Management Journal 22, (2001)
28
Freeman C. “Networks of innovators: a synthesis of research issues” Research Policy 20, (1991)
29
Hagedoorn J. “Inter-firm R&D partnerships: an overview of major trends and patterns since 1960” Research Policy 31, (2002)
30
Liebeskind J.P., Oliver A.L., Zucker L., Brewer M. “Social networks, learning, and flexibility: sourcing scientific knowledge in new biotechnology firms” Organization Science 4, (1996)
Sometimes geographical proximity appears to play a role in the formation and innovative activity of collaborative networks. City and state governments, for example, might like to know how to foster the creation of a technology cluster in their region in order to increase employment, tax revenues, and other economic benefits. For firms, understanding the drivers and benefits of clustering is useful for developing a strategy that ensures the firm is well positioned to benefit from clustering.
Technology clusters may span a region as narrow as a city or as wide as a group
of neighboring countries31. Clusters often encompass an array of industries that are linked through relationships between suppliers, buyers, and producers of complements. One primary reason for the emergence of regional clusters is the benefit of proximity in knowledge exchange. Though advances in information technology have made it easier, faster, and cheaper to transmit information in great distances, several studies indicate that knowledge does not always transfer readily via such mechanisms.
Proximity and interaction can directly influence firms’ ability and willingness to exchange knowledge. First, knowledge that is complex or tacit may require frequent and close interaction to be meaningfully exchanged32. Firms may need to
31
Porter M. E. “Location, competition, and economic development: local clusters in a global economy” Economic Development Quarterly 14, (2000)
32
Almeida P., Kogut B. “Localization of knowledge and the mobility of engineers in regional networks” Management Science 45, (1999)
interact frequently to develop common ways of understanding and articulating the knowledge before they are able to transfer it33. Second, closeness and frequency of interaction can influence a firm’s willingness to exchange knowledge. When firms interact frequently, they can develop trust and reciprocity norms. Firms that interact over time develop greater knowledge of each other, and their repeated interactions give them information as to the likelihood of their partner’s behaving opportunistically. A shared understanding of the rules of engagement emerges, wherein each partner understands its obligations with respect to how much knowledge is exchanged, how that knowledge can be used, and how the firms are expected to reciprocate34. Firms that are proximate thus have an advantage in sharing information that can lead to greater innovation productivity. This can, in turn, lead to other self-reinforcing geographical advantages. A cluster of firms with high innovation productivity can lead to more new firms starting up in the immediate vicinity and can attract other firms to the area35. As firms grow, divisions may be spun off into new firms, entrepreneurial employees may start their own enterprises, and supplier and distributor markets emerge to service the cluster. Successful firms also attract new labor to the area and help to make the
33
Szulanski G. “Exploring internal stickiness: impediments to the transfer of best practice within the firm” Strategic Management Journal 17, (1996)
34
Dyer J. H., Nobeoka K. “Creating and managing a high-performance knowledge-sharing network: the Toyota case” Strategic Management Journal 21, (2000)
35
Stuart T., Sorenson O. “The geography of opportunity: spatial heterogeneity in founding rates and the performance of biotechnology firms” Research Policy 32, (2003)
existing labor pool more valuable by enabling individuals to gain experience working with the innovative firms. The increase in employment and tax revenues in the region can lead to improvements in infrastructure, schools, and other markets that service the population. The benefits firms reap by locating in close geographical proximity to each other are known collectively as agglomeration
economies.
There are also some downsides to geographical clustering. First, the proximity of many competitors serving a local market can lead competition that reduces their pricing power in their relationships with both buyers and suppliers. Second, the close proximity of firms may increase the likelihood of a firm’s competitors gaining access to the firm’s proprietary knowledge. Third, clustering can potentially lead to traffic congestion, inordinately high housing costs, and higher concentrations of pollution.
A big part of the reason that technologies are often regionally localized is that technological knowledge is, to a large extent, held by people, and people are often only reluctantly mobile. Studies have indicated that while many innovative activities appear to have some geographic component, the degree to which innovative activities are geographically clustered depends on things such as36:
36
Schilling M. A. “Strategic management of technological innovation”, McGraw-Hill Education, 4th edition, (2012)
The nature of the technology, such as its underlying knowledge base or the degree to which it can be protected by patents or copyright, and the degree to which its communication requires close and frequent interaction;
Industry characteristics, such as the degree of market concentration or stage of the industry life cycle, transportation costs, and the availability of supplier and distributor markets.
The cultural context of the technology, such as the population density of labor or customers, infrastructure development, or national differences in the way techno- logy development is funded or protected.
1.3.4 Technological spillovers
While the work on technology clusters has tended to emphasize the “stickiness” of knowledge, a related body of research has focused on explaining the spread of knowledge across organizational or regional boundaries. This topic is known as technological spillovers. Technological spillovers occur when the benefits from the research activities of one firm spill over to other firms or other entities. Spillovers are thus a positive externality of research and development efforts. Evidence suggests that technology spillovers are a significant influence on innovative activity. Whether R&D benefits will spill over is partially a function of the strength of protection mechanisms such as patents, copyrights, and trade secrets. Since the strength of protection mechanisms varies significantly across industries and countries, the likelihood of spillovers varies also37. The likelihood of spillovers is also a function of the nature of the underlying knowledge base and the mobility of the labor pool38.
37
Cohen W., Goto A., Nagata A., Nelson R., Walsh J. “R&D spillovers, patents and the incentives to innovate in japan and the United States” Research Policy 31, (2002)
38
Almeida P., Kogut B. “Localization of knowledge and the mobility of engineers in regional networks” Management science 45, (1999)
1.4 Types of innovation
Technological innovations are often categorized into different types such as “radical” versus “incremental.” Different types of innovation require different kinds of underlying knowledge and have different impacts on the industry’s competitors and customers. Four of the dimensions most commonly used to categorize innovations are described here: product versus process innovation, radical versus incremental, competence enhancing versus competence destroying, and architectural versus component.
1.4.1 Product innovation or process innovation
Product innovations are embodied in the outputs of an organization: its goods or services. Process innovations are innovations in the way an organization conducts its business, such as in the techniques of producing or marketing goods or services. Process innovations are often oriented toward improving the effectiveness or efficiency of production by, for example, reducing defect rates or increasing the quantity that may be produced in a given time. For example, a process innovation in a biotechnology firm might entail developing a genetic algorithm that can quickly search a set of disease-related genes to identify a target for therapeutic intervention. In this instance, the innovation process can speed up the firm’s ability to develop a product innovation. New product innovations and process innovations often occur in tandem. First, new processes may enable the production of new products. Then, new products may enable the development of new processes. Finally, a product innovation for one firm may simultaneously be a process innovation for another. Though product innovations are often more visible than process innovations, both are extremely important to an organization’s ability to compete.
1.4.2 Radical innovation or incremental innovation
One of the primary dimensions used to distinguish types of innovation is the continuum between radical versus incremental innovation. A number of definitions have been posed for radical innovation and incremental innovation, but most hinge on the degree to which an innovation represents a departure from existing practices39. Thus radicalness might be conceived as the combination of newness and the degree of differentness. A technology could be new to the world, new to an industry, new to a firm, or new merely to an adopting business unit. A technology could be significantly different from existing products and processes or only marginally different. The most radical innovations would be new to the world and exceptionally different from existing products and processes. The introduction of wireless telecommunication products aptly illustrates that it embodied significantly new technologies that required new manufacturing and service processes. Incremental innovation is at the other end of the spectrum. An incremental innovation might not be particularly new or exceptional, it might have been previously known to the firm or industry, and involve only a minor change from existing practices. The radicalness of innovation is also sometimes defined in terms of risk. Since radical innovations often embody new knowledge,
39
producers and customers will vary in their experience and familiarity with the innovation, and in their judgment of its usefulness or reliability40.
Finally, the radicalness of an innovation is relative, and may change over time or with respect to different observers. An innovation that was once considered radical may eventually be considered incremental as the knowledge base underlying the innovation becomes more common. Furthermore, an innovation that is radical to one firm may seem incremental to another. Innovations can also be classified as competence enhancing versus competence-destroying. An innovation is considered to be competence enhancing from the perspective of a particular firm if it builds on the firm’s existing knowledge base. An innovation is considered to be competence destroying from the perspective of a particular firm if the technology does not build on the firm’s existing competencies or renders them obsolete41.
40 Dewar R. D., Dutton J. E. “The adoption of radical and incremental innovations: an empirical
analysis” Management Science32, (1986)
41 Schilling M. A. “Strategic management of technological innovation” McGraw-Hill Education, 4th
1.4.3 Architectural innovation or component innovation
Most products and processes are hierarchically nested systems, meaning that at any unit of analysis, the entity is a system of components, and each of those components is, in turn, a system of finer components, until we reach some point at which the components are elementary particles42. For example, a bicycle is a system of components such as a frame, wheels, tires, seat, brakes, and so on. Each of those components is also a system of components: the seat might be a system of components that includes a metal and plastic frame, padding, a nylon cover, and so on. An innovation may entail a change to individual components, to the overall architecture within which those components operate, or both. An innovation is considered a component innovation if it entails changes to one or more components, but does not significantly affect the overall configuration of the system43. In the example above, an innovation in bicycle seat technology does not require any changes in the rest of the bicycle architecture. In contrast, an architectural innovation entails changing the overall design of the system or the way that components interact with each other. An innovation that is strictly architectural may reconfigure the way that components link together in the
42
Simon H. “The architecture of complexity,” Proceedings of the American Philosophical Society 106, (1962)
43 Fleming L., Sorenson O. “Navigating the technology landscape of innovation” Sloan
system, without changing the components themselves44. Most architectural innovations, however, create changes in the system that reverberate throughout its design, requiring changes in the underlying components in addition to changes in the ways those components interact. Architectural innovations often have far-reaching and complex influences on industry competitors and technology users. For a firm to initiate or adopt a component innovation may require that the firm have knowledge only about that component. However, for a firm to initiate or adopt an architectural innovation typically requires that the firm have architectural knowledge about the way components link and integrate to form the whole system. Firms must be able to understand how the attributes of components interact, and how changes in some system features might trigger the need for changes in many other design features of the overall system or the individual components.
Though the dimensions described above are useful for exploring key ways that one innovation may differ from another, these dimensions are not independent, nor do they offer a straightforward system for categorizing innovations in a precise and consistent manner. Each of the above dimensions shares relationships with others: for example architectural innovations are often considered more radical and more competence destroying than component innovations.
44
Henderson R., Clark K. “Architectural innovation: the reconfiguration of existing product technologies and the failure of established firms” Administrative Science Quarterly 35, (1990)
Furthermore, where an innovation lies on the dimension of competence enhancing versus destroying, architectural versus component, or radical versus incremental depends on the time frame and industry context from which it is considered. Thus, while the dimensions above are valuable for understanding innovation, they should be considered relative dimensions whose meaning is dependent on the context in which they are used45.
45
Schilling M. A. “Strategic management of technological innovation” McGraw-Hill Education, 4th edition, (2012)
1.5 Patterns of performance and technology innovation
Numerous studies of innovation have revealed recurring patterns in how new technologies emerge, evolve, are adopted, and are displaced by other technologies.
Both the rate of a technology’s performance improvement and the rate at which the technology is adopted in the marketplace repeatedly have been shown to conform to an shape curve. Though curves in technology performance and s-curves in technology diffusion are related, they are fundamentally different processes. S-curves in technology diffusion are often explained as a process of different categories of people adopting the technology at different times. Hereafter is proposed some categories of consumers depending on the time of adoption: 1. Innovators: are the first individuals to adopt an innovation. Extremely
adventurous in their purchasing behavior, they are comfortable with a high degree of complexity and uncertainty. Innovators typically have access to substantial financial resources. Though they are not always well integrated into a particular social system, innovators play an extremely important role in the diffusion of an innovation because they are the individuals who bring new ideas into the social system.
2. Early adopters: The second category of adopters is the early adopters. Early adopters are well integrated into their social system and have the greatest potential for opinion leadership. Early adopters are respected by their peers
and know that to retain that respect they must make sound innovation adoption decisions. Other potential adopters look to early adopters for information and advice, thus early adopters make excellent missionaries for new products or processes.
3. Early majority: adopts innovations slightly before the average member of a social system. They are typically not opinion leaders, but they interact frequently with their peers.
4. Late majority: Like the early majority, the late majority constitutes one-third of the individuals in a social system. Those in the late majority approach innovation with a skeptical air and may not adopt the innovation until they feel pressure from their peers. The late majority may have scarce resources, thus making them reluctant to invest in adoption until most of the uncertainty about the innovation has been resolved.
5. Laggards: They may base their decisions primarily upon past experience rather than influence from the social network, and they possess almost no opinion leadership. They are highly skeptical of innovations and innovators, and they must feel certain that a new innovation will not fail before adopting it.
1.5.1 Patterns S-curves in Technological development
Many technologies exhibit an s-curve in their performance improvement over their lifetimes46. When a technology’s performance is plotted against the amount of effort and money invested in the technology, it typically shows slow initial improvement, then accelerated improvement, then diminishing improvement. Performance improvement in the early stages of a technology is slow because the fundamentals of the technology are poorly understood. Great effort may be spent exploring different paths of improvement or different drivers of the technology’s improvement. If the technology is very different from previous technologies, there may be no evaluation routines that enable researchers to assess its progress or its potential. Furthermore, until the technology has established a degree of legitimacy, it may be difficult to attract other researchers to participate in its development47. However, as scientists or firms gain a deeper understanding of the technology, improvement begins to accelerate. The technology begins to gain legitimacy as a worthwhile endeavor, attracting other developers. Furthermore, measures for assessing the technology are developed, permitting researchers to target their attention toward those activities that reap the greatest improvement per unit of effort, enabling performance to increase rapidly. However, at some point, diminishing returns to effort begin to set in. As the technology begins to reach its
46
Foster R. “Innovation: the attacker’s advantage” Summit Books, (1986)
47
Garud R., Rappa M. A. “A socio-cognitive model of technology evolution: the case of cochlear implants” Organization Science 5, (1994)
inherent limits, the cost of each marginal improvement increases, and the s-curve flattens. Often a technology’s s-curve is plotted with performance against time, but this must be approached with care. If the effort invested is not constant over time, the resulting s-curve can obscure the true relationship. If effort is relatively constant over time, plotting performance against time will result in the same characteristic curve as plotting performance against effort. However, if the amount of effort invested in a technology decreases or increases over time, the resulting curve could appear to flatten much more quickly, or not flatten at all. Technologies do not always get the opportunity to reach their limits; they may be rendered obsolete by new, discontinuous technologies.
A new innovation is discontinuous when it fulfills a similar market need, but does so by building on an entirely new knowledge base48.
In early stages, effort invested in a new technology may reap lower returns than effort invested in the current technology, and firms are often reluctant to switch. However, if the disruptive technology has a steeper s-curve or an s-curve that increases to a higher performance limit (see Figure 1.2), there may come a time when the returns to effort invested in the new technology are much higher than effort invested in the incumbent technology. New firms entering the industry are likely to choose the disruptive technology, and incumbent firms face the difficult choice of trying to extend the life of their current technology or investing in switching to the new technology. If the disruptive technology has much greater performance potential for a given amount of effort, in the long run it is likely to displace the incumbent technology, but the rate at which it does so can vary significantly.
48
1.5.2 Patterns S-curves in Technology expansion
S-curves are also often used to describe the diffusion of a technology. Unlike s-curves in technology performance in technology diffusionare obtained by plotting the cumulative number of adopters of the technology against time. This yields an s-shape curve because adoption is initially slow when an unfamiliar technology is introduced to the market, it accelerates as the technology becomes better understood and utilized by the mass market, and eventually the market is saturated so the rate of new adoptions declines. For instance, when electronic calculators were introduced to the market, they were first adopted by the relatively small pool of scientists and engineers. This group had previously used slide rules. Then the calculator began to penetrate the larger markets of accountants and commercial users, followed by the still larger market that included students and the general public. After these markets had become saturated, fewer opportunities remained for new adoptions49. One rather curious feature of technology diffusion is that it typically takes far more time than information diffusion50.
If a new technology is a significant improvement over existing solutions, why do some firms shift to it more slowly than others? The answer may lie in the complexity of the knowledge underlying new technologies and in the development of complementary resources that make those technologies useful.
49
Brown R. “Managing the ‘s’ curves of innovation” Journal of Consumer Marketing 9, (1992).
50
Although some of the knowledge necessary to utilize a new technology might be transmitted through manuals or other documentation, other aspects of knowledge necessary to fully realize the potential of a technology might be built up only through experience. Some of the knowledge about the technology might be tacit and require transmission from person to person through extensive contact. Many potential adopters of a new technology will not adopt it until such knowledge is available to them, despite their awareness of the technology and its potential advantages51.
Furthermore, many technologies become valuable to a wide range of potential users only after a set of complementary resources are developed for them.
Finally, it should be clear that the s-curves of diffusion are in part a function of the s-curves in technology improvement: as technologies are better developed, they become more certain and useful to users, facilitating their adoption. Furthermore, as learning- curve and scale advantages accrue to the technology, the price of finished goods often drops, further accelerating adoption by users.
51
1.5.3 Patterns S-curves as a predicting tool
Several authors have argued that managers can use the s-curve model as a tool for predicting when a technology will reach its limits and as a prescriptive guide for whether and when the firm should move to a new, more radical technology52. Firms can use data on the investment and performance of their own technologies, or data on the overall industry investment in a technology and the average performance achieved by multiple producers. Managers could then use these curves to assess whether a technology appears to be approaching its limits or to identify new technologies that might be emerging on s-curves that will intersect the firm’s technology s-curve. Managers could then switch s-curves by acquiring or developing the new technology. However, as a prescriptive tool, the s-curve model has several serious limitations. First, it is rare that the true limits of a technology are known in advance, and there is often considerable disagreement among firms about what a technology’s limits will be. Second, the shape of a technology’s s-curve is not set in stone. Unexpected changes in the market, component technologies, or complementary technologies can shorten or extend the life cycle of a technology. Furthermore, firms can influence the shape of the s-curve through their development activities. For example, firms can sometimes
52
stretch the s-curve through implementing new development approaches or revamping the architecture design of the technology53.
Finally, whether switching to a new technology will benefit a firm depends on a number of factors, including the advantages offered by the new technology, the new technology’s fit with the firm’s current abilities, the new technology’s fit with the firm’s position in complementary resources, and the expected rate of diffusion of the new technology. Thus, a firm that follows an s-curve model too closely could end up switching technologies earlier or later than it should.
53
1.5.4 Cyclical changes
The s-curve model above suggests that technological change is cyclical: Each new s-curve user in an initial period of turbulence, followed by rapid improvement, then diminishing returns, and ultimately is displaced by a new technological discontinuity54. The emergence of a new technological discontinuity can overturn the existing competitive structure of an industry, creating new leaders and new losers. Schumpeter called this process creative destruction, and argued that it was the key driver of progress in a capitalist society55.
Several studies have tried to identify and characterize the stages of the technology cycle in order to better understand why some technologies succeed and others fail, and whether established firms or new firms are more likely to be successful in introducing or adopting a new technology56. One technology evolution model that rose to prominence was proposed by Utterback and Abernathy57. They observed that a technology passed through distinct phases. In the first phase there was considerable uncertainty about both the technology and its market. Products or services based on the technology might be crude, unreliable, or expensive, but might suit the needs of some market niches. In this phase, firms experiment with
54
Anderson P., Tushman M., “Technological discontinuities and dominant designs: a cyclical model of technological change” Administrative Science Quarterly 35, 1990).
55
Schumpeter J. “Capitalism, socialism and democracy” Harper Brothers, (1942).
56
Sahal D. “Patterns of technological innovation” Addison-Wesley Publishing, (1981).
57
Utterback J.M. Abernathy W.J. “A dynamic model of process and product innovation” Omega 3, (1975).
different form factors or product features to assess the market response. Eventually, however, producers and customers begin to arrive at some consensus about the desired product attributes, and a dominant design emerges. The dominant design establishes a stable architecture for the technology and enables firms to focus their efforts on process innovations that make production of the design more effective and efficient or on incremental innovations to improve components within the architecture. Utterback and Abernathy termed this phase the specific phase because innovations in products, materials, and manufacturing processes are all specific to the dominant design.
In the words of Anderson and Tushman, the rise of a dominant design signals the transition from the era of ferment to the era of incremental change58. In this era,
firms focus on efficiency and market penetration. Firms may attempt to achieve greater market segmentation by offering different models and price points. They may also attempt to lower production costs by simplifying the design or improving the production process. This period of accumulating small improvements may account for the bulk of the techno- logical progress in an industry, and it continues until the next technological discontinuity. Understanding the knowledge that firms develop during different eras lends insight into why successful firms often resist the transition to a new technology,
58
Anderson P. Tushman M. “Technological discontinuities and dominant designs: a cyclical model of technological change” Administrative Science Quarterly 35, (1990)
even if it provides significant advantages. During the era of incremental change, many firms cease to invest in learning about alternative design architectures and instead invest in refining their competencies related to the dominant architecture. Most competition revolves around improving components rather than altering the architecture, thus, companies focus their efforts on developing component knowledge and knowledge related to the dominant architecture. As firms’ routines and capabilities become more and more wedded to the dominant architecture, the firms become less able to identify and respond to a major architectural innovation. For example, the firm might establish divisions based on the primary components of the architecture and structure the communication channels between divisions on the basis of how those components interact. In the firm’s effort to absorb and process the vast amount of information available, it is likely to establish filters that enable it to identify the information most crucial to its understanding of the existing technology design59.
As the firm’s expertise, structure, communication channels, and filters all become oriented around maximizing its ability to compete in the existing dominant design, they become barriers to the firm’s recognizing and reacting to a new technology architecture. While many industries appear to conform to this model in which a dominant de- sign emerges, there are exceptions. In some industries,
59
Henderson R., Clark K. “Architectural innovation: the reconfiguration of existing product technologies and the failure of established firms” Administrative Science Quarterly, 35 (1990).
heterogeneity of products and production processes are a primary determinant of value, and thus a dominant design is undesirable60.
60
Porter M. E. “The technological dimension of competitive strategy” Research on technological innovation, management and policy, JAI Press, (1983)
1.6 Timing of adoption
In the previous paragraph we discuss that industries are characterized by increasing returns to adoption, meaning that the more a technology is adopted, the more valuable it becomes. In such industries, timing can be crucial: a technology that is adopted earlier than others may reap self-reinforcing advantages such as greater funds to invest in improving the technology, greater availability of complementary goods, and less customer uncertainty. On the other hand, the same factors that cause increasing returns to adoption may make very early technologies unattractive: if there are few users of the technology or availability of complementary goods is poor, the technology may fail to attract customers. A number of other first-mover advantages, and disadvantages, can shape how timing of entry is related to likelihood of success. Entrants are often divided into three categories: first movers, which are the first to sell in a new product or service category; early followers, which are early to the market but not first; and late entrants, which enter the market when or after the product begins to penetrate the mass market. The research on whether it is better to be a first mover, early follower, or late entrant yields conflicting conclusions. Some studies that contrast early entrants with late entrants find that early entrants have higher returns and survival rates, consistent with the notion of first-mover advantage61. However, other research has suggested the first firm to market is often the first to fail,
61
causing early followers to outperform first movers62. Still other research contends the higher returns of being a first mover typically offset the survival risk63. A number of factors influence how timing of entry affects firm survival and profits.
62
Golder P., Tellis G. “Pioneer advantage: marketing logic or marketing legend?” Journal of
Marketing Research 30, (1993)
63
Robinson W., Sungwook M. “Is the first to market the first to fail? empirical evidence for
1.6.1 First-mover advantages
One of the key factors influencing the level of profits for companies is the ability to launch the product “at the right time” on the market. The management can choose to be the first-mover can pursue the following advantages64:
a) Brand loyalty and technological leadership: The company that introduces a new technology may earn a long-lasting reputation as a leader in that technology domain. Such a reputation can help sustain the company’s image, brand loyalty, and market share even after competitors have introduced comparable products. The organization’s position as technology leader also enables it to shape customer expectations about the technology’s form, features, pricing, and other characteristics. By the time later entrants come to market, customer requirements may be well established. If aspects that customers have come to expect in a technology are difficult for competitors to imitate (e.g., if they are protected by patent or copyright, or arise from the first mover’s unique capabilities), being the technology leader can yield sustained
monopoly rents. Even if the technology characteristics are imitable, the first
mover has an opportunity to build brand loyalty before the entry of other competitors.
64
Schilling M. A. “Strategic management of technological innovation” McGraw-Hill Education, 4th edition (2012)
b) Preemption of scarce assets: Firms that enter the market early can preemptively capture scarce resources such as key locations, government permits, access to distribution channels, and relationships with suppliers. c) Exploiting buyer switching costs: Once buyers have adopted a good, they
often face costs to switch to another good. For example, the initial cost of the good is itself a switching cost, as is the cost of complements purchased for the good. Additionally, if a product is complex, buyers must spend time becoming familiar with its operation; this time investment becomes a switching cost that deters the buyer from switching to a different product. If buyers face switching costs, the firm that captures customers early may be able to keep those customers even if technologies with a superior value proposition are introduced later.
d) Reaping increasing returns advantages: In an industry with pressures encouraging adoption of a dominant design, the timing of a firm’s investment in new technology development may be particularly critical to its likelihood of success.