Full Terms & Conditions of access and use can be found at
http://www.tandfonline.com/action/journalInformation?journalCode=tjom20
Download by: [Universita Di Ferrara] Date: 01 December 2015, At: 01:32
Journal of Maps
ISSN: (Print) 1744-5647 (Online) Journal homepage: http://www.tandfonline.com/loi/tjom20
Uranium distribution in the Variscan Basement of
Northeastern Sardinia
M. Kaçeli Xhixha, M. Albèri, M. Baldoncini, G.P. Bezzon, G.P. Buso, I. Callegari,
L. Casini, S. Cuccuru, G. Fiorentini, E. Guastaldi, F. Mantovani, L. Mou, G.
Oggiano, A. Puccini, C. Rossi Alvarez, V. Strati, G. Xhixha & A. Zanon
To cite this article: M. Kaçeli Xhixha, M. Albèri, M. Baldoncini, G.P. Bezzon, G.P. Buso,
I. Callegari, L. Casini, S. Cuccuru, G. Fiorentini, E. Guastaldi, F. Mantovani, L. Mou, G. Oggiano, A. Puccini, C. Rossi Alvarez, V. Strati, G. Xhixha & A. Zanon (2015): Uranium distribution in the Variscan Basement of Northeastern Sardinia, Journal of Maps, DOI: 10.1080/17445647.2015.1115784
To link to this article: http://dx.doi.org/10.1080/17445647.2015.1115784
View supplementary material
Published online: 30 Nov 2015.
Submit your article to this journal
View related articles
ORIGINAL ARTICLE
Uranium distribution in the Variscan Basement of Northeastern Sardinia
M. Kaçeli Xhixhaa,b, M. Albèric,e, M. Baldoncinib,c,e, G.P. Bezzond, G.P. Busod, I. Callegarib,d, L. Casinif, S. Cuccuruf, G. Fiorentinic,e, E. Guastaldib,g, F. Mantovanic,e, L. Moud, G. Oggianof, A. Puccinif, C. Rossi Alvarezd, V. Stratib,c,d, G. Xhixhab,dand A. Zanond
a
Department of Engineering Sciences, Faculty of Professional Studies, University‘Aleksandër Moisiu’ Durrës, Durrës, Albania;bGeoExplorer Impresa Sociale S.r.l., Arezzo, Italy;cDepartment of Physics and Earth Sciences, University of Ferrara, Ferrara, Italy;dINFN, Legnaro National Laboratories, Padua, Italy;eINFN, Ferrara Section, Ferrara, Italy;fNature and Environment Department, University of Sassari, Sassari, Italy;
g
University of Siena, Center for GeoTechnologies, Arezzo, Italy
ABSTRACT
We present a detailed map of uranium distribution and its uncertainties in the Variscan Basement of Northeastern Sardinia (VBNS) at a scale of 1:100,000. An area of 2100 km2was
investigated by means of 535 data points obtained from laboratory and in situ gamma-ray spectrometry measurements. These data volume corresponds to the highest sampling density of the European Variscides, aimed at studying the genetic processes of the upper crust potentially triggered by an enrichment of radiogenic heat-producing elements. For the first time, the Kriging with Variance of Measurement Error method was used to assign weights to the input data which are based on the degree of confidence associated with the measurements obtained using different gamma-ray spectrometry techniques. A detailed tuning of the model parameters for the adopted Experimental Semi-Variogram led to the identification of a maximum distance of spatial variability coherent to the observed tendency of the experimental data. We demonstrate that the obtained uranium distribution in the VBNS, characterized by several calc-alkaline plutons emplaced within migmatitic massifs and amphibolite-facies metamorphic rocks, is an excellent benchmark for the study of ‘hot’ collisional chains. The uranium map of VBNS, and in particular the Arzachena minor pluton, confirms the emplacement model based on the recognition of the different petrological associations characterizing the Variscan magmatic processes in the Late Paleozoic. Furthermore, the presented model of the uranium content of the geological bedrock is a potential baseline for future mapping of radon-prone areas.
ARTICLE HISTORY Received 6 August 2015 Revised 7 October 2015 Accepted 30 October 2015 KEYWORDS Variscan-Sardinian batholith; in situ and laboratory gamma-ray spectroscopy; Kriging with Variance of Measurements Errors; Arzachena pluton; radiogenic heat-producing elements; Variscan granitoids 1. Introduction
The Variscan Basement of Northeastern Sardinia (VBNS) is a benchmark for the study of ‘hot’ colli-sional chains characterized by a high temperature– low pressure (HT–LP) gradient. Several processes might have enhanced the Variscan geotherm, such as (i) shear heating (Casini, Cuccuru, Puccini, Oggiano, & Rossi, 2015; Maino et al., 2015), (ii) the advection of hot, mantle-derived melts, (iii) the break-off of the mantle lithosphere (Li, Faure, & Lin, 2014) or (iv) the selective enrichment of radiogenic heat-producing elements, such as U, Th and K, in the crust (Lexa et al., 2011). The widespread late-Variscan magmatism in the Corsica-Sardinia Batholith (C-SB) has been occasionally explained in terms of enhanced radiogenic heating. The models that describe the efficiency of the processes depend strongly on the uranium content of the fertile crust (Bea, 2012). The heterogeneous distri-bution of uranium throughout the VBNS might be a proxy for investigating the applicability of thermal models based on the selective enrichment of radiogenic elements in the crust (Mohamud, Cózar, Rodrigo-Naharro, & Pérez del Villar, 2015; Tartèse, Boulvais,
Poujol, & Vigneresse, 2011). In addition, the outcrops in VBNS are the most accessible intrusive bodies for studying the geoneutrino signal in the Borexino exper-iment (Borexino Collaboration, 2015), which is par-ticularly sensitive to the U and Th contents and distributions in the Variscan continental crust (Coltorti et al., 2011).
Finally, this study has implications related to public health, as recent investigations (Bochicchio et al., 2005) show that the Sardinia region is characterized by high values of radon gas, monitored in 124 dwellings. Since for good bedrock exposure, as in the case of VBNS, the correlation between indoor radon concen-trations and uranium content of the underlying rocks increases, the results of this study potentially constitute a baseline for future mapping of radon-prone areas.
In this paper, we present a map of the eU distri-bution (this notation indicates equivalent uranium, as we assume secular equilibrium in the 238U decay chain) in the VBNS at a scale of 1:100,000 as support for further studies regarding the main geophysical, geo-chemical and geodynamic features of the continental crust in this region. This study is included in the
© 2015 V. Strati
CONTACT V. Strati [email protected]
framework of a research project which has already led to the production of the total natural radioactivity map of the Tuscany region (Callegari et al., 2013) and Veneto region (Strati et al., 2015).
The spatial model, together with its uncertainties, was obtained using the Kriging with Variance of Measurement Error method for 535 gamma-ray spec-trometry measurements. The eU distribution is dis-cussed in the geodynamic framework proposed by
Casini, Cuccuru, Puccini, et al. (2015), taking into account the petrological features of the C-SB, the com-positional variation and the emplacement timing of Variscan granitoids. Finally, we focus on the eU distri-bution measured in the granitoids of the Arzachena pluton, linking it to the emplacement mechanism pro-posed by Casini, Cuccuru, Maino, Oggiano, and Tie-polo (2012).
2. Geological setting
The Variscan belt of Western Europe resulted from the collision of Northern Gondwana and Laurussia in a time interval spanning from the Late Devonian to the Early Permian (∼380–270 Ma). The European Varis-can crust, including the Corsica-Sardinia massif, experienced several episodes of plutonic and volcanic activity with different petrochemical affinities (Corsini & Rolland, 2009;Finger, Roberts, Haunschmid, Scher-maier, & Steyrer, 1997).
The C-SB, with its ca. 12,000 km2area, constitutes one of the largest batholiths in south-western Europe, emplaced at approximately 40 Ma (Late Mississippian
Pennsylvanian-Early Permian). Three main magmatic suites can be recognized: a magnesium–potassium complex exposed only in northern Corsica, a peralu-minous calc-alkaline complex (Casini et al., 2012;
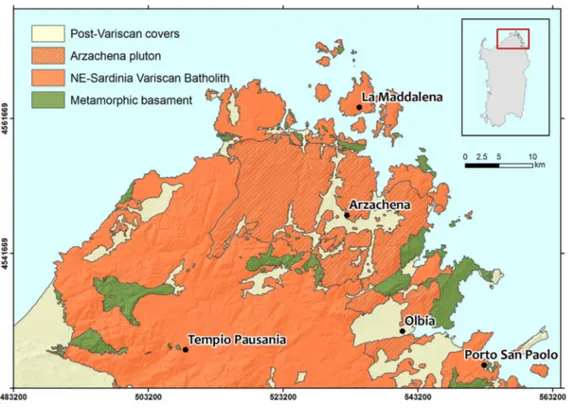
Rossi & Cocherie, 1991) and finally, a late to post-orogenic alkaline suite in the VBNS (Bonin, 2007). The 2100 km2of the VBNS (Figure 1) are character-ized by several calc-alkaline plutons and a few minor alkaline complexes emplaced within migmatites and amphibolite-facies of metamorphic rocks (Casini, Cuccuru, Maino, et al., 2015). According toCruciani, Franceschelli, Massonne, Carosi, and Montomoli (2013), the migmatites outcropping in the study area are related to high-pressure metamorphism that occurred in the Internal Nappes of the Sardinia Variscides at the age of the initial continent–conti-nent collision.
Both migmatites and the calc-alkaline plutons have been interpreted in terms of extensive crustal melting related to the establishment of an anomalous thermal gradient (Anderson, 2006). One of the main contributions to the high geothermal gradient, which is required to induce anatexis processes, originates from the enrichment of radiogenic heat-producing elements caused by several genetic processes, such as subduction of continental crust, crust-scale migmatization (Li et al., 2014), melt dehydration and segregation (Gerdes, Worner, & Henk, 2000). Understanding heat production and transfer mechanisms is relevant for modeling thermal-kinematic and exhumation processes (Lexa et al., 2011).
Figure 1. Geological sketch map of the VBSN (cartographic reference system WGS84 UTM ZONE 32N), modified from Casini, Cuccuru, Maino et al. (2015).
2 M. K. XHIXHA ET AL.
3. Methods
The 535 input data points used for producing the Main Map come from 167 rock sample measurements and 368 in situ measurements. The studies were planned based on the Geological map of Sardinia at a scale of 1:200,000 (Barca et al., 1996) and the structural map of Variscan Northern Sardinia at a scale of 1:100,000 (Casini, Cuccuru, Maino, et al., 2015).
The eU abundances in the rock samples collected from fresh outcrops were measured using the MCA-Rad system, a gamma-ray spectrometer equipped with two HPGe p-type detectors having a 60% relative coaxial efficiency and an energy resolution of approxi-mately 1.9 keV at 1332.5 keV (60Co) (Xhixha et al., 2013). The MCA-Rad system is shielded with a 10 cm thickness of copper and 10 cm thickness of lead so reducing the laboratory background by approxi-mately two orders of magnitude. The absolute peak energy efficiency of the MCA-Rad system is calibrated using certified reference materials (RGK_1, RGU_1 and RGTh_1) traceable by the International Atomic Energy Agency (IAEA) (Xhixha et al., 2015). The total uncertainty for the absolute peak energy efficiency is estimated to be less than 5%. Prior to measurement, each rock sample was crushed, homogenized and sealed in a cylindrical polycarbonate container of 180 cm3 volume. Then, the samples were left undis-turbed for at least four weeks to establish radioactive equilibrium in the 226Ra decay chain segment. Each sample was measured for 3600 seconds with a statisti-cal uncertainty generally less than 10% for eU. Less
than 2% of the measurements are below the minimum detection activity of∼2.5 Bq/kg.
In this study, a total of 368 in situ gamma-ray measurements were performed on granitic outcrops using a portable NaI(Tl) detector mounted in a back-pack to allow flexible operation (Figure 2), with an acquisition live time of 300 seconds. The NaI(Tl) detec-tor is of a cubic shape (10.2 cm × 10.2 cm × 10.2 cm) and has an energy resolution of 7.3% at 662 keV (137Cs) and 5.2% at 1172 and 1332 keV (60Co). The instrument was calibrated following the method of Full Spectrum Analysis with the Non-Negative Least Squares (FSA-NNLS) constraint, as described in
Caciolli et al. (2012). According to the FSA-NNLS method, each spectrum was reconstructed from a lin-ear combination of standard spectra for 238U, 232Th,
40K, 137Cs and for the background. The uncertainty
of the method is estimated to be 5% for 40K and 7% for 232Th, with relatively higher uncertainty for 238U of approximately 15%. In Caciolli et al. (2012), the coefficient of correlation (0.87 ± 0.12) between the eU values obtained by NaI(Tl) and HPGe is compatible with unity at the 1 sigma level. Despite this strong agreement between the two acquisition methods, it is well known (IAEA, 2003) that in situ gamma-ray measurements are susceptible to many sources of ‘noise’: the geometry of the investigated area, the pres-ence of atmospheric radon, the soil moisture content, the weathering and the outcrop exposure can affect the gamma signal, decreasing the precision of the study.
Because in our study we include thefield measure-ments, relevant precautions were taken to ensure the reliability of our data. Indeed, we avoided acquiring data immediately after rainfall and preferredflat out-crops far from man-made constructions (Figure 2).
In the U decay chain, disequilibrium occurs when one or more isotopes are completely or partially removed or added to the system. Because gamma-ray spectroscopy is a method that detects the gamma emit-ter daughemit-ters of uranium, secular equilibrium of the decay chains is commonly assumed and is reported as the equivalent uranium (eU).
Table 1. Uranium average abundance U (µg/g), standard deviation σ (µg/g) and goodness of fit (normalized χ2) obtained with normal and lognormal probability density functions applied to all data and both datasets (i.e. HPGe and NaI(Tl)).
Normal distribution
Lognormal distribution Dataset Number of records U ± σ (μg/g) χ2 U ± σ (μg/g) χ2 HpGe 167 3.5 ± 1.9 1.7 2.9+3.3−1.5 4.3 NaI(Tl) 368 5.2 ± 2.2 6.0 4.8+2.4−1.6 0.5 All data 535 4.7 ± 2.3 4.5 4.1+3.3−1.8 6.1
Figure 2.Field measurements using the portable NaI(TI) detector.
4. Mapping radiometric data
The map of eU distribution in the VBNS, at a spatial resolution of 100 m × 100 m, was obtained using the Ordinary Kriging with all the 535 measurements acquired by HPGe and NaI(Tl) (Figure 3) using the Kriging method. The frequency distribution and
principal statistical parameters of the input data and the output model are reported on the Main Map.
The exploratory statistical analysis highlights that the HPGe and NaI(Tl) data are characterized by fre-quency distributions (Figure 4) described by the stat-istical parameters reported inTable 1. We emphasize that the distributions are affected by a sampling bias
Figure 3.Locations of the 167 collected rock samples and the 368in situ measurements (cartographic reference system WGS84 UTM ZONE 32N).
Figure 4.The frequency distributions of the eU abundances (μg/g) in rock samples (red) and in situ measurements (blue).
4 M. K. XHIXHA ET AL.
because each lithology was not investigated using the same number of records in the two datasets: this is par-ticularly clear in observing the tails of the distributions. In fact, the quartzites and amphibolites of the meta-morphic basement are characterized by the lowest uranium concentrations (<2 µg/g) and were mainly investigated with HPGe measurements because they are badly exposed and poorly suited to in situ measure-ments. In contrast, the highest values in Figure 4 are found in the U-rich monzogranites (∼9 µg/g) of the La Maddalena pluton (Casini, Cuccuru, Maino, et al., 2015), investigated mostly with in situ studies.
Since the distribution of the input data shows a skewness value close to unity, the study of the spatial variability was performed without any normal trans-formation of the uranium abundances. A detailed analysis of the directional Experimental Semi-Vario-grams (ESV) highlighted an isotropic experimental variability without any preferred directions. Therefore, an omnidirectional ESV made up of 9 lags of 2.2 km
was computed and modeled using a trial-and-error procedure (Figure 5). Since we are interested in small-scale variability of U abundances, the parameters used for the ESV modeling were tuned for optimizing the fit in the first lags of the ESV. The nugget effect (1.7μg2/g2), contributing approximately 30% of the total amount of spatial variability, and the maximum distance of spatial variability equal to 4.8 km are in excellent agreement with the observed tendency of the experimental data. The goodness-of-fit of the ESV model was checked via a cross-validation procedure. The results are reported inTable 2, together with the parameters of the structures of variability used for the ESV modeling.
The estimation process, performed with Geovar-iances ISATIS®software, takes into account the overall uncertainties of the two methods of gamma-ray measurements as the known Variance of Measure-ments Error of the input data. In particular, we con-sidered an overall uncertainty of 5% for each HPGe measurement and a conservative uncertainty of 20% in the case of the NaI(Tl) measurements. This method-ology, known as Kriging with Variance of Measure-ment Error, allows for assigning different weights to the input considering the degree of confidence of the measurements, thus improving the quality of the esti-mations (Deraisme & Strydom, 2009).
The accuracy of the spatial model in terms of the variance normalized with respect to the estimated values is reported in the Main Map with contour lines. The chromatic variations in the color ramp of
Table 2.Parameters of the structures of variability used for the model fitted on the ESV; results of the cross-validation procedure in terms of the Mean of Standardized Errors (MSE) and the Variance of Standardized Errors (VSE).
ESV model parameters
Cross-validation
results Structures of variability Range (km) Sill (µg/g)2 MSE VSE Nugget effect model – 1.7
First spherical model 3.4 2.4 −0.04 0.74 Second spherical model 1.4 0.8
Figure 5.Modelfitted for the ESV calculated with 9 lags of 2.2 km.
the legend were assigned to specific values of eU con-centration. In particular, they correspond to the 20th, 35th, 45th, 55th, 65th, 75th and 80th percentiles calcu-lated for the entire dataset of 535 measurements.
5. The Arzachena pluton
In this section, we present a specific focus on the eU distribution in the Arzachena pluton (AZN), a refer-ence calc-alkaline massif of the VBNS.
The AZN is an elongated pluton that consists of three concentric granitic shells (Oggiano et al., 2005). The pluton shows reverse zonation: the more mafic terms (medium-grained granodiorite) are exposed in the core, along the southern margin of the pluton, whereas the external part is composed of felsic rocks, such as porphyritic biotite–monzogranite and fine-grained leuco-monzogranites. This last type of rock represents the more evolved magmatic products and is mainly localized in the peripheral zone of the pluton, exposed to the north (Casini et al., 2012).
InFigure 6, we use the cartographic boundaries of the three granitic shells to distinguish and analyze the range of eU concentrations of the different petrological associations related to the magmatic differentiation during magma emplacement. The mean and 1σ uncer-tainty of the input data and of the spatial model are reported for the three rock types. The granodiorites are characterized by lower eU concentrations (3.4 ± 0.4 µg/g). Monzogranites and leuco-monzogranites are enriched in eU content, with average values of 4.3 ± 0.8 µg/g and 4.9 ± 0.7 µg/g, respectively. This
distribution defines a clear geochemical trend charac-terized by eU values that increase in felsic rocks. The eU distribution within the AZN supports a strong posi-tive correlation between the presence of U-bearing accessory minerals (e.g. zircons, monazite and xeno-time) and the evolution of magmatic systems ( Pérez-Soba, Villaseca, Orejana, & Jeffries, 2014). Indeed, melting processes and melt extraction remove a large amount of radioactive elements from the magmatic system that are hosted by accessory minerals in which uranium can substitute other cations with a similar ionic radius and occasionally equal valences (e.g. Ca, trivalent REE, Zr and Y) (Mohamud et al., 2015; Pagel, 1982; Peiffert, Nguyen-Trung, & Cuney, 1996).
These results confirm the conceptual model pro-posed inCasini et al. (2012), which explains the distri-bution of Large-Ion Lithophile Elements (LILE) within AZN in terms of in situ progressive differentiation of anatectic melts sourced from a compositionally hetero-geneous lower crust. The obtained eU distribution in the AZN agrees with the emplacement history and plu-ton evolution described in the proposed thermo-mech-anical model.
6. Conclusions
In this study, we present a 1:100,000 scale map of eU abundance distribution in the Variscan Basement, which occupies a total area of 2100 km2in Northeast-ern Sardinia. The spatial model was obtained perform-ing Krigperform-ing on the 535 gamma-ray measurements and
Figure 6.The eU distribution map in the Arzachena pluton with cartographic boundaries of the three different magmatic bodies. The mean and 1σ uncertainty of eU abundances of the input data and the output model are reported for each petrological associ-ation (cartographic reference system WGS84 UTM ZONE 32N).
6 M. K. XHIXHA ET AL.
is reported together with the uncertainties of the estimations.
Following a detailed statistical analysis performed on the input dataset consisting of 167 laboratory measurements (HPGe) and 368 in situ measurements (NaI(Tl)), the spatial variability of eU abundance was studied with the computation and modeling of an omnidirectional ESV (9 lags of 2.2 km). The map was produced using the Kriging with Variance of Measure-ment Error method, a geostatistical tool that allows for the combination of eU abundances with different levels of confidence associated with the two different gamma-ray spectroscopy methods.
The map shows the highest values in the granitoids of the La Maddalena pluton, where the eU content ranges between 6.2 and 9.3 µg/g. However, in the meta-morphic basement, outcropping in the southwest of the study area (Figure 1), the presence of eclogites intruded in the migmatitic orthogneisses contributes to the low-est uranium abundances (<2 µg/g).
We suggest that the distribution of eU content is related to the Post-Variscan brittle structure, reported in Casini, Cuccuru, Maino, et al. (2015), that affects the metamorphic units and the plutons of the VBNS. In particular, in the Tempio Pausania pluton (south-west of the study area), the major NE–SW faults corre-spond to anomalies in eU distribution and mark an area with higher eU content (5–7 µg/g) compared to the adjacent sectors of the pluton with lower eU con-tent (∼3.5 µg/g).
In the AZN, the eU content increases in the more differentiated rocks. This behavior can be verified in the spatial model, even if the ranges of the estimated values for granodiorites, monzogranites and leuco-monzogranites are affected by the ‘smoothing effect’ typically associated with the Kriging method.
The presented map, integrated with available and more detailed geological maps, is a useful tool for studying the assembly of the intruded plutons and the relationships between the different petrological associations, based on eU behavior during crustal mag-matic processes. Indeed, the study of eU distribution in the VBNS, particularly in the AZN, could help to refine existing models explaining the post-collisional mag-matic processes of the southern European Variscides.
We emphasize that about 90% of the territory of the VBNS is characterized by eU concentrations higher than the average upper continental crust abundance (2.7 µg/g) (Rudnick & Gao, 2003). Since uranium-rich rocks are generally the main source of radon and the presented distribution is a primary criterion for identifying radon-prone areas. Although radon migration depends on many geophysical parameters (e.g. porosity, fractures and permeability of rocks), the assessment of radon gas emission from the under-lying bedrock is strongly recommended for mapping the Radon risk, which could be relevant in coastal
areas where the tourism enhances the population den-sity especially in the summer.
Software
The geostatistical analysis was performed using Geo-variances ISATIS®. The map was produced using the Esri ArcGIS 9.3.
Acknowledgements
The authors are extremely grateful to L. Carmignani, T. Colonna, P. Conti and W.F. McDonough who pro-vided insight and expertise that greatly assisted the research. The authors would also like to thank B. Ricci and E. Lisi for comments that considerably improved the manuscript.
Disclosure statement
No potential conflict of interest was reported by the author (s).
Funding
This work was partially supported by the Italian Istituto Nazionale di Fisica Nucleare (INFN) through the ITALian RADioactivity project (ITALRAD) and the research grant Theoretical Astroparticle Physics number 2012CPPYP7 under the program PRIN 2012 funded by the Ministero del-l’Istruzione, Università e della Ricerca (MIUR).
References
Anderson, D. L. (2006). Speculations on the nature and cause of mantle heterogeneity. Tectonophysics, 416(1–4), 7–22.
doi:10.1016/j.tecto.2005.07.011
Barca, S., Carmignani, L., Oggiano, G., Pertusati, P., Salvatori, I., & Carmignani, L. (1996). Carta geologica della Sardegna, Servizio Geologico Nazionale. Firenze: Litografia Artistica Cartografica.
Bea, F. (2012). The sources of energy for crustal melting and the geochemistry of heat-producing elements. Lithos, 153, 278–291.doi:10.1016/j.lithos.2012.01.017
Bochicchio, F., Campos-Venuti, G., Piermattei, S., Nuccetelli, C., Risica, S., Tommasino, L.,… Cappai, M. (2005). Annual average and seasonal variations of residential radon concentration for all the Italian regions. Radiation Measurements, 40(2–6), 686–694.doi:10.1016/j.radmeas. 2004.12.023
Bonin, B. (2007). A-type granites and related rocks: Evolution of a concept, problems and prospects. Lithos, 97(1–2), 1–29.doi:10.1016/j.lithos.2006.12.007
Borexino Collaboration. (2015). Spectroscopy of geo-neutri-nos from 2056 days of Borexino data. Submitted to Physical Review D.http://arxiv.org/abs/1506.04610
Caciolli, A., Baldoncini, M., Bezzon, G. P., Broggini, C., Buso, G. P., Callegari, I.,… Xhixha, G. (2012). A new FSA approach for in situ γ ray spectroscopy. Science of the Total Environment, 414, 639–645. doi:10.1016/j. scitotenv.2011.10.071
Callegari, I., Bezzon, G. P., Broggini, C., Buso, G. P., Caciolli, A., Carmignani, L.,… Zanon, A. (2013). Total natural radioactivity, Tuscany, Italy. Journal of Maps, 9(3), 438– 443.doi:10.1080/17445647.2013.802999
Casini, L., Cuccuru, S., Maino, M., Oggiano, G., Puccini, A., & Rossi, P. (2015). Structural map of Variscan northern Sardinia (Italy). Journal of Maps, 11(1), 75–84. doi:10. 1080/17445647.2014.936914
Casini, L., Cuccuru, S., Maino, M., Oggiano, G., & Tiepolo, M. (2012). Emplacement of the Arzachena Pluton (Corsica–Sardinia Batholith) and the geodynamics of incoming Pangaea. Tectonophysics, 544–545, 31–49.
doi:10.1016/j.tecto.2012.03.028
Casini, L., Cuccuru, S., Puccini, A., Oggiano, G., & Rossi, P. (2015). Evolution of the Corsica–Sardinia Batholith and late-orogenic shearing of the Variscides. Tectonophysics, 646, 65–78.doi:10.1016/j.tecto.2015.01.017
Coltorti, M., Boraso, R., Mantovani, F., Morsilli, M., Fiorentini, G., Riva, A.,… Chubakov, V. (2011). U and Th content in the central Apennines continental crust: A contribution to the determination of the geo-neutrinos flux at LNGS. Geochimica et Cosmochimica Acta, 75(9), 2271–2294.doi:10.1016/j.gca.2011.01.024
Corsini, M., & Rolland, Y. (2009). Late evolution of the southern European Variscan belt: Exhumation of the lower crust in a context of oblique convergence. Comptes Rendus Geoscience, 341(2–3), 214–223. doi:10. 1016/j.crte.2008.12.002
Cruciani, G., Franceschelli, M., Massonne, H.-J., Carosi, R., & Montomoli, C. (2013). Pressure–temperature and
deformational evolution of high-pressure metapelites from Variscan NE Sardinia, Italy. Lithos, 175–176, 272– 284.doi:10.1016/j.lithos.2013.05.001
Deraisme, J., & Strydom, M. (2009). Estimation of iron ore resources integrating diamond and percussion drillholes. APCOM.
Finger, F., Roberts, M. P., Haunschmid, B., Schermaier, A., & Steyrer, H. P. (1997). Variscan granitoids of central Europe: Their typology, potential sources and tecto-nothermal relations. Mineralogy and Petrology, 61(1–4), 67–96.doi:10.1007/BF01172478
Gerdes, A., Worner, G., & Henk, A. (2000). Post-collisional granite generation and HT-LP metamorphism by radio-genic heating: The Variscan South Bohemian Batholith. Journal of the Geological Society, 157(3), 577–587.
doi:10.1144/jgs.157.3.577
IAEA. (2003). Guidelines for radioelement mapping using gamma ray spectrometry data. IAEA-TECDOC-1363.
Lexa, O., Schulmann, K., JanoušEk, V., Štípská, P., Guy, A., & Racek, M. (2011). Heat sources and trigger mechanisms of exhumation of HP granulites in Variscan orogenic root. Journal of Metamorphic Geology, 29(1), 79–102. doi:10. 1111/j.1525-1314.2010.00906.x
Li, X.-H., Faure, M., & Lin, W. (2014). From crustal anatexis to mantle melting in the Variscan orogen of Corsica (France): SIMS U–Pb zircon age constraints. Tectonophysics, 634(0), 19–30.doi:10.1016/j.tecto.2014.07.021
Maino, M., Casini, L., Ceriani, A., Decarlis, A., Di Giulio, A., Seno, S.,… Stuart, F. M. (2015). Dating shallow thrusts with zircon (U-Th)/He thermochronometry–the shear heating connection. Geology, 43(6), 495–498. doi:10. 1130/g36492.1
Mohamud, A. H., Cózar, J. S., Rodrigo-Naharro, J., & Pérez del Villar, L. (2015). Distribution of U and Th in an Iberian U-fertile granitic complex (NW, Spain): Airborne-radiometry, chemical and statistical approaches. Journal of Geochemical Exploration, 148, 40–55. doi:10. 1016/j.gexplo.2014.07.022
Oggiano, G., Cherchi, G., Aversano, A., Di Pisa, A., Ulzega, A., Orrù, P., & Pintus, C. (2005). Note illustrative della Carta Geologia d’Italia, Foglio 428 Arzachena. S. EL. CA, Firenze.
Pagel, M. (1982). The mineralogy and geochemistry of uranium, thorium, and rare-earth elements in two radio-active granites of the Vosges, France. Mineralogical Magazine, 46(339), 149–161. doi:10.1180/minmag.1982. 046.339.01
Peiffert, C., Nguyen-Trung, C., & Cuney, M. (1996). Uranium in granitic magmas: Part 2. Experimental deter-mination of uranium solubility and fluid-melt partition coefficients in the uranium oxide-haplogranite-H2
O-NaX (X = Cl, F) system at 770°C, 2 kbar. Geochimica et Cosmochimica Acta, 60(9), 1515–1529. doi:10.1016/ 0016-7037(96)00039-7
Pérez-Soba, C., Villaseca, C., Orejana, D., & Jeffries, T. (2014). Uranium-rich accessory minerals in the peraluminous and perphosphorous Belvís de Monroy pluton (Iberian Variscan belt). Contributions to Mineralogy and Petrology, 167(5).doi:10.1007/s00410-014-1008-4
Rossi, P., & Cocherie, A. (1991). Genesis of a Variscan bath-olith: Field, petrological and mineralogical evidence from the Corsica-Sardinia batholith. Tectonophysics, 195(2–4), 319–346.doi:10.1016/0040-1951(91)90219-I
Rudnick, R. L., & Gao, S. (2003). Composition of the conti-nental crust. In R. L. Rudnick (Ed.), The crust, Vol. 3 trea-tise on geochemistry (pp. 1–64). Oxford: Elsevier. Strati, V., Baldoncini, M., Bezzon, G. P., Broggini, C., Buso,
G. P., Caciolli, A.,… Zanon, A. (2015). Total natural radioactivity, Veneto (Italy). Journal of Maps, 11(4), 545–551.doi:10.1080/17445647.2014.923348
Tartèse, R., Boulvais, P., Poujol, M., & Vigneresse, J.-L. (2011). Granite petrogenesis revealed by combined gravi-metric and radiogravi-metric imaging. Tectonophysics, 501(1– 4), 98–103.doi:10.1016/j.tecto.2011.02.003
Xhixha, G., Alberi, M., Baldoncini, M., Bode, K., Bylyku, E., Cfarku, F.,… Kaçeli, M. X. (2015). Calibration of HPGe detectors using certified reference materials of natural ori-gin. Journal of Radioanalytical and Nuclear Chemistry.
doi:10.1007/s10967-015-4360-6
Xhixha, G., Bezzon, G. P., Broggini, C., Buso, G. P., Caciolli, A., Callegari, I.,… Shyti, M. (2013). The worldwide NORM production and a fully automated gamma-ray spectrometer for their characterization. Journal of Radioanalytical and Nuclear Chemistry, 295(1), 445–457.
doi:10.1007/s10967-012-1791-1 8 M. K. XHIXHA ET AL.
URANIUM DISTRIBUTION IN THE VARISCAN BASEMENT OF NORTHEASTERN SARDINIA
Tyrrhenian
Sea
I TA LY
I TA LY
FRANCE
Corsica
Corsica
Sardinia
Sardinia
12° E
10° E
8° E
44° N
42° N
40° N
Scale 1:100,000
! ( ! ( !( ! (!( !( !( ! ( ! ( !( ! ( !( !( !( ! ( !( !( ! (!( !( !( ! ( ! ((!(!(!(!!((!(!!((!(!!(!(!(!(!(!(((!! !( (! !( ! ( !( !( !( !( ! ( ! (!( !(!( !( !( ! ( ! ( !( ! ( !( !( !( !( ! (!( !( !(!( !( !( ! ( ! ( !(!( !( !( !( !( ! ( !( !( ! (!( ! ( ! ( !( ! ( !( !( !(!( ! ( !( !( !( !( !( !( !( ! ( ! ( !( !( !( ! ( ! ( !( !( !( ! ( !( ! ( ! ( !( !( !( !( ! ( ! ( !( !( ! (!( !(!( ! ( (! (! !( (!!(!(!(!(!(!(!((!(! !( (! ! ( ! ( ! (!( !( !( !( ! ( !( ! ( !( !( ! ( ! ((! !( !((! (!(!(!!((! (! !((!!((! (! (! (! (! (!!(!( (! (! (! !( (! ! ( ! ( ! ( !( !(!( !( ! ( ! (!( ! ( !( !( !( ! ( (! !( !( !(!(!( !( !(!(!( (! ! ( !( !( ! ( ! ( ! ( !( ! ( !( !( !( !( !( ! ( !( !(!(!( !(!( ! (!( ! ( !( !( ! ( !( ! ( !( ! ( !( !( !( !(!(!( ! ( ! ( ! ( ! ( !( !( !( ! ( !( !( !( !( !( ! ( ! ( ! ((!!( !( (!(! !( !( !( (! !( !( ! ( !( ! ( !( !( !( ! ( !(!( ! ( !(!( !(!( !( ! ( !( ! ( !( !( ! ( !( !( !( ! ( ! (!( !( !( !( (!!( !( !( ! ( ! ( !( ! ( ! (!( !( ! ( !( !( !( !( !( !( !( ! ( ! ( !( !( !( ! ( !( !( !( !( !( ! ( ! ( !( !( !( !( !( ! ( ! ( ! ( !( !( !( ! ( !( ! ( !(!(!( ! ( ! ( !(!( !( ! ( !( !( !( ! ( ! ( ! ( !( ! ( ! ( !( # * # * #* # * #*#* #* #* #* # * # * # * # * # *#* #* #* # * # * # * # * #**# *###***# #* #*#* #* #* *#*#*##*#**# *# # **# #*#*#**#*#*# #* #*#* # * # *#* # * #*#* # *#* # *#* #*#* # * # *#* #* #* #* # * # * #* #*#* #* # * #* #* #* *# ##** #* #* # * #* #*#* #*#* #* #* # *#* #*#*#**#*# *# #*#* #* # * #* *# #* #*#*#* *# #* # * # * # * # * # * #* #*#*#* #* # * #*#*#***###* #* #* # * #* #* #* #*#* #* # * #*#*#* #* # * #*#*#* # * #* #* #* #* # *#*#* #* #* # * # * # * # * # * # * # * # * # * # * # * " " " " " "Olbia
Arzachena
La Maddalena
Porto San Paolo
Tempio Pausania
9.6°
9.4°
9.2°
9°
41.2°
41°
CARTOGRAPHIC REFERENCE SYSTEM WGS 84 UTM ZONE 32 - CARTESIAN LATTICE IN BLACK
GEOGRAPHIC COORDINATES REFER TO THE WGS 84 - GEODETIC SYSTEM IN BLUE
! ! ! ! ! ! ! ! ! ! ! ! ! ! ! ! ! ! ! ! ! ! ! ! ! ! ! ! ! ! ! ! Variscan Basement of Northeastern Sardinia
OLBIA
TEMPIO PAUSANIA
Palau
Luras
Telti
Bulzi
Badesi
Aggius
Trudda
Stagnali
Aglientu
Viddalba
Arzachena
Paduledda
Luogosanto
Valledoria
Porto Cervo
Calangianus
Bortigiadas
Murta Maria
La Maddalena
Golfo Aranci
Montepetrosu
Baja Sardinia
Porto San Paolo
Isola di Tavolara
Santa Teresa Gallura
Santa Maria Coghinas
Sant'Antonio di Gallura
Trinità d'Agultu e Vignola
50
40
60
30
70
80
100
20
60
30
40
30
40
50
50
30
60
60
40
40
40
80
60
30
40
30
50
40
50
50
40
60
40
30
40
40
40
60
30
80
70
30
50
80
30
30
30
40
50
40
30
40
40
30
40
50
50
40
50
30
40
40
40
40
30
40
40
30
40
40
40
40
40
40
30
40
40
60
40
40
30
40
30
30
481226
481226
501226
501226
521226
521226
541226
541226
561226
561226
4520545
4520545
4540545
4540545
4560545
4560545
9.7°
9.7°
9.5°
9.5°
9.3°
9.3°
9.2°
9.2°
9°
9°
8.8°
8.8°
41.3°
41.3°
41.2°
41.2°
41°
41°
# *Rock samples
! (In situ measurements
Mean Standardized Errors
-0.04
Variance Standardized Errors
0.74
Structures of variability Range [km] Sill [µg/g]
2Nugget effect model
-
1.7
1
stSpherical model
3.4
2.4
2
ndSpherical model
1.4
0.8
C) Parameters of the model
D) Cross Validation results
A) Frequency distribution input
E) Frequency distribution output
0
5
10
km
Descriptive notes
© Journal of Maps, 2015
Tyrrhenian
Sea
²
B) Modeling the ESV
0
1
2
4
6
8
10
Kilometres
0.0 0.5 1.0 1.5 2.0 2.5 3.0 3.5 4.0 0.7 1.2 1.7 2.2 2.7 3.2 3.7 4.2 4.7 5.1 5.6 6.1 6.6 7.1 7.6 8.1 8.6 9.1Fr
eq
ue
nc
y
(%
)
eU (µg/g)
Percentiles
20
th35
th45
th55
th65
th75
th80
thRecords
210095
Minimum
0.7 µg/g
Maximum
9.3 µg/g
Mean
4.7 µg/g
Median
4.6 µg/g
St. deviation
0.9 µg/g
Variance
0.8 (µg/g)
2Skewness
0.4
Kaçeli Xhixha M.
a,b
, Albèri M.
c,e
, Baldoncini M.
b,c,e
, Bezzon G.P.
d
, Buso G.P.
d
, Callegari I.
b,d
, Casini L.
f
, Cuccuru S.
f
, Fiorentini G.
c,e
,
Guastaldi E.
b,g
, Mantovani F.
c,e
, Mou L.
d
, Oggiano G.
f
, Puccini A.
f
, Rossi Alvarez C.
d
, Strati V.
b,c,d
, Xhixha G.
b,d
, Zanon A
d
.
a
University “Aleksandër Moisiu” Durrës, Department of Engineering Sciences, Faculty of Professional Studies, Str. Currila 1, 2000 - Durrës, Albania.
b
GeoExplorer Impresa Sociale S.r.l., Via E. Vezzosi, 15, 52100 - Arezzo, Italy.
c
University of Ferrara, Department of Physics and Earth Sciences, Via Saragat 1, 44122 - Ferrara, Italy.
d
INFN, Legnaro National Laboratories, Viale dell’Università, 2, 35020 - Legnaro, Padova, Italy.
e
INFN, Ferrara Section, Via Saragat 1, 44122 - Ferrara, Italy.
f
University of Sassari, Nature and Environment Department, Via Piandanna 4, 07100 - Sassari, Italy.
g
University of Siena, Center for GeoTechonologies, Via Vetri Vecchi 34, 52027 - San Giovanni Valdarno, Arezzo, Italy.
The spatial model of the uranium distribution, together with the
uncertainties, in the Variscan Basement of Northeastern Sardinia
was obtained by applying the Kriging method to 535 gamma-ray
measurements [A]. The study area of approximately 2100 km
2was investigated through the collection of 167 rock samples and
368 in situ measurements, achieving a total average sample
distribution of one data per 4 km
2.
An omnidirectional Experimental Semi-Variogram (ESV)
composed by 9 lags of 2.2 km [B] was computed and modeled
[C], and a cross validation procedure was performed to assess
the model accuracy [D]. The overall uncertainties of the two
types of gamma-ray measurements are taken into account in the
estimation process, introduced as the Variance of Measurements
Error variable that contains the amount of uncertainty at the
sample locations. The accuracy of the spatial model in terms of
the variance normalized with respect to the estimated values is
reported in the Main Map with contour lines.
The chromatic variations in the color ramp of the legend
correspond to the 20
th, 35
th, 45
th, 65
th, 55
th, 75
thand 80
thpercentiles calculated from the entire dataset of 535
measurements[E].
Percentile
eU (µg/g)
80
55
65
75
45
0
20
35
100
6.2
4.7
5.2
5.8
4.2
0.1
2.9
3.7
17.9
Legend
!Towns
CITIES
Unsampled areas
Normalized estimation errors (%)
Post-Variscan faults (inferred)
40
0 1 2 3 4 5 6 0 5000 10000 15000Va
ria
nc
e
(µ
g/
g)
2Distance (m)
Omnidirectional ESV and number of pairs contributing to the variogram value
ESV model A priori variance 791 2438 3864 4789 5840 7100 8488 9308 8885 0 2 4 6 8 10 12 14 16 18 20 1 2.8 4.6 6.4 8.2 10 11.8 13.6 15.4 17.2