1
UNIVERSITY OF MESSINA
DEPARTMENT OF ECONOMICS (SEAM)
DOCTORAL PROGRAMME IN ECONOMICS, STATISTICS AND MANAGEMENT
EFFICIENCY IN AIRPORTS MANAGEMENT:
A TWO STAGE ANALYSIS APPLIED TO ITALIAN AIRPORTS.
Doctoral Dissertation of:
Valentina Recupero
Tutor:
Prof. Edoardo Otranto
Co-tutor:
Prof. Andrea Cirà
2
CONTENT
Introduction ... 4
1st Paper ... 9
HAVING A LOOK AT THE DATA ENVELOPMENT ANALYSIS ... 9
Introduction ... 9
1.1 The DEA’s story ... 10
1.2 Literature review ... 15
1.3 DEA analysis: the Farrell’s contribution ... 17
1.4 Input/output oriented model ... 19
1.5 The different DEA models ... 21
1.5.1 The CCR model ... 23
1.5.2 The BCC model ... 26
1.5.3 Returns to Scale... 30
1.5.4 The Additive Model ... 31
Conclusion ... 33
2nd Paper ... 35
EFFICIENCY IN AIRPORT MANAGEMENT. ... 35
A MODEL ANALYSIS APPLIED TO ITALIAN AIRPORTS. ... 35
Introduction ... 35 2.1 Literature ... 37 2.2 Methodology ... 39 2.3 Data ... 41 2.4 Results ... 46 2.4.1 Performance analysis ... 47 2.4.2 Performance breakdown ... 51 Conclusion ... 53
3
3rd Paper ... 55
EFFICIENCY IN THE ITALIAN AIRPORTS MANAGEMENT. ... 55
APPLYING A SECOND STAGE ANALYSIS. ... 55
Introduction ... 55
3.1 Literature review ... 57
3.2 How to improve DEA using a Tobit regression model... 59
3.3 Results of regression analysis ... 62
Conclusion ... 66
General Conclusion ... 68
Acknowledgement ... 70
4
Introduction
Air transport is one of the main drivers of the economy, as it creates jobs and it improves the accessibility, making some geographic area more attractive and competitive. It should be noted, indeed, that the presence of efficient airport infrastructures caused the development of activities such as hotel and tourism services, facilitating, above all, commercial transactions and workers' mobility. It is clear therefore that air transport business and consequently airport management are a source of significant positive externality for the territory on which an airport infrastructure is located, contributing to economic and employment growth.
The importance of the air transport system for the development of the country imposes a strategic and systemic vision of the airport network which include a single trans-European transport network (TEN-T). The Ministry for Infrastructure and Transport (MIT) issued the National Airports Program since 2012, definitively approved by the "Conferenza permanente per i rapporti tra lo Stato, le Regioni e le Province autonome di Trento e di Bolzano" on February 2015. For the first time the "National Airport Program" suggested systemic vision of the Italian airport network, being an useful instrument in order to identify the public investment strategy in the connection infrastructure between airports.
During the last decade the increasing strategic importance of airports in the movement of people and cargo in the globalized world increased considerably. The air transport industry has been characterized by structural changes related both to the regulatory framework and to the market scenario.
With reference to the regulatory framework, European regulation - largely transposed by the national legislator - has been aimed at the air transport liberalization and the reduction of the local monopoly in the airports management/ownership. In particular, in the airport sector, the legislator aimed at stimulating competition in both aeronautical and commercial activities managed by airport operators. The deregulation and liberalization process caused the increase of the competition among airlines placing airports in a much more competitive environment. As result, airports are now under pressure to upgrade their efficiency taking as benckmark the one of their competitors. As effect of the liberalization process in the EU air transportation market, indeed, European airlines can now provide intra-European connections without restrictions since there is slot availability. As a result, considering all the 460 airports of the 18 countries that belonged to the European Common Aviation Area (ECAA) in 1997, the total number of connections among these airports rose from 3.410 in 1997 to 4.612 in 2008. This implies a compounded annual growth rate of 2.78%, with the number of connecting flights increasing from 4.102.484 to 5.228.688 (Scotti et al, 2012). In this
5 context of network expansion airports have to compete both directly for airlines and indirectly for passengers and freights and it emerged, also, an airline new business models, the low cost carries (LCC), which had a relevant driver in airport costs. This involved that travellers had the possibility now to choose their travel suppliers from different airlines at the same airport (direct competition) or from ones operating at nearby ones (indirect competition).
Furthermore, the privatization and a commercialization process has affected many airports so that non-aeronautical revenues have become the main income source for many airports (Bracaglia et al., 2014; Graham, 2009). In this context, airports have been restructured in order to attract private investments, search for new sources of revenues and attract full service or low-cost carriers (Starkie, 2002).
With reference to the market scenario, the decade from 2006 to 2016 - which is the focus of this analysis - has been characterized not only, as already sad, by the low cost carriers development which contributed to increasing passenger volumes and the regional airports significancy but even by the economic and financial crisis, which began in 2008 leading to a fall in the volume of goods and passengers transported, and the intermodal competition between air transport and high-speed rail transport, which in part withdrawn air transport market share especially on domestic routes but on the contrary it supported some airports access by increasing their consumer base.
In this scenario, airport benchmarking is one of the way to drive airports towards the frontier of the best practices (De Borger et al., 2002). For this reason, it has become of increasing concern and source of debate for both academics and practitioners (Liebert and Niemeier, 2013). The comparison of decision-making units (DMUs), such as airports, indeed, has become a popular tool in order to improve their efficiency so they can survive in a competitive environment. There has been an increasing of study using Data Envelopment Analysis (DEA) to benchmark airport efficiency. Others used stochastic frontier models (SFA) in order to analyse airports. Some other papers compare the DEA model with the SFA model. Recent studies included in the analysis environmental factors which cannot be controlled by the airport but may influence the production process. This is particularly relevant for the airport industry, characterized by regulatory constraints (Rate of Return, Price Cap, Single Till or Dual till), downstream market structure (high or low airline concentration), type of competitive environment (competitive versus monopolistic airports, HSR pressure), type of ownership (private, public, mixed) and so on (D'Alfonso et al., 2015). These factors can be included in the analysis as exogenous variables that can help to detect and analyse influential factors which may affect airports’ productivity patterns, to explain the (in)efficiency differentials, as well as to improve policy decisions.
6 Referring to Italian airports, it is noted that the most popular analysis methodology was the DEA. In particular, among others Barros and Dieke (2008) applied the two-stage analysis of Simar and Wilson (2007) in order to estimate which factors are able to affect the efficiency of 31 airports from 2001 to 2003. Curi et al. (2011) implemented a bootstrapping procedure analysing DEA outcomes of 18 Italian airports from 2000 to 2004 in the case of constant return to scale having regard to operations and financial activities. Subsequently, Gitto and Mancuso (2012) developed the Barros and Dieke’s analysis (2008) by employing a DEA analysis on 28 Italian airports in the period from 2000 to 2006 from which they derived a Malmquist index adapted to an inferential context.
In this context, this analysis considering previous works of Barros and Dieke (2008), Curi et al. (2011) and Gitto and Mancuso (2012), aims to provide a contribution to the Italian airport network development strategies by assessing the performance of airports included in the "National Airport Program". The main purpose of this work is to analyse the competitiveness of Italian airport infrastructures through the non-parametric analysis model, Data Envelopment Analysis, in order to estimate its technical and operational efficiency taking into consideration a wider period than the one analysed in previous Italian studies - the years from 2006 to 2016 - and above all by valuating, for the first time in Italy, the effects on airports efficiency of other relevant external factor, such as the size of the airport and the presence of low-cost carriers (LCCs). This research, indeed, improves on the samples used by previous authors since none of them evaluated the long period that has been affected by the liberalization process which revolutionised the aviation sector, considering both the greater power acquired by Italian airports and the influence of the LCCs on the airports efficiency. None of the previous papers on Italian airports efficiency evaluated how much the LCCs have impacted Italian airport efficiency. At the same time, differently to previous papers regarding Italian airports, it was analysed the effect of cargo traffic on airports efficiency, which are expected to have higher variable factor productivity scores, because “handling cargo is capital intensive and therefore more productive than handling passengers” (Oum et al. 2006). This study has been divided into two phases. The first phase analyses efficiency through an analysis of DEA's performance scores taking into consideration a sample of 34 Italian airports during the wide period 2006-2016 for which it has been collected data referred to the main input and output of the airport management companies along with financial information. The performance analysis allowed to outline the critical points of several airport operators through the identification of any best practices applicable to the relevant field and the distance between the latter and the remaining DMUs. The second phase assesses how external factors impact the efficiency level. Using the Tobit model, it was regressed the efficiency scores obtained during the first stage, on three explanatory variables: airport size, share of LCC passenger and share of cargo traffic. Based on the results obtained, it is discussed some general sector considerations and it is
7 suggested some improvements in order to enhance the efficiency of the companies under consideration.
The choice of this topic is linked to the crucial importance of achieving an efficient airport network for the economic system, not only in order to satisfy the demand for mobility, but especially considering the high economic impact associated with the airports infrastructures and the role that air carriers play in ensuring an adequate level of connectivity within the Country. Two important aspects have to be taken into account: the impact of airport infrastructure on the relevant areas in terms of employment, income and added value, and the effect on the definition of the economic system arising from a suitable level of airport connectivity.
In Italy, in order to meet successfully both the potential growth in demand and to ensure a service and safety level compliant with the European standards, it was issued the National Airport Program (PNA) whose main goal is to increase airport capacity through the rationalization and optimization of existing capacity (even in order to minimize the environment and landscape impacts thanks to the implementation of new air side and land side infrastructures); and the use of available capacity within existing airports which today it represents a "network capacity reserve".
The PNA takes into account even two other problems that have to be solved: airports accessibility and the integrated transport.
Travelling to/from the airports it is not so easy, even for airports near to the relative urban centres. In many cases, indeed, access times are slowed down by local traffic or an insufficient road system. In case of airports out from urban centres, such as Rome Fiumicino and Palermo, accessibility is affected by the traffic jam caused by the metropolitan conurbation and by new urban attraction poles along the access road. Even the intermodal transport between trains and planes is still insufficient and very far from European standards: currently only Fiumicino, Malpensa, Palermo, Pisa, Turin and Ancona airports are accessible by train. Even if the rail link is working, however, travel times, frequencies and trains characteristics discourage users and these do not create a competitive rail connections. Since the integrated transport represent an essential element for competitiveness and sustainable development of the country, it is strongly urged by Local Authorities to set up and implement projects aimed at supporting the proper development of the airport system. In this regard, the National Airport Program identifies specific actions to perform, indicating how to achieve them.
The shares represented by the National Plan of Airports determine the amount of investment of around 80 billion euro.
The present work consists of three papers strictly related to each other. The 1st Paper outlines the airport efficiency evaluation literature applying the Data Envelopment
8 Analysis and then focused on the DEA method, its origins and the different ways of its applications. The 2nd Paper aims to analyse the financial and operating efficiency of 34 Italian airports during the period 2006-2016 through the DEA analysis. The 3rd Paper, following the efficiency analysis carried out in the 2nd Paper, aims at studying the effect of the airport size presence, low-cost carrier presence and cargo traffic on efficiency applying the Tobit model, a second stage regression analysis.
9 1st Paper
HAVING A LOOK AT THE DATA ENVELOPMENT ANALYSIS
Introduction
The topic covered in this paper concerns the efficiency analysis of a set of independent organizational units. Over the last decade, this argument has been heavily discussed as, in the current economic context of increasing competitiveness and dynamism, it is crucial for a company to know both its degree of efficiency compared to its competitors and the relative efficiency of different internal operating units (divisions, departments, functions) or individual employees. This work lies in a field of managerial studies defined with the term benchmarking, a theory based on the identification of excellent references to compare the performance of the various units. Benchmarking is an effective method for measuring and enhancing the performance of an operating unit. The systematic use of Benchmarking methodologies and tools stimulates and integrates learning and change processes while at the same time it stimulates the effectiveness and efficiency of business processes and the renewal of corporate culture, ensuring continuous improvement thanks to constant comparison with other internal or external units. This technique involves several phases such as identifying the area where analysis is needed, the indicators to compare, the collection of data, the results processing and finally the evaluation and control of these. In this thesis it is presented the Data Envelopment Analysis, a benchmarking and performance evaluation technique that over the last few years it has been recognized mainly through the development of specific software.
Data Envelopment Analysis (DEA) is a method for measuring decision-making units (DMUs) efficiency, such as, for example, companies or public institutions. It was developed theoretically by Charnes, Cooper and Rhodes in 1978 as a technique based on linear programming.
This paper is inherent to the theoretical definition of DEA, which starts from the bases dictated by Farrell to reach the most complex and most recent introduction. The first chapter will deal with DEA's story, especially focusing on the application of the DEA model for evaluating the efficiency of Italian airports. The second chapter deals with Farrell's contribution, the basic models of slack and model orientation. The third chapter after a short digression on the choice of the model, it will introduce the model Charnes, Cooper and Rhodes (hereafter CCR), and the Model Banker, Charnes and Cooper (henceforth BCC) (with an in-depth study on scale returns), Additive and finally conclude analysing some of the advantages and disadvantages of the technique.
10 1.1 The DEA’s story
The performance analysis of firms or business sectors naturally leads with productivity and efficiency measures. These productivity analysis allow to determine what is the optimal production scale and what are the best management methods and organizations of production networks.
Two methods are mainly used to measure efficiency: Stochastic Frontier Analysis (SFA) and Data Envelopment Analysis (DEA). SFA was first introduced by Aigner, Lovell and Schmidt, 1977, and Meeusen and Van den Broeck 1977. It consists in estimating a parametric frontier econometric model. The first DEA article was published by Charnes, Cooper and Rhodes in 1978.
DEA is a nonparametric method implemented to measure the productive efficiency of Decision Making Units (DMUs). Its main advantage over SFA is that it does not require any parametric assumption on the production frontier. The envelope of the observed DMUs' input and output levels is calculated by linear programming and can be considered as a best-practice frontier. By measuring the distance between a firm and the efficient frontier, it is possible to calculate the DMU's efficiency.
Today, many different DEA models are used in the literature and additional statistical inference methods can strengthen results validity.
The main economic sectors applying DEA were mostly the banking industry, education, health care and communication while the transport sector was never mentioned as a potential application field according to Seiford. Transportation appeared very recently as the fourth DEA application field according to Liu, Lu L.Y.Y., Lu W.M., Lin (2013) who state that 53% of the referred articles were published during the period 2005 and 2009.
The economic theory underlying efficiency analysis is based on Koopmans (1951), Debreu (1951), and Farrell (1957), who made the first efforts on measuring the efficiencies for a set of observed production units (Simar and Wilson, 2008). Farrell introduced the concept of best practice frontier which delineates the technological limits of what a country can achieve with a given level of resources. The distance from the frontier can be used as a performance indicator (Terzi, Pierini, 2015).
Inserted in this context, the DEA original model, was introduced by Charnes, Cooper and Rhodes (1978).
Charnes et al. gave to this concept more precision and suggested a way of dealing with efficiency in practice. They defined efficiency and justified the necessity for a ‘‘relative’’ rather than an ‘‘absolute’’ measure thereof: more than 20 years later, the CCR model remains central in the DEA literature.
11 “[The] distinction between effectiveness and efficiency need not to be emphasized in evaluating private enterprise activities. We lay aside the more difficult problem of effectiveness and assume that this has been decided in the choice of inputs (resources) to be used and outputs (benefits) to be achieved, as well as the way in which the inputs and outputs are to be measured:
100% of efficiency is attained for any Decision Making Unit (DMU) only when: (a) None of its outputs can be increased without either
i. increasing one or more of its inputs or ii. decreasing some of its other outputs
(b) None of its inputs can be decreased without either i. decreasing some of its outputs or
ii. increasing some of its other inputs.
The Charnes, Cooper and Rhodes’ publication (CCR) represents the birth of data envelopment analysis (DEA). They formulated the evaluation of a firm’s efficiency ‘‘in a stringent mathematical form more readily understood and absorbed by the research community’’. It described the DEA method as a “mathematical programming model applied to observed data that provides a new way of obtaining empirical estimates of extremal relationships such as the production functions and/or efficiency production possibility surfaces that are the cornerstones of modern economics”. Since then, numerous applications employing the DEA methodology have been presented and they involved a wide area of contexts. DEA aimed at evaluating data management units (DMUs), which use multiple inputs to produce multiple outputs, without a clear identification of the relation between them, but then it has progressed throughout a variety of formulations and uses to other kind of industries. It was decided to use the DEA method because it can be applied to scenarios where the data cannot be strictly interpreted as inputs or outputs or there is no direct functional relationship between variables.
In the airport sector, the first application of DEA analysis for research studies started in the 1990s.
Gillen and Lall (1997) employed DEA to assess the performances of 23 US airports in the years ranging from 1989 to 1993 and estimated two Tobit regression models for explaining terminal and movement’s efficiency. The first one reveals that the increase in efficiency is positively associated with hubbing and negatively with the proportion of international passengers. For the latter increased efficiency is found to be negatively associated with hubbing and positively with the proportion of general aviation movements.
12 Murillo-Melchor (1999) applied DEA to assess the performance of 33 Spanish civil airports. They used DEA input CRS model as well as DEA input VRS model.
Parker (1999) used the DEA method in two different stages estimating the technical efficiency of British airports prior to and after privatization. Assessing, in the second model, the technical efficiency of 22 UK airports including six BAA (British Airports Authority) he found that privatisation had no noticeable impact on technical efficiency. Salazar (1999) applied DEA output CRS model to assess the performance of 16 main Spanish airports in 1993 – 1995 and empirically, observed the extent to which input and output contribute to the change in efficiency by visualizing from a graph.
Sarkis (2000), considering the period 1990-1994, applied the DEA input CRS and DEA input VRS model as to analyse the operational efficiencies of 44 major US airports. The main characteristic of the paper is that the author used a variety of other DEA models including simple cross efficiency, aggressive cross efficiency and ranked efficiency in addition to the basic models: constant and variable return scale models. So it was possible to assess the consistency of the results and to gain additional insights.
Anne and Holvad (2000) employing DEA analysed the performance of 25 European and 12 Australian airports during the period from 1992 to 1993.
Adler and Berechman (2001) applied DEA input VRS model for evaluating the performance of 26 airports in Western Europe, North America and Far East. Fernandes and Pacheco (2001) employed the DEA model for assessing the efficiency of 35 Brazilian airports in 1998, focusing on domestic airports. Martin & Roman (2001) applied the DEA to evaluate the performance of 37 Spanish airports. Differently from Parker (1999), they highlighted that privatization will improve the airport’s performance, stating that in order to ensure the efficiency it would be necessary a simultaneous process of economic regulation.
Applying a Malmquist total factor productivity index and DEA, Abbot and Wu (2002) investigate the efficiency and productivity of Australian airports during the 1990s. Their results showed that Australian airports recorded strong growth in technological change and total factor productivity during this period. However, this growth was based almost exclusively on a shift of the production frontier, with growth in technical and scale efficiency lagging behind.
Subsequently, Pels, Nijkamp and Rietveld (2003) analyzed 33 European airports from 1995 to 1997, employing both DEA and SFA models in a complementary way. In DEA, in fact, the distance from the efficiency frontier is regarded as inefficiency and random deviations are not possible; otherwise, a SFA model determines inefficiency according to the distance from the stochastic border and take into consideration possible deviations. From the SFA analysis, authors concluded that the airports analysed operate
13 under constant return to scale for aircraft movements and with increasing return to scale having regard to passenger movements.
Sarkis and Talluri (2004) assessed the efficiency of 44 US airports from 1990 to 1994 applying the DEA analysis and clustering methods in order to provide policy recommendations with respect to certain improvement targets. The advantage of clustering is to group information based on inputs in order to obtain homogeneous groups of comparable information.
Diana (2009) analysed 10 US airports for the summer periods over the years 2000, 2007 and 2008 in order to determine whether delay propagation differs in case of airports operating in highly concentrated markets with respect to airports operating in markets with lower levels of concentration. Based on non-parametric tests and proximity analysis, the study concluded that it is not possible to find a clear evidence, in terms of delayed propagation, on the difference between airports operating in highly concentrated markets and those operating in less concentrated markets. The importance of the study lies in the impact assessment of the market structure on the operation and efficiency of the analysed airports.
Ming-Miin Yu (2010) used a three-stage DEA analysis to evaluate 14 Taiwanese airports from 1998 to 2000. In detail, the author changed the stage one of the DEA approach into three different stages in order to take into account non-output desirable such as airplane noise and used a directional distance function defining a DEA with output-oriented approach. Additionally, at stage two the regression analysis provided variations in output considering components such as technological change and management inefficiency. The third stage of DEA can be considered as a repetition of the first one taking into account the effects of the variation of the above mentioned components. Empirical analysis has shown the validity of the three stages DEA approach in case in which environmental impacts, technological factors and unwanted outputs are too important to be ignored.
More recently, Adler, Ülkü, Yazhemsky (2013) focused their analysis on small regional airports. In particular, through the DEA model, the authors assessed the efficiency of 85 small European regional airports over a period of 8 years from 2002 to 2009. In a second stage regression some environmental variables (ie military use of the airport, membership of an airport system, presence of public service obligations) in order to recognise their impact on the airport management efficiency. The work ends with a break-even analysis aimed at determining the level of passenger flow needed to cover the costs, and therefore the airports located on the Pareto border. Adler, Ülkü, Yazhemsky's analysis fills a gap in economic literature focusing on small airports. Focusing on the economic literature analysis relating to Italian airports, it is noted that the most widely used methodology was DEA. The DEA offers an inefficiencies
14 measurement ("Farrell approach"), where SFA allows both to measure and provide inefficiency explanation (“Leibenstein approach”). In particular, in order to exceed these limits of DEA, Barros and Dieke (2008) applied the two-stage Simar and Wilson procedure to estimate the efficiency determinants of 31 airports from 2001 to 2003. In the first stage DEA has allowed to classify airports according to their productivity. In the second stage, the Simar and Wilson procedures allowed a "bootstrap" with truncated regression of the DEA results. The analysis revealed that the main efficiency determinants are size, ownership structure and workload units (WLUs) and that most Italian airports operate under constant return to scale.
Malighetti, Martini, Paleari and Rodondi (2007) applied a Tobit regression to the DEA results on physical inputs for 34 Italian airports from 2005 to 2006. The analysis showed that the main efficiency determinants are the proprietary structure and the hub premium; the analysis has shown, moreover, that larger airports mainly operate with decreasing returns to scale, while smaller airports operate under increasing return to scale, different from what Barros and Dieke (2007) had come up with.
Abrate and Erbetta (2010) used a parametric input distance function as an innovative methodology to evaluate efficiency and characteristics of 26 Italian airports observed over a six-year period from 2000 to 2005. This approach removes the cost minimization hypothesis and avoids price input, which represents a limit to traditional methodologies of estimating the cost function. In addition, the authors analysed the relationship and synergies between aeronautical, handling and commercial activities, concluding that outsourcing of handling activities is a valid strategy, although conditioned by the airport size in terms of traffic volumes.
More recently, Curi, Gitto and Mancuso (2011) implemented a bootstrap procedure for DEA's results having regard to 18 Italian airports over the period 2000 - 2004, in the case of constant return to scale, with reference to operational nature and financial activities. In particular, the authors analysed the most recent statistical inference tools for DEA (bias correction, and confidence intervals associated with DEA results), particularly useful considering small samples and different sizes production models, such as Italian airports.
Scotti, Malighetti, Martini and Volta (2012) analysed 38 Italian airports considering the period from 2005 to 2008, using a SFA model in order to assess whether the competitiveness degree of each airport influences its efficiency. The authors concluded that airports with local monopoly power were more efficient than airports in a competitive market condition and that following the analysis public airports appeared more efficient than those with private or mixed ownership structure.
Gitto and Mancuso (2012) developed the work of Barros and Dieke (2007) employing a DEA on 28 Italian airports on data from 2000 to 2006 from which derived the
15 Malmquist index which was adjusted to an inferential context. The Malmquist index calculated in a deterministic way, indeed, would not allow to verify whether the productivity variations identified correspond to real / actual variations or, alternatively, represent a shift of production frontiers over the time. The use of the bootstrap procedure (Simar and Wilson, 1999) has enabled to obtain confidence intervals for the Malmquist index, the efficiency and technological variation. The analysis of Malmquist indices indicates that the productivity growth of Italian airports network is polarized on the Rome and Milan systems and on a few other airports. The analysis found even that airports run by managers with mixed corporate structure with a government majority are not significantly less efficient than airports run by managers with a public-sector structure.
D'Alfonso, Daraio and Nastasi (2015), instead, analysed the effect of competition on technical efficiency of 45 Italian airports by applying a novel conditional nonparametric frontier analysis for the first time to the airport industry. This novel two stage approach has shown that, on average, competition has a negative impact on technical efficiency. They estimated a measure of pure efficiency, whitened from the main effect of the competition, whose distribution has a bi-modal shape, indicating the existence of two differently managed groups of airports.
1.2 Literature review
In this paper it has been stated some economic considerations about the possibility to measure the airport efficiency through the Data envelopment analysis, and so, to have an idea of the relevant literature in this specific topic, we have interrogated the Scopus database using the Boolean search parameters “Airport competition OR Airport efficiency”. Through this search it was possible to find the literature concerning two different kinds of problems. The first one is to identify the paper applying the traditional literature of the airports efficiency sector. The second one is to understand which variables are able to affect the airports efficiency.
This research showed a huge number of documents, 2.497 in total. In order to narrow the documents to analyse there were introduced two more parameters: the language, “English”, and the document source, “journals”; in this way we have reduced the number of documents to 1.033. Since this number of documents was too big to analyse, the research was focused on the title, abstract, and keywords, in this way obtaining 35 documents containing the words “Airports + competition+ DEA OR Airports + efficiency + DEA”.
Analysing the contents of the 209 documents it was found that only eight of them were economic papers analysing Italian airports. This is consistent with the research of Cavaignac and Petiot (2017). Applying a bibliometric analysis, they have shown that
16 Italian articles using DEA in transport analysis in a broad sense (Transport, Maritime, Road, Rail, Air), between 1989 and 2016, are only 21.
In table 1.1, below, it has been reported the most significant papers with regard to the Italian airports, synthetizing what is the nature of them, the model used and the variables considered in them.
Table 1.1. Inputs and outputs used in previous studies on the efficiency of the Italian airport system.
Selected Studies Method Units Input Output
Malighetti et al. 2007
DEA and Tobit regression model
33 Italian airports
2005 - 2006
Number of aircraft parking position
Number of aircraft movements
total airport area Number of passengers
total runways lenght
Abrate-Erbetta 2010 Input distance function 26 Italian airports 2000 - 2005
Labour costs Number of passengers
Soft cost handling receipts
Runway area commercial receipts
apron size total airport area
Curi et al. 2010 DEA and truncated regression model
36 Italian airports, 2001–2003
Labour costs Number of passengers
operational costs excluding labour costs
Number of aircraft movement
capital invested commercial sales
Number of cargo aeronautical sales handling receipts
Curi et al. 2011 DEA and two-stage bootstrapping
18 Italian airports
2000– 2004
employees Number of aircraft
movements
apron size Number of passengers
Number of runways Number of cargo
Gitto-Mancuso 2011
two different DEA models: physical and
monetary
28 Italian airports during the 2000–2006
Number of employees aeronautical cost
Runway area non aeronautical costs
Airport area Gitto-Mancuso 2012 DEA-Malmquist with bootstrap 28 Italian airport 2000– 2006
Number of aicraft movements labour costs
Number of passengers soft costs
Number of cargo capital invested
aeronautical revenues non-aeronautical revenues
Scotti et al. 2012 SFA – two-stage analysis
38 Italian airport 2005–
2008
runway capacity Number of aircraft
movements Number of aircraft parking
position Number of passengers
Terminal area Number of cargo
Number of check in desks Number of baggage claims Number of employees
17
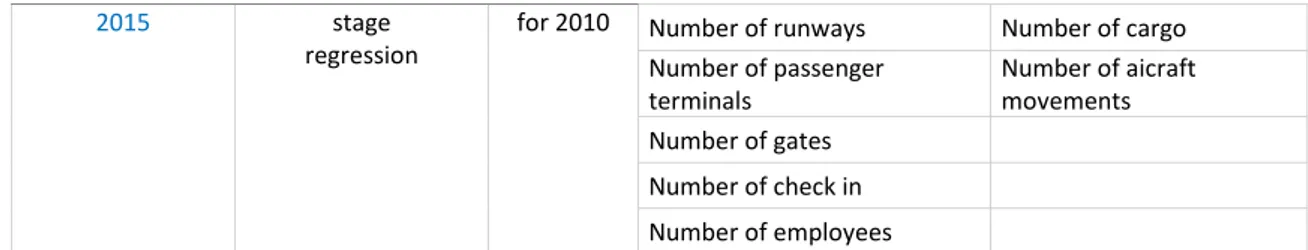
2015 stage
regression
for 2010 Number of runways Number of cargo
Number of passenger terminals Number of aicraft movements Number of gates Number of check in Number of employees
Table source: V. Recupero Table 1.1 shows clearly that almost all economic literature analysed related to the Italian airports efficiency is focused on empirical works and that the main techniques used are the Data Envelopment analysis and a two-stage regression analysis.
This literature gap brings to generate uncompleted empirical model to explain which is the effective process that bring an Italian airport to be efficient. In a similar situation it is hard to answer questions like: is it possible to measure efficiency of Italian airports after the liberalisation process? What kind of influence can the low-cost companies have on Italian airport efficiency? Can cargo traffic affect airport efficiency?
This research contributes to the literature by analysing the efficiency of a larger and balanced dataset of Italian airports. There were analysed, indeed, all the Italian airports of the National Airport Program having regard to the wider period ranging from 2006 to 2016. This research improves on the samples used by previous authors showed up since none of them evaluated the long period that has been affected by the liberalization process which led to a change in the aviation sector, especially given the greater power acquired by Italian airports. Taking into consideration previous research, indeed, it is possible to noticed that the larger period (from 2000-2006), was analysed by Gitto and Mancuso while some other authors studied airport efficiency during a single reference year, ie. D’Afonso et al. and Malighetti et al.
In this study it was also considered another important aspect linked to the aviation liberalization which is the influence of the LCCs on the airports efficiency. None of the previous papers on Italian airports efficiency evaluated how much the LCCs have impacted Italian airport efficiency. At the same time, differently to previous papers regarding Italian airports, this work it was analysed the effect of cargo traffic on airports efficiency, which are expected to have higher variable factor productivity scores, because “handling cargo is capital intensive and therefore more productive than handling passengers” (Oum et al. 2006).
1.3 DEA analysis: the Farrell’s contribution
As already sad, DEA's bases were set around 1957 by Farrell, which introduced a linear production function, but failed to determine a line-up programming program to explain the graphical efficiency indices obtained.
18 The production function is estimated by solving a system of linear equations satisfying the convexity and the exclusion conditions of the origin of the axes on the one isoquant. Farrell's contribution to measuring efficiency is only useful in three cases:
• one input and one output; • two inputs with equal output; • Two outputs with equal input.
Farrell also decomposed the efficiency of a production unit into two-component, technical efficiency and allocative efficiency. The first one is the ability of the production unit to get the most output given a certain (and limited) set of inputs. Therefore, in a technically inefficient unit, there is a waste of productive resources, which implies a non-minimization of production costs, in the direction of Input, while in output orientation, the product is less than the maximum obtainable data factors employed. Allocation efficiency, on the other hand, reflects the ability of the unit to use in optimal proportions, given the respective prices. In the case of units characterized by allocative inefficiency, assuming orientation to the inputs, the mix of inputs chosen is not able to ensure a technically efficient level of output (the marginal rate of substitution of the factors does not equal the ratio between their prices) while, in the case of orientation to the output, the multi-product enterprise, does not gather that output mix that maximize revenues (the MRS does not match the price ratio).
Technical and allocative inefficiencies can occur both separately and jointly, contributing to increasing production costs to the minimum possible. Therefore, all cases in which costs are not minimized may depend on both technical and allocative inefficiency.
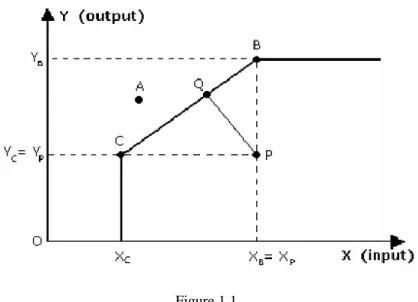
By indicating input and output, a production level will be technically efficient when the combination (𝑋, 𝑌) lies beneath the efficient frontier. In the Figure below, point 𝑃 is technically inefficient because in order to produce the quantity of output 𝑌𝑃 would be enough the amount of rebates 𝑋𝐶 or, alternatively, because with the same amount of resources 𝑋𝑃 could produce a higher quantity of goods, equal to 𝑌𝐵.
19 Figure 1.1
The ratio commonly used in DEA to evaluate efficiency is 𝑂𝑢𝑡𝑝𝑢𝑡/𝐼𝑛𝑝𝑢𝑡, when it has been analysed an homogeneous DMU sample, using the same resource set.
1.4 Input/output oriented model
In order to determine whether a DMU is efficient or not, it has to be measured if there is waste in production. A production unit can be technically inefficient not only when it wastes inputs during production (input orientation) but even when inputs cannot reach the maximum amount of production to be produced. Then it will have an exit orientation when the goal of the analysis is to define the amount of production to be produced so that production steps from inefficient to efficient.
20 The above figure shows an input oriented measurement. This will be performed by measuring the horizontal distance between the points inefficient, to the right of the efficient frontier, and the latter. For point P3:
Point P3 has an efficiency of 70%, so with a 30% reduction in inputs it will continue to get an output of seven units, but with a lower amount of resources.
Figure 1.3(A. Charnes, W. Cooper, A. Lewin, L. Seiford)
This figure, however, shows an output oriented analysis. The measurement, this time, will be carried out on the vertical distance between the point representing the inefficient production and the efficient frontier. For point P''3:
It can be noticed that with models characterized by CRS the efficiency does not vary depending on the choice of one or the other orientation. The same thing, however, does not happen for models characterized by VRS. This difference is graphically shown in the figure below:
21 Figure 1.4 (T. Coelli)
1.5 The different DEA models
All DEA models are useful for assessing the efficiency of DMUs but their orientation and effort are focused on different concepts and assumptions. The analyst, before performing the analysis by the DEA model, must first choose the most appropriate model. This choice has to be weighted considering whether the formulation of the problem allows constant or variable returns to scale, and whether the problem is to maximize output, minimize inputs, or both.
Based on the above, the analyst will be able to choose one of the models shown below:
Input Output Both
Constant Return to Scale CCR input CCR output Additive Variable Return to Scale BCC input BCC output Additive
It is necessary to evaluate the performance of n DMUs consuming different resources to produce different goods or services. In general, DMUj consumes a quantity
of input (i = 1, ..., m) and produces a quantity of output (r = 1, ..., t), by convention, non-negative. The production possibilities set is reduced to:
while the possible sets of input (L (y)) and output (P (x)) will be:
22
In particular, we assume the existence of an inverse relation between 𝐿 (𝑦) 𝑒 𝑃 (𝑥): 𝑥∈𝐿 (𝑦) ⇔ 𝑦 ∈𝑃 (𝑥) y and a production function F (x; y) such that:
For these constants, which generally take the form of observations, we assume that the output matrix (t × n) is denoted by Y, and the input matrix (m × n) is indicated by X. Non-parametric DEA models are characterized by the presence of a set of hypotheses that the production set must satisfy:
(1) Convexity of the input production sets:
If for
Then (2) Convexity of the output production sets:
If for
Then (3) Convexity of the production set:
If
Then (4) Strong input availability:
If Then
(5) Strong output availability:
23 Then
(6) Constant return to scale: If
Then
(7) Belonging to the feasible region:
The osservation
(8) Minimum extrapolation: If a production set
𝑇’ fulfills (1), (2), (4)−(7) 𝑜r (3)−(7), Then 𝑇’⊂ 𝑇
The 1st and 2nd hypotheses are included in 3rd hypothesis, but, even if satisfied, they do not imply the 3rd. The 6th hypothesis, as it shall be seen below, is a necessary condition for the CCR model, characterized by constant returns to scale. In addition, they only take DMUs:
• homogeneous in terms of industry, input and output;
• of which is intended to maximize outputs or minimize inputs. 1.5.1 The CCR model
This is the base model and its name comes from its creators, Charnes, Cooper and Rhodes in 1978. This model is characterized by:
• Constant Return to Scale (CRS); • relative efficiency;
• is constrained by the fact that numeric data must be positive;
• all inputs and all outputs are traced to a single virtual input (expressed as the weighted sum of the inputs) and a single output (expressed as the weighted sum of the outputs). The model, using linear programming (LP), will determine the weights of the various inputs and outputs that maximize the ratio
24 where u and v are, mutually, the optimal weights of inputs and outputs which vary according to the decision unit. This report also represents our objective function and it will be subject to the constraint that expected to be less than or equal to one. It also raises the constraint of the positivity of the weights. It will be possible, therefore, to have the following fractional programming model:
This, however, is a fractional linear programming problem which, to be solved, must be converted into a PL problem. To bring the fractional form to the linear one, it is sufficient to normalize the denominator assigning it an arbitrary value equal, for example, to the unit. Therefore, the solution will be obtained by maximizing the numerator and including the constraint .Then it will be obtained:
CCR INPUT ORIENTED MODEL The Multiplier model
25
The Envelope model
Matrix form: Linear form:
It could be possible also place 𝑣𝑟, 𝑢𝑖≥ε≥0, where ε is a positive infinitesimal amount imposed to avoid that a DMU clearly inefficient in the consumption of a certain 𝑥𝑖 can make "transparent" their inefficiency by assigning a zero weight to that factor.
A DMU will be efficient if and only if, at the same time, its efficiency is equal to the unit and all slack variables are equal to zero. Indeed, the presence of slack points out that the DMU is not Pareto-Koopmans efficient and it would therefore be possible to maintain the same level of production by reducing the resources employed.
The transition from the primary problem to its dual involves changing the number of variables and constraints to be met: the problem of multipliers will have as many variables as are the constraints, and so many constraints as are the variables of the envelope problem (being its dual). It has to be noted also that the duality of the issue of output oriented multipliers is nothing more than the problem of input oriented development (and vice versa).
CCR OUTPUT ORIENTED MODEL The Multiplier model
26
The Envelope model
Matrix form: Linear form:
The efficiency of each DMU, as mentioned above, is a relative efficiency, that is, it is evaluated compared to the other DMUs. Indeed, for the highest efficiency DMUs:
while the others will have an efficiency between one and zero. 1.5.2 The BCC model
While the CCR model of 1978 assumes CRS, in reality often the opposite happens, and for the analysis it is necessary to know beforehand the scale with which used to operate the units to be analysed, or to know the input / output size at which inefficiency becomes a direct consequence of scale returns. The BCC model is characterized by variable return to scale and then it is taken into account the possibility that the production function can assume increasing or decreasing returns to scale.
27 The figure above shows the trends of two efficient frontiers. The 𝐵𝐸𝐷 curve corresponds to a production function with VRS, while the straight line coincides with the efficient frontier if it is characterised by CRS. Looking at the graph, it can be said that the unit A does not belong to the production frontier (for the case of VRS and CRS). Similarly to the CCR model, unit A should be compared with point C in case of output orientation and, with point B, in the case of orientation to the inputs; Similarly to the CCR model, unit A should be compared with point C in case of output orientation and, with point B, in the case of orientation to the inputs; It can be measured then its efficiency:
• it is the pure technical efficiency of A input oriented;
• it is the pure technical efficiency of A output oriented.
Comparing the two models and the respective efficient frontiers it is noted that along the straight line with the average productivity CRS ( having only one input and one output) remains constant, while in the frontier with VRS varies at each point. The highest average productivity point along the VRS border is point E (CRS point tangency point) and it corresponds to what Banker called "most productive scale size (MPSS)." The average productivity of the MPSS is equal to the average productivity of the efficient CRS frontier. The overall (technical and scale) efficiency is obtained by comparing the same unit with E or N points (DMUs that reach the same average productivity as they belong to the CRS border). Using an orientation to the input it is obtained from the ratio .
The efficiency of scale at each point belonging to the efficient frontier is equal to the ratio between the average productivity of that point and that of the MPSS. Therefore, the DMU A scale efficiency will be which is also the horizontal distance between the CRS and VRS borders.
Finally, it can be noted that the product between overall efficiency and scale efficiency is the pure technical efficiency:
However, these concepts are not applicable in a more complex context, where numerous inputs and outputs are considered, given the impossibility of determining a common set
28 of weights that can be accepted by all DMUs in the weighting of variables. It is therefore necessary to develop a model capable of assessing the "pure technical" efficiency share in a multi-input and multi-output situation so as to correct the error of the CCR model to attribute the technical inefficiency of the single DMU any disadvantages caused by economies of scale.
This model, called BCC, is similar to the CCR and it satisfies all the DEA hypotheses, but it has tighter constraints as the convex constraint (Σλ = 1) is inserted, which allows the variable return to scale.
The fractional programming problem is:
from which we get the linear programming models listed on the following pages.
BCC INPUT ORIENTED MODEL The Multiplier problem
29
The Envelope problem
Matrix form: Linear form:
BCC OUTPUT ORIENTED MODEL The Multiplier problem
Matrix form: Linear form:
The Envelope problem
30 1.5.3 Returns to Scale
As already mentioned above the BCC model (but also the CCR model) is characterized by possible returns to scale. By this, it is meant the relationship existing between the variation of production input in a production unit and the variation of its output.
The returns to scale are defined as:
• Constants (CRSs): If an increase (decrease) in inputs follows a proportional increase (decrease) in output;
• Increasing (IRS): If an increase (decrease) in inputs follows an increase (decrease) of more than proportional output;
• Decreasing (DRS): If an increase (decrease) in the input follows an increase (decrease) less than proportional to the output.
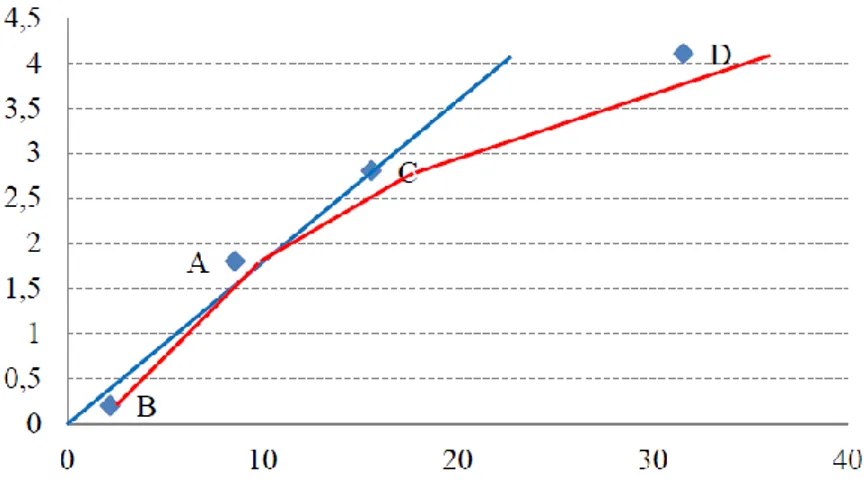
Figure 1.6. X: Cpital invested; Y: Added Value
Now let's look at the Figure representing a CRS frontier (in blue) and a VRS frontier (in red). A is the only one to be both efficient considering BCCs and CCRs and is MPSS since its average productivity coincides with average productivity according to the CCR model. Let's now look at the model solutions shown in the table below:
DMU Efficiency λ A 1 1 B 0,434 0,256 C 0,858 1,814 D 0,620 3,674 Source: R.Ramanathan (2003)
31 It is possible to notice that λA, the only efficient one, is equal to the unit. Units operating at a lower magnitude of scale (for example B - λB <1) are characterized by increasing returns to scale while, conversely, the units C, D with larger λ unit are distinguished by decreasing returns to scale.
Referring to the envelope problem, it is possible to summarize thus: • < 1 Increasing return to scale (IRS);
• > 1 Decreasing return to scale (DRS);
• = 1 Constant return to scale (CRS).
However, with reference to the multipliers problem, it should be taken into account the value of u0 and v0, assuming that (𝑥𝑜; 𝑦𝑜) belongs to the efficient frontier, this point will be characterized by returns to scale:
• Increasing if and only if 𝑢0 * 𝑜r 𝑣0 * <0 for all the best solutions; • Decreasing if and only if 𝑢0 * 𝑜r 𝑣0 *> 0 for all the best solutions; • Constant if and only if 𝑢0 * 𝑜r 𝑣0 * = 0 for all the best solutions.
Consider now a "forcing" (R. Ramanathan) of the BCC model in which we put ≤ 1 instead of = 1. If we put this constraint a unit (such as B) characterized by IRS will be considered efficient only if = 1 is forced but with ≤ 1 this does not happen. Without a convex constraint the unit B will have the constraint < 1. This is allowed by the condition ≤ 1, therefore, the unit will not be considered efficient. On the contrary, the units C, D, with > 1 which is not allowed by the constraint, and they will be considered efficient because they will force the condition ≤ 1. Thus, units operating under the IRS will be considered inefficient while, units operating under DRS, will be evaluated efficiently. It will then be said that the model operates under non-incremental return to scale (NIRS). Similarly, setting the contrary condition to the previous one, ie ≥ 1, the model will be characterised by non-decreasing returns to scale (NDRS). Therefore, unit B will become efficient while units C and D will be considered inefficient.
1.5.4 The Additive Model
In the Additive model, developed by Charnes et al. in 1985, unlike the previous ones, a DMU will be efficient if and only if the indexes of envelope and multipliers problems
32 simultaneously take null value. It will be inefficient, however, when such values will be negative and slack variables (on inputs and outputs) will be positive. The efficiency frontiers will always be estimated by imposing the transition to efficient DMUs. A special feature of the Additive model is that there is no distinction between input oriented and output oriented. Indeed, both directions are considered simultaneously by adopting slack variables which, if positive, it indicates (graphically) the distance the inefficient unit must travel to reach both the frontier and the direction. In strategic terms this reveals the variation in the input / output quantities the inefficient unit must bring to its performance to make it efficient. The Additive model is also characterized by VRS as it is shown below.
THE ADDITIVE MODEL The Multiplier problem
Matrix form: Linear form:
The Envelope problem
33 Conclusion
DEA advantages and disadvantages
As it has been possible to see so far, the DEA analysis, thanks to its flexibility, can be applied in different contexts and for different purposes.
It is possible to show some distinction between models and different contexts application on the efficient frontier. Unlike in the CCR model, which takes the form of a straight line allowing constant returns to scale, indeed, in the BCC model and in the Additive model the efficient frontier takes the form of a broken line that allows variable returns to scale.
Taking into consideration the purposes of the different models, instead, it is possible to point out that the three models are aimed at achieving three different goal. If the main goal is to reach an objective assessment of the overall efficiency it is necessary to apply the CCR model. The BCC model, instead, allows to distinguish the technical inefficiency from the scale efficiency differently from the Additive model which connects efficiency to Pareto-efficiency.
It could be sad that DEA analysis has some weaknesses that, if neglected, will alter the validity of the whole analysis. One of the main problem is the inability to give an absolute assessment of the single unit efficiency. It should be noted, indeed, that the efficiency value that is attributed to each DMU is relative therefore it depends on the efficiency of the other units that make up the sample, which involve, for example the inability of all units to be ineffective and the effortlessness of moving the efficient frontier. It is sufficient, indeed, that a unit produces more than the others in the sample so that it can be considered efficient and therefore it could be able to change the production frontier. Moreover, DEA can simultaneously handle multiple variables, each of which can be expressed in different and incongruous units of measurement, while still providing a single real number as a relative performance efficiency index. This process may give rise to errors in measurement, approximation, etc. Finally, DEA model need to have an higher number of decision-making units (at least three times) to the sum of inputs and outputs so that it can occur a significant difference between efficient and inefficient DMUs.
However, it should be pointed out that DEA presents some features which distinguish it from other analysis methods and could make it preferable compared to other techniques. DEA allows to (A. Charnes, W. Cooper, A. Lewin, L. Seiford):
34 ▪ Produce an aggregate efficiency measure for each DMU using productive factors as known variable (independent variables) and goods produced (dependent variables);
▪ Use a multiplicity of input and output factors, considering each measurement unit, even if different from each other;
▪ Incorporate dummy variables;
▪ Do not know input and output prices a priori;
▪ Evaluate the efficiency of homogeneous operating unit;
▪ Obtain objective values to which the inputs and outputs of the inefficient units are to be aimed;
▪ Identify the best combination of production factors; ▪ Get Pareto efficient solutions.
Regardless of the model type, indeed, all the DEA models produce a large set of concrete, relevant and useful results. Besides the efficiency score for each observed entity, for each inefficient entity it is possible to assign a potential performance target, in terms of inefficiency sources and amounts, proposed improvements in each of the inputs and outputs (resulting in efficient projection onto the frontier) or reference set (defined by the closest efficient units). These results provide policy-makers with information crucial for operating more efficiently in today’s dynamic business environment, where competitive rivalry is increasing exponentially (Rabar, 2017). Therefore, the DEA model presented can be considered as a good tool for decision makers evaluating alternative policies and projects especially in case within the decision-making body there are conflicting perspective. The main advantage of DEA, indeed, is that it enables the decision maker to handle multiple criteria without relying on subjective judgments involved in the evaluation process. It also incorporates multiple incommensurate attributes, while allowing for measures of uncertainty.
35
2nd Paper
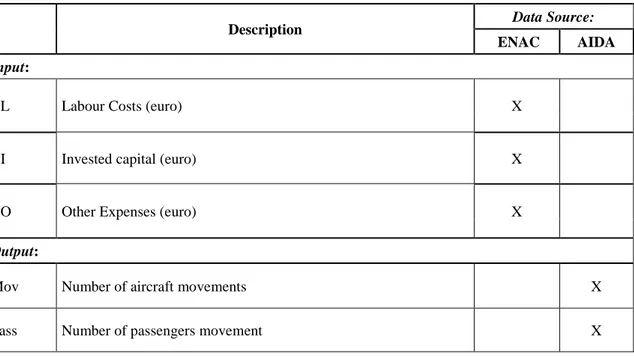
EFFICIENCY IN AIRPORT MANAGEMENT. A MODEL ANALYSIS APPLIED TO ITALIAN AIRPORTS.
This paper aims to analyse the financial and operating efficiency of Italian airports, by applying a nonparametric frontier analysis to the airport industry. It seems interesting identify the best practices on national level in order to address any improvements to inefficient airports. It becomes even more important particularly in the current period in which there has been a privatization process of airport infrastructure in order to extract some policy considerations for increasing the efficiency of the services. The analysis was carried out on a sample of 34 Italian airports during the period 2006-2016 for which it has been collected data referred to the main input and output of the airport management companies along with financial information. The study was carried out through a DEA analysis (Data Envelopment Analysis), which allows to analyse the technical efficiency and performance of each individual Italian airport and then to point out the critical points of several airport operators through the identification of any best practices applicable to the relevant field and the distance between the latter and the remaining DMUs. Results obtained pointed out some interesting features of the Italian airports system especially on the effect of the overall technical, pure technical, and scale efficiency on airport efficiency. It was found not only that the dominant source of efficiency is the efficiency of scale but even that, in Italy, only a minority of airports appear inefficient from an operational point of view, which makes to conclude that overall Italians airports are well managed with regard to the pure technical efficiency. In other words, air transport privatization and deregulation can positively affect regional airport efficiency.
Keywords: Airport competition; Italian airports; data envelopment analysis; Efficiency
Introduction
Air transport market can be considered essential in the process of cultural, social and therefore economic globalization. It is also important to notice the derived character of transport: an increase in economic activity, industrial production and expanding trade relations will inevitably result in an ever-greater need for transport. A decrease of the same parameters will result in a decreasing demand for transport (Blauwens et.al., 2008, p. 291). In the European Union the air transport system currently plays a fundamental economic role. It had started to grow when the three deregulation packages became effective. Until that period the aviation market has been characterized by the supremacy of the domestic carriers, or Flag carriers, and bilateral agreements between nations. Over the years it has been felt the need of give back to the market the air transport
36 sector, which up to that moment was considered over regulated and with an high incidence of public monopolies.
The deregulation process in Europe followed four steps (ELFA, 2004; Graham, 1998; Malighetti et al., 2008; Mawson, 1997) that led to a unique domestic market for the continent. The last step took place in 2008 when, thanks to the Regulation (EC) No. 1008/2008, reviewing the regulations of 1992, European Institutions have perfected the process of liberalization: EU routes it has become reserved "freely" to community air carriers. European States, indeed, from now on would have been obliged to accept the entry into their airspace to all "authorized" carriers.
This situation, clearly, has led to increased competition among carriers, decreased average fares, increased frequency, and new route services (D’Alfonso and Nastasi, 2014; Fu and Oum, 2014; InterVISTAS, 2006). Airlines have become more footloose, having a greater freedom to choose where they fly to and from, and generally set fares, frequencies, capacities and routes according to commercial consideration (Koo et al., 2015). It was quite important in order to provide opportunity for airport to grow attracting new routes but also challenging the existing ones (around 2,500 new routes were opened in 2011; ATCONF 2013). One of the main result of the regulation process was the entrance and the development of Low Cost Carriers (LCCs).These new players have greatly stimulated a part of demand which was "neglected" by the great carriers: customers highly price sensitive and therefore willing to receive a low profile service ("no frills").Thanks to an unscrupulous pricing policy, indeed, these new operators have attracted millions of passengers. They have also developed a network called "point-to-point" indicating a connection of pairs of destinations and with an high frequency gain (thus maximizing the number of passengers boarded per way). In doing so LCCs were focused especially on secondary airport due to the lower level of airport charges, increasing the chance for competition among airports. It is important to notice that LCCs played an important role in the aviation market changing the traditional business relationship between airport and airline. The capability of LCCs to guarantee high level of passengers, indeed, created an asymmetry between airlines and airports, with more market power in the hand of the airlines (Barbot, 2006; Laurino and Beria 2014). Turning to the airport industry, the sector in Europe was traditionally characterised by public sector ownership and national requirements (Graham, 2014). However, at the same time as Europe’s internal air transport market was being liberalised, a number of governments in Europe began to transfer the ownership or operation of larger airports to the private sector. Many smaller airports in Europe are still publicly owned but the majority is now operated by corporatised entities. Transformations in the way that airports are owned and operated mean that, just as airline decisions are driven more by commercial considerations, so too are the decisions of airports (Koo et al., 2015). This