Management and sustainability:
Creating shared value
in the digital era
Full Papers
Sapienza University of Rome
II
Referred Electronic Conference Proceedings of Sinergie - Sima Management Conference
Management and sustainability: Creating shared value in the digital era. Full Papers
Rome, 20-21 June 2019 Sapienza University of Rome
ISBN 97888943937-4-3
I Referred Electronic Conference Proceeding sono pubblicati online sul portale di Sinergie
http://www.sijm.it
© 2019 FONDAZIONE CUEIM Via Interrato dell’Acqua Morta, 26 37129 Verona
III
Management and sustainability:
Creating shared value in the digital era
20-21 June 2019
Referred Electronic
Conference Proceeding
Full Papers
a cura di
IV
Conference chairs
ALBERTO PASTORE Sapienza University of Rome
FEDERICO TESTA University of Verona
Former chairs
CLAUDIO BACCARANI University of Verona
GAETANO M.GOLINELLI Sapienza University of Rome
Scientific coordination
FEDERICO BRUNETTI University of Verona
MARCO FREY Scuola Superiore S. Anna of Pisa
GENNARO IASEVOLI LUMSA Free University, Rome
MARTA UGOLINI University of Verona
International coordination
SANDRO CASTALDO Bocconi University
ANGELO CAMILLO Sonoma State University, USA
Scientific committee
PEGGY CHAUDRY Villanova University, Pennsylvania, US
MARIA COLURCIO University of Catanzaro
ANDREW CRANE School of Management, University of Bath, UK
BO EDVARDSSON Karlstads Universitet, Sweden
MICHAEL GOODMAN Baruch College, The City University of New York
MICHAEL HAENLEIN ESCP Paris, France
IRENE HENRIQUES York University, Canada
EMANUELE INVERNIZZI IULM University of Milan
PHILIP KITCHEN Salford University Business School, UK
ALBERTO MATTIACCI Sapienza University of Rome
GUIDO PALAZZO Université de Lausanne, Suisse
ROBERTO PARENTE University of Salerno
LUCA PELLEGRINI IULM University of Milan
TONINO PENCARELLI Carlo Bo University of Urbino
FRANCESCO PERRINI Bocconi University of Milan
ELITA SCHILLACI University of Catania
PAOLA SIGNORI University of Verona
BARBARA STOETTINGER University of Vienna
ANTONIO TENCATI University of Brescia
ALFONSO VARGAS SÁNCHEZ University of Huelva, Spain
TIZIANO VESCOVI Ca’ Foscari University of Venice
DONATA VIANELLI University of Trieste
Organization and editorial staff
ANGELO BONFANTi, FABIO CASSIA and NICOLA COBELLI, University of Verona
LAURA CIARMELA ([email protected]) ADELE FERRAGAMO ([email protected]) LUANA GALLOTTA ([email protected])
ANNA MALLAMACI ([email protected]) ADA ROSSI ([email protected])
Registration and invoicing
V
La Direzione e il Comitato Scientifico del Convegno di Sinergie sono riconoscenti ai Referee che hanno collaborato
al processo di peer review dei paper
TINDARA ABBATE Università di Messina
BARBARA AQUILANI Università della Tuscia
DANIELA BAGLIERI Università di Messina
CAMILLA BARBAROSSA Toulouse Business School
VALERIA BELVEDERE Università Cattolica Sacro Cuore
GIUSEPPE BERTOLI Università di Brescia
GUIDO BORTOLUZZI Università di Trieste
FEDERICA BUFFA Università di Trento
STEFANO BRESCIANI Università di Torino
ANTHONY BUONO Bentley University
FRANCESCA CABIDDU Università di Cagliari
MARIA ROSITA CAGNINA Università di Udine
LUIGI CANTONE Università di Napoli Federico II
FRANCESCO CAPONE Università di Firenze
ANTONELLA CAPRIELLO Università del Piemonte Orientale
MATTEO CAROLI LUISS Business School
FEDERICA CECCOTTI Sapienza Università di Roma
CORRADO CERRUTI Università di Roma Tor Vergata
ANDREA CHIARINI Università di Verona
FRANCESCO CIAMPI Università di Firenze
MARCO CIOPPI Università di Urbino Carlo Bo
MARIA COLURCIO Università Magna Grecia di Catanzano
ILENIA CONFENTE Università di Verona
LAURA COSTANZO University of Southampton
FRANCESCO CRISCI Università di Udine
MONICA CUGNO Università di Torino
GIORGIA D’ALLURA Università di Catania
PATRIZIA DE LUCA Università di Trieste
ALFREDO DE MASSIS Università di Bolzano
GIACOMO DEL CHIAPPA Università di Sassari
MANLIO DEL GIUDICE Link Campus University
MARIA DELLA LUCIA Università di Trento
FRANCESCA FAGGIONI Università di Roma Tre
MONICA FAIT Università del Salento
VINCENZO FORMISANO Università di Cassino e del Lazio Meridionale
MARIANGELA FRANCH Università di Trento
MARCO FREY Sant’Anna Scuola Universitaria Superiore Pisa
LORIS GAIO Università di Trento
BARBARA GAUDENZI Università di Verona
FRANCESCO IZZO Università degli Studi della Campania Luigi Vanvitelli
MAURIZIO LA ROCCA Università della Calabria
TIZIANA LA ROCCA Università di Messina
BEATRICE LUCERI Università di Parma
PIERPAOLO MAGLIOCCA Università di Foggia
AMEDEO MAIZZA Università del Salento
MICHELA CESARINA MASON Università di Udine
VI
ALBERTO MATTIACCI Sapienza Università di Roma
ALESSANDRA MAZZEI Libera Università di Lingue e Comunicazione IULM
GAETANO MICELLI Università della Calabria
LAURA MICHELINI Università Lumsa di Roma
ROBERTA MINAZZI Università dell’Insubria
ANTONIO MINGUZZI Università del Molise
ARABELLA MOCCIARO LI DESTRI Università di Palermo
MARIAGRAZIA MURTARELLI Libera Università di Lingue e Comunicazione IULM
FABIO MUSSO Università di Urbino Carlo Bo
FRANCESCA NEGRI Università di Parma
COSTANZA NOSI Università Lumsa di Roma
ANDREA PACI Università di Firenze
GIOVANNA PEGAN Università di Trieste
LUCA PELLEGRINI Libera Università di Lingue e Comunicazione IULM
ANNA CLAUDIA PELLICELLI Università di Torino
TONINO PENCARELLI Università di Urbino Carlo Bo
ALESSANDRA PERRI Università Cà Foscari
FRANCESCO POLESE Università di Salerno
ANGELO PRESENZA Università del Molise
TOMMASO PUCCI Università di Siena
ANDREA QUINTILIANI Università Telematica Pegaso
ANGELO RIVIEZZO Università del Sannio
MARCO ROMANO Università di Catania
STEFANIA ROMENTI Libera Università di Lingue e Comunicazione IULM
MARCELLO SANSONE Università di Cassino e del Lazio Meridionale
FRANCESCO SCHIAVONE Università di Napoli Parthenope
PAOLA SCORRANO Università del Salento
VERONICA SCUOTTO Università di Torino
ALFONSO SIANO Università di Salerno
PAOLA SIGNORI Università di Verona
PIERPAOLO SINGER Università di Salerno
SIMONE SPLENDIANI Università di Perugia
ANTONIO TENCATI Università di Brescia
FRANCESCO TESTA Sant’Anna Scuola Universitaria Superiore Pisa
PIERPAOLO TESTA Università di Napoli Federico II
MARIAPINA TRUNFIO Università di Napoli Parthenope
MARIA VERNUCCIO Sapienza Università di Roma
DONATA VIANELLI Università di Trieste
AGOSTINO VOLLERO Università di Salerno
ROBERTO VONA Università di Napoli Federico II
LUCA ZANDERIGHI Università di Milano
VII Al Lettore,
questo volume accoglie i full paper del Convegno Sinergie-SIMA 2019 Management and
sustainability: Creating shared value in the digital era, Sapienza Università di Roma, Roma, 20-21
giugno 2019.
La sostenibilità è senza dubbio uno dei temi sfidanti dell’epoca contemporanea. Lo sfruttamento delle risorse naturali legato alla crescente domanda di beni e servizi ha messo in evidenza quanto i modelli economici esistenti siano limitati. Un sistema di produzione e consumo basato su una logica lineare ove le risorse naturali sono estratte e trasformate per la produzione di beni e servizi è chiaramente non sostenibile. Inoltre, l’iniquità sociale, la povertà, e la fame nel mondo sono problemi sociali che devono essere globalmente affrontati.
Lo scopo del Convegno è discutere dei modelli di business sostenibili e delle necessarie evoluzioni strategiche come sfide per la gestione dell’impresa nel prossimo futuro. Un focus particolare è rivolto allo sviluppo di modelli di business e strategie basate su paradigmi di co-creazione di valore e alle opportunità oggi offerte dalle tecnologie digitali.
IX Cari Lettori e Convegnisti,
il call for paper del Convegno Sinergie-SIMA 2019 Management and sustainability: Creating
shared value in the digital era ha previsto la possibilità di presentare extended abstract oppure full paper. In totale sono pervenuti in redazione 102 extended abstract e 51 full paper.
Per gli extended abstract, la valutazione dei contributi ricevuti è stata operata dal Comitato Scientifico in base alla coerenza con il tema del Convegno e/o con gli studi management secondo i Gruppi Tematici SIMA, alla chiarezza e alla rilevanza (anche potenziale) dei contenuti proposti. Per i full paper, la procedura di valutazione dei contributi è stata condotta secondo il meccanismo della peer review da parte di due referee anonimi, docenti universitari ed esperti dell’argomento, scelti all’interno dell’Albo dei Referee della rivista Sinergie.
In particolare, i referee hanno seguito i seguenti criteri nella valutazione dei contributi: - chiarezza degli obiettivi di ricerca,
- correttezza dell’impostazione metodologica,
- coerenza dei contenuti proposti con il tema/track del convegno e/o con gli studi management, - contributo di originalità/innovatività,
- rilevanza in relazione al tema/track del convegno e/o agli studi management, - chiarezza espositiva,
- significatività della base bibliografica.
L’esito del referaggio ha portato a situazioni di accettazione integrale, accettazione con suggerimenti e non accettazione. In caso di giudizio discordante la decisione è stata affidata alla Direzione Scientifica. Ogni lavoro è stato poi rinviato agli Autori completo delle schede di referaggio per la valutazione delle modifiche suggerite dai referee, verificate in seguito dalla Redazione della rivista Sinergie.
A seguito del processo di valutazione sono stati accettati 41 full paper e 97 extended abstract, pubblicati in due distinti volumi. In questo volume dedicato ai full paper, i contributi sono articolati nelle seguenti gruppi:
- Management and sustainability: Creating shared value in the digital era - Management studies
Tutti i full paper di questo volume sono stati presentati e discussi durante il Convegno e pubblicati
online sul portale della rivista Sinergie (www.sijm.it).
Nel ringraziare tutti gli Autori per la collaborazione ci auguriamo che questo volume contribuisca a fornire un avanzamento di conoscenze sui modelli di business sostenibili e sulle necessarie evoluzioni strategiche come sfide per la gestione dell’impresa nel prossimo futuro.
XI
I
NDICE
Management and sustainability: Creating shared value in the digital era
How to collaboratively create shared-value? The role of crowdfunding in NPOs
MARIA CARMEN LAUDANO,LAMBERTO ZOLLO,CRISTIANO CIAPPEI,VINCENZO ZAMPI PAG. 3
Multi-sided platform: how digital technology supports collaborative action for sustainable development
GIANLUCA ELIA,ALESSANDRO MARGHERITA “ 15
Modelli di business sost enibili orientati all’innovazione. Un’analisi esplorativa di un caso studio
MARIA V.CIASULLO,PAOLA CASTELLANI,CHIARA ROSSATO,ORLANDO TROISI “ 35
Innovation in managing sustainability: a tentative of integration of an accounting instrument for employee health and safety
MASSIMO BATTAGLIA,MARCO FREY,LARA BIANCHI,EMILIO PASSETTI “ 57
The supply chain in the context of Industry 4.0: a qualitative analysis
MARIACARMELA PASSARELLI,PIETRO DE GIOVANNI,ALFIO CARIOLA “ 79
Smart destinations: towards a more sustainable tourism industry
ALFONSO VARGAS-SANCHEZ,TINDARA ABBATE,MIRKO PERANO “ 95
L’economia circolare tra sostenibilità e rivitalizzazione di siti produttivi storici
VINCENZO FORMISANO,MARIA FEDELE “ 113
Consumers’ attitude and purchase intention towards organic personal care products. An application of the S-O-R model
DONATA TANIA VERGURA,CRISTINA ZERBINI,BEATRICE LUCERI “ 135
Towards a framework for understanding recycling behavior in higher education institutions
ANGELO BONFANTI,ROSSELLA BARATTA,REZARTA SALLAKU,VANIA VIGOLO “ 149
Trust in green electricity: a measurement model
ANDREA MEZGER,LORENZO PABLO CABANELAS,KLAUS RÜDIGER,FRANCESCA CABIDDU “ 165
Last and least: when hotel guests don’t care about environmental policies
GRAZIANO ABRATE,REBECCA PERA,SARAH QUINTON “ 185
Consapevolezza e sensibilità dei turisti per offerte di turismo sostenibile. Logiche di interpretazione ambientale per la valorizzazione delle aree naturali
SILVIA PEDERZOLLI GIOVANAZZI,FEDERICA BUFFA,PIER LUIGI NOVI INVERARDI,UMBERTO MARTINI “ 201
The conflicting relation of farmers with management software. Evidences from durum wheat-pasta value chain in Italy
EMANUELE BLASI,CLARA CICATIELLO “ 221
Impatto socio-economico di una infrastruttura di ricerca: una metodologia di misurazione
MELITA NICOTRA,RICCARDO PAPALEO,GIACOMO CUTTONE,MARCO ROMANO “. 237
Management studies
Determinants of business model innovation: the role of proximity and technology adoption
MATTEO DEVIGILI,ELENA CASPRINI,TOMMASO PUCCI,LORENZO ZANNI “ 265
Industry 4.0 technologies and servitization st rategy: a good match?
XII
Open innovation and network dynamics. An analysis of openness of co-patenting collaborations in Italy
FRANCESCO CAPONE PAG. 297
An investigation over inbound open innovation in SMEs: insights from an italian manufacturing sample
ALFREDO D’ANGELO,ALESSANDRO BARONCELLI “ 313
Cross-border M&As and family businesses. The effect of generational stage
MARIO OSSORIO “ 323
Entrepreneurial logics underlying foreign country entry mode decisions
VALENTINA MACOVEI,BIRGIT HAGEN “ 339
Observing CSR embeddedness through an organizational network analysis lens. The case of an Italian multi-utility company
NATALIA MARZIA GUSMEROTTI,MARGHERITA MACELLARI,FRANCESCO TESTA,MARCO FREY “ 357
Talking about dialogism. Evidence from a participative experience in the water service industry
NORA ANNESI,MASSIMO BATTAGLIA,MARCO FREY “ 377
Principal investigators in entrepreneurial universities: a project network model
MELITA NICOTRA,JAMES CUNNINGHAM,MARCO ROMANO “ 395
Museum branding: challenges and strategies beyond works of art. A pilot study in Italy
ANNAMARIA ESPOSITO,ANGELA BESANA,M.CRISTINA VANNINI,CHIARA FISICHELLA “ 411
Sources of wine brand authenticity in the digital era
MICHELA MINGIONE,MIKE BENDIXEN,RUSSELL ABRATT “ 427
Why do people use instant messaging and social networking apps? An investigation from Italian mobile app users
SILVIA SARTI,NATALIA MARZIA GUSMEROTTI,FRANCESCO TESTA,MARCO FREY “ 445
La resilienza come elemento base per la competitività d’impresa? No, è una questione di vitalità!
SERGIO BARILE,FRANCESCO POLESE,LUCA CARRUBBO “ 461
Effetti del dinamismo di mercato sulle intese restrittive della concorrenza: un’analisi empirica
FABRIZIO IANNONI “ 491
Competenze manageriali e tecnologie 4.0 . Evidenze dal settore agrifood
FILOMENA IZZO,DOMENICO GRAZIANO,MARIO MUSTILLI “ 503
Il ruolo dei big data nelle decisioni di Marketing: una ricerca-azione basata sul Growth Hacking
FRANCESCO POLESE,ORLANDO TROISI,GENNARO MAIONE,MARA GRIMALDI “ 515
Le traiettorie di crescita internazionale e la presenza delle donne nei ruoli decisionali: un’indagine empirica sui CdA delle imprese italiane
MARIASOLE BANNÒ,GIORGIA MARIA D’ALLURA,ALEXANDRA DAWSON “ 531
Capacità dinamiche e vantaggio competitivo: un’analisi empirica nel retail
ELISA MARTINELLI,GIULIA TAGLIAZUCCHI,FRANCESCA DE CANIO “ 547
Dimmi chi segui e ti dirò chi sei
FRANCESCA NEGRI “ 559
Female leadership effects on profitability and business growth
MARIASOLE BANNÒ,VIOLA NICOLARDI “ 571
Anti-corruption disclosure in local public services
Sinergie-SIMA 2019 Conference Referred Electronic Conference Proceeding Management and sustainability: Creating shared value in the digital era ISBN 97888943937-4-3
20-21 June 2019 – Sapienza University, Rome (Italy) DOI 10.7433/SRECP.FP.2019.15
265
Determinants of business model innovation:
the role of proximity and technology adoption
MATTEO DEVIGILI*ELENA CASPRINITOMMASO PUCCILORENZO ZANNI **
Abstract
Objectives. This paper investigates the non-technological and technological determinants of BMI, focusing on the
role of proximity dimensions and technology adoption (TA). In particular, the paper looks at whether technological (TP), organizational (OP) and social proximities (SP) influence TA and BMI, while geographical proximity (GP) moderates these relationships. Then, a mediation effect of TA over TP, OP, and SP on BMI is also tested.
Methodology. Based on a unique sample of 123 firms, the impact of the technological, organizational and social
proximities over TA is tested by an OLS regression analysis. Then, a logit regression is adopted to test the impact of independent variables on BMI. Finally, a mediation analysis - obtained through g-computation formula - is adopted to look at the mediation effect of TP.
Findings. For both TA and BMI, TP has a positive influence and GP acts as moderator of SP. Moreover, while
GP negatively influences TA, it has an inverted U-shaped impact on BMI. Lastly, TA has a positive influence on BMI, and it is able to mediate the effect of TP over BMI.
Research limits. The study does not consider the multi-dimensional nature of each proximity dimension.
Practical implications. This study suggests that firms should invest in TA if they want to innovate their business
model, but also be careful at collaborating with too much socially proximate partners that may hinder BMI. However, when these partners are geographically close, their negative influence is mitigated.
Originality of the study. This is the first quantitative study on the role of proximity dimensions on BMI.
Key words: business model innovation; geographical proximity; organizational proximity; technological proximity;
social proximity; technology adoption
*
PhD Student of Development Economics and Local Systems - University of Trento e-mail: [email protected]
Postdoctoral Researcher of Management - University of Siena e-mail: [email protected]
Assistant professor of Management and Marketing - University of Siena e-mail: [email protected]
**
Full Professor of Management and Marketing - University of Siena e-mail: [email protected]
MATTEO DEVIGILI - ELENA CASPRINI - TOMMASO PUCCI - LORENZO ZANNI
266
1. Introduction
In a complex scenario made of heterogeneous actors, where firms boundaries are blurred and innovation lies in networks (Doganova and Eyquem-Renault, 2009; Chesbrough and Schwartz, 2007), it is crucial to understand if and how firms should develop and innovate their approach to making business. To tackle this issue, several academics from management areas such as entrepreneurship (Zott and Amit, 2007; Doganova and Eyquem-Renault, 2009; Berbegal-Mirabent, 2012), innovation (Teece, 2010; Chesbrough, 2010; Casprini et al., 2018), and strategy (Baden-Fuller and Mangematin, 2013; Magretta, 2002) employed business model (BM) as unit of analysis. Unfortunately, no agreement can be found among scholars on BM definition (Zott et al., 2011). So, while several researchers defined the BM as “the content, structure, and governance of
transactions” (Amit and Zott, 2001, p. 511) or as “the combination of a firm’s business strategy, organization, and capabilities and the resulting financial structure” (Casprini et al., 2014, p. 176),
others as “the heuristic logics that connects technical potential with the realization of economic
value” (Chesbrough and Rosenbloom, 2002, p. 529). Nevertheless, the following BM features are
undeniable: “the model must link the workings inside the firm to outside elements” (Baden-Fuller and Mangematin, 2013, p. 413) and it is influenced by the context where the firm operates (Casprini
et al., 2014; Pucci, 2016). Therefore, whatever a BM is named (architecture, conceptual tool,
description, etc.) or defined, it should explain “how an organization is linked to external
stakeholders, and how it engages in economic exchanges with them to create value for all exchange partners” (Zott and Amit, 2007, p. 181). For example, defining a cooperation and partnership
strategy, the BM may enable firms to gather new knowledge from outside, and generate a market outcome (Zott et al., 2011).
The literature on BM has underlined its ability to enhance or hinder firm’s competitive advantage (Markides and Charitou, 2004; Teece, 2010), economic performance (Pucci et al., 2017a; Zott and Amit, 2007), internationalization (Casadesus-Masanell and Ricart 2010; Onetti et al., 2012), and innovation (Chesbrough, 2010; Loon and Chik, 2018). For these reasons and for the daily usefulness, practitioners more than academicians recognized its economic value (Doganova and Eyquem-Renault, 2009). Today, much more discussion has been devoted to business model innovation (BMI), underlining its positive impact on firms’ performances (Lambert and Davidson, 2013). Indeed, entrepreneurs constantly looks for new ways of doing business, thus new BMs, in order to overturn the existing competitive rules leading the market (Ireland et al., 2001). Therefore, the literature investigated those factors enabling BMI, highlighting technological and market related forces as possible causes (Lambert and Davidson, 2013; Casprini et al., 2018). However, even though BM is undeniably tied to external factors, the social, spatial, cognitive, and cultural determinants have been largely overlooked (Mason and Chakrabarti, 2017).Our research aims to contribute to the literature answering the following research questions: (1) How does technology
adoption effect business model innovation?; (2) How do socio-cognitive relational structures influence business model innovation? Indeed, to the best of our knowledge, no paper has
investigated quantitatively to what extent technological proximity, organizational proximity and social proximity influence business model innovation and what is the role of geographical proximity in moderating these relationships.
As the BM is a “cognitive instrument” defined by the “understanding of causal links” (Baden-Fuller and Mangematin, 2013, p. 412), we expect socio-cognitive dimensions to influence the process of BMI, thus swaying how actors cognize new causal links. To test this relationship, we employ the proximity framework (Boschma, 2005; Knoben and Oerlemans, 2006), that has been applied by several management scholars (Lazzeretti and Capone, 2016; Geldes et al., 2017; Mason and Chakrabarti, 2017). Indeed, proximity has been understood as a pre-condition for innovation, nurturing knowledge and technology transfer among actors (Gertler, 1995; Knobben and Oerlemans, 2006; Pucci et al., 2017b): this corroborates its suitability in answering our second research question.
INDUSTRY4.0TECHNOLOGIESANDSERVITIZATIONSTRATEGY:AGOODMATCH?
267
The paper is structured as follow: section two provides a review of the relevant literature and the conceptual model; section three discusses methodology and sample characteristics; section four provides the research findings; section five presents discussion, conclusions and limitations of this research.
2. Literature review and conceptual model
2.1 Business model innovation
Defining BMI presents two levels of complexity. A first level is linked to the fact that literature still debates about what a BM is (Zott et al., 2011). If in its broadest terms a BM refers to the ways a company creates, delivers and captures value (Teece, 2010), a BMI could be simply defined as innovating a firm’s BM. A second level of complexity is linked to its potential dynamic nature. Indeed, whether BM per se has been treated as a static concept, BMI may refer to either a completely new BM, as in the case of AirBnB (Mikhalkina and Cabantous, 2015), or to the evolution of an existing BM (Casprini et al. 2014, Bohnsack et al., 2014). This implies that BM can be considered either as an outcome or as a process (Foss and Saebi, 2017). Referring to the former, literature has looked at two main aspects: the intensity and the audience of BMI. For what concerns the intensity, we can distinguish between incremental and radical BMI, on the basis of how much a BM is different from an existing one (Foss and Saebi, 2017). For example, Amit and Zott (2012) specify that a BMI could happen in several ways such as the addition of new activities or the change of parties performing one/more of the activities. For what concerns the audience, a BM may be novel for the firm or the industry (Casprini, 2015; Foss and Saebi, 2017). Referring to BMI as a process, literature is very heterogenous and has focused on several aspects such as the exploration and exploitation phases an established company could face in innovating its BM (Sosna et al., 2010), the learning mechanisms in the BMI trajectories (Berends et al., 2016), and the barriers - such as the resistance to modify asset configuration - to be faced in changing a BM (Chesbrough, 2010).
Beyond the definitional aspects, a crucial element is linked to understanding what drives BMI or, in other terms, its determinants. In particular, the drivers of BMI can be summarized in two broad categories: technological vs. non-technological factors. Technology represents undoubtedly a key driver of BMI (Gambardella and McGahan, 2010; Johnson et al., 2008), as also evidenced by the fact that BM literature has flourished following the advent of ICTs (see Zott et al., 2011 for a literature review). Additionally, research has also investigated the impact of sustainable technologies - as those applied in the case of electric vehicles (Bohnsack et al., 2014) - as the starting point of BMI for all, established and entrepreneurial businesses. More recently, the diffusion and adoption of industry 4.0 technologies has also posited new challenges for established firms that are trying to integrate 3D printing, could computing and robotics in their activities (Müller et al., 2018). Overall, it is evident that digitalization has enabled firms to innovate the way they create and capture value, both in the case of manufacturing firms (Coreynen et al., 2017) and services (Casprini et al., 2018; Remane et al., 2017). Non-technological factors have been less investigated or jointly investigated with technological ones. Among the drivers of BMI we can cite the economic conditions and legislation (Ghezzi et al., 2015; Murray and Scuotto, 2016; Sosna et
al., 2010), disruptive changes factors such as changes in customer habits and competitor strategy
change (Ghezzi et al., 2015; Murray and Scuotto, 2016), proximity (Mason and Chakrabarti, 2017), and the cognitive antecedents (Osiyevskyy and Dewald, 2015). For example, among the disruptive factors, we can mention sustainability. Many firms are changing their business models in order to be more sustainable not only from an economical, but mainly from a social and environmental point of view (see Bocken et al., 2014 for a recent literature review on sustainable business model). Indeed, as Foss and Saebi (2017)’s literature review evidences, identifying and understanding the determinants of BMI is an important gap to address.
MATTEO DEVIGILI - ELENA CASPRINI - TOMMASO PUCCI - LORENZO ZANNI
268
2.2 Proximity dimensions
The relationship among proximity, learning, knowledge creation, and innovation has largely attracted academic attention (Torre and Gilly, 2000; Boschma, 2005; Knoben and Oerlemans, 2006) and several scholars have recently highlighted proximity as a driver able to foster knowledge transfer among actors (Fitjar et al., 2016; Capone and Lazzeretti, 2018; Rodrìguez et al., 2018). A great issue within the proximity literature has always been the conceptualization and definition of such a complex variable, thus leading to many divergences, overlaps and ambiguities (Knoben and Oerlemans, 2006). Nevertheless, the literature agrees on proximity multidimensionality, thus distinguishing at least five dimensions: cognitive, institutional, organizational, social, and geographical (Boschma, 2005; Fitjar et al., 2016; Capone and Lazzeretti, 2018). Recently, a technological facet has also been accepted (Cantù, 2010; Enkel and Heil, 2014; Isaksson et al., 2016).
Geographical Proximity (GP) looks purely at the physical distance among actors (Boschma,
2005), known as a channel able to foster knowledge transfer across face-to-face interactions (Bindroo et al., 2012; Fernandes and Ferreira, 2013). Indeed, the transfer of complex and strategic knowledge, both tacit and explicit, is facilitated by close proximity among actors and organizations (Torre and Gilly, 2000; Knoben and Oerlemans, 2006). Though, GP is neither a necessary nor a sufficient condition for knowledge transfer, but it may act as a catalyst fostering the development and influence of other proximity dimensions (Boschma, 2005; Geldes et al., 2017).
Bounded rationality influences not only the ability to search for new knowledge, but also the way in which actors do structure and perform that search (Simon, 1995; Boschma, 2005). In such a cognitive constraint, at least two dimensions of proximity should be considered: Cognitive (CP) and
Technological Proximity (TP). CP is defined as the affinity or distance in individual perceptions and
cognition of phenomena (Knoben and Oerlemans, 2006), that is determined by both absorptive capacity and learning potentials (Boschma, 2005). Conversely, TP looks at the knowledge base that is at actors’ disposal to acquire or exchange a specific technology (Zeller, 2004; Knoben and Oerlemans, 2006). So, while CP looks at efficient communication, TP “refers to the extent to which
actors can actually learn from each other” (Knoben and Oerlemans, 2006, p.78).
Organizational proximity (OP) “consists of shared organizational principles, rules, and codes, including a corporate identity and a corporate philosophy (Blanc and Sierra 1999, 196), to promote a certain coherence within a firm and compatibility among collaborating firms” (Zeller,
2004, p. 88). Therefore, OP looks both to the inner-firm logic of belonging/similarity (see also Torre and Rallet, 2005), and to the inter-firms compatibility (see also Boschma, 2005).
Institutional proximity (IP) refers to both formal and informal “humanly devised constraint”
(North, 1991, p. 97) that are likely to influence socio-economic interactions. Therefore, not only the “rules of the game” governing economic actors, but also cultural habits and values (Boschma, 2005). Thus, IP is likely to foster knowledge transfer decreasing transaction complexity through the sharing of common rules and values.
Social proximity (SP) is able to decrease risk of opportunism felt by economic actors resorting
to trust mechanism (Hansen, 2015). Indeed, it “refers to the strength of social ties between agents at
the micro-level resulting from friendship, family relations or previous work-related interactions”
(ibid., 2015, p. 1674). This concept is rooted in the Granovetter’s embeddedness, thus highlighting the ability of “concrete personal relations and structures (or “networks”) of such relations in
generating trust and discouraging malfeasance” (1985, p.490).
Perhaps counterintuitively, it should be underlined that higher proximity does not simply bring higher innovation. As emphasized by Boschma (2005), both too high and too low proximity may negatively affect innovation: also known as the “proximity paradox” (Broekel and Boschma, 2012). Indeed, an insufficient proximity between actors is likely to prevent learning, knowledge transfer, and innovation, while a too high proximity may generate a lock-in effect, thus redundancy of information and knowledge. This intuition has been empirically supported, thus highlighting that
INDUSTRY4.0TECHNOLOGIESANDSERVITIZATIONSTRATEGY:AGOODMATCH?
269
actors at the right distance outperform those in lower or higher proximity positions (Fitjar et al., 2016).
2.3 Conceptual model and hypothesis
As previously highlighted, proximity is able to foster knowledge flow among actors both across formal and informal relationships, thus enhancing the sharing of technical advices, technology adoption and the development of innovation (Lazzeretti and Capone, 2016; Capone and Lazzeretti, 2018). Therefore, proximity dimensions are not only able to influence collaboration per se, but also the output of that collaboration (Werker et al., 2019).
Gertler (1995) was among the first authors to investigate the impact of proximity dimensions over technology adoption (TA), thus highlighting that physical, organizational, and cultural “closeness” are important factors for the adoption of advanced technologies. More recently, Feldmann et al. (2015) analyzed rDNA technologies diffusion, showing the crucial role of social and cognitive proximity in fostering TA. Still, to understand how proximity dimensions may affect TA is an open topic of inquiry, calling for further understanding since “technology diffusion will
vary across industries, regions and time periods and for incremental rather than for radical technological breakthroughs” (Feldman et al., 2015, p. 814). The importance of studying
technology adoption is crucial especially in this moment of transition towards the Fourth Industrial revolution. Several new technologies such as 3D printing, big data, robotics are becoming more diffused and easier adopted thanks to their lower costs, improved performance (Schmidt et al., 2015; Strange and Zucchella 2017), and public investments (e.g. the so-called Piano Calenda in Italy). However, contrary to previous industrial revolutions, Industry 4.0 highlights the importance of technology adoption by the several partners along their supply chain in order to fully realize its potential value. Indeed, it is not the sole adoption of a technology within a firm, but the adoption and integration of multiple technologies across several partners that make the difference between a simple operational improvement and a new business model. In order to contribute to this debate, this study considers GP, TP, OP, and SP as determinants of TA. Indeed, it does not investigate: IP, as differences in formal institutions are not relevant on this research contest and informal institutions are likely to overlap the notion of OP (Knobben and Oerlemans, 2006); CP, since we are investigating specific technologies and their related knowledge. Therefore, looking at formal and informal relationships among supply chain partners, our first hypothesis is:
HP.1: Technological, organizational and social proximity foster technology adoption.
As highlighted by the literature (Kirat and Lung, 1999; Boschma, 2005; Knobben and Oerlemans, 2006), GP is not a sufficient condition to foster knowledge transfer. Indeed, GP “may
enhance interactive learning and innovation more indirectly, most likely by stimulating the other dimensions of proximity” (Boschma, 2005, p. 71). Geldes et al. (2017) tried to empirically test this
intuition investigating the ability of GP to moderate the impact of non-spatial proximity over inter-organizational cooperation, obtaining a not significant effect. Also, Guan and Yan (2016) investigated the ability of GP to moderate TP influence over re-combinative innovation. Again, the empirical results did not support the theoretical intuition. Lastly, through a qualitative analysis, Letaifa and Rabeau (2013) found that geographical proximity may decrease the likelihood of social proximity development.
Given the divergent and scarce research on this challenging theoretical/empirical debate, we aim to test the following:
HP.2: Geographical proximity is able to positively moderate the impact of technological, organizational and social proximity on technology adoption.
MATTEO DEVIGILI - ELENA CASPRINI - TOMMASO PUCCI - LORENZO ZANNI 270 Technological Proximity Organizational Proximity Social Proximity Geographical Proximity Technology Adoption Business Model Innovation Hp. 1 Hp. 2 Hp. 3 Hp. 4 Hp. 5
In addition, as we have seen, TA is one of the main drivers of BMI. Indeed, the introduction of new technologies in a firm’s existing BM may change the way the firm creates and captures value. Literature is plenty of examples describing how new technologies have influenced many industrial sectors such as logistic (Alberti-Alhtaybat, et al., 2019) and shared mobility (e.g. Casprini et al., 2018) and empirical evidence is cumulating about the impact of digital (Li, 2018), 3D printing (Rayna and Striukova, 2016) and more in general industry 4.0 technologies (Müller et al., 2018) on BMI. Consequently, our third hypothesis is:
HP.3: Technology adoption fosters business model innovation.
Furthermore, a recent qualitative research (Mason and Chakrabarti, 2017) looks at the role of proximity in the process of business model design. In particular, it proposes an analytical framework combining Boschma’s (2005) proximities with the three BM elements of technology, market offering and network architecture, showing “how managers and entrepreneurs organize
their business activities to connect to business networks and markets” (Mason and Chakrabarti,
2017: p. 78). To the best of our knowledge, no paper has investigated quantitatively to what extent TP, OP and SP influence BMI. Nonetheless, proximity may be considered as a potential non-technological determinant of BMI. Henceforth, our fourth hypothesis is:
HP.4a: Technological, organizational and social proximity influence business model
innovation.
Moreover, since we have hypothesized that TP, OP and SP influences TA, we also suggest that: HP.4b: Technology adoption mediates the impact of technological, organizational and social
proximity on business model innovation.
Finally, as previously shown, the debate on the ability of GP to stimulate the other proximity dimensions is still open (Boschma, 2005; Guan and Yan, 2016; Geldes et al., 2017). Therefore, we aim to test the following:
HP.5: Geographical proximity moderates the effect of technological, organizational and social proximity on business model innovation.
Fig. 1: Conceptual Model
INDUSTRY4.0TECHNOLOGIESANDSERVITIZATIONSTRATEGY:AGOODMATCH?
271
3. Methodology
Data were collected through a structured survey submitted to a sample of Italian manufacturing firms during July and November 2018. Particularly, we gathered answers from firms involved mainly in B2B transactions, such as machinery, equipment, and components producers. Indeed, B2B firms offer a relevant case and suitable sample to test the relevance of proximity determinants, receiving both upstream, downstream, and horizontal stimuli from their supply chain partners. Meanwhile, the choice of an Italian sample was led by convenience, but we acknowledge the significance of an international comparison, leaving space for further research.
The collection process has been performed in two steps. Firstly, the questionnaire (introduced by a presentation letter) was sent by email to a sample of 467 Italian manufacturing firms. Secondly, a printed version of the survey was administered to entrepreneurs and managers during several practitioner conferences organized by ADACI (Italian purchasing and supply management association). From the first step we collected 31 survey answers, while from the second one we gathered 107 answers. Further, we deleted observations containing missing values, thus the final sample is composed by 123 complete and usable survey answers. Finally, we employed data from the Chamber of Commerce to collect information regarding firm’s age and employees.
On the basis of number of employees, the final sample is composed as follow: 38 micro firms (1-9 employees); 32 small firms (10-49 employees); 34 medium firms (50-249 employees); 19 large firms (≥ 250 employees).
3.1 Measures
To test our conceptual model, we operationalized the variables as follow.
Dependent Variable. BMI is a dummy variable operationalized asking firms if they have
changed or not their BMs, therefore those organizational and strategical structures allowing firms to generate value and achieve a competitive advantage (Pucci, 2016).
Independent Variables. Geographic [a], Technological [b], Organizational [c], and Social [d]
Proximities are operationalized asking respondents to assess from 1 “no impact” to 5 “high impact” what is the influence on the relationships with their supply chain partners of: [a] geographic proximity; [b] existence and sharing of digital infrastructures; [c] share of a similar organizational culture; [d] trust based on long term relationships.
Mediating Variable. For what concerns TA, firms were asked to indicate if they have
introduced during the period 2015-2017 the following technologies: (1) advanced manufacturing solutions, (2) additive manufacturing, (3) augmented reality, (4) simulation, (5) horizontal/vertical integration, (6) industrial internet, (7) blockchain, (8) cloud, (9) cyber-security, (10) big data and analytics (Piano Calenda, 2015). Each item is operationalized as a dummy variable (1 = “introduced” or 0 = “not-introduced”), thus TA was obtained as the arithmetic mean of the previous ten dummies.
Control Variables. To control for firms’ Age and Size, we used the natural logarithm of the
number of years since firm’s establishment and number of employees, respectively. Furthermore, we asked firms to state if they are family firms (dummy = 1) or not (dummy = 0). Lastly, R&D was operationalized asking respondents to state the percentage of R&D over the total turnover.
MATTEO DEVIGILI - ELENA CASPRINI - TOMMASO PUCCI - LORENZO ZANNI
272
Tab. 1: Measures description
Variables Items Source
Business Model Innovation
(dummy, 1 0 “selected”) Our processing and adaptation starting from Pucci (2016)
Proximity Dimensions What is the impact of the following factors on the relationships among the actors of your supply chain? Geographical Proximity
(Likert scale 1-5)
Actors’ geographical propinquity
Technological Proximity
(Likert scale 1-5)
Existence and sharing of digital infrastructures
Organizational Proximity
(Likert scale 1-5)
Share of a similar organizational culture
Social Proximity
(Likert scale 1-5)
Trust based on long term relationships
Technology Adoption (1) Advanced Manufacturing Solutions; (2) Additive
Manufacturing; (3) Augmented Reality; (4) Simulation; (5) Horizontal/Vertical Integration; (6) Industrial Internet; (7) Blockchain; (8) Cloud; (9) Cyber-security; (10) Big Data and Analytics
Piano Calenda, 2015 (dummy, 1 = “selected”)
Control variables
Age (log) Natural logarithm of the number of years since the
constitution
Size (log) Natural logarithm of the number of employees
Family Dummy, 1 = Selected
R&D Percentage of R&D expenditure on total turnover
Source: our elaboration
3.2 Econometric Strategy
To test the impact of the independent variables over TA, we employed an OLS regression analysis since TA (obtained through the arithmetic mean of ten dummies) can be treated as a continuous variable. Whereas, BMI is regressed over the independent variables employing a Logit model since BMI is a dichotomous variable.
Mediation analysis is obtained through g-computation formula (Daniel et al., 2011). We employed Model 1 for TA (see Table 3) and Model 6 (controlling also for the interaction term among TP and TA) for BMI (see Table 4), thus estimating the following regressions:
[1] TA = 1 Age(log) + Size(log) + Family + R&D + TP + GP + OP + SP
[2] BMI = Age(log) + Size(log) + Family + R&D + TA + TP + GP + (GP)2 + OP + SP (log) + TA*TP
To explain what g-formula package estimates, it is easier to decompose mediation analysis with counterfactuals (Daniel et al., 2011). Let’s assume that X is a binary exposure variable, M a binary mediator, and Y an outcome variable. I our case, the formula gives three outcomes: the total causal effect (TCE), the natural direct effect (NDE), and the natural indirect effect (NIE). TCE compares E(Y[x, M(x)]) for different values of x:
TCE = E(Y[1, M(1)]) - E(Y[0, M(0)])
NDE is a comparison of E(Y[x, M(x0)]) for different values of x, while x0 is fixed at the
baseline value:
NDE(0) = E(Y[1, M(0)]) - E(Y[0, M(0)])
Lastly, the NIE is obtained comparing E(Y[x, M(x0)]) for different values of x0, while keeping
x fixed: NIE(1)= E(Y[1, M(1)]) - E(Y[1, M(0)])
The g-formula infers TCE as described above, while for NDE and NIE it combines several simulations of M under different hypothetical values of X. Therefore, if X is binary, M is simulated for both X=1 and X=0.
INDUSTRY4.0TECHNOLOGIESANDSERVITIZATIONSTRATEGY:AGOODMATCH?
273
In our case, X is not binary, but it is a categorical variable with baseline value equal to 1. In this case, the package compares this baseline value with the distribution of X. Additionally, it enables to control for confounders in both exposure-outcome and mediator-outcome relationships.
Computations were performed through Stata 14.2.
4. Results
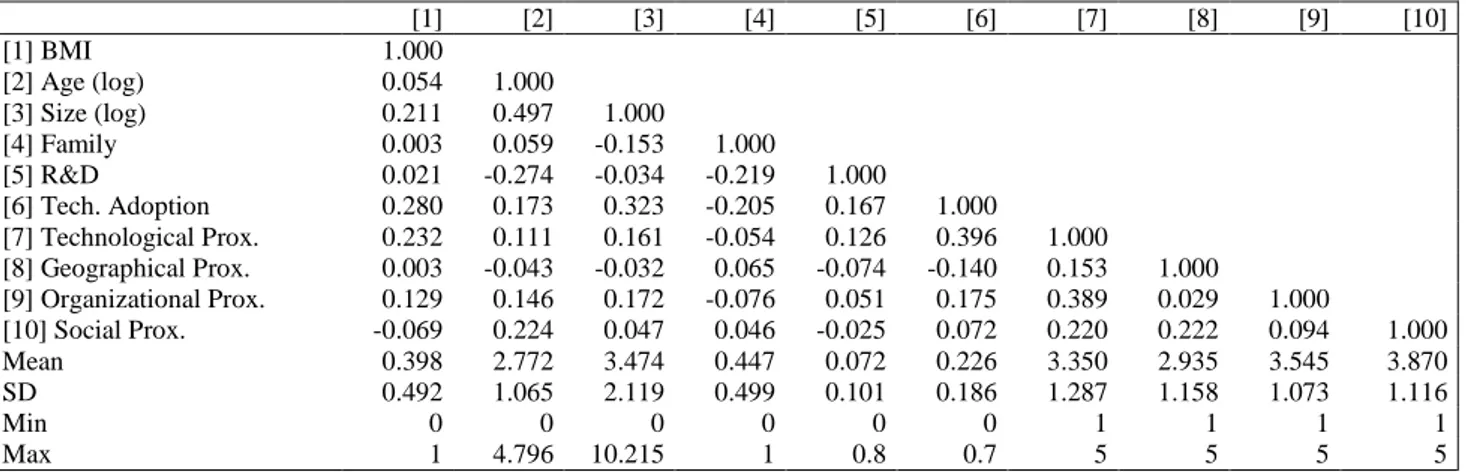
Table 2 provides descriptive statistics and correlation analysis and Appendix 1 displays VIF scores and Tolerance levels. Low correlation levels (all lower than 0.5 in absolute value), together with low VIF scores (all equal or lower than 1.60) and good Tolerance levels (all greater than 0.62) guarantee the absence of multicollinearity among model variables (Kunter et al., 2004).
Tab. 2: Descriptive Statistics and Correlation Analysis
[1] [2] [3] [4] [5] [6] [7] [8] [9] [10] [1] BMI 1.000 [2] Age (log) 0.054 1.000 [3] Size (log) 0.211 0.497 1.000 [4] Family 0.003 0.059 -0.153 1.000 [5] R&D 0.021 -0.274 -0.034 -0.219 1.000 [6] Tech. Adoption 0.280 0.173 0.323 -0.205 0.167 1.000 [7] Technological Prox. 0.232 0.111 0.161 -0.054 0.126 0.396 1.000 [8] Geographical Prox. 0.003 -0.043 -0.032 0.065 -0.074 -0.140 0.153 1.000 [9] Organizational Prox. 0.129 0.146 0.172 -0.076 0.051 0.175 0.389 0.029 1.000 [10] Social Prox. -0.069 0.224 0.047 0.046 -0.025 0.072 0.220 0.222 0.094 1.000 Mean 0.398 2.772 3.474 0.447 0.072 0.226 3.350 2.935 3.545 3.870 SD 0.492 1.065 2.119 0.499 0.101 0.186 1.287 1.158 1.073 1.116 Min 0 0 0 0 0 0 1 1 1 1 Max 1 4.796 10.215 1 0.8 0.7 5 5 5 5
Notes: N=123. Correlation coefficients greater than 0,2 in absolute value are statistically significant at 95%.
Source: our elaboration
4.1 Regression model
Table 3 displays results of TA regressed over the explanatory variables. In Model 0 only control variables are introduced, thus highlighting both Size and R&D to have a positive and significant influence on the dependent variable. Then, Model 1 introduces the independent variables: TP shows a positive and highly significant influence, while GP has a negative and significant effect. Moreover, while the effect of Size remains significant and positive, the coefficient of R&D loses both magnitude and significance. Both OP and SP have an effect not statistically significant. So, Hp.1 is partially supported as SP and OP do not have a direct effect on TA. Furthermore, we tested the ability of GP to moderate the effect of TP, OP, and SP on TA. As shown in Model 2, only the interaction term GP*SP has a significant and positive effect on the dependent variable. Hence, Hp.2 is partially supported since GP is not able to positively moderate TP and OP. Lastly, both Model 1 and Model 2 show good levels of R2, thus highlighting a good model fit.
MATTEO DEVIGILI - ELENA CASPRINI - TOMMASO PUCCI - LORENZO ZANNI
274
Tab. 3: Regression Analysis on Technology Adoption
Technology Adoption
VARIABLES Model 0 Model 1 Model 2
Age(log) 0.0175 0.00874 0.00892 (0.0172) (0.0170) (0.0170) Size(log) 0.0228** 0.0195** 0.0197** (0.00878) (0.00821) (0.00813) Family -0.0499 -0.0461 -0.0496 (0.0329) (0.0305) (0.0307) R&D 0.320** 0.191* 0.203* (0.127) (0.113) (0.108) Technological Prox. 0.0532*** 0.0578*** (0.0119) (0.0123) Geographical Prox. -0.0282** -0.108*** (0.0117) (0.0361) Organizational Prox. -0.00439 0.000115 (0.0123) (0.0127) Social Prox. 0.00309 -0.0512* (0.0117) (0.0279)
Geo. Prox. * Soc. Prox. 0.0204**
(0.00926)
Constant 0.0979** 0.0490 0.225**
(0.0474) (0.0684) (0.102)
Observations 123 123 123
R-squared 0.157 0.290 0.307
Robust standard errors in parentheses *** p<0.01, ** p<0.05, * p<0.1
Source: our elaboration
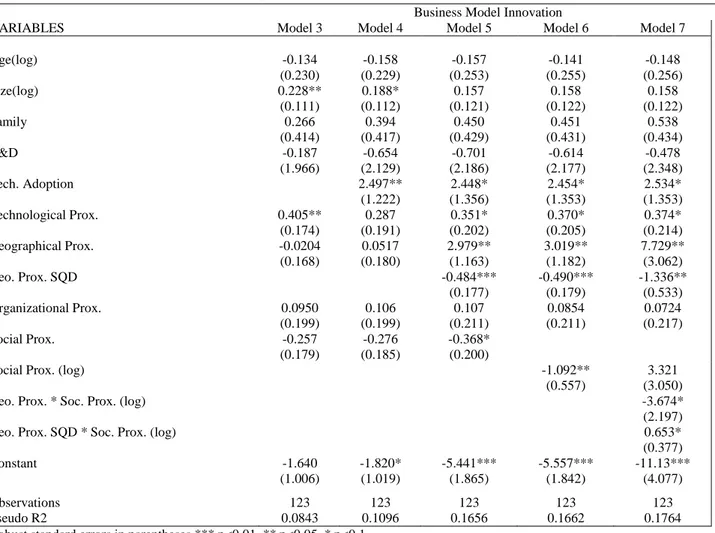
Table 4 summarizes the logit analysis obtained regressing BMI over the explanatory variables. In Model 3 BMI is regressed over the four proximity dimensions. Only TP shows a positive and significant effect on the likelihood of having BMI, while GP, OP, and SP display a not significant effect. In Model 4 TA is introduced, thus showing a positive and significant coefficient. Moreover, it should be noted that TP coefficient loses its magnitude and the standard error increases, thus suggesting a mediation effect of TA over TP on BMI. In Model 5 and 6 we take into account nonlinear effects for GP and SP, improving the Pseudo R2 from 0.109 to 0.165 and 0.166. Here, GP shows a strong inverted U-shaped effect over the likelihood of having BMI, while SP shows a negative linear effect improved in terms of significance after the log transformation. Here, TP acquires a positive and significant effect if compared to Model 4, while TA coefficient loses magnitude and the standard error increases. Thus, Hp.3 is supported, while Hp.4a is partially supported. Lastly, we investigated the moderating ability of GP over TP, OP, and SP: as shown in Model 7, only the interaction term GP*SP is statistically significant and curvilinear. Indeed, Figure 2 shows that for extreme values of spatial distance or proximity, the effect of SP on BMI is negatively moderated, while for medium-low to medium-high values of spatial proximity, the effect of SP on BMI is positively moderated. Hence, Hp.5 is partially supported.
INDUSTRY4.0TECHNOLOGIESANDSERVITIZATIONSTRATEGY:AGOODMATCH?
275
Tab. 4: Logit Regression Analysis on Business Model Innovation
Business Model Innovation
VARIABLES Model 3 Model 4 Model 5 Model 6 Model 7
Age(log) -0.134 -0.158 -0.157 -0.141 -0.148 (0.230) (0.229) (0.253) (0.255) (0.256) Size(log) 0.228** 0.188* 0.157 0.158 0.158 (0.111) (0.112) (0.121) (0.122) (0.122) Family 0.266 0.394 0.450 0.451 0.538 (0.414) (0.417) (0.429) (0.431) (0.434) R&D -0.187 -0.654 -0.701 -0.614 -0.478 (1.966) (2.129) (2.186) (2.177) (2.348) Tech. Adoption 2.497** 2.448* 2.454* 2.534* (1.222) (1.356) (1.353) (1.353) Technological Prox. 0.405** 0.287 0.351* 0.370* 0.374* (0.174) (0.191) (0.202) (0.205) (0.214) Geographical Prox. -0.0204 0.0517 2.979** 3.019** 7.729** (0.168) (0.180) (1.163) (1.182) (3.062) Geo. Prox. SQD -0.484*** -0.490*** -1.336** (0.177) (0.179) (0.533) Organizational Prox. 0.0950 0.106 0.107 0.0854 0.0724 (0.199) (0.199) (0.211) (0.211) (0.217) Social Prox. -0.257 -0.276 -0.368* (0.179) (0.185) (0.200)
Social Prox. (log) -1.092** 3.321
(0.557) (3.050)
Geo. Prox. * Soc. Prox. (log) -3.674*
(2.197)
Geo. Prox. SQD * Soc. Prox. (log) 0.653*
(0.377)
Constant -1.640 -1.820* -5.441*** -5.557*** -11.13***
(1.006) (1.019) (1.865) (1.842) (4.077)
Observations 123 123 123 123 123
Pseudo R2 0.0843 0.1096 0.1656 0.1662 0.1764
Robust standard errors in parentheses *** p<0.01, ** p<0.05, * p<0.1
Source: our elaboration
Fig. 2: Interaction effect on BMI
Source: our elaboration
4.2 Mediation analysis
Table 5 shows mediation analysis obtained through g-computation formula (Daniel et al., 2011).
MATTEO DEVIGILI - ELENA CASPRINI - TOMMASO PUCCI - LORENZO ZANNI
276
Tab. 5: Mediation Analysis
G-computation estimate
Bootstrap Std. Err z P>|z| Normal-based [95% Conf. Interval]
TCE .423 .054 7.90 0.000 .318 .528
NDE .171 .057 3.01 0.003 .059 .282
NIE .252 .066 3.79 0.000 .122 .382
Source: our elaboration
The mediation analysis results show that both total causal effect (TCE), natural direct effect (NDE), and natural indirect effect (NIE) are significant. From TCE, we can conclude that TP has a causal effect on BMI. Indeed, if TP is equal to 1 (baseline value), the likelihood of having BMI would decrease of 0.423; a large part of this reduction is mediated by TA, 0.252. Therefore, we can conclude that TA is able to mediate the effect of TP on BMI.
We tested mediation also for SP and OP, obtaining not significant results. Consequently, Hp.4b is supported only in the case of TP.
5. Discussion and conclusion
Focusing on the role of both technological and non-technological factors, this research offers some intriguing findings for both theory and practice.
For what concerns TA, having a strong relation (SP) with supply chain partners per se is a not sufficient condition. However, if that relationship goes with face-to-face contact, its effect becomes relevant. Indeed, the introduction of new technologies is negatively influenced by long-term relationships, but if that exchange of knowledge or advices happens in close proximity, the negative effect is smoothed. This result is in contrast with Feldman et al (2015) that emphasized the crucial role of social connections in fostering technology diffusion. Additionally, sharing similar digital infrastructures (TP) with supply chain actors enhances firms’ ability to adopt new technologies. Indeed, to use such infrastructures, firms need a specific technical knowledge and practical understanding of that knowledge. Hence, having in common such a specific knowledge and experience base enables firms reciprocal understanding (Zeller, 2004). Moreover, a strong negative effect on TA is exerted by spatial closeness (GP). This result suggests that actors facing high GP with partners are less likely to introduce new technologies, falling in a lock-in effect and technological redundancy.
For what concerns BMI, its relationship with technological and non-technological variables is more complex, involving both linear and non-linear effects. Having adopted new technologies, firms are more prone to modify their BM to efficiently tackle the technological challenge faced. This result is in line with previous researches on BMI (Rayna and Striukova, 2016; Li, 2018; Müller
et al., 2018). Additionally, actors that share too strong relationships with supply chain partners are
less likely to engage in modification of their BM. This negative effect is partially smoothed by face-to-face contacts and only for medium values of both SP and GP. This negative effect may be explained by bounded rationality of actors that push them to search for new knowledge and technical advices among socially closer partners, that are more likely to share similar values, knowledges, and routines. This unconscious custom may increase the likelihood of lock-in effect, knowledge redundancy, thus hindering innovation. Moreover, actors that share digital infrastructures are more likely to engage in the reshaping of their BM. However, this effect is largely indirect, thus driving BMI across the introduction of new technologies. Therefore, TP is beneficial for both TA and BMI. Lastly, actors displaying too high or too low values of spatial closeness with supply chain partners are less likely to innovate their BM. This inverted U-shaped effect fits perfectly the theoretical assumption discussed by the literature (Boschma, 2005).
INDUSTRY4.0TECHNOLOGIESANDSERVITIZATIONSTRATEGY:AGOODMATCH?
277
Sharing a final thought on the effect of OP, thus the sharing of a similar organizational culture, it is worth. Indeed, OP has a not significant effect on both TA and BMI, something unexpected if compared to previous results on collaboration networks and innovation (Marrocu et al. 2013; Geldes et al., 2017). The reason for this may depend on the timing of this research. Indeed, as underlined by Feldman et al. (2015) the impact of proximity dimensions may change not only over industry but also over time. Indeed, we are facing the first steps towards a digitalization process that is calling economic actors to completely reshape not only their organizational structure, but also values, customs, culture, and so forth. Therefore, OP may result not significative for TA and BMI, since firms are unconsciously facing a modification process that is ongoing. Perhaps, to share a common organizational culture is still a latent firms’ need for cooperation and partnership agreements, that may become expressed when digitalization and Industry 4.0 will actually spread. We leave this topic open for further research.
This paper provides interesting contributions to theory and literature on business model innovation. First, studies on business model innovation in Industry 4.0 are still in their embryonic stage and, albeit initial evidence has emerged, it is mainly qualitative in nature. Hence, our paper presents some first empirical quantitative evidence treating BMI as the outcome (Foss and Saebi, 2017), rather than a process (e.g. Sosna et al., 2010), and showing whether a technological determinant, i.e. Industry 4.0 technologies adoption, has an impact on BMI. Then, we looked at an under researched non-technological determinant of BMI, that of proximity dimensions. This provides a first quantitative evidence of the influence of proximity on BMI, thus enriching the previous qualitative contribution of Mason and Chackrabarti (2017). Thirdly and foremost, this research gives a partial support to the theoretical intuition of Boschma (2005), showing that being geographically close or distant could influence the effect of at least SP. This provides an interesting contribution in the context of Industry 4.0 and requires further investigation. As a matter of fact, whether on the one side technologies 4.0 may express their full potential once adopted along the entire supply chain., our results suggest that companies need to pay attention to being too much geographically close and socially proximate. Indeed, having strong relationships with upstream and downstream partners is not enough in adopting new technologies and it leads to lower business model innovation. However, geographical proximity plays an important role in influencing these relationships. It is only when social relationship goes with face-to-face contact, that its effect becomes relevant as shown by our findings. Companies face lot of internal obstacles in adopting new technologies even when adopted by their partners. One of the reasons may reside on their perception as highly risky technologies, especially in the case of smaller firms. However, when socially proximate companies are also geographically close, the adoption of new technology may be facilitated. In other terms, when companies are able to touch and see their partners’ technologies, having face-to-face contact with their partners, they are more prone to adopt them. In addition, being too little (much) geographically close and too little (much) socially proximate could damage business model innovation. To the best of our knowledge this is the first contribution that emphasizes the importance of balancing proximities dimensions in improving business model innovation.This research has also some crucial managerial implications. Firstly, in a changing technological environment that is going towards a deep modification of the industrial system (fourth industrial revolution), firms should invest on knowledge. Hence, economic actors should try to acquire that knowledge both outside firm boundaries (e.g. collaborations with Universities or research centers; hiring highly skilled and well-trained employees) and inside (e.g. training courses for both managers and employees). Secondly, firms should invest on new technologies, thus boosting internal stirring and avoiding falling in myopia and inertia. Thirdly, actors should avoid looking for knowledge and technological advices solely among socially close partners. Indeed, overcoming this cognitive constraint may enhance the access to new and strategic knowledge that will translate in organizational renewal. Lastly, even though globalization and transport improvements lowered the significance of physical boundaries, economic actors should still pay attention to maintain both local relationships and distant ones strategically crucial. Therefore, firms
MATTEO DEVIGILI - ELENA CASPRINI - TOMMASO PUCCI - LORENZO ZANNI
278
should actively manage their relationship balancing not only local and distant relations, but also local and distant knowledge.
Nonetheless, this research has also some policy implications. A first consideration is linked to the relationship between size and technology adoption: our findings suggest that larger firms have a higher propensity to adopt new technologies than smaller ones. This evidence supports the need to develop regional policies in favor of small and medium-sized firms (that constitute the main business archetype of Italy), thus enabling them to catch up with the latest technological challenges. Furthermore, since technological proximity results from investments in education and, in particular, in the so-called STEM (Science, Technology, Engineering and Mathematics) disciplines, policy makers should direct higher investments towards education and learning. Finally, the new challenge offered by Industry 4.0 and digitalization is calling not only for capable managers, but also for public administrators able to understand and lead local context towards this challenge. Supporting education and boosting collaboration among local and distant stakeholders is a “must” for local administrators.
This research is not without limitations. Indeed, our study does not consider the multi-dimensional nature of each proximity dimension since our operationalization relies on single-item scales. Moreover, our firms belong to multiple sectors and we have not employed sector dummies to control for sectoral specificities. Lastly, the choice of an Italian sample represents a limitation that may hinder generalizability, thus calling for a comparison at international level.
Appendix
Appendix 1: VIF and Tolerance levels
TA Regression BMI Logit
Variable VIF Tolerance VIF Tolerance
Business Model Innovation 1.16 0.8634
Technology Adoption 1.41 0.7103 1.46 0.6857 Age (log) 1.59 0.6288 1.60 0.6265 Size (log) 1.50 0.6659 1.53 0.6518 Family 1.12 0.8951 1.13 0.8887 R&D 1.20 0.8367 1.20 0.8359 Technological Proximity 1.47 0.6786 1.50 0.6673 Geographical Proximity 1.14 0.8782 1.14 0.8773 Organizational Proximity 1.21 0.8294 1.21 0.8284 Social Proximity 1.16 0.8590 1.18 0.8463
Mean VIF = 1.31 Condition Number: 17.5181 (TA Regression); 18.0623 (BMI Logit)
Source: our elaboration
References
ALBERTI-ALHTAYBAT L.V., AL-HTAYBAT K., HUTAIBAT K. (2019), “A knowledge management and sharing business model for dealing with disruption: The case of Aramex”, Journal of Business Research, vol. 94, pp. 400-407.
AMIT R., ZOTT C. (2001), “Value creation in e-business”, Strategic Management Journal, vol. 22, n. 6-7, pp. 493-520. AMIT R., ZOTT C. (2012), “Creating value through Business Model Innovation”, MIT Sloan Management Review, vol.
53, n. 3, pp. 41-49.
BADEN-FULLER C., MANGEMATIN V. (2013), “Business models: A challenging agenda”, Strategic Organization, vol. 11, n. 4, pp. 418-427.
BERBEGAL-MIRABENT J. (2012), “Business model innovation in entrepreneurship”, International Entrepreneurship
and Management Journal, vol. 8, n. 4, pp. 449-465.
BERENDS H., SMITS A., REYMEN I., PODOYNITSYNA K. (2016), “Learning while (re)configuring: business model innovation processes in established firms”, Strategic Organization, vol. 14, n. 3, pp. 181-219.
BINDROO V., MARIADOSS B.J., PILLAI R.G. (2012), “Customer Clusters as Sources of Innovation-Based Competitive Advantage”, Journal of International Marketing, vol. 20, n. 3, pp. 17-33.