RESEARCH ARTICLE
Forecasting national and regional level
intensive care unit bed demand during
COVID-19: The case of Italy
Simone GittoID1*, Carmela Di Mauro2, Alessandro Ancarani2, Paolo Mancuso3
1 Department of Information Engineering and Mathematics, University of Siena, Siena, Italy, 2 Management Engineering Group, DICAR, University of Catania, Catania, Italy, 3 Department of Industrial Engineering, University of Rome Tor Vergata, Rome, Italy
Abstract
Given the pressure on healthcare authorities to assess whether hospital capacity allows properly responding to outbreaks such as COVID-19, there is a need for simple, data-driven methods that may provide accurate forecasts of hospital bed demand. This study applies growth models to forecast the demand for Intensive Care Unit admissions in Italy during COVID-19. We show that, with only some mild assumptions on the functional form and using short time-series, the model fits past data well and can accurately forecast demand fourteen days ahead (the mean absolute percentage error (MAPE) of the cumulative four-teen days forecasts is 7.64). The model is then applied to derive regional-level forecasts by adopting hierarchical methods that ensure the consistency between national and regional level forecasts. Predictions are compared with current hospital capacity in the different Ital-ian regions, with the aim to evaluate the adequacy of the expansion in the number of beds implemented during the COVID-19 crisis.
1. Introduction
By giving rise to sudden surges in hospital admissions, pandemics place a heavy load on health systems [1]. The current COVID-19 outbreak is putting the entire world to test [2,3], and has impacted countries such as Brazil, Italy, Spain, UK and the US more severely than others. In spite of mitigation measures adopted, both hospital infectious wards and especially intensive care units (ICU henceforth) have been overburdened in many countries [4]. Since shortage of ICU beds may engender a trade-off between saving the life of a patient over another, the ability to timely forecast the impact of the epidemic on ICU bed capacity usage is a critical compo-nent of adequate outbreak management [5]. Timely forecasts are in fact key to adjusting ICU capacity to meet demand or planning measures for the transfer of patients.
Researchers in the medical field typically use epidemic models of disease spread to gain insight into the transmission dynamics. These models hold two sources of uncertainty, the first linked to observational error and limited resolution and detail from available data, and the second stemming from uncertainty in the model structure, especially when confronting a1111111111 a1111111111 a1111111111 a1111111111 a1111111111 OPEN ACCESS
Citation: Gitto S, Di Mauro C, Ancarani A, Mancuso
P (2021) Forecasting national and regional level intensive care unit bed demand during COVID-19: The case of Italy. PLoS ONE 16(2): e0247726. https://doi.org/10.1371/journal.pone.0247726
Editor: Simone Lolli, Italian National Research
Council (CNR), ITALY
Received: October 31, 2020 Accepted: February 12, 2021 Published: February 25, 2021
Copyright:© 2021 Gitto et al. This is an open access article distributed under the terms of the Creative Commons Attribution License, which permits unrestricted use, distribution, and reproduction in any medium, provided the original author and source are credited.
Data Availability Statement: Data are publicly
available at: https://github.com/pcm-dpc/COVID-19.
Funding: The author(s) received no specific
funding for this work.
Competing interests: The authors have declared
outbreaks triggered by a novel virus. Furthermore, some studies have underlined the sensitiv-ity of key epidemiological parameters to model assumptions [6].
Several very recent studies have tackled the problem of predicting COVID-19 related health outcomes using data-driven models. Petropoulos and Makridakis predicted cumulative level of confirmed cases, deaths and recoveries at worldwide level using models from the exponen-tial smoothing family [7]. They used data for the period from January 22th to March 11th, 2020 to produce ten-days-ahead point forecasts. Utkucan and Tezcan compare grey model, nonlinear grey Bernoulli model and fractional nonlinear grey Bernoulli model to forecast the number of confirmed case in Italy, UK and USA using a 35 days training sample (from March 19th to April 22th, 2020) [8]. Parbat and Chakraborty propose a prediction model of the total number of deaths, patients recovered, cumulative number of confirmed cases and number of daily cases of COVID19 in India using support vector regression [9]. The data are analyzed for the period from March 1stto April 30th, 2020 (61 Days) with a training sample of about 60 days (30thJune). Ribeiro et al. build forecasts of cumulative confirmed cases over ten Brazilian states with three forecasting horizons (one, three, and six-days-ahead) [10]. A training sample of 34–53 days is used to compare six models (autoregressive integrated moving average, cubist regression, random forest, ridge regression, support vector regression, and stacking-ensemble learning). Chakraborty and Ghosh analyzed COVID-19 cases for India, Canada, France, South Korea, and the UK using ARIMA, wavelet-based forecasting techniques and a hybrid forecast-ing approach [11]. Their observation sample is based on 64–76 observations according to the country, through which they compare the fit of the proposed models on past data. Torrealba-Rodriguez et al. predict confirmed cases in Mexico using Gompertz, logistic and artificial neu-ral network models [12]. Their sample includes 60 observations (from February 27, 2020 to May 8, 2020) to build seven-day forecasts (from May 9th to 16th). Singh et al. test the accuracy of a hybrid wavelet-ARIMA model using past 66 days data of death cases to generate forecasts 16 days ahead for five countries (Italy, Spain, France, USA, and UK) [13].
Phenomenological models (also known as growth models), which are used extensively in modelling and forecasting the diffusion of innovations, new technologies or new products in marketing and operations management [14], have recently been employed also to predict epi-demics [15–18]. This class of models offers simple, data-driven methods that can be used with small samples and do not require hypotheses about epidemiological parameters. When addressing the problem of forecasting ICU demand during the initial phase of an epidemic, growth models represent a useful tool because they allow obtaining rapid, yet accurate predic-tions using short time-series and forecasting over a time horizon sufficient for ICU bed capac-ity adjustments to be implemented.
Another important issue when forecasting ICU demand lies in the fact that the spread of the disease has been highly variable within a single country. To illustrate, the Italian national health system’s capacity to match the demand for ICU beds has dramatically been put under stress especially in those areas of the country that were hit first and foremost [19], but less so in several other regions where the number of hospitalized patients has remained under control throughout the crisis. The uneven spread of the disease across the country implies the need for accurate forecasts of ICU demand not only at national but also at regional level. Further, it is critical that forecast models provide regional-level estimates that are consistent with national-level ones, in order to allow effectively planning healthcare capacity adjustments associated with a single region or the overall (national) healthcare system. This consistency requirement is especially relevant in Italy because the Italian National Healthcare System is organized on a regional basis. In such a context, running separate forecasts at regional and national level with-out a consolidation would generate inaccurate results. To ensure the reliability of consolidated
multilevel forecasts and to improve the accuracy of the overall forecast, hierarchical forecast techniques can be adopted [20,21].
This study applies three growth models and hierarchical forecasting methods to predict the demand of ICU beds at national and regional level in Italy during the most severe period of the COVID-19 outbreak. We show that, with only mild assumptions on the functional form, one model fits past data on bed demand well and can be used to forecast demand in the days ahead.
With respect to previous contributions, this study innovates by: i) proposing the use of Har-vey model [22], which represents a novel application in the case of predicting COVID-19 health outcomes; ii) showing the suitability of the proposed model using a short training sam-ple (22, 24, 26 or 28 observations) and a rather long (fourteen-days) period of forecast, in com-parison with the more widely used logistic and Gompertz models; iii) introducing the
hierarchical forecasting approach to predict COVID-19 ICU admissions in order to ensure consistency and increase accuracy of both national and regional series.
The relevance of the study lies in the provision of a decision support tool that can be straightforwardly implemented in countries that are being hit by the COVID-19 outbreak. Forecasts obtained can be compared with current ICU capacity, with the aim to estimate the need to either expand the number of beds or to organize the transfer of patients to neighbour-ing areas.
The article is organised as follows: Section 2 introduces the methodologies adopted, Section 3 provides a brief overview of the data used, Section 4 presents model fit and forecasts, while Section 5 concludes with a discussion of the results.
2. Methods
2.1. Growth models
The most frequently used approach in epidemiology for forecasting the evolution of an infec-tious disease adopts mechanistic models relying on assumptions about the transmission mech-anisms of the disease in an infected population, which are embedded in the model parameters (e.g. number of infected over the total population, percentage of infected requiring intensive care, expected length of the outbreak). This approach uses different variants of the so-called SIR model (susceptible, infectious, recovered), which allows an exact evaluation of the epidemi-ological diffusion of the disease in the long term [23]. However, SIR models appear not to per-fectly suit situations in which the transmission mechanisms of the disease are only partially known and real-time data are incomplete. As past experiences with the SARS and Ebola out-breaks have shown, knowledge about transmission mechanisms of new diseases may develop slowly, therefore requiring model assumptions that may turn out to be inaccurate in the first phases of the disease management. Specifically, in order to forecast the demand for hospital beds during the outbreak, SIR models make starting hypotheses concerning a number of parameters, which are then adjusted as more knowledge about the outbreak and the disease is accumulated [18,24–26].
The experience with COVID-19 has further shown that it is difficult, if not impossible, for countries that are being hit by the disease to use previous estimates from other countries (e.g. data from China or Korea) as starting model parameters. In fact, comparability is severely hin-dered by the fact that the infection rate in the population and the mortality rate exhibit signifi-cant cross-country differences due to varying national public health practices, data collection and political containment decisions. This limitation may extend to comparisons of infection rates among regions within a country, depending on the degree of autonomy of regional healthcare bodies.
Past epidemics have taught that it is important to balance the need for detailed models against the limitations stemming from the parameter information they require. Knowing the growth rate of cases and when they will peak is critical for healthcare providers to organize an adequate response. For this reason, phenomenological models (also known as growth models) that use a fully data-driven approach are also used in forecasting the diffusion of an epidemic, in alternative to or in conjunction with SIR models [15]. In spite of their simplicity, growth models might produce good forecasts using small samples, even in the absence of hypotheses about the population, the rate of diffusion, and the upper limit of the infection curve [16,17]. Furthermore, even if they have fewer parameters, these models may produce better forecasts than mechanistic ones for forecasts of 1–2 weeks [18].
Many functional forms have been used in epidemic forecasting research, as documented by other contributions in this journal. The logistic model is the baseline model. It is defined by the equation:
Yt¼
y1
1 þ y2expð y3tÞ
þεt ð1Þ
WhereYtis the cumulative level of the variable,t denotes time, Θ1,Θ2andΘ3are the
parame-ters to be estimated using nonlinear least squares andεtis the error term. The curve is
sym-metric about its points of inflection (i.e., half the relevant population has the disease at the point of inflection).
The Gompertz curve is another widely applied model. Using the same notation as in (1), the equation is:
Yt¼ y1exp½ y2expð y3tÞ� þ εt ð2Þ
Unlike the logistic, this curve is asymmetric about its points of inflection.
Flexible functional forms have been proposed with respect to the baseline logistic model [14,26,27]. Forecast accuracy has been shown to vary across different growth models. Young compared forecast accuracy over the last three data points for nine different models [26] and showed that the model proposed by Harvey was the most accurate (Eq 3) [22].
lnðytÞ ¼ b0þ b1lnðYt 1Þ þ b2t þ εt ð3Þ
In Harvey’s model,ytis the change ofYt(that isyt=Yt− Yt-1),β are the parameters to be
estimated andεtis the error term. Thus, this rate-of-change model does incorporate the
vari-able time (t), allowing for flexibility in skew and, as discussed by Harvey and Young, it includes the logistic, Gompertz and modified exponential as special cases [22,26]. Theβ parameters can be estimated by ordinary least squares. Analogously to the logistic form, the model is sub-ject to a saturation level, although the limit is not imposed a priori but it is estimated from the data. Note also that Harvey model, unlike the models (1–2), includes an autoregressive term. Quite surprisingly, while the logistic and Gompertz models have been widely used in forecast-ing the diffusion of an epidemic [15–18], we are not aware of any application of Harvey model in this context.
2.2. Hierarchical forecasting
As suggested by previous studies, epidemic curves are characterized by different spatial and temporal patterns [27], with the consequence that regional forecasts may not reproduce the aggregate national level predictions. When series are disaggregated by geographical area (e.g. regions) or by categories, they form a hierarchy. The hierarchical forecasting approach pro-vides a method to obtain consistent forecasts at all levels, i.e. ensures that the sum of regional
forecasts is equal to the national forecasts. Several hierarchical forecast techniques have been proposed and two main alternative approaches can be identified: top-down and bottom-up methods (see the review in [20,21]). We argue that the top-down approach is well-suited to the COVID-19 epidemic case, as bottom-level data of regional ICU admissions are quite noisy and are therefore challenging to model. Furthermore, Athanasopoulos et al. notes that the per-formance of bottom-up method deteriorates as the length of the forecasting horizon increases [20].
The top-down approach discussed by Athanasopoulos et al. is based on disaggregating the national forecasts according to forecast proportions of the regional series [20]. First, the method requires generatingh-step-ahead forecasts for all the regional series ^yh;j, j = 1,‥,J and the national series ^yh. Next, the top-down approach disaggregates the national series in order
to obtain modified regional forecasts as follows:
~yh;j ¼ph;j ^yh ð4Þ
Whereph,jare the regional proportions, and are obtained as: ph;j¼ ^ yh;j PJ j¼1^yh;j ð5Þ
Therefore, the regional forecasts are not used directly, but they drive the decomposition from the top to the bottom level, generating regional forecasts coherent with the national one.
2.3. Evaluating forecast accuracy
We are interested in comparing the forecast accuracy of models introduced in section 2.1–2.2. When choosing models, it is common practice to identify a training sample, where the training data is used to estimate any parameters of a forecasting method, and a test sample, that is used to evaluate its accuracy.
Using the same notation of the previous sections, we denote cumulative forecast with ^Yt andYtis the observation at timet. Two commonly used scale-dependent measures are the
mean absolute error (MAE) and the root mean squared error (RMSE) [28]:
MAE ¼ meanðj ^Yt YtjÞ ð6Þ RMSE ¼ ffiffiffiffiffiffiffiffiffiffiffiffiffiffiffiffiffiffiffiffiffiffiffiffiffiffiffiffiffiffiffi meanð ^Yt YtÞ 2 q ð7Þ It is possible to define percentage errors that are unit-free [28]. The most common used measure is the mean absolute percentage error (MAPE) that is defined as:
MAPE ¼ 100 mean Y^t Yt Yt � � � � � � � � � � ð8Þ According to Lewis, MAPE values suggest accurate forecast when <10, good forecast when they are in the interval 10–20, and reasonable forecast when they are in the interval 20–50 [29]. Hyndman and Koehler suggest to use MAPE and MAE in evaluating forecast accuracy and for empirical comparisons because they are simple to explain [28].
3. Context under analysis
The Italian healthcare organizational context and experience with COVID-19 appears to be well suited to illustrate the benefits of the hierarchical forecasting approach. Since the 1990s,
the Italian National Healthcare System has been organized on a regional base and exhibits sig-nificant geographical variations in health services provision and organization [30,31]. A direct consequence is a significant heterogeneity both in the preventive measures (e.g. diagnosis through swab tests) and in the mitigation measures that each region has adopted to curb the outbreak. Furthermore, the large degree of autonomy in planning health care capacity has also determined a high variability in the number of ICU beds per capita available across regions.
As of June 15, the number of patients infected in Italy had reached 237,290 confirmed cases and 34,371 deaths according to data provided by the Dipartimento della Protezione Civile (http://www.protezionecivile.gov.it/attivita-rischi/rischio-sanitario/emergenze/coronavirus), making Italy one of the most severely affected countries by the virus. After the start of the infection in Italy in late February, the Italian Government was among the first to implement extraordinary community containment measures on March 8, in the attempt to limit the spread of contagion. However, during the months of March and April the hospital system was under heavy stress. This was especially true for ICUs, which accounted for about 14% of patients admitted to hospitals. During this critical period, due to the heterogeneous diffusion of the virus across the country, ICU demand in some regions stayed well below ICU bed capac-ity (e.g. in Southern regions), while in other regions capaccapac-ity saturated quickly (e.g. Lom-bardy). Therefore, the epidemic put ICUs to test in an asymmetric manner, with some regions experiencing a sudden shortage of beds, equipment, and medical staff to respond to the COVID-19 emergency.
The healthcare system response was a significant increase in ICU capacity all over the coun-try. Official statistics indicate that total capacity in Italy at the start of the outbreak was approx-imately 5,200 ICU beds, which has now been augmented to about 8,500 beds according to Bank of Italy sources [32]. However, the uniform increase in capacity in the entire national ter-ritory, coupled with the highly variable infection rates in the different regions, has led to excess capacity. We believe that the absence of accurate forecasts at regional level may have played a significant role in leading to public investment in capacity increase, which in some cases may have resulted in unneeded public expenditure.
4. Data
During the COVID-19 healthcare crisis, there was an immediate need to understand whether the capacity of ICU beds was sufficient to cover the rapidly rising demand. Below, we offer evi-dence that simple data-driven estimations were able to provide accurate early forecasts that would have been useful to support healthcare managers and policymakers.
Official statistics for Italy provide information on the total number of hospitalized patients and of ICU patients (https://github.com/pcm-dpc/COVID-19). However, given that the bed shortage was most severe for ICU and that this type of hospital department captures a high consumption of resources, the analysis was restricted to officially published data concerning net daily admissions (admissions minus discharges) to ICU with a COVID-19 diagnosis, by region. Admissions were monitored starting from February 25 (Day 1 of the outbreak) until April 3 (Day 39 of the outbreak). We consider this time interval significant, because it includes the peak of the daily admissions to ICU. After April 4 the daily variation of ICU admissions becomes negative at national level and demand pressure on hospitals reduces significantly.
Within this period, we identified a training sample composed by 22, 24, 26 or 28 observa-tions (from February 25 to March 16, 18, 20 or 22), while using the remaining data as test sam-ple. This choice of training sample allows testing the ability of our model to make accurate predictions with a short time-period. Additionally, it allows testing the goodness of fit of the
model in the initial period of the outbreak, when there was high uncertainty concerning the success of containment measures introduced by the Italian government on March 8.
5. Results
This section presents evidence of model fit and forecasts of ICU bed demand using the meth-ods described in Section 2: growth models and hierarchical forecasting [20]. Figs1and2report
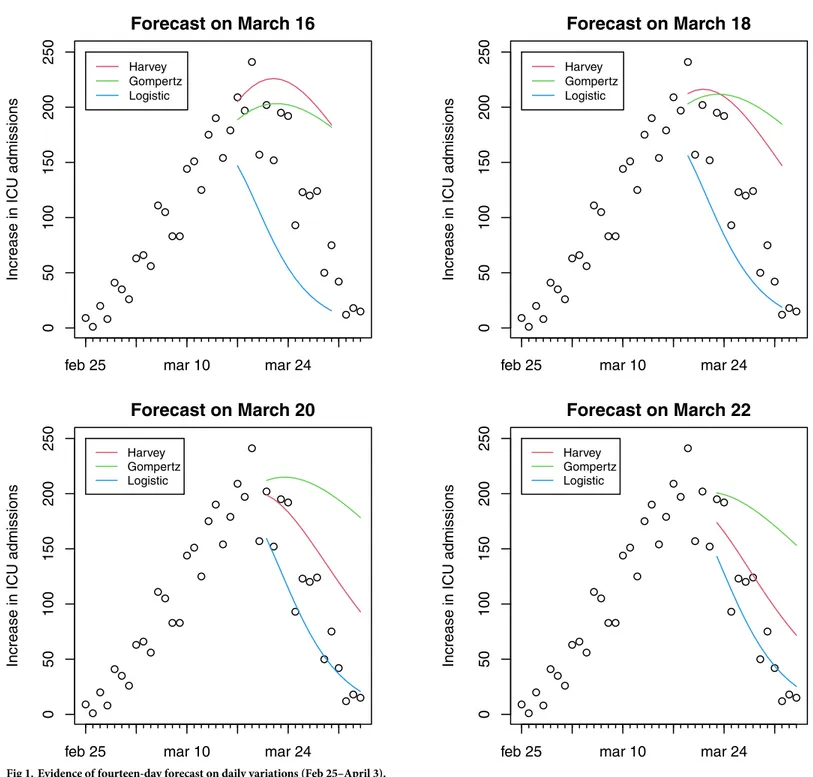
Fig 1. Evidence of fourteen-day forecast on daily variations (Feb 25–April 3).
daily variations and cumulative ICU admissions at national level estimated through three dif-ferent models. Fourteen-day forecasts of hospital ICU at difdif-ferent dates (March 16, 18, 20 or 22) are presented. The colored curves refer to forecasts made on March 16, on March 18, on March 20 and on March 22. Harvey growth model satisfactorily fits the ICU admission data for the periods considered. The model correctly predicts admissions fourteen-days ahead, although its performance worsens for forecasts made on March 22 when the net increase in ICU admis-sions was close to zero. In particular, Harvey growth model is able to capture the (a posteriori) evidence that the peak in the increase of daily admissions was attained during the period March 17–21. It is important to underline that even if the peak occurs during the test period, the curves reported in Figs1and2represent forecasts using the previous data and not fitted
Fig 2. Evidence of fourteen-day forecast on cumulative ICU admissions (Feb 25–April 3).
values. The forecasts based on the logistic model exhibit underestimation in the test sample, as a consequence of the low flexibility of this model. Conversely, Gompertz model shows a good fit for the forecasts made on March 16, but a steady overestimation in the remaining period.
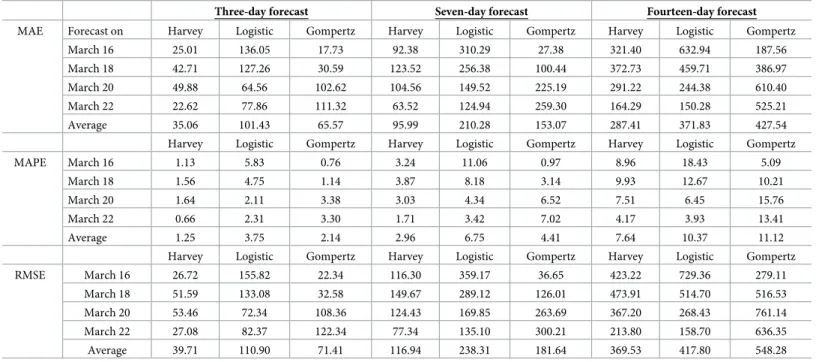
In order to evaluate the accuracy of these forecasts, the mean absolute error (MAE), the mean absolute percentage error (MAPE) and the root mean squared error (RMSE) [29] con-sidering the cumulative curve, are reported inTable 1. To allow evaluating the accuracy of the predictions in addition to fourteen-day forecasts,Table 1reports three-day and seven-day forecasts for comparison. The average of these performance measures of the forecasts based on March 16, 18, 20 and 22 is also reported. These measures confirm the comparisons between models reported in Figs1and2; and they show that the Harvey provides better estimates, con-sidering forecasts on different horizons and on different days. In particular, values for MAPE suggest accurate forecasts also when the longer forecasting horizon of fourteen days is used [32]. Given the superior performance of the Harvey model as per the results inTable 1, the analysis of the estimates at regional level was carried out using only this model.
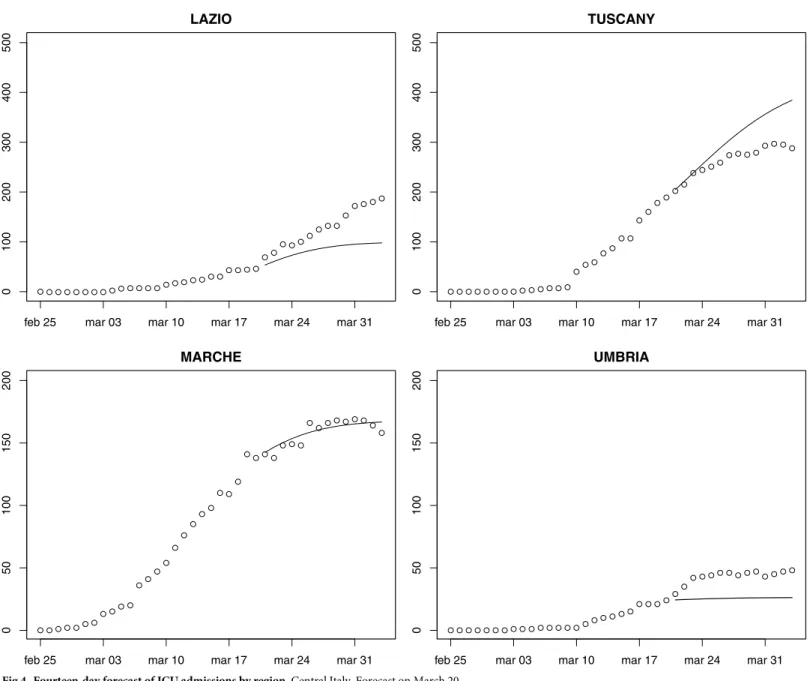
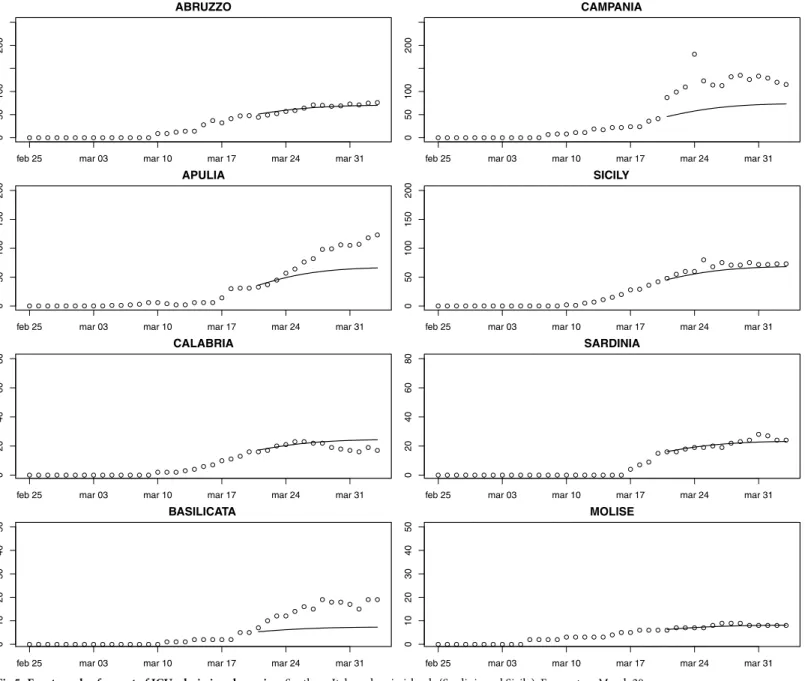
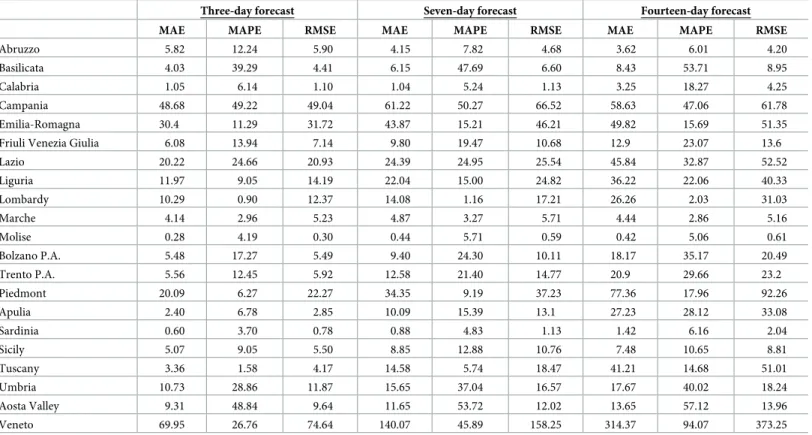
Figs3–5provide fourteen-day hierarchical adjusted forecasts on March 20 of cumulated ICU admissions broken down by regions, whileTable 2reports MAE, MAPE and RMSE at regional level based on Harvey model. Considering three- and seven-days forecast, MAPE val-ues suggest accurate forecast for eight regions (<10, according to Lewis [29]), good forecast for five regions (10–20), and reasonable forecast for six regions (20–50). Two regions exhibit a MAPE greater than 50 (Aosta Valley and Campania) but their values are very close to the threshold. When forecasting over fourteen days, MAPE values suggest accurate forecast for Sardinia, Abruzzo, Molise, Marche and Lombardy, good forecast for Calabria, Piedmont, Emi-lia-Romagna, Tuscany and Sicily, reasonable forecast for Campania, Umbria, Bolzano, Lazio, Trento, Apulia, Friuli and Liguria, and poor forecast for Veneto, Aosta Valley and Basilicata. Valle d’Aosta and Basilicata are two very small regions that exhibited a low rate of infections, thus making forecasts very sensitive to small variations. It is noteworthy that for the three
Table 1. Performance measures of the forecasts.
Three-day forecast Seven-day forecast Fourteen-day forecast
MAE Forecast on Harvey Logistic Gompertz Harvey Logistic Gompertz Harvey Logistic Gompertz
March 16 25.01 136.05 17.73 92.38 310.29 27.38 321.40 632.94 187.56
March 18 42.71 127.26 30.59 123.52 256.38 100.44 372.73 459.71 386.97
March 20 49.88 64.56 102.62 104.56 149.52 225.19 291.22 244.38 610.40
March 22 22.62 77.86 111.32 63.52 124.94 259.30 164.29 150.28 525.21
Average 35.06 101.43 65.57 95.99 210.28 153.07 287.41 371.83 427.54
Harvey Logistic Gompertz Harvey Logistic Gompertz Harvey Logistic Gompertz
MAPE March 16 1.13 5.83 0.76 3.24 11.06 0.97 8.96 18.43 5.09
March 18 1.56 4.75 1.14 3.87 8.18 3.14 9.93 12.67 10.21
March 20 1.64 2.11 3.38 3.03 4.34 6.52 7.51 6.45 15.76
March 22 0.66 2.31 3.30 1.71 3.42 7.02 4.17 3.93 13.41
Average 1.25 3.75 2.14 2.96 6.75 4.41 7.64 10.37 11.12
Harvey Logistic Gompertz Harvey Logistic Gompertz Harvey Logistic Gompertz
RMSE March 16 26.72 155.82 22.34 116.30 359.17 36.65 423.22 729.36 279.11 March 18 51.59 133.08 32.58 149.67 289.12 126.01 473.91 514.70 516.53 March 20 53.46 72.34 108.36 124.43 169.85 263.69 367.20 268.43 761.14 March 22 27.08 82.37 122.34 77.34 135.10 300.21 213.80 158.70 636.35 Average 39.71 110.90 71.41 116.94 238.31 181.64 369.53 417.80 548.28 https://doi.org/10.1371/journal.pone.0247726.t001
regions that were more severely affected by the epidemic (Lombardy, Piedmont, Emilia-Roma-gna), the forecast is either accurate or good.
6. Application of results to ICU capacity adjustment in Italy
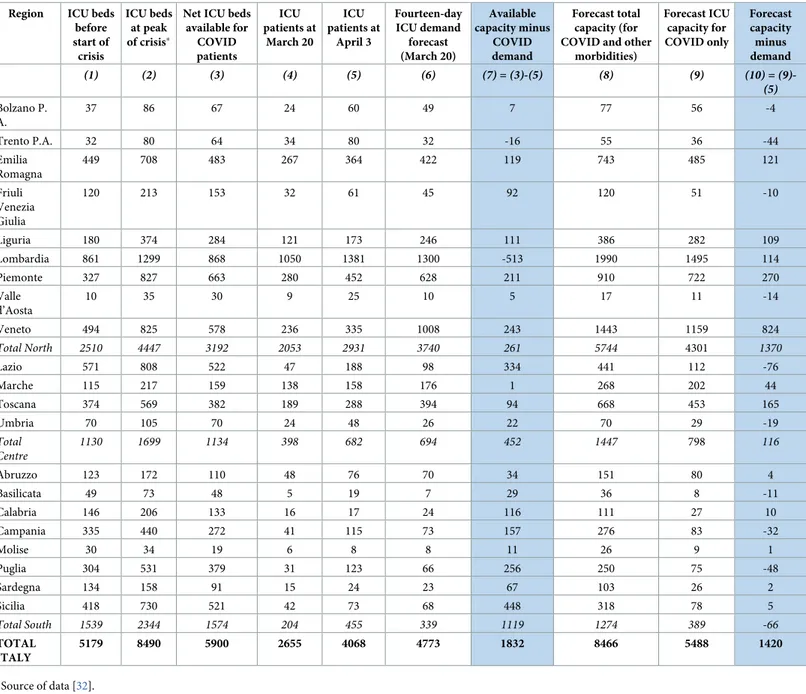
Predictions obtained can be compared with ICU capacity in the different Italian regions, with the aim to evaluate the adequacy of the expansion in the number of beds during the COVID-19 crisis.Table 3reports ICU admissions at regional level (using real and forecast data) and available capacity (pre and post COVID-19 crisis). Comparison between columns (1) and (2) show that all regions have significantly expanded ICU capacity during the outbreak. Column (3) calculates the net availability of ICU for COVID-19 patients based on the assump-tion that ICU average occupaassump-tion rate in 2019 was around 50%. Comparison of columns (3)Fig 3. Fourteen-day forecast of ICU admissions by region. Northern Italy. Forecast on March 20.
and (5) shows that on April 3 capacity exceeded demand in all regions except Trento P.A. and Lombardy (column (7)), with average over-capacity of 50% in Northern Italy, 150% in Central Italy and 200% in Southern Italy. This geographical distribution of new ICU capacity has cre-ated a significant shortage in Lombardy, the region where the highest numbers of deaths were registered in the following weeks.
Columns (8) and (9) report the forecasts of total ICU capacity (including COVID and non-COVID patients) and non-COVID-19 only capacity respectively. The figures have been created adding to the model forecasts a buffer of 15% (i.e. an occupation rate of 85% is assumed). The total number of ICU beds resulting from this calculation is very similar to the actual number of ICU beds created (8466 forecast vs. 8490 realized). However, the distribution of beds across the country and especially across the three different macro-areas of Italy (North, Centre and
Fig 4. Fourteen-day forecast of ICU admissions by region. Central Italy. Forecast on March 20.
South) is significantly different, with forecasts from our model assigning the greatest portion of capacity increase to northern regions. Column (10) reports the difference between forecast capacity and actual ICU admissions on April 3, showing that the allocation of new capacity proposed by the model would have avoided the shortage of ICU beds experienced by Lom-bardy (-513 real data vs + 114 forecast). Overall, our model creates fewer shortages (-258 in our model vs -529 realized), although these are spread over several regions.
7. Conclusions and limitations
The first wave of the COVID-19 epidemic that has occurred in the first semester of 2020 has shown the difficulty of reliably predicting the number of patients requiring ICU hospitaliza-tion. Healthcare managers and policy makers at regional level critically need this information
Fig 5. Fourteen-day forecast of ICU admissions by region. Southern Italy and main islands (Sardinia and Sicily). Forecast on March 20.
in order to rapidly adjust capacity or to organise the transfer of patients from one region to another.
This study has made two contributions to the problem of managing ICU capacity during the COVID-19 outbreak. The first contribution is the identification of a flexible functional form for predicting ICU admissions using past data that allows fitting short time series and correctly predicts the peak of ICU admissions. Results are especially relevant because the dates at which forecasts are made range from one to two weeks after the start of the lockdown in Italy, i.e. when there was high uncertainty on the effects of the community containment mea-sures undertaken. This model has been compared to two of the most frequently used growth models, showing better performance. The second contribution concerns the decomposition of national-level forecasts of ICU admissions into regional-level predictions, with the aim of pro-ducing consistent and accurate forecasts at both levels. Forecasts of ICU capacity expansion substantially align with realized capacity expansion at national level. However, the decomposi-tion proposed by our model assigns a greater pordecomposi-tion of beds to Northern Italy, the area of the country that was ravaged by the virus, at the expense of creating some shortages in the South. Although our model forecasts would have avoided creating the major ICU capacity shortage in Lombardy that was unfortunately observed, we realize that such planning would have required centralised healthcare planning at national level, which is at odds with the current regional structure of the Italian healthcare system.
Limitations of the study include the fact that forecasts are based on three growth models while it would be of interest to compare forecasts from several different functional forms including other methods. Another limitation arises from the reliability of data concerning ICU demand, given that during the peak of the crisis some regions decided not to admit to hospitals
Table 2. MAE and MAPE of the fourteen-day regional forecast (starting from March 20).
Three-day forecast Seven-day forecast Fourteen-day forecast
MAE MAPE RMSE MAE MAPE RMSE MAE MAPE RMSE
Abruzzo 5.82 12.24 5.90 4.15 7.82 4.68 3.62 6.01 4.20
Basilicata 4.03 39.29 4.41 6.15 47.69 6.60 8.43 53.71 8.95
Calabria 1.05 6.14 1.10 1.04 5.24 1.13 3.25 18.27 4.25
Campania 48.68 49.22 49.04 61.22 50.27 66.52 58.63 47.06 61.78
Emilia-Romagna 30.4 11.29 31.72 43.87 15.21 46.21 49.82 15.69 51.35
Friuli Venezia Giulia 6.08 13.94 7.14 9.80 19.47 10.68 12.9 23.07 13.6
Lazio 20.22 24.66 20.93 24.39 24.95 25.54 45.84 32.87 52.52 Liguria 11.97 9.05 14.19 22.04 15.00 24.82 36.22 22.06 40.33 Lombardy 10.29 0.90 12.37 14.08 1.16 17.21 26.26 2.03 31.03 Marche 4.14 2.96 5.23 4.87 3.27 5.71 4.44 2.86 5.16 Molise 0.28 4.19 0.30 0.44 5.71 0.59 0.42 5.06 0.61 Bolzano P.A. 5.48 17.27 5.49 9.40 24.30 10.11 18.17 35.17 20.49 Trento P.A. 5.56 12.45 5.92 12.58 21.40 14.77 20.9 29.66 23.2 Piedmont 20.09 6.27 22.27 34.35 9.19 37.23 77.36 17.96 92.26 Apulia 2.40 6.78 2.85 10.09 15.39 13.1 27.23 28.12 33.08 Sardinia 0.60 3.70 0.78 0.88 4.83 1.13 1.42 6.16 2.04 Sicily 5.07 9.05 5.50 8.85 12.88 10.76 7.48 10.65 8.81 Tuscany 3.36 1.58 4.17 14.58 5.74 18.47 41.21 14.68 51.01 Umbria 10.73 28.86 11.87 15.65 37.04 16.57 17.67 40.02 18.24 Aosta Valley 9.31 48.84 9.64 11.65 53.72 12.02 13.65 57.12 13.96 Veneto 69.95 26.76 74.64 140.07 45.89 158.25 314.37 94.07 373.25 https://doi.org/10.1371/journal.pone.0247726.t002
patients whose conditions were too severe and who were unlikely to survive. Finally, the exact rate of occupancy of ICU beds for non-COVID inpatients is not available at local level, and this has limited ability to exactly assess the capacity gap. Despite these limitations, we are confi-dent that the study can be useful to forecast ICU capacity needs, which may support healthcare decisions in countries that are currently experiencing COVID-19.
Acknowledgments
Simone Gitto wishes to thank Silvia Forni for stimulating this research by requesting reliable forecasts of ICU needs at the very beginning of the COVID-19 outbreak.
Table 3. Comparison between current capacity and forecasts. Region ICU beds
before start of crisis ICU beds at peak of crisis�
Net ICU beds available for COVID patients ICU patients at March 20 ICU patients at April 3 Fourteen-day ICU demand forecast (March 20) Available capacity minus COVID demand Forecast total capacity (for COVID and other
morbidities) Forecast ICU capacity for COVID only Forecast capacity minus demand (1) (2) (3) (4) (5) (6) (7) = (3)-(5) (8) (9) (10) = (9)-(5) Bolzano P. A. 37 86 67 24 60 49 7 77 56 -4 Trento P.A. 32 80 64 34 80 32 -16 55 36 -44 Emilia Romagna 449 708 483 267 364 422 119 743 485 121 Friuli Venezia Giulia 120 213 153 32 61 45 92 120 51 -10 Liguria 180 374 284 121 173 246 111 386 282 109 Lombardia 861 1299 868 1050 1381 1300 -513 1990 1495 114 Piemonte 327 827 663 280 452 628 211 910 722 270 Valle d’Aosta 10 35 30 9 25 10 5 17 11 -14 Veneto 494 825 578 236 335 1008 243 1443 1159 824 Total North 2510 4447 3192 2053 2931 3740 261 5744 4301 1370 Lazio 571 808 522 47 188 98 334 441 112 -76 Marche 115 217 159 138 158 176 1 268 202 44 Toscana 374 569 382 189 288 394 94 668 453 165 Umbria 70 105 70 24 48 26 22 70 29 -19 Total Centre 1130 1699 1134 398 682 694 452 1447 798 116 Abruzzo 123 172 110 48 76 70 34 151 80 4 Basilicata 49 73 48 5 19 7 29 36 8 -11 Calabria 146 206 133 16 17 24 116 111 27 10 Campania 335 440 272 41 115 73 157 276 83 -32 Molise 30 34 19 6 8 8 11 26 9 1 Puglia 304 531 379 31 123 66 256 250 75 -48 Sardegna 134 158 91 15 24 23 67 103 26 2 Sicilia 418 730 521 42 73 68 448 318 78 5 Total South 1539 2344 1574 204 455 339 1119 1274 389 -66 TOTAL ITALY 5179 8490 5900 2655 4068 4773 1832 8466 5488 1420 �Source of data [32]. https://doi.org/10.1371/journal.pone.0247726.t003
Author Contributions
Conceptualization: Simone Gitto, Carmela Di Mauro, Alessandro Ancarani, Paolo Mancuso. Data curation: Simone Gitto, Carmela Di Mauro, Alessandro Ancarani, Paolo Mancuso. Formal analysis: Simone Gitto, Carmela Di Mauro, Alessandro Ancarani, Paolo Mancuso. Methodology: Simone Gitto, Carmela Di Mauro, Alessandro Ancarani, Paolo Mancuso. Software: Simone Gitto, Carmela Di Mauro, Alessandro Ancarani, Paolo Mancuso. Writing – original draft: Simone Gitto, Carmela Di Mauro, Alessandro Ancarani, Paolo
Mancuso.
Writing – review & editing: Simone Gitto, Carmela Di Mauro, Alessandro Ancarani, Paolo Mancuso.
References
1. Lau K, Hauck K, Miraldo M. Excess influenza hospital admissions and costs due to the 2009 H1N1 pan-demic in England. Health Econ. 2019; 28(2):175–88.https://doi.org/10.1002/hec.3834PMID:
30338588
2. Ahamad MM, Aktar S, Rashed-Al-Mahfuz M, Uddin S, LiòP, Xu H, et al. A machine learning model to identify early stage symptoms of SARS-Cov-2 infected patients. Expert Syst Appl. 2020; 160:113661. https://doi.org/10.1016/j.eswa.2020.113661PMID:32834556
3. Callaway E. Time to use the p-word? Coronavirus enter dangerous new phase. Nat. 2020; 579(12):10– 38.
4. Menon DK, Taylor BL, Ridley SA, Intensive Care Society, UK. Modelling the impact of an influenza pan-demic on critical care services in England. Anaesth. 2005; 60(10):952–4.https://doi.org/10.1111/j. 1365-2044.2005.04372.xPMID:16179037
5. Earnest A, Chen MI, Ng D, Sin LY. Using autoregressive integrated moving average (ARIMA) models to predict and monitor the number of beds occupied during a SARS outbreak in a tertiary hospital in Singa-pore. BMC Health Serv Res. 2005; 5(1):36.
6. Chowell G, Luo R, Sun K, Roosa K, Tariq A, Viboud C. Real-time forecasting of epidemic trajectories using computational dynamic ensembles. Epidemics. 2020; 30:100379.
7. Petropoulos F, Makridakis S. Forecasting the novel coronavirus COVID-19. PLoS One. 2020; 15(3): e0231236.https://doi.org/10.1371/journal.pone.0231236PMID:32231392
8. UtkucanŞ, TezcanŞ. Forecasting the cumulative number of confirmed cases of COVID-19 in Italy, UK and USA using fractional nonlinear grey Bernoulli model. Chaos Solitons Fractals. 2020:109948. 9. Parbat D, Chakraborty M. A python based support vector regression model for prediction of COVID19
cases in India. Chaos Solitons Fractals. 2020; 138:109942.https://doi.org/10.1016/j.chaos.2020. 109942PMID:32834576
10. Ribeiro MH, da Silva RG, Mariani VC, dos Santos Coelho L. Short-term forecasting COVID-19 cumula-tive confirmed cases: Perspeccumula-tives for Brazil. Chaos Solitons Fractals. 2020: 109853.https://doi.org/ 10.1016/j.chaos.2020.109853PMID:32501370
11. Chakraborty T, Ghosh I. Real-time forecasts and risk assessment of novel coronavirus (COVID-19) cases: A data-driven analysis. Chaos Solitons Fractals. 2020: 109850.https://doi.org/10.1016/j.chaos. 2020.109850PMID:32355424
12. Torrealba-Rodriguez O, Conde-Gutie´ rrez RA, Herna´ndez-Javier AL. Modeling and prediction of COVID-19 in Mexico applying mathematical and computational models. Chaos Solitons Fractals. 2020:109946.https://doi.org/10.1016/j.chaos.2020.109946PMID:32836915
13. Singh S, Parmar KS, Kumar J, Makkhan SJ. Development of new hybrid model of discrete wavelet decomposition and autoregressive integrated moving average (ARIMA) models in application to one month forecast the casualties cases of COVID-19. Chaos Solitons Fractals. 2020:109866.https://doi. org/10.1016/j.chaos.2020.109866PMID:32395038
14. Meade N, Islam T. Modelling and forecasting the diffusion of innovation–A 25-year review. Int J Fore-cast. 2006; 22(3):519–45.
15. Chowell G, Simonsen L, Viboud C, Kuang Y. Is West Africa approaching a catastrophic phase or is the 2014 Ebola epidemic slowing down? Different models yield different answers for Liberia. PLoS Curr.
2014; 6.https://doi.org/10.1371/currents.outbreaks.b4690859d91684da963dc40e00f3da81PMID: 25685615
16. Ma J, Dushoff J, Bolker BM, Earn DJ. Estimating initial epidemic growth rates. Bull Math Biol. 2014; 76(1):245–60.https://doi.org/10.1007/s11538-013-9918-2PMID:24272389
17. Pell B, Baez J, Phan T, Gao D, Chowell G, Kuang Y. Patch models of EVD transmission dynamics. In Mathematical and Statistical Modeling for Emerging and Re-emerging Infectious Diseases. Cham: Springer; 2016. p.147–167.
18. Viboud C, Sun K, Gaffey R, Ajelli M, Fumanelli L, Merler S, et al. The RAPIDD ebola forecasting chal-lenge: Synthesis and lessons learnt. Epidemics. 2018; 22:13–21.https://doi.org/10.1016/j.epidem. 2017.08.002PMID:28958414
19. Remuzzi A, Remuzzi G. COVID-19 and Italy: what next?. The Lancet. 2020 Mar 13.https://doi.org/10. 1016/S0140-6736(20)30627-9PMID:32178769
20. Athanasopoulos G, Ahmed RA, Hyndman RJ. Hierarchical forecasts for Australian domestic tourism. Int J Forecast. 2009; 25(1):146–66.
21. Nenova ZD, May JH. Determining an optimal hierarchical forecasting model based on the characteris-tics of the data set. J Oper Manag. 2016; 44:62–8.
22. Harvey AC. Time series forecasting based on the logistic curve. J Oper Res Soc. 1984; 35(7):641–6. 23. Keeling MJ, Danon L. Mathematical modelling of infectious diseases. Br Med Bull. 2009; 92(1). 24. Ercole A, Taylor BL, Rhodes A, Menon DK. Modelling the impact of an influenza A/H1N1 pandemic on
critical care demand from early pathogenicity data: the case for sentinel reporting. Anaesth. 2009; 64(9):937–41.https://doi.org/10.1111/j.1365-2044.2009.06070.xPMID:19645759
25. Wearing HJ, Rohani P, Keeling MJ. Appropriate models for the management of infectious diseases. PLoS Med. 2005; 2(7):174.https://doi.org/10.1371/journal.pmed.0020174PMID:16013892 26. Young P. Technological growth curves: a competition of forecasting models. Technol Forecast Soc
Change. 1993; 44(4):375–89.
27. Chowell G, Viboud C, Hyman JM, Simonsen L. The Western Africa ebola virus disease epidemic exhib-its both global exponential and local polynomial growth rates. PLoS Curr. 2015; 7.https://doi.org/10. 1371/currents.outbreaks.8b55f4bad99ac5c5db3663e916803261PMID:25685633
28. Hyndman RJ, Koehler AB. Another look at measures of forecast accuracy. Int J Forecast. 2006; 22(4):679–88.
29. Lewis C.D. Industrial and business forecasting methods. London: Butterworth-Heinemann; 1982. 30. De Nicola A, Gitto S, Mancuso P, Valdmanis V. Healthcare reform in Italy: an analysis of efficiency based on nonparametric methods. Int J Health Plann Manage. 2014; 29(1):48–63.https://doi.org/10. 1002/hpm.2183PMID:23616362
31. Mancuso P, Valdmanis VG. Care appropriateness and health productivity evolution: a non-parametric analysis of the Italian regional health systems. Appl Health Econ Health Policy. 2016; 14(5):595–607. https://doi.org/10.1007/s40258-016-0257-yPMID:27448211
32. Aimone Gigio L., Citino L., Depalo D., Francese M., and Petrella A. Contrastare l’emergenza. l’espan-sione della capacitàproduttiva del sistema sanitario italiano: progressi conseguiti, Note COVID-19, Banca d’Italia, April 21 2020.https://www.bancaditalia.it/media/notizie/2020/2020_HealthPolicies_ Progress_v6_ITA_External.pdf