COMPARISON OF RATING OF PERCEIVED EXERTION SCALES
DURING INCREMENTAL AND INTERVAL EXERCISE
Blaine E. Arney
1, Reese Glover
1, Andrea Fusco
2,3, Cristina Cortis
2, Jos J. de Koning
4,
Teun van Erp
4, Salvador Jaime
1, Richard P. Mikat
1, John P. Porcari
1, and Carl Foster
1 1Department of Exercise and Sport Science, University of Wisconsin-La Crosse, La Crosse, USA
2
Department of Human Sciences, University of Cassino and Lazio Meridionale, Cassino, Italy
3Department of Sports Science and Kinesiology, University of Salzburg, Salzburg, Austria
4
Amsterdam Movement Sciences, Department of Human Movement Sciences,
Vrije Universiteit-Amsterdam, Amsterdam, The Netherlands
Original scientific paper https://doi.org/10.26582/k.51.2.1
Abstract:
The Rating of Perceived Exertion (RPE) is an important measure of exercise intensity, which is useful both as a primary and adjunctive method of exercise prescription. However, there are multiple variants of the Borg RPE scale, primarily the Borg 6-20 RPE scale (BORG-RPE) and the Borg Category-Ratio-10 scale (BORG-CR10). There are inadequate data available to address the comparability and interchangeability of these two widely used scales. Well-trained non-athletes performed two increment cycle tests, with each scale used in a random sequence. Subjects also performed interval sessions at three intensities (50, 75 and 85% of peak power output) with each scale used in a random sequence. There were very large correlations during the incremental exercise between the conventional physiological measures (% heart rate reserve – r=0.89 & r=.87); and %VO2reserve (r=.88 & r=.90) and RPE measured by either the RPE or the BORG-CR10, respectively. This pattern was also evident during the interval exercise (% heart rate reserve – r=.85 & r=.84; and blood lactate concentration – r=.74 & r=.78) and RPE measured by either the BORG-RPE or the CR10, respectively. The relationship between RPE measured by the RPE and the BORG-CR10 was large and best described by a non-linear relationship for both the incremental (R2=.89) and the interval (R2=.89) exercise. The incremental and interval curves were virtually overlapping. We concluded that the two most popular versions of the RPE scale, BORG-RPE and BORG-CR10, were both highly related to the conventional physiological measures and very strongly related to each other, with an easily described conversion.
Key words: exercise prescription, perceived exertion, heart rate, oxygen uptake, lactate
Introduction
Appropriately prescribed exercise intensity stress can provide the impetus to achieve desired physiological and health adaptations (Riebe, Ehrman, Liguori, & Magal, 2017). Oxygen consumption (VO2) is a standard indicator of the training-induced metabolic stress, and there-fore is the preferred method for exercise prescrip-tion, particularly when used as a relative measure (percent of maximal VO2 – %VO2max), or percent of VO2 reserve (%VO2R) (Garber, et al., 2011). Heart rate (HR), as a relative measure (percent of maximal HR – %HRmax), or percent of HR reserve (%HHR), is widely used as a surrogate measure of exercise intensity (Garber, et al., 2011). Because of the
rela-tive linearity and simplicity of the HR-based meas-ures, HR is more widely used than VO2 for exercise prescription. Furthermore, due to interindividual variation in metabolic responses to relative exer-cise intensity (Katch, Weltman, Sady, & Freedson, 1978; Scharhag-Rosenberger, Meyer, Gäßler, Faude, & Kindermann, 2010), training intensity thresholds derived from blood lactate (HLa) and/or ventilatory threshold (VT) have recently become accepted, if not preferred, for exercise prescription (Mezzani, et al., 2012). However, prescribing exercise intensity using relative intensities or threshold concepts may be impractical due to the need for maximal tests, appropriate equipment, and trained staff to cali-brate the intensity. Subjective measures of exercise
intensity, such as the Rating of Perceived Exertion (RPE) (Borg, 1998) and the Talk Test (Foster, et al., 2018), have become more widely used, as they can be easily and inexpensively administered and interpreted.
The RPE is currently recommended as an adjunct method for prescribing and monitoring exercise intensity by the American College of Sports Medicine (ACSM) (Riebe, et al., 2017). Supporting literature, however, has identified the RPE as an effective primary method for regulating exercise intensity (Borg, 1998; Dunbar, et al., 1992; Eston, 2012; Noble & Robertson, 1996; Pollock, Foster, Rod, & Wible, 1982) as well as for forming the basis for computing overall training load (the session RPE – sRPE) (Eston, 2012; Foster, 1998; Foster, et al., 1995, 2001; Foster, Rodriguez-Marroyo, & de Koning, 2017). Perceptually regulated exercise training has been shown to elicit improvements in VO2max (17% increase) in sedentary individuals and was regarded as a “pleasant” method of exer-cise regulation (Parfitt, Evans, & Eston, 2012). As this may contribute to an increased exercise adher-ence, the use of the RPE rather than relative meas-ures of VO2 and HR may be preferred.
To quantify the RPE, researchers have devel-oped multiple scales (Borg, 1998; Garcin, Vande-walle, & Monod, 1999; Robertson, et al., 2000; Swart, Lindsay, Lambert, Brown, & Noakes, 2012). The two most widely used RPE scales are the classical Borg 6-20 RPE scale (BORG-RPE) and the Borg Category-Ratio-10 scale (BORG-CR10) (Borg, 1998; Noble & Robertson, 1996). Both have been shown to be valid and reliable for estimating physiological responses to exercise (Borg, 1998; Chen, Fan, & Moe, 2002; Eston & Williams, 1988; Scherr, et al., 2013). Nevertheless, the creation of multiple RPE scales, each with its own construct, has made comparisons of the RPE difficult across studies. Borg (1998) proposed scale interchange-ability between the BORG-RPE and BORG-CR10 through means of a transformation table. Although the scale transformation table has been derived from the theoretical relationship between the two scales, few studies have compared the BORG-RPE and BORG-CR10 to determine scale equiv-alence and interchangeability (Borg, 2001; Borg & Kaijser, 2006). These comparison studies were conducted to observe altered rating habits during incremental exercise tests with 1- and 3-minute stages. To date, no current studies have investi-gated BORG-RPE and BORG-CR10 equivalence regarding momentary RPE using intraindividual comparisons during a standardized incremental exercise testing and interval training. Given the known limitations of interindividual comparisons relative to describing the physiological response to exercise (Katch, et al., 1978; Sharhag-Rosenberger,
et al., 2010) intraindividual comparisons are to be preferred, and represents the next step in evalu-ation. Therefore, the purpose of this study was to compare, within subjects, the commonly used BORG-RPE and BORG-CR10 during the stand-ardized incremental exercise testing and interval training to determine scale equivalence and inter-changeability. The BORG-CR10 was constructed to have both categorical and ratio properties. The Borg-RPE was only constructed to have categorical properties, although with a view of replicating the relationship of linear physiological responses (e.g., HR) to an increased workload. We hypothesized that ratings from both scales would have a strong relationship, validating their equivalence and inter-changeability during exercise testing and training.
Methods
SubjectsFourteen healthy, recreationally active (>30-minutes of moderate-intensity exercise (40%-59 %HRR), >3x/week) young adults (18-30 years of age) were recruited from a university commu-nity. Subjects were screened using the American Heart Association Health/Fitness Pre-Participa-tion Screening form to identify individuals with contraindications prior to participation (Balady et al., 1998). A signed written informed consent based on the principles articulated in the Declara-tion of Helsinki was provided by each subject prior to testing. Approval was obtained from the Univer-sity Human Subjects Committee.
Testing procedures
Incremental exercise testing
Two identical incremental exercise tests, using each RPE scale, were conducted on an electron-ically-braked cycle ergometer (Lode Excallibur, Groningen, NL). The order in which the RPE scales were used was randomized. Standardized instruc-tions were provided prior to each incremental exercise test (Borg, 1998). Subjects were tested >3-hour postprandial, had refrained from alcoholic consumption and heavy exercise >24 hours prior to testing, and abstained from caffeine consumption >6 hours prior to testing. Both tests were conducted within a 5-day time period, with at least 48 hours between the tests. The initial power output was 25W and was increased by 25W every two minutes until volitional fatigue. Subjects were instructed to main-tain a pedaling rate of 60-80 rotations per minute. Respiratory gas exchange was measured using an open-circuit spirometry (AEI Moxus, Pittsburg, PA) with calibration of the gas analyzers using a refer-ence gas (16% O2, 4% CO2) and room air. Expir-atory volume calibration was conducted before
each test using a 3L syringe. VO2 was recorded based on 30-second averages throughout the test. VO2max was defined as the highest continuous VO2 over a 30-second period. Heart rate was moni-tored throughout the test using radio-telemetry (Polar Electro Oy, Kempele, Finland). The RPE was obtained during the last 10 seconds of each stage. Peak power output (PPO) was recorded for each subject at the conclusion of each test, based on the highest completed stage and the propor-tional time during incomplete stages. Subjects continued cycling at 25-50W for three minutes after reaching volitional fatigue. After the 3-minute cool-down period, blood lactate (HLa) was measured in a fingertip blood sample using dry chemistry (Lactate Plus, Nova Biomedical, Watham, MA). The maximal character for each incremental test was confirmed by the presence of two or more of the following criteria: respiratory exchange ratio of ≥1.1, RPE of ≥17 RPE) or ≥7 (BORG-CR10), or a post-exercise HLa of ≥8mmol/L.
Interval exercise training sessions
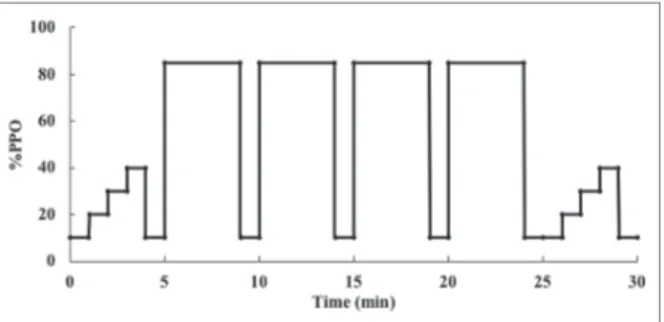
Interval exercise training sessions were conducted on an electronically-braked cycle ergom-eter (Lode, Groningen, NL). Each subject partici-pated in six randomly ordered (3xBORG-RPE and 3xBORG-CR10) 30-minute sessions designed to be easy (~50% PPO), moderate (~75% PPO) and hard (~85% PPO). Each interval training session consisted of four 4-minute intervals at 50, 75 or 85% of PPO with a 1-minute inter-set rest period at 25W. In addition to the four intervals, an incre-mental 5-minute warm-up and cool-down were conducted to make a total session duration of 30 minutes. Figure 1 is an example of an interval exercise sessions, represented at the hard inten-sity. Each training session was conducted with at least 48 hours of rest. Standardized instructions were provided prior to each training session for the BORG-RPE and BORG-CR10, respectively (Borg, 1998). HR and RPE, using either the BORG-RPE or BORG-CR10, were recorded during the last 10 seconds of the peak warm-up and cool-down
inten-sity (100W) and during the last 10 seconds of each interval. Blood for HLa was sampled pre-exercise, immediately following the peak warm-up and cool-down intensity (25W), and immediately following interval bouts (during the 25W recovery interval) from a fingertip and using dry chemistry.
Statistical analysis
Descriptive characteristics and physiological and perceptual responses from the maximal incre-mental exercise testing were calculated as mean ± standard deviation (SD). Linear regression analysis was used to analyze the relationship of the physi-ological criterion variables (%HRR, %VO2R, and HLa) with the BORG-RPE and BORG-CR10, whereas non-linear regression analysis was used to determine the association between the two scales for both the incremental and interval exercise. The magnitude of correlations was defined by the following criteria: trivial (less than .10), small (from .10 to .29), moderate (from .30 to .49), large (from .50 to .69), very large (from .70 to .89), and almost perfect (from .90 to 1.0) (Cohen, 1988; Hopkins, 2002). Standard error of the estimate (SEE) was calculated for all regression analyses. Alpha was set at .05 to achieve statistical significance. Data were analyzed using SPSS version 25.0 (Chicago, IL).
Results
Descriptive characteristics as well as physio-logical and perceptual responses from the maximal incremental exercise testing are presented in Table 1. Linear regression analysis revealed very large posi-tive relationships between the corresponding crite-rion variables with the two scales for both the incre-mental and interval exercise (Tables 2-4). Figure 2 represents the relationship between %HRR and RPE ratings during the incremental and interval sessions and between HLa and BORG-RPE and BORG-CR10 during the interval exercise. Quad-ratic regression analysis revealed an almost perfect relationship between BORG-RPE and BORG-CR10 for the incremental (r=.94, SEE =1.021, p<.0001) and interval (r=.95, SEE=.816, p<.0001) exercise (Figure 3). The best fit regression lines for the incre-mental and interval exercise were almost perfectly overlapping and could be described by the following equations:
Incremental: BORG-CR10 = 0.02(BORG-RPE)2 + .1659(BORG-RPE) - 1.3221
Incremental: BORG-RPE = - 0.0615(BORG-CR10)2 + 1.9065(BORG-CR10) + 6.0806
Interval: BORG-CR10 = 0.0335(BORG-RPE)2 - .142(BORG-RPE) + .3372
Interval: BORG-RPE = - 0.047(BORG-CR10)2 + 1.7007(BORG-CR10) + 6.4579
Figure 1. Graphical representation of the interval exercise session performed at 85% of individual’s peak power output (PPO).
Table 1. Descriptive characteristics and physiological and perceptual responses of males and females during the maximal incremental exercise testing (N=14). Values represent mean±standard deviation
Male (n=8) Female (n=6)
Age (year) 21.9±3.52 21.5±1.38
Height (cm) 180.3±5.96 164.7±8.41
Weight (kg) 80.8±9.18 63.9±7.75
VO2max (mL/kg/min) 49.0±7.87 45.0±8.11
Heart Rate Max (bpm) 188±4.9 192±2.5
Peak Power Output (W) 272±31.3 207±44.5
Max BORG-RPE Scale Rating 18.5±1.04 19.0±0.55
Max BORG-CR10 Scale Rating 9.3±1.11 9.4±1.36
Blood Lactate (mmol/L) 12.3±1.87 11.4±2.14
Table 2. Peak physiological and perceptual responses during easy, moderate and hard interval exercise sessions. Values represent mean±standard deviation
Easy Moderate Hard
BORG-RPE 11.1±1.93 15.5±1.53 18.1±1.33
BORG-CR10 3.1±.73 6.5±1.22 8.9±1.08
% Heart Rate Reserve 63.8±7.93 90.0±5.63 97.4±6.52
Blood Lactate (mmol/L) 3.9±1.10 9.9±2.67 13.7±3.15
Table 3. Correlations between BORG-RPE and BORG-CR10 and percent of heart rate reserve (%HRR) and percent of maximal oxygen consumption reserve (%VO2R) during the incremental exercise (N=14)
r R2 SEE
BORG-RPE BORG-CR10 BORG-RPE BORG-CR10 BORG-RPE BORG-CR10
%HHR .89 .87 .80 .75 12.7% 14.9%
%VO2R .88 .90 .77 .81 12.3% 11.2%
Table 4. Correlations between BORG-RPE and BORG-CR10 and percent of heart rate reserve (%HRR) and blood lactate (HLa) during the interval exercise (N=14)
r R2 SEE
BORG-RPE BORG-CR10 BORG-RPE BORG-CR10 BORG-RPE BORG-CR10
%HHR .85 .84 .73 .70 10.9% 11.6%
Figure 2. Comparison of BORG-RPE and BORG-CR10 with percent of heart rate reserve (%HRR) and blood lactate (HLa) in the incremental and interval exercise. (A) Incremental BORG-RPE vs. %HRR; B) Incremental BORG-CR10 vs. %HRR; C) Interval BORG-RPE vs %HRR; D) Interval BORG-CR10 vs. %HRR); E) Interval BORG-RPE vs. HLa; F) Interval BORG-CR10 vs. HLa).
Figure 3. Comparison of BORG-RPE and BORG-CR10 scales in the incremental (dashed black line and black dots) and interval (gray line and dots) exercise represented by quadratic best-fit lines.
Discussion and conclusions
The aim of this study was to determine the interchangeability between the BORG-RPE and BORG-CR10. The present findings confirm our hypothesis of a high equivalence and interchange-ability between the two scales. Previous studies investigating the relationship between physiolog-ical variables and perceptual scales have primarily focused on absolute physiological values (Borg, 1998; Chen, et al., 2002; Scherr, et al., 2013). For the present study, it was of interest to scale relation-ships with relative physiological parameters due to the large application of relative values for exercise prescription (Riebe, et al., 2017). When comparing physiological parameters with the BORG-RPE and BORG-CR10, very large correlations were identi-fied during both the incremental and interval exer-cise. Thus, each scale was independently related to objective physiological markers. Additionally, the two scales were systematically related to each other. A similar trend was identified by the early work of
Pollock et al. (1982) when comparing %HRR versus BORG-RPE values, although no correlation coef-ficients were presented.
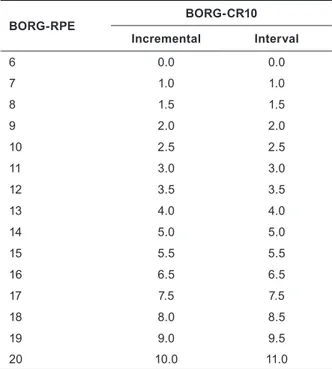
A high equivalence and interchangeability between the BORG-RPE and BORG-CR10 on an intraindividual level in incremental and interval exercise was found. A slight variance was identified with the scale relationship between the incremental and interval ratings. This variance was mostly asso-ciated with the upper scale ratings. It is assumed that the fixed nature of the interval sessions, espe-cially during hard sessions, compared to the self-selected end point for the incremental tests led to higher RPE values for both scales. The results imply that scale ratings from either the BORG-RPE or BORG-CR10 can be translated to the other using our proposed quadratic regression equations. For example, a rating of 17 on the BORG-RPE would translate to a rating of 7.5 on the BORG-CR10. From these regression equations, proposed trans-formation tables were derived and are presented in Table 5. Values produced in the proposed scale transformation tables used the BORG-RPE as the criterion variable and were rounded to the nearest .5 on the BORG-CR10 to allow rating ease. Addi-tionally, when following the regression equations derived from this study, a 6 on the BORG-RPE was identified with values greater than 0 on the BORG-CR10. However, 6 is identified as no exertion and as such should be transformed to a rating of 0 on the BORG-CR10 (Borg, 1998). Participants in this study were restricted from rating 6 on the BORG-RPE or 0 on the BORG-CR10 scale when exertion was present.
Although the results support the theoretical relationship suggested by Borg (1998), when using the proposed quadratic regression equation, the numerical scale values mimicked but did not repli-cate the numerical equivalence proposed. This may be a result of decreased physiological cuing at a lower intensity exercise (Noble & Robertson, 1996) or linear rating habits used on the BORG-CR10 due to the non-verbal anchor rating. In fact, due to the societal norms of linear ratings with subjective scales (e.g., difficulty of a task from 0 to 10), individuals may resort to linear rating habits when using the BORG-CR10 if verbal anchors are neglected. This would compromise the curvilinear structure of the scale.
One scale rating of interest for exercise prescrip-tion is the BORG-RPE of 13. This rating was identi-fied by Parfitt, Evans, and Eston (2012) as a subjec-tive exercise intensity that elicits improvements in health and fitness measurements (VO2max, body mass index, mean arterial pressure, and total choles-terol) in sedentary individuals. This rating has also
been identified as a “pleasant” intensity for cise while establishing a sense of autonomy in exer-cise participants, both potentially contributing to increased exercise adherence. Consequentially, a scale rating equivalence for the BORG-CR10 is desired due to the scale’s regular use for exercise intensity prescription and regulation. The Borg’s scale transformation table (Borg, 1998) suggests a BORG-RPE of 13 is equivalent to a rating of 3.5 on the BORG-CR10. However, the results of the present study suggest the equivalence of the BORG-RPE of 13 as a rating of 4 on the BORG-CR10. This finding implies that exercise professionals using the BORG-CR10 in practice following the BORG-RPE prescription proposed by Parfitt et al. may prescribe 4 on the BORG-CR10. As 4 is present on the rating scale, whereas 3.5 is not, this target RPE value may be more practical for exercise prescription by allowing an individual to identify this essential perceptual intensity with a greater degree of ease. In summary, our findings demonstrate the equivalence and interchangeability between the BORG-RPE and BORG-CR10 ratings. These results provide researchers and exercise profes-sionals with the ability to translate ratings from one scale to the other for rating comparisons or alternate scale use for exercise prescription. Finally, future studies should validate the effectiveness of the BORG-CR10 rating of 4 to elicit health and fitness improvements and pleasantness of intensity for exercise as found by Parfitt et al. (2012) using the rating of 13 with the BORG-RPE.
Table 5. Proposed BORG-RPE and BORG-CR10 trans-formation for incremental and interval data
BORG-RPE BORG-CR10 Incremental Interval 6 0.0 0.0 7 1.0 1.0 8 1.5 1.5 9 2.0 2.0 10 2.5 2.5 11 3.0 3.0 12 3.5 3.5 13 4.0 4.0 14 5.0 5.0 15 5.5 5.5 16 6.5 6.5 17 7.5 7.5 18 8.0 8.5 19 9.0 9.5 20 10.0 11.0
References
Balady, G.J., Chaitman, B., Driscoll, D., Foster, C., Froelicher, E., Gordon, N., Pate, R.R., Rippe, J., & Bazzarre, T. (1998). Recommendations for cardiovascular screening, staffing and emergency policies at health/fitness facilities: A joint position statement by the American College of Sports Medicine and the American Heart Association. Medicine and Science in Sports and Exercise, 30, 1009-1018.
Borg, E. (2001). A comparison between two rating scales for perceived exertion. In E. Sommerfeld, R. Kompass & T. Lachmann (Eds.), Fechner Day 2001. Proceedings of the Seventeenth Annual Meeting of the International Society for Psychophysics (pp. 298-302). Lengerich: Pabst Science Publishers.
Borg, E., & Kaijser, L. (2006). A comparison between three rating scales for perceived exertion and two different work tests. Scandinavian Journal of Medicine and Science in Sports, 16(1), 57-69.
Borg, G. (1998). Borg’s perceived exertion and pain scales. Champaign, IL: Human Kinetics Publishers.
Chen, M.J., Fan, X., & Moe, S.T. (2002). Criterion-related validity of the Borg Rating of Perceived Exertion scale in healthy individuals: A meta-analysis. Journal of Sports Sciences, 20, 873-899.
Cohen, J. (1988). Statistical power analysis for the behavioral sciences (2nd ed.). New Jersey: Lawrence Erlbaum.
Dunbar, C.C., Robertson, R.J., Baun, R., Blandin, M.F., Metz, K., Burdett, R., & Goss, F.L. (1992). The validity of regulating exercise intensity by ratings of perceived exertion. Medicine and Science in Sports and Exercise,
24(1), 94-99.
Eston, R. (2012). Use of ratings of perceived exertion in sports. International Journal of Sports Physiology and
Performance, 7(2), 175-182.
Eston, R.G., & Williams, J.G. (1988). Reliability of ratings of perceived effort regulation of exercise intensity. British
Journal of Sports Medicine, 22(4), 153-155.
Foster, C. (1998). Monitoring training in athletes with reference to overtraining syndrome. Medicine and Science in
Sports and Exercise, 30, 1164-1168.
Foster, C., Florhaug, J.A., Franklin, J., Gottschall, L., Hrovatin, L.A., Parker, S., Pamela, D., & Dodge, C. (2001). A new approach to monitoring exercise training. Journal of Strength and Conditioning Research, 15(1), 109-115. Foster, C., Hector, L.L., Welsh, R., Schrager, M., Green, M.A., & Snyder, A.C. (1995). Effects of specific versus
cross-training on running performance. European Journal of Applied Physiology, 70(4), 367-372.
Foster, C., Porcari, J.P., Ault, S, Doro, K. Dubiel, J., Engen, M., Kolman, D., & Xiong, S. (2018). Exercise prescription when there is no exercise test: The Talk Test. Kinesiology, 50(Supplement 1), 33-48.
Foster, C., Rodriguez-Marroyo, J.A., & de Koning, J.J. (2017). Monitoring training loads: The past, the present and the future. International Journal of Sports Physiology and Performance, 12, s3-s8.
Garber, C.E., Blissmer, B., Deschenes, M.R., Franklin, B.A., Lamonte, M.J., Lee, I.M., Nieman, D.C., & Swain, D.P. (2011). Quantity and quality of exercise for developing and maintaining cardiorespiratory, musculoskeletal, and neuromotor fitness in apparently healthy adults: Guidance for prescribing exercise. Medicine and Science in
Sports and Exercise, 43(7), 1334-1359.
Garcin, M., Vandewalle, H., & Monod, H. (1999). A new rating scale of perceived exertion based on subjective estimation of exhaustion time: A preliminary study. International Journal of Sports Medicine, 20(1), 40-43.
Hopkins, W.G. (2002). A new view of statistics. Retrieved from http://www.sportsci.org/resource/stats/effectmag.html Katch, V., Weltman, A., Sady, S., & Freedson, P. (1978). Validity of the relative percent concept for equating training
intensity. European Journal of Applied Physiology and Occupational Physiology, 39(4), 219-227.
Mezzani, A., Hamm, L.F., Jones, A.M., McBride, P.E., Moholdt, T., Stone, J.A., Urhausen, A., & Williams, M.A. (2012). Aerobic exercise intensity assessment and prescription in cardiac rehabilitation: A joint position statement of the European Association for Cardiovascular Prevention and Rehabilitation, the American Association of Cardiovascular and Pulmonary Rehabilitation and the Canadian Association of Cardiac Rehabilitation. European
Journal of Preventive Cardiology, 20(3), 442-467.
Noble, B.J., & Robertson, R.J. (1996). Perceived exertion. Champaign, IL: Human Kinetics.
Parfitt, G., Evans, H., & Eston, R. (2012). Perceptually regulated training at RPE13 is pleasant and improves physical health. Medicine and Science in Sports and Exercise, 44(8), 1613-1618.
Pollock, M.L., Foster, C., Rod, J.L., & Wible, G. (1982). Comparison of methods for determining exercise training intensity for cardiac patients and healthy adults. Advanced Cardiology, 31, 129-133.
Riebe, D., Ehrman, J.K., Liguori, G., & Magal, M. (2017). ACSM’s guidelines for exercise testing and prescription (10th ed.). Philadelphia, PA: Wolters Kluwer.
Robertson, R.J., Goss, F.L., Boer, N.F., Peoples, J.A., Foreman, A.J., Dabayebeh, I.M., Millich, N. B., Balasekaran, G., Riechman, S. E., Gallagher, J. D., & Thompkins, T. (2000). Children’s OMNI scale of perceived exertion: Mixed gender and race validation. Medicine and Science in Sports and Exercise, 32(2), 452-458.
Scharhag-Rosenberger, F., Meyer, T., Gäßler, N., Faude, O., & Kindermann, W. (2010). Exercise at given percentages of VO2max: Heterogeneous metabolic responses between individuals. Journal of Science and Medicine in Sport, 13(1), 74-79.
Submitted: May 10, 2018 Accepted: November 6, 2018 Published Online First: July 17, 2019 Correspondence:
Carl Foster, Ph.D.
Department of Exercise and Sport Science University of Wisconsin-La Crosse La Crosse, WI, 54601, USA Phone 608 785 8687 e-mail [email protected]
Scherr, J., Wolfarth, B., Christle, J.W., Pressler, A., Wagenpfeil, S., & Halle, M. (2013). Associations between Borg’s rating of perceived exertion and physiological measures of exercise intensity. European Journal of Applied
Physiology, 113, 147-155.
Swart, J., Lindsay, T.R., Lambert, M.I., Brown, J.C., & Noakes, T.D. (2012). Perceptual cues in the regulation of exercise performance-physical sensations of exercise and awareness of effort interact as separate cues. British Journal