Online ISSN 2424-6166. ekonomikA 2016 Vol. 95(3) DOI: http://dx.doi.org/???
BANK VUlNErABiliTy AND FiNANCiAl SOUNDNESS
TESTiNG: THE BANK rESiliENCE iNDEX
1Maurizio Pompella
*University of Siena, Italy
Antonio Dicanio
Bank of Italy, ItalyAbstract. The paper presents a stochastic method to test the soundness of accounting based solvency of banks, over a five-year period, and to define a proper capital adequacy level inductively, from a very limited subset of balance sheet indicators. A review of the literature about stress testing and capital adequacy is provided first, ai-med to give evidence of the existing approaches in use and their critical aspects. Then, starting from a sample of 246 listed banks, a few balance sheet indicators are considered. Having set a critical threshold for each of them, according to the regulatory prescriptions, their effective values are forced according to different confidence levels, and two separate kinds of vulnerabilities are defined for the individual banks. These values allow to build a “bank Resilience index” (bRi), which is a measure of the capability to stay within the threshold limits (in other words, to remain solvent). We conclude that the approach could constitute a new, powerful alternative to test “financial soundness”, inasmuch it can give evidence of which banks are solvent, actually, as a consequence of a temporarily efficient mix of ratios, and which banks show a higher resilience for being truly much stronger. In effect, the bRi candidates itself to be a major health check indicator, suitable for surveillance purposes.
Keywords: Stress-test; Vulnerability; Bank-resilience; Financial Soundness; Value at Risk.
Introduction
The literature about banks’ stress tests (STs), whose traces have been appearing since the nineties, has evolved significantly over the last ten years after the global financial crisis (GFC), when it became manifest that the vulnerability of the banking system was mainly a consequence of a generalized lack of capital, and more, of the shortage of any “emergency” capital buffer. Stress testing was already a hot topic before crises, anyway, at the beginning of 2000s, when the FSAP (Financial Sector Assessment Program), managed by the IMF, had just been launched, for it was already clear enough that financial stability assessment had to be considered crucial (Blaschke, Jones, majnoni & Peria, 2001). Being the main
1 Views expressed in this paper are those of the authors and do not reflect the official views of their home
insti-tutions. maurizio Pompella is author of introduction, §§ 2, 3 and Conclusions; Antonio Dicanio of §§ 1 and 2 (both authors contributed in § 2).
* Corresponding author:
School of economics and management, University of Siena, Piazza San Francesco, 7 – 53100 Siena, italy. e-mail: [email protected]
result of a worsening scenario, a right-hand shifting of the loss probability distribution, the subject was often dealt with, from the very beginning of the debate, in association with the literature about market risk modeling and Value at Risk (Cherubini & della lunga, 1999; Aragones, blanco & dowd, 2001; Teker & Akçay, 2004; Alexander & sheedy, 2008), by also emphasizing the drawbacks of the VAR approach (Lopez, 2005). The very simple, general idea is that a financial intermediary ought to demonstrate to be able to stand up under some adverse economic scenarios. A series of different approaches were designed, on the other hand, to perform the tests. it’s worth to remind the bottom-up and top-down models, the macro and micro tests (managed respectively by supervisors or financial insti-tutions), piecewise and integrated approaches, sensitivity and scenario tests (Sorge, 2004; Lopez, 2005). The effectiveness of this kind of methods was questioned, lately, in the same way of many other supervisory tools (Borio, 2012), but stress testing still remains a most promising instrument to prevent systemic instability.
What we aim to do in this paper is to develop a stochastic method, a type of hybrid way of testing bank resilience, which is both top-down and macro, yet also piecewise and strictly accounting based, as the sensitivity aspect is also taken into account for some key variables and indicators. The final outcome of the procedure are two different measures of vulnerability – namely class 1 and 2 – whose potential impact is synthesized in what we call the bank Resilience index (bRi).2
The first section below summarizes the recent literature about STs, and reminds the context in which it developed after the GFC, since the new implementation of this kind of tools by the Federal Reserve in the US, until the european experience within the eBA context. Then, the dataset and methodology are discussed, and results are presented. Conclusions follow, illustrating the prominent pros (and some cons) of our approach. 1. Literature review
Stress test techniques used by Supervision Authorities became more and more important over the latest years, due to the need to integrate the VAR models developed by banks in order to better measure their financial vulnerability. The Global Financial Crisis showed that it is necessary to provide Supervision Authorities, banks, and other market partici-pants with a different analytical framework to assess the resilience and vulnerability of the banking system to adverse economic developments consistently. To this end, Petrella & Resti (2013) pointed out that stress tests could lead to a consistent reduction of banks’ opaqueness for investors. They focused on the stress test exercise conducted by the eBA in 2011, starting on a sample of 201 banks included in the Thomson Reuters European Index. Their analysis proves that stress testing results are considered relevant by inves-tors and that they could contribute to decrease banks’ opacity.
2 “Resilience” is intended, in general, as the capability to absorb shocks and overcome stress situations, which
From a theoretical point of view, many of the recent studies followed different ap-proaches, proving that there is a consistent variety of techniques which can be used to test hypotheses. Hirtle, kovner, vickery & bhanot (2016) proposed a top-down capital stress testing framework that uses public data and econometric models to consider the effect of macroeconomic scenarios on the 200 largest banking firms in the US. They used a set of macro-economic variables patterns (such as GDP growth, unemployment rate, housing prices, and credit spreads) to make projections on banks’ net income and capital over the assumed stress horizon (2-3 years). They found evidence that the US banking system has improved since the recent financial crisis and outlined the value of stress test-ing as a macro-prudential policy tool. on the other hand, Alexander & Sheedy (2008) developed a bottom-up procedure, based on market risk models, to directly stress port-folios held by banks that can incorporate both volatility clustering and heavy tails. They explored eight risk models based on VAR and Conditional VAR (CVAR): they found strong evidence that the best risk model, for stress testing purposes, is the conditional empirical model developed by Barone-Adesi, Bourgoin & Giannopoulos (1998). The conditional empirical model is based on conditional return distributions and conditional volatility over different rolling estimation periods, using the GARCH model presented by Bollerslev (1986).
Beyond models and methods analyzed so far, at least other two approaches have been developed in recent years: the one providing stress test models based on the Extreme Value Theory (eVT), and those developed by using simulation techniques. For instance, Longin (2000) presents a Value at Risk (VAR) model that takes into consideration the application of the EVT 3 in order to estimate the capital requirement of a financial institu-tion that could face extreme events in financial markets. He suggests that eVT is more useful than traditional VAR models for three main reasons: the eVT is a parametric model; it works with few numbers of observations; it does not assume any particular model for returns. The usefulness of the eVT has also been confirmed in the latest years. in particular, koliai (2016) used a semi-parametric copula-GARCH risk model for fi-nancial return series where the marginal distributions of the returns are specified using the eVT. The model considered three types of assets: equity indices, exchange rates, and commodity prices. The empirical results implied better static and dynamic properties of the developed model compared to most common specifications used in practice by traditional stress test models.
As regards the simulation approach, Berkowitz (1999) was one of the first authors who outlined that the VAR estimates should be supplemented by stress testing and he strongly suggested using simulation techniques, assigning explicit probabilities for each stress scenario, in order to obtain a probability distribution of the losses. After this
gestion, simulation techniques applied to stress testing have been presented in the fol-lowing years. For example, Peura & Jokivuolle (2004) developed a simulation-based model to stress testing the banks’ regulatory capital adequacy that takes into account both rating transitions and business-cycle dynamics. They simulated actual bank capital and minimum capital requirements simultaneously in order to give a calibration of this confidence level to data on actual bank capital ratios. moreover, Varotto (2012) investi-gated how much capital banks should hold to face losses during the Great Depression. He finds that the new bank capital requirements under Basel 3 rules would enable banks to absorb Great Depression-style losses. Instead, Rebonato (2010) proposes a Bayesian approach to financial stress testing. The author suggests the use of expert judgment, based both on historical sampling or simulation methods in order to assign a probability distribution to each scenario.
2. Dataset and methodology
Dataset
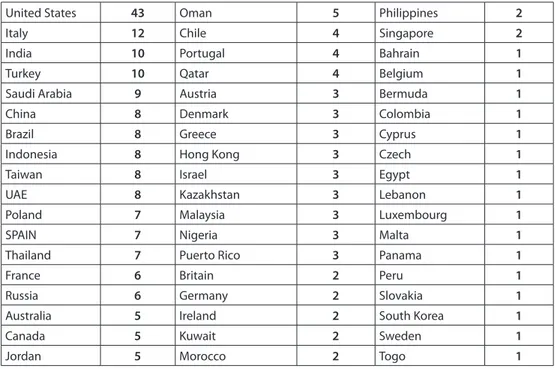
Our dataset was downloaded from Bloomberg® (BLG),4 and it consists of 246 listed banks from a worldwide sample. From the original 482 available banks – whose one year PD (probability of default) was calculated as an average value of the three PDs estimated according to the official ratings (S&P, Fitch and Moody’s) – were taken off all rows containing missing values and a convenient number of outliers. The remaining 246 banks do constitute a very representative set of banks, thus ordered by their average rating (decreasing, base 2010). The average rating has been obtained according with the following procedure:
a. for every bank, the rating assigned by each Rating Agency (RA) has been trans-formed into a 1 year PD estimate through a transformation matrix provided by the rating agencies that includes the historical default frequency for each rating category;
b. for every bank, the 1 year average PD estimate has been obtained by the simple arithmetic mean of the three PDs calculated as for step (a);
c. for every bank, the 1 year average PD (calculated in step (b)) has been trans-formed into an average rating through a transformation matrix provided by the RAs that includes the historical default frequency for each rating category. The sample is structured as follows: 43 US banks, 56 EU banks, and the other 147 from the rest of the world (Table No. 1).
4 The balance sheets indicators of the same group of banks, belonging to the subsector GICS (Global Industry
in order to choose the best bank indicators that could represent banks’ vulnerability, we follow the methodology discussed in Pompella & Dicanio (2016)5 and the frame-work applied by Regulatory Authorities6.
TABLE 1. The number of banks considred, by Country (decreasing)
United States 43 Oman 5 Philippines 2
Italy 12 Chile 4 Singapore 2
India 10 Portugal 4 Bahrain 1
Turkey 10 Qatar 4 Belgium 1
Saudi Arabia 9 Austria 3 Bermuda 1
China 8 Denmark 3 Colombia 1
Brazil 8 Greece 3 Cyprus 1
Indonesia 8 Hong Kong 3 Czech 1
Taiwan 8 Israel 3 Egypt 1
UAE 8 Kazakhstan 3 Lebanon 1
Poland 7 Malaysia 3 Luxembourg 1
SPAIN 7 Nigeria 3 Malta 1
Thailand 7 Puerto Rico 3 Panama 1
France 6 Britain 2 Peru 1
Russia 6 Germany 2 Slovakia 1
Australia 5 Ireland 2 South Korea 1
Canada 5 Kuwait 2 Sweden 1
Jordan 5 Morocco 2 Togo 1
So, the four indicators selected are:
i- Tier 1 ratio (T1) calculated as the ratio between the Tier 1 Capital (in practice the shareholders’ equity adjusted with intangible assets) and the Risk Weighted As-sets. Formally:
1) T1= Tier 1 RWA
ii- Net interest spread (NIS) calculated as interest yield on earning assets minus in-terest rates paid on borrowed funds:
2) NIS = Interest Income – Interest Expense Earning Assets Borrowed Liabilities
5 The selected indicators proved to be the most effective in banks’ vulnerability also looking at Sahut & mili
(2011) and Betz, oprica, Peltonen & Sarlin (2014).
6 Banks with the highest Net Interest Spread proved to be the most resilient in the stress test exercise conducted
iii- Common equity to total assets (CeTA) calculated as the ratio between the Com-mon equity and the Total Assets:
3) CETA = Common Equity Total Assets
iv- Non-performing loans to total loans (NPLT) represents the percentage of the Non-Performing Loans (i.e., the ones that most probably will not be reimbursed) compared to Total Assets:
4) NPLT = Non Performing Loans Total Loans Methodology
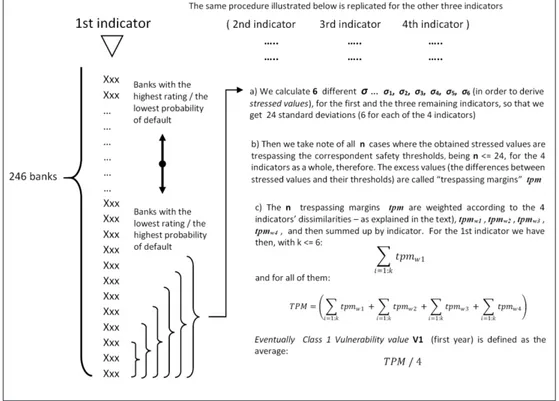
The first step of the procedure implies (starting from 2010) the calculation – for each of the indicators – of a series of standard deviations (σi ). More precisely, we calculate seven σ, the first, on the whole sample distribution, and six more on the following sub-sets: the last 60 banks of the list, the last 50, 40, 30, 20, 10.7 So that for our indicators as a whole, we get ((1+6)x4=) 28 σ. The four σ on the entire sample serve only as refer-ence values. The twenty-four σ, ensuing from the bottom list of intermediaries’ distribu-tions, on the other hand, are the main ingredients of our stress test. A varying subset of “bottom intermediaries”, in fact, shows an increasingly high σ not only while gradually decreasing the number of individuals, of course, but also as the end-list is approached. The reason why we consider six different values of σ is to make our estimation of the low-grade banks indicators variability more stable. if we just would consider the stand-ard deviation of – let’s say – the 20 end-list banks, we would take the risk of applying the method to different samples to get an inconsistent ensuing value, strongly influenced by occasional outliers.
Secondly, we define, four “safety” thresholds, for each of our four indicators, accord-ing to the regulatory parameters and prescriptions. in particular, the thresholds do reflect the minimum (or the maximum, in case of nPLT) level required by the Regulatory Au-thorities in charge of supervising financial intermediaries. in fact, according to the Basel 3 regulatory framework, if one or more of the considered indicators should go below (or above in case of nPLT) the regulatory thresholds, the Supervisory Authorities could take early intervention measures or even declare failure of the bank.
Fig. No. 1 below illustrates the procedure.
7 it is worthy to clarify how these subsets are selected. “Last banks” just means the end-list banks showing the
Thirdly, we impose to each of the individual values of indicators (year 2010) by bank a two σ stress, by adding 2σ to the effective values, so that we may assess if any of the stressed values (effective + 2σ) would result in a threshold trespassing value. A maxi-mum of 24 excess values will be found then, and translated in %Δ; what we call tpm. All
tpm values are then weighted according to the indicators’ dissimilarities DISS(i), coming from a ROC analysis (tpmw).8
tpmw(TIER1) = tpm(TIER1) ×DISS(TIER1) tpmw(NIS) = tpm(NIS) × DISS(NIS) tpmw(CETA)= tpm(CETA) × DISS(CETA) tpmw(NPLT)= tpm(NPLT) × DISS(NPLT)
We have now all that we need to calculate our indexes. Class 1 Vulnerability value
V1 (for the first year 2010) will be the average of the weighted, % excess values sums
by indicator (k ≤ 6):
8 Dissimilarity is a measure – obtained by calculating the area under ROC curve for each column of the matrix
246×4 – of the discriminating power of the related indicator. ROC analysis was mainly developed in the bio-medical context, and even before by psychologists (Swets, 1996).
Fig. No 1. The adopted stressing procedure
FIGURE 1 – in your final draft has a not sufficient resolution and some indexes are unreadable, please use THIS ONE
whereas V2 (Class 2 Vulnerability value V2) will be structured in the same way, but having considered 1 σ instead of 2, and it will be symptomatic of a heavier vulnerability, of course.
The procedure is run iteratively for all the five years considered (2010-14), in order to observe the dynamics and to calculate the five years mean-values of V1 and V2.9
Bank Resilience index bRi will be easily derived by these calculations, as
where (V1max) is the Class 1 Vulnerability index obtained by imposing a 2 σ stress to an imaginary bank whose four values of indicators already reached the threshold level. 3. Results
The main findings of our method may be easily illustrated trough a few graphs, which also intuitively prove the effectiveness of our vulnerability detection instrument.
Having calculated our vulnerability indexes V1 and V2, we assumed that the first concern had to be to reveal which banks were “trespassing” the heaviest test, that is, firstly, which banks couldn’t remain under the regulatory threshold being stressed with two σ.10 So we focused on the V1 value.
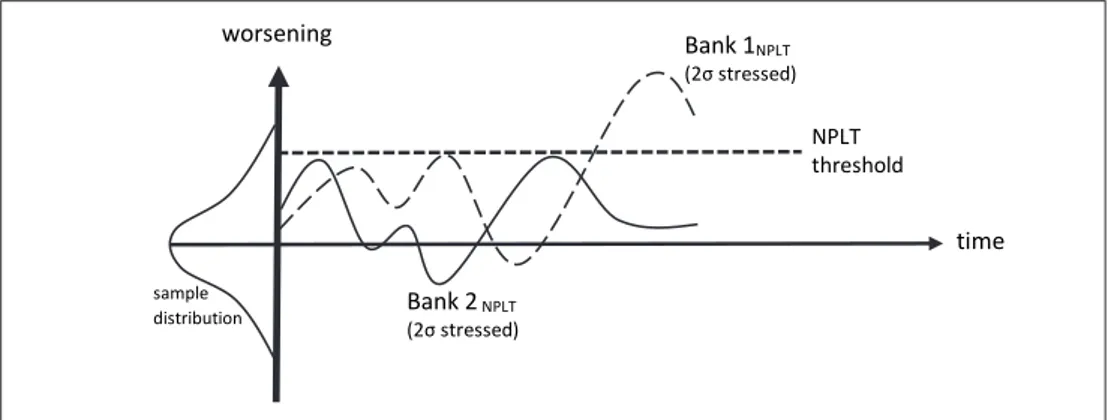
It is worthwhile to note that a Class 2 vulnerability (V2) is heavier than a Class 1 (V1), and that all Class 2 vulnerable banks (trespassing with just one σ) are also Class 1, but not vice versa. If we consider V1 to evaluate resilience, we look for the more resilient between the relatively healthy intermediaries.11 The following figure exemplifies the case of two banks, the first trespassing the nPLT12 threshold with 2σ (the same can’t be said for 1σ as well), and the second being resilient to the 2σ stress, and then, by defini-tion, to the single stress as well.
The following step, then, is to exclude all the banks which do not trespass all four regulatory thresholds at the same time, for they are in a better condition, and concentrate our attention on the remaining subset.
9 Some of the results below have been obtained after having taken off all banks showing one or more indicators
under threshold, that is, having considered only trespassing banks, and discriminating by Country/area (see below).
10 it is worth to remind that if just one σ is not enough to let the bank trespasses the limit, it means that the
si-tuation is not as “dramatic”, and that the considered bank is resilient to certain “soft” shocks. We could say that – in some sense/to some extent – a bank is legitimated to trespass the threshold if you stress it with a higher number of σ.
11 if you are safe being stressed 2σ you are safe by definition being stressed just one, actually.
12 It is worthy to remind this is our fourth indicator: NPLT = nonperforming loans (NPLs) to total loans in
percentage.
whereas V2 (Class 2 Vulnerability value V2) will be structured in the same way, but having considered 1 σ instead of 2, and it will be symptomatic of a heavier vulnerability, of course.
The procedure is run iteratively for all the five years considered (2010-14), in order to observe the dynamics, and to calculate the five years mean-values of V1 and V2.8
Bank Resilience index bRi will be easily derived by these calculations, as
��� � � �������
����
where (V1max) is the Class 1 Vulnerability index obtained by imposing a 2 σ stress to an imaginary bank whose four values of indicators already reached the threshold level.
3. Results
Main findings of our method may be easily illustrated trough a few graphs, which also prove the effectiveness of our vulnerability detection instrument, intuitively.
Having calculated our vulnerability indexes V1 and V2, we assumed that the first concern had to be to reveal which banks were “trespassing” the heaviest test, as first, that is which banks couldn’t remain under the regulatory threshold being stressed with two σ .9 So we focused on the V1 value.
It is worthwhile to note that a Class 2 vulnerability (V2) is heavier than a Class 1 (V1), and that all
Class 2 vulnerable banks (trespassing with just one σ) are also Class 1, but not vice versa. If we
consider V1 to evaluate resilience, we look for the more resilient between the relatively healthy intermediaries.10 The following figure exemplifies the case of two banks, the first trespassing NPLT11 threshold with 2σ (can’t say if one also), and the second being resilient to the 2σ stress, and then to the single σ stress as well, by definition.
8 Some of the results below have been obtained after having taken off all banks showing one or more indicators under
threshold, that is having considered only trespassing banks, and discriminating by Country/area (see below).
9 It is worth to remind that if just one σ is not enough to let the bank trespasses the limit, it means that the situation is not so
“dramatic”, and that the considered bank is resilient to “soft” shocks. We could say that – in some sense/to some extent – a bank is legitimated to trespass the threshold if you stress it with a higher number of σ.
�� � � � � ����������� ����� �+ � ��������� + ����� � ���������� ����� + � ���������� ����� �����
whereas V2 (Class 2 Vulnerability value V2) will be structured in the same way, but having considered 1 σ instead of 2, and it will be symptomatic of a heavier vulnerability, of course.
The procedure is run iteratively for all the five years considered (2010-14), in order to observe the dynamics, and to calculate the five years mean-values of V1 and V2.8
Bank Resilience index bRi will be easily derived by these calculations, as
��� � � �������
����
where (V1max) is the Class 1 Vulnerability index obtained by imposing a 2 σ stress to an imaginary bank whose four values of indicators already reached the threshold level.
3. Results
Main findings of our method may be easily illustrated trough a few graphs, which also prove the effectiveness of our vulnerability detection instrument, intuitively.
Having calculated our vulnerability indexes V1 and V2, we assumed that the first concern had to be to reveal which banks were “trespassing” the heaviest test, as first, that is which banks couldn’t remain under the regulatory threshold being stressed with two σ .9 So we focused on the V1 value.
It is worthwhile to note that a Class 2 vulnerability (V2) is heavier than a Class 1 (V1), and that all
Class 2 vulnerable banks (trespassing with just one σ) are also Class 1, but not vice versa. If we
consider V1 to evaluate resilience, we look for the more resilient between the relatively healthy intermediaries.10 The following figure exemplifies the case of two banks, the first trespassing NPLT11 threshold with 2σ (can’t say if one also), and the second being resilient to the 2σ stress, and then to the single σ stress as well, by definition.
8 Some of the results below have been obtained after having taken off all banks showing one or more indicators under
threshold, that is having considered only trespassing banks, and discriminating by Country/area (see below).
9 It is worth to remind that if just one σ is not enough to let the bank trespasses the limit, it means that the situation is not so
“dramatic”, and that the considered bank is resilient to “soft” shocks. We could say that – in some sense/to some extent – a bank is legitimated to trespass the threshold if you stress it with a higher number of σ.
10 If you are safe being stressed 2σ you are safe by definition being stressed just one, actually.
11 It is worthy to remind this is our fourth indicator: NPLT = nonperforming loans (NPLs) to total loans in percentage.
�� � � � � ����������� ����� �+ � ��������� + ����� � ���������� ����� + � ���������� ����� �����
In accordance with the current regulatory framework and supervisory practice, the following thresholds have been used:
i. T1 – (not below) 6% ii. NIS – (not below) 0.5% iii. CeTA – (not below) 3% iv. NPLT – (not above) 9%
We have decided then to keep in the analysis – of every year – only the banks tres-passing all thresholds at the same time. Then we divided them in three groups: the US (individual banks), the EU (mean values by Country), and the Other Countries (mean values as well), thus obtaining 72 banks / groups of banks. The following Fig. No. 3 demonstrates how these three categories evolve over the five years considered; lowest vulnerability (healthy banks) is displayed at the top.
FIG. NO 2. 2σ stressed Bank 1 and Bank 2, according to (e. g.) NPlT
FIG. NO 3. How the banks rank by vulnerability (V1) and their path along the period
FIGURE 2 – in your final draft has a not sufficient resolution and
some text is unreadable, please use THIS
Bank 2 NPLT (2σ stressed) NPLT threshold worsening Bank 1 NPLT (2σ stressed) time sample distribution
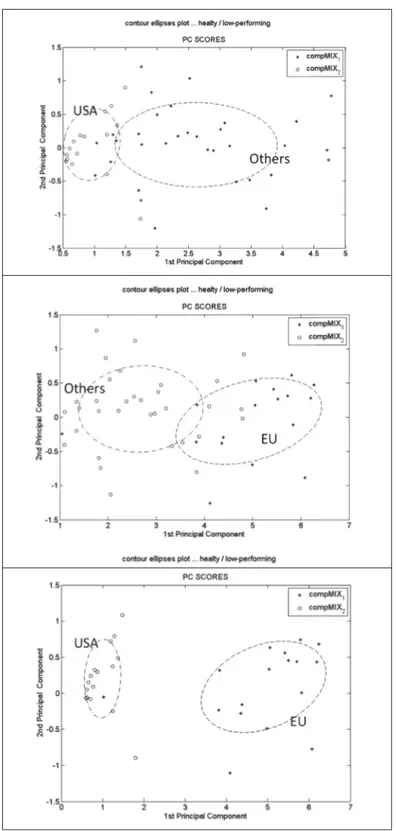
Defocusing (second and third graph) and contour analysis show how US banks do concentrate at the top, and EU banks concentrate at the bottom.
The PCM analysis (Pompella & Dicanio, 2016), on the other hand, allows us to dis-criminate the US from EU banks in a very clear and impressive way (Fig. No. 4) – which proves how powerful is the method and suggests that these two groups followed opposite tendencies over that five years period, which is coherent with some of the measures and regulatory prescriptions assumed in the US then.
Conclusions
Class 1 and 2 vulnerabilities and the bank Resilience index bRi do represent a useful instrument to evaluate the capability of banks to withstand any adverse scenario. They are not exactly per se an Early Warning System, but if you calculate them over time, they will catch any worsening tendency in advance, for sure.
Moreover, this new stress system, apart from being easy to be applied, seems to be original. In spite of being based on some very basic statistical indicators, in fact, our ap-proach provides a meaningful, accounting based index, nevertheless taking into account the probability distribution of each indicator and its intimate structure, then weighing measures according to the relevance of indicators themselves.
Also, the bRi is parsimonious, as V1 does catch the most of the needed information, and it requires the values of only four, most relevant, balance-sheet values.
We conclude that the approach could constitute a new, powerful alternative to test “financial soundness”, inasmuch as it can give evidence of which banks are actually solvent, as a consequence of a temporarily efficient mix of ratios, and which banks show a higher resilience for being truly much stronger. As a most flexible index, if applied to individual countries, or geographic areas, the bRi allows to associate best surveillance/ monetary practices to their good outcomes at a systemic level. So, the bRi candidates it-self to be a major health-check indicator and a powerful comparative instrument, suitable for surveillance purposes. From a truly different approach, if compared, for example, with the VAR (Value at Risk) methodology, which defines the amount of capital possibly lost, having defined the confidence interval, the method is not just devoted to assess the needed capital to cover possible losses, but provides regulators with a continuous meas-ure of financial soundness of banks.
rEFErENCES
Alexander, C., & Sheedy, e. (2008). Developing a stress testing framework based on market risk models. Journal of Banking & Finance (32), 2220-2236.
Aragones, J., Blanco, C., & Dowd, k. (2001). incorporating stress tests into market risk modeling. Derivatives Quarterly (7), 44–49.
Barone-Adesi, G., Bourgoin, F., & Giannopoulos, k., (1998). Don’t look back. Risk (11), 100–103. Berkowitz, J. (1999). A coherent framework for stress-testing. Journal of Risk (2), 5-15.
Betz, F., oprica, S., Peltonen, T.& Sarlin, P. (2014). Predicting distress in european banks. Journal of Banking & Finance (45), 225–241.
Blaschke, W, Jones m.T., majnoni G. & Peria S.m. (2001). Stress testing of financial systems: an overview of issues, methodologies, and FSAP experiences. international monetary Fund.
Borio C., Drehmann M.; & Tsatsaronis K. (2014). Stress-testing macro stress testing: Does it live up to expectations? Journal of Financial Stability (12), 3-15.
Bollerslev, T. (1986). Generalized Autoregressive Conditional Heteroskedasticity. Journal of Econometrics 31 (3), 307–327.
Cherubini U., & Della Lunga G. (1999). Stress testing Techniques and Value at Risk measures, A Unified Approach. Decision in economic and Finance (22), 77-99.
Hirtle, B., kovner, A., Vickery, J., & Bhanot, m. (2016). Assessing financial stability: The Capital and Loss Assessment under Stress Scenarios (CLASS) model. Journal of Banking and Finance (69), 35-55.
koliai, L. (2016). extreme risk modeling: An eVT–pair-copulas approach for financial stress tests. Journal of Banking and Finance (70), 1-22.
Longin, F.m. (2000). From Value at Risk to Stress Testing: The extreme value approach. Journal of Banking and Finance (24), 1097-1130.
Lopez, J. (2005). Stress tests: Useful complements to financial risk models. FRBSF economic Let-ter, 119–124.
Peura, S., & Jokivuolle, e. (2004). Simulation based stress tests of banks’ regulatory capital ad-equacy. Journal of Banking and Finance (28), 1801-1824.
Petrella, G., & Resti, A. (2013). Supervisors as information producers: Do stress tests reduce bank opaqueness? Journal of Banking and Finance (37), 5406-5420.
Pompella, m. & Dicanio, A. (2016). Ratings based inference and Credit Risk, detecting likely to fail banks with the PC-M Method. Economic Modelling.
Rebonato, R. (2010). Coherent Stress Testing: A Bayesian Approach to the Analysis of Financial Stress. Wiley.
Sahut, J.m. & mili, m. (2011). Banking distress in menA countries and the role of mergers as a strategic policy to resolve distress. Economic Modelling (28), 138–146.
Sorge, m. (2004). Stress-testing financial systems: an overview of current methodologies. BiS Working Papers (165).
Swets, J.A. (1996). Signal Detection Theory and RoC Analysis in Psychology and Diagnostics. Lawrence erlbaum Ass. PUBLiSHeRS, mahwah, new Jersey.
Teker, S., & Akçay, B. (2004). Value-at-Risk (VaR) Computations Under Various VaR models and Stress Testing. Journal of Transnational management Development (28), 47-67.
Varotto, S. (2012). Stress testing credit risk: The Great Depression scenario. Journal of Banking and Finance (36), 3133-3149.