SCUOLA DI DOTTORATO “VITO VOLTERRA”
PhD in Chemical Sciences- XXXII Cycle
Preparation and characterization of screening
methods for classification and quality control of
olive oils
Daniele Zappi
Matriculation number 1320355Thesis Advisor: Prof. Claudia Sadun
Ph.D. Program Coordinator: Prof. Osvaldo Lanzalunga
Academic year 2018-2019
III
Index
1.
Purpose of the thesis ... 1
2.
Introduction ... 3
2.1.
Olive Oil ... 3
2.1.1. Olive oil production ... 5
2.1.2. Olive oil quality regulation ... 6
2.1.3. Olive oil adulteration ... 8
2.2.
Biosensors ... 12
2.2.1. Enzymatic Biosensors ... 14
2.2.2. Electrochemical biosensors ... 14
2.3.
Nanomaterials ... 18
2.3.1. Multi-walled carbon nanotubes ... 20
2.3.2. Gold nanoparticles ... 22
2.3.3. Graphene ... 23
2.3.4. Titanium dioxide nanoparticles (TiO2) ... 24
2.4.
Room temperature ionic liquids (RTILs) ... 26
2.4.1. Non-toxic room temperature ionic liquids ... 28
2.5.
Deep Eutectic Solvents (DES) ... 30
3.
Experimental part ... 32
3.1.
Materials ... 32
3.1.1. Reagents ... 32
3.1.2. Preparation of solutions ... 33
3.1.3. Screen-printed electrodes (SPE) ... 35
3.1.4. Olives sampling ... 37
3.2.
Methods ... 40
3.2.1. Cyclic voltammetry ... 40
3.2.2. Chronoamperometry ... 43
IV
3.2.4. Energy-dispersive X-ray diffraction (EDXD)... 47
3.2.5. Methods for determining the alcohol content in beverages ... 49
3.2.6. Room temperature ionic liquid preparation ... 51
3.2.7. Deep eutectic solvent preparation ... 54
3.2.8. Electrodes Functionalization ... 55
3.2.9. Olive oil extraction: mechanical process ... 58
3.2.10. Chemometric data processing... 59
3.3.
Instrumentation ... 61
3.4.
Enzymes ... 62
3.4.1. Lipase ... 62
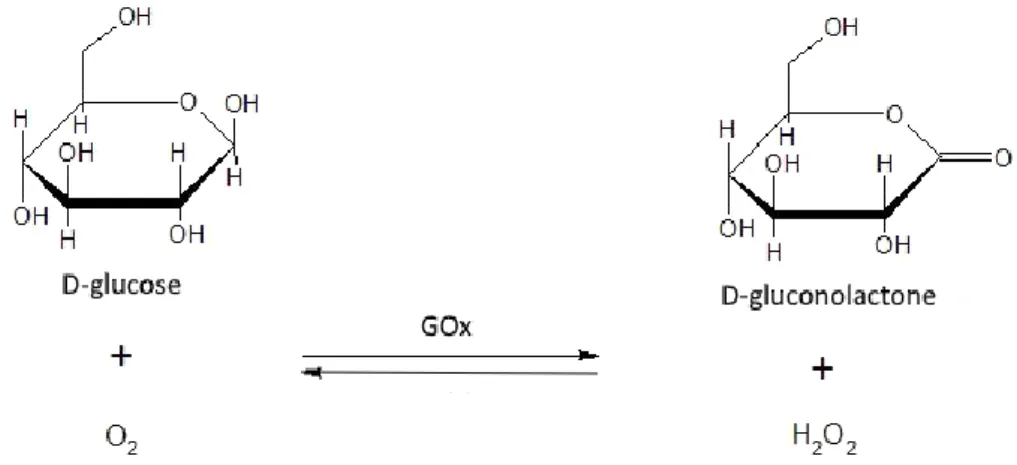
3.4.2. Glucose oxidase ... 65
3.4.3. Alcohol Dehydrogenase ... 68
4.
Results and discussion ... 70
4.1.
Study of the interactions between ionic liquids and
nanomaterials ... 70
4.1.1. Modified electrode test: Glucose oxidase ... 74
4.1.2. Modified electrode test: Alcohol Dehydrogenase ... 78
4.2.
Electrode modification: optimizing electrochemical
performances ... 81
4.2.1. New MWCNT / TiO2 electrode test: Alcohol Dehydrogenase biosensor ... 89
4.3.
New platform application: extra-virgin olive oils classification
system ... 93
4.3.1. Optimization of olive oil analysis ... 95
4.3.2. Analysis and classification of extra-virgin olive oils with the optimized analytical method. ... 101
4.4.
Polar antioxidants quantification in olive oils through
electrochemical analysis of DES extract ... 104
4.4.1. Electrode modification optimization ... 104
4.4.2. Extraction of total phenolic compounds with DES ... 107
V
4.4.4. Recovery and EVOO samples analysis ... 114
4.5.
EDXD analysis of edible oils ... 117
5.
Conclusions ... 120
Bibliography... 122
1
1. Purpose of the thesis
The main goal of this Ph.D. research has been the development, characterization, and application of innovative procedures and sensing tools for olive oil quality control, in particular, one or more analytical methods useful to categorize olive oils and detect frauds relating to olive oil quality, composition, and origin have been pointed out. In order to obtain a friendly platform for users with minimal waste production, all the methodologies had been aimed to minimize the organic solvent use or any other environmental toxic material.
In order to monitor as many parameters as possible concerning olive oils, different approaches to the olive oil quality problem were sought.
The first developed analytical system was constituted by a screen-printed electrode modified with green ionic liquids and nanomaterials. The initial tests were performed to find the best RTIL/nanomaterial combination [1] for the electrode modification. Then the RTIL/nanomaterial proportions in the functionalization mixture were optimized using a chemometric approach. Further studies were performed to understand if the best platform performance could be achieved by the enzyme immobilized on the electrode or incubated with the sample and the resulting mixture dropped on the electrode [2]. Finally, the optimized platform was used to analyze monocultivar oil samples collected over three years from various geographical origins in order to verify a possible classification based on the oil cultivar or geographical origins [3].
A second analytical system was developed to detect if an oil sample was adulterated or replaced with lower quality oils poor in polar antioxidants. To this aim, deep eutectic solvents (DES) were employed as an extraction medium for polar phenolic compounds present in olive oils. A screen-printed electrode was modified using a mixture of nanomaterials suspended in Nafion resin. At the same time, the extraction procedure of the polar phenolic compounds from olive oil was optimized by means of various mechanical steps. The DES phase was analyzed with the modified electrode
2
to quantify the polar phenols, which are only present in olive oil and not in other edible seed oils.
Finally, WAX and SAX diffraction measurements were performed to search a possible classification of olive oils, based on differences in the structures created by triglycerides aggregates. To this end, oil samples were analyzed using energy-dispersive X-ray diffraction (EDXD), which allowed fast and easy measurements of the oils with no pretreatment of the sample.
3
2. Introduction
2.1.
Olive Oil
Olive oil is defined as the oil obtained from the fruits of the olive tree (Olea europae L.) by mechanical means with processes that do not alter the oil organoleptic characteristics.
Olive trees seem to have coexisted alongside with humans since the early Bronze Age (3150 – 1200 BC). The origins of olive cultivation can be traced back to the east Mediterranean zone, nowadays corresponding to Turkey, Syria, Lebanon, Palestine, and Israel. Numerous archaeological finds suggest that olive trees were actively cultivated by the ancient farmers and both olives and olive oil were an integral part of their diet [4].
It is supposed that the Phoenicians (1000 BC) first brought the cultivation of olive trees in southern Spain and Northen Africa coasts, while the Greeks imported olive plants to their colonies in Southern Italy [5]. When the nascent Roman Empire came in contact with the Greek colonies in South Italy, they adopted the olive tree cultivation and, during their subsequent conquest of Europe, were responsible for spreading the tree across the Empire [6]. Romans did not mainly use olive oil for food purposes, preferring its use for personal hygiene, religious rites, as pharmaceutical ointments to treat diseases and as fuel for illumination [7].
Olive oil continued to be one of the central plants in numerous plantation in Southern Europe until the early 20th century where the discovery and development of low-cost solvent extraction of seed oils coupled with the rise of other sources of illumination (gas first and electricity later) marked a sharp decline in olive oil demand.
Olive oil returned in high demand when, in recent years, numerous scientific publications underlined its importance in human nutrition. Olive oil is a central food of the so-called “Mediterranean diet” [38], used both during cooking and poured raw on foods for flavoring. More and more proofs are emerging that this extensive use of
4
olive oil done by people in the Mediterranean area is correlated with a lower incidence of various illnesses and health problems such as obesity [8], hypertension [9], some types of cancer [10] and a general improvement in the functioning of the immune system [11], [12]. This is because, as opposed to seed oils, olive oil is a complex mixture of substances, mainly triacylglycerols (up to 99% of total weight), and a plethora of minor compounds, such as [6]:
• Pigments (mainly chlorophylls and carotenoids); • Aliphatic and aromatic alcohols;
• Sterols (mainly cholesterol);
• Antioxidants: polar (various phenolic compounds) and nonpolar (mainly tocopherol group);
• Various volatile and aroma compounds (alcohols, esters, aldehydes, ketones, etc.).
Regarding the fatty acids making up the triacylglycerols, their composition varies strongly depending on genetic profile (cultivar) from which the olives have been obtained. The most common fatty acid encountered in olive oils (and relative abundance) are: • Oleic acid (C18:1 55.0-83.0 %) • Palmitic acid (C16:0 7.5-20.0 %) • Linoleic acid (C18:2 3.5-21.0 %) • Stearic acid (C18:0 0.5-5.0 %) • Palmitoleic acid (C16:1 0.3-3.5 %) • Others (less than 1.0 % each)
5 Figure 2.1 Most prevalent fatty acids forming triglycerides in olive oil: A) Palmitic acid; B) Oleic acid; C)
Linoleic acid
As can be seen (Figure 2.1), olive oils are mostly composed of unsaturated fats unlike other traditional fats such as butter rich in saturated fats [13].
2.1.1. Olive oil production
In order to maintain the aforementioned beneficial properties for human health, olive oil must be obtained from olives with methods that minimize the degradation of the final product.
The extraction of oil from olives is mainly carried out by two methods: a discontinuous method carried out with traditional mills and a continuous one performed with "modern" mills.
The operating cycle of a traditional mill requires that the olives are washed (not always defoliated) before grinding. For crushing, ancient stone wheels (molazze) are
6
used. The olive paste produced is distributed on fiber disks (now synthetic fiber, once made of vegetable fiber) called "fiscoli", which are placed one above the other. The stack thus obtained is then pressed to obtain the oil. The main advantage of a traditional oil mill is that the paste suffers lower heating and less mechanical stress. On the other hand, there are some disadvantages in using this system, such as long processing times, difficult cleaning of the machines used, prolonged exposure of the paste to air and light, all of which can lead to oxidation of the oil.
The modern oil mill with a "continuous cycle" system consists of a set of machines continuously connected to each other, thus excluding any interruption in processing. The phases of the olive oil extraction process are washing, crushing, kneading, centrifugation, and separation. Different extraction methods are used, the most common one is the 3-phase cycle (oil/water/pomace): the olives are washed and defoliated, are sent to the olive press which continuously produces an olive paste that goes to the kneader. The olive paste, appropriately added with water (characteristic of the 3-phase cycle), is sent to the centrifuge, which separates the paste in its three components: pomace, vegetation water, and oil-water emulsion. The emulsion is sent to another centrifugal separator to extract the oil. The main advantages of this method are the speed and cleaning of the process, the main disadvantages are the high cost of machinery and energy. Furthermore, since the machine involved in the process work in a closed-circuit system, the temperature of the olive paste can rise to levels where degradation processes can happen, especially during the crushing and kneading phases.
2.1.2. Olive oil quality regulation
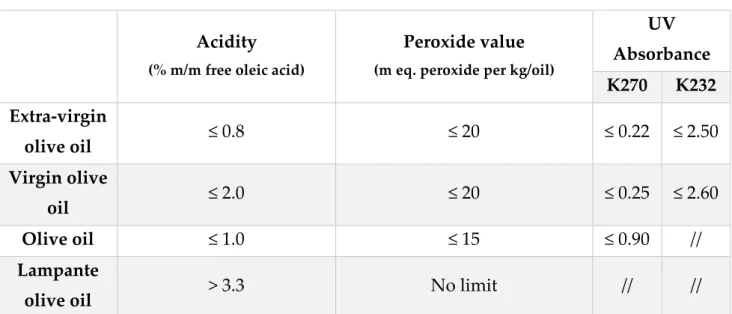
Olive oil quality parameters have been defined by the International Olive Council (IOC) [14]. The three major parameters that are used to categorize an olive oil are:
7
• Acidity (expressed as % m/m of free oleic acid). It is an index of deterioration of the structure of the triglycerides, due to incorrect storage (i.e., oil in an untreated metal container or stored at high humidity/temperature), microbial contamination or low quality of the olives.
• Peroxide value (expressed as milliequivalents of peroxide oxygen per oil kg). An index of oxidation of the fatty acids of the oil. A high value could be due to long time exposure of the oil to air/light/high temperature during the grinding phase of production.
• Absorbance in ultra-violet (K270 - K232). Measurement that gives the abundance of ketonic and aldehydic compounds in the oil. These compounds are produced by the fragmentation and decomposition of the peroxidated free fatty acids of the oil.
Based on the analyses of these factors, the olive oils are thus categorized:
Table 2.1 Categorization of olive oils based on analytical parameters according to International Olive
Council
For olive oil production in the European Union, the analytical procedures for the determination of these parameters have been defined by Commission Regulations [15], [16]. Furthermore, these regulations define that the label must not contain false, misleading information or anything else to to deliberately mislead the consumers about the origin, the organoleptic qualities and/or the composition of the product.
Acidity (% m/m free oleic acid)
Peroxide value (m eq. peroxide per kg/oil)
UV Absorbance K270 K232 Extra-virgin olive oil ≤ 0.8 ≤ 20 ≤ 0.22 ≤ 2.50 Virgin olive oil ≤ 2.0 ≤ 20 ≤ 0.25 ≤ 2.60 Olive oil ≤ 1.0 ≤ 15 ≤ 0.90 // Lampante
8 2.1.3. Olive oil adulteration
Due to the considerable market involved (2,186 million tons of olive oil produced in Europe) and the large request (1,584 million tons consumed only in Europe) [17] the risk of frauds concerning the adulteration of olive oils is high. The problem is further exacerbated by the progressive increase in prices of commercial extra-virgin olive oils caused by worsening climate conditions in Italy, Greece, and Spain so that an increasing portion of the commercialized olive oil comes from extra-European sources. Traceability for these oils is often poor, and scams and frauds are common. The analytical techniques proposed by the European Union to ascertain olive oil quality and to certify the commercial category, are not useful to classify extra-virgin olive oils according to their geographical origin [18]. Furthermore, scammers have found ways to adulterate the oils sold in ways as to deceive the analyses.
The typical frauds performed in recent years to evade such controls are [19]–[22]: • replacement of all or part of the olive oil with different seed oils (sunflower,
hazelnut, etc.), the oil is then added with chlorophyll/carotenoids to obtain an olive oil-like color
• mixing extra-virgin olive oil with olive oils of lower quality (i.e., virgin or lampante virgin olive oils); if acidity results over the limit for extra-virgin oils, the oil is deacidified by addition of sodium hydroxide and removal (by filtration) of the formed precipitate;
• chemical/physical treatment of low-quality oils to make them look-like extra-virgin ones: oils can be subjected to deodorization (removal of volatile compounds such as aldehydes, alcohol and short-chain carboxylic acids responsible for odor defects [23]), deacidified, added with dyes (for example chlorophyll, carotenoids) to correct color;
• replacement or mixing of the PDO oils (Protected Denomination of Origin) with oils of unknown origin.
9 Figure 2.2 Top 10 product categories (number of requests) in the Administrative Assistance and
Cooperation System – Agri-Food Chain (AAC-FF) in 2018 (data from “The EU Food Fraud Network and the System for Administrative Assistance - Food Fraud - Annual Report 2018.”, European Commission for Health and Food Safety).
As can be seen from Figures 2.2 and 2.3, frauds concerning fats and oils have been quite common in recent years. In Figure 2.3 it can be observed that the majority of the frauds (59%) are due to mislabeling of the final product sold to the consumers. Still, a noteworthy percentage of the frauds consists of adulteration of the product (18%) by addition and/or replacement of the product with others of lower quality, unapproved treatment and or processes (5%) in order to improve the production yield and/or the organoleptic qualities of the product and, finally, alteration of origin documentation, composition and production method of the fat/oil transported and sold.
0 5 10 15 20 25 30 35 40 45
Fish and fish products Meat and meat products Oils and fats
Alcohol beverages
Dietetic foods, food supplements, fortified foods Herbs and spices
Other food product/mixed Animal by-products Honey and royal jelly Fruits and vegetables
10 Figure 2.3 Types of suspected violations relating to fats and oils (data from “The EU Food Fraud Network
and the System for Administrative Assistance - Food Fraud - Annual Report 2018.”, European Commission for Health and Food Safety).
The rapid and reliable detection of such adulterations has been the object of numerous researches in recent years. Many innovative analytical procedures have been proposed, including not only sample preparation and analysis but also data processing and interpretation with chemometric techniques. As seen before, olive oil is a complex matrix, where the most abundant compounds (triglycerides and free fatty acids) are very similar both for composition and abundance to those present in other seed oils.
FT-NIR [24] and Raman scattering spectroscopy [25] techniques, implemented by chemometric data treatment, can be successfully employed to monitor the compositions and relative abundances of fatty acids, trans-fatty acids, and triacylglycerols.
NMR spectroscopy techniques (1H, 13C, and 31P) have been extensively used in virgin oil adulteration control and two different approaches can be employed [26], [27]. In one case, NMR spectroscopy can be employed to perform quantitative analysis of olive oil triacylglycerols, fatty acids, and sterols, and anomalous compounds can be quickly individuated. In the other one, NMR can be employed to detect specific peaks
Food Fraus: Fats and oils (2018)
Mislabeling
Replacement/diluition/addition/removal in product Unapproved treatment and/or process
Documents absent/falsified; manipulated documentation Intellectual Property Rights Infringements
11
related to the “fingerprint” of low-quality seed oils typically used for adulteration, down to very low detection limits.
Mass spectrometry (both alone and coupled with LC technique) is probably one of the most common analytical techniques present in the literature regarding EVOO adulteration detection. Direct infusion of the oil sample in the Mass spectrometer leads to complex spectra revealing the fragments of all the present oil compounds. It has been demonstrated [28], [29] that, by processing the obtained spectra with chemometric tools, it is possible to discriminate between pure EVOOs and adultered oils. When combined with a separation technique (commonly HPLC), mass spectroscopy can be used to exactly determine all the components of the oil under examination. This methodology allows adulterant compounds to be detected at very low levels; if coupled with spectra databases, the methodology allows the geographical origin of the oil to be identified [30]–[32].
While these methods succeeded in identifying frauds, they have proved to be too expensive, time-consuming and difficult to apply to the large-scale analyses, routinely performed at custom offices on imported foods from Countries outside the EU. At the same time, with the removal of custom office at the border between different EU countries, it is increasingly difficult to identify adulterated olive oils marketed around the European Union.
12
2.2.
Biosensors
To determine analytes of interest more and more sensitive and selective methods have been sought in the Analytical Chemistry field. At the same time, many attempts have been carried out to yield portable and straightforward systems for analyses on the field. All the methods involving biosensors hold these characteristics.
Numerous research groups deal with biosensor technology, driven by the great versatility of molecular recognition of receptors and because the single device allows the main analytical requirements to be satisfied: easy sampling and sample processing, quick processing data analysis, and interferences reduction.
A biosensor is defined as an analytical device capable of performing qualitatively and possibly quantitatively analyte determination employing the specific interaction between the analyte and bioactive component used. Due to this interaction, the variation of a physical or chemical property of the bioactive element is converted into a measurable signal, through the appropriate signal transducer [33]. The signal thus obtained, appropriately amplified and processed, will provide the qualitative or quantitative analytical information required. The purpose of a biosensor is, therefore, to convert a chemical parameter (concentration of an analyte or group of analytes) into a digital signal (Figure 2.4).
13
Biosensors can be classified using different parameters:
• Analyte/bioactive element interaction kind: the measured signal derives from the concentration variation of a reagent or a product of the reaction catalyzed by the enzyme (biocatalysis) or from the variation of a chemical-physical property of the bioactive element (charge density; interaction with light; etc.), after its association with the analyte (bioaffinity) [34].
• Bioactive element type: the type of bioreceptor used varies widely depending on the searched analyte and the sensitivity and selectivity required. It is possible to use, as bioactive elements, single biomolecules (e.g., proteins, enzymes, antibodies, nucleic acid segments), entire microbial cells, parts of plant or animal tissues or small organisms (lichens, molds, etc).
• Transduction system: the transduction system employed in the biosensor strongly depends on the properties of the chosen bioactive component and the target analyte. The most common transduction systems are. [35]:
o Optical based: measurement of the variation of intensity or frequency of electromagnetic radiation absorption or emission after the interaction between the analyte and bioactive component. [36].
o Acoustic based: measurement of the vibration frequency variation of a piezoelectric crystal subjected to an alternating current after the interaction. [37]
o Calorimetric based: measurement of the amount of heat produced or absorbed by the interaction (with known enthalpy). [38]
o Electrochemical based: measurement of the variation of electrochemical parameters of the system:
▪ Amperometric: measurement of current intensity produced in the measuring cell under a constant fixed potential. [39]
▪ Potentiometric: measurement of the potential difference between the working electrode and reference electrode during the studied interaction [40]
14
▪ Conductometric: measurement of the conductivity variation in the measuring cell due to the studied interaction [41].
2.2.1. Enzymatic Biosensors
Among the numerous biological receptors useful to produce a biosensor, the most commonly used are enzymes. In the past years, many enzymes catalyzing a large number of analytical interest reactions have been discovered and characterized, especially for the food and environmental fields. Furthermore, enzymes are often highly specific for the substrates under examination, making them suitable for creating biosensors with high specificity.
In an enzymatic biosensor, the interaction between the substrate and the enzyme takes place in a specific region of the protein, the active site. Here the chemical reaction takes place, and then the reaction products leave the active site. After that, a new reaction cycle can begin [35]. Small amounts of enzyme, the catalyst, are needed to catalyze the desired reaction and thus miniaturized and reusable sensors can be assembled.
Enzymes show a drastic activity decrease if they work in non-physiological conditions or in the presence of inhibitors or product excess. These applicability limits of enzymes affect their use in biosensors in extreme conditions: very high/low temperatures, acidic/basic solutions, high ionic concentrations, presence of inhibitors, etc. It must be taken into account that some enzymes require cofactors to exploit their catalytic function; therefore, the reaction conditions for the cofactor must be considered too.
2.2.2. Electrochemical biosensors
Electrochemical biosensors have been the object of basic and applied research for more than fifty years. Leland C. Clark presented the first enzymatic electrode with
15
immobilized glucose oxidase during the Symposium at the New York Academy of Sciences in 1962 [42].
The most critical element of an electrochemical biosensor is the bioactive element which recognizes the target electroactive substance, producing the variation of an electrochemical property of the system transducted and recorded as a digital signal. When enzymes are used as bioactive components, the analyte acts as the enzymatic substrate; alternatively, the analyte can act as an inhibitor of a redox process involving the enzyme and another substrate. Furthermore, enzymes can be used to bind antibodies, antigens, or oligonucleotides with a specific sequence, creating mixed type sensors based on affinity. Common enzymes selected and studied to analyze clinical and food metabolites are alcohol dehydrogenase, glucose oxidase, glucose dehydrogenase, lactate dehydrogenase, and urease, etc. [43].
The most commonly used electrochemical biosensor is the amperometric one. Its operation is based on the measurement of the current produced by the oxidation or reduction of the analyte, at constant potential with respect to a reference electrode, in the presence of the counter electrode. The current thus produced is proportional to the concentration of the analyzed chemical species. The applied potential chosen depends on the oxidation/reduction potential of the analyte, on the reference electrode used and the presence of any electrochemical interferents.
The transfer of electrons between the enzyme and the electrode has been widely discussed along time.
Depending on the type of transfer, the amperometric biosensors can be divided into three generations (Figure 2.5):
• First generation biosensors: there is no electron transfer between enzyme and electrode. In this case, the concentration variation of the substrate or the product or a natural redox mediator (e.g.oxygen discharged at the working electrode) that gives rise to a redox reaction at the electrode, is measured. • Second generation biosensors: the electron transfer between the enzyme and
16
• Third generation biosensors: the direct electron transfer between the enzyme and electrode takes place (DET).
Figure 2.5 Amperometric biosensors: A) First generation; B) Second generation; C) Third generation
(Antonelli M. L., et al., Edizione Nuova Cultura - Roma, 2015)
The first generation biosensors have obvious problems: the response is proportional not only to the substrate concentration but also to the secondary reagent concentration. The most common secondary reagent is oxygen, which causes further problems, mainly due to its high reduction potential (in absolute value) (-0.7 V). In the second generation biosensors, problems have been overcome by replacing oxygen with a redox mediator. This kind of molecule can be oxidized and reduced reversibly by transporting electrons between the enzyme and the electrode. The mediator must have a low redox potential and a fast reaction to avoid interference by other electroactive substances.
The direct electron transfer (DET) that occurs in third-generation biosensors contributes to making the biosensor even more selective. The enzymatic reaction takes place directly on the working electrode, and the applied potential will be the same as the enzyme. The absence of the mediator reduces the error sources. The principal disadvantage in the third generation biosensors development is the reduced number of redox enzymes that can give rise to the DET. Since the electron transfer channels of the enzyme must be near to the electrode and to the active site too, the structure and immobilization of the enzyme must be carefully studied.
17
Despite the previous issues, many third generation amperometric biosensors have been realized employing laccase, cytochrome c, peroxidase, glucose oxidase, alcohol dehydrogenase, etc. [44].
18
2.3.
Nanomaterials
Recently the interest of the scientific community has been focused on “nanoscience” (formally defined by the National Nanotechnology Initiative in the USA), which deals with the study of the properties of nanometer-scale materials (1 to 100 nm). The idea to investigate the microscopic to make a change in scientific progress was set in 1959 by the American physicist Richard Feynman, considered the father of nanoscience, in a speech remembered as "There is plenty of room at the bottom" [45]. Since then, the interest in this sector began to develop, and it is continuing to increase.
Nanoscience represents a combination of different disciplines, ranging from physics to supramolecular chemistry, from material science to molecular biology. In general, nanotechnologies employ methods and knowledge specific to nanosciences and deal with the design, characterization, implementation, and application of structures, devices, and systems characterized by nanometric dimensions. Feynman's hypotheses proved to be well-founded in fact, nanomaterials were successfully employed in a large number of sectors, such as catalysis, optoelectronics, sensors, and drug delivery. The nanomaterials allow a broad spectrum of applications because the properties of materials (reactivity, mechanical strength, optical properties, magnetic properties, and electrical characteristics) strongly vary moving from the macroscopic to the nanoscale world. The properties of nanoparticles, therefore, differ both from those of massive substances, and from those of molecules and isolated atoms, being influenced by the presence of atoms that in this scale can be on the surface or in the bulk of the material (in nanoscale, electron-surface collisions cannot be neglected). Precisely because of this non-symmetry of the interface with the surrounding environment, there are considerable chemical-physical differences with bulk materials.
Nanomaterials can be classified based on the number of non-nanometric dimensions present in the system. At least one dimension must be in nanometric scale, i.e. <100 nm, so that, in these systems, at least one dimension shows quantum confinement effects (significant at size <10 nm):
19
• Nanocrystals, quantum dots, and atomic clusters: they are structures consisting of aggregates from tens to thousands of atoms, and present the three spatial dimensions in the nanometer scale. They are defined as 0D nanostructures.
• Nanotubes and Nanowires: they have one macroscopic dimension (the length), and two nanometric ones. Nanotubes, in particular, can be single or multiple coaxial structures. They are defined as 1D nanostructures.
• Nanostrates: they are thin surfaces or films, single or multiple, where the total stack thickness is in the nanoscale dimension. They are defined as 2D nanostructures.
• Nanostructures: they are materials having all the macroscopic dimensions but containing inside them 0D, 1D, 2D structures.
There are two general strategies for obtaining nanostructured materials: top-down and bottom-up. By the first method, nanomaterials are manufactured starting from macroscopic materials to reach nanoscale levels, through physical processes such as lithography, laser ablation, or irradiation of various types, etc.
The "bottom-up" method allows obtaining nanoparticles by chemical reactions starting from solutions, basing on the ability of specific atoms or molecules to self-assemble, through chemical bonds.
In both cases, the produced nanomaterials can be examined by various techniques to characterize their structure, and to find any defects:
• Scanning Electron Microscopy (SEM) • Transmission Electron Microscopy (TEM) • Scanning tunneling microscopy (STM) • X-ray diffractometry
20 2.3.1. Multi-walled carbon nanotubes
Several research groups had already reported the discovery of structures similar to carbon nanotubes [46] dates back to the sixties, but it was only the article published by Ijima in 1991 [47] that carbon nanotubes became of interest in the scientific literature all over the world. Ijima first proposed a method for the synthesis of carbon nanotubes, without catalysts, similar to the fullerenes synthesis one [48]. Ijima discovered that nanometric tubular structures were formed by vaporizing graphite and each structure was constituted by coaxial tubes with a total diameter between 2 and 50 nm (single- or multiwalled nanotubes).
Carbon nanotubes are among the most resistant fibers known. They are chemically stable and are good conductors of electricity and heat. Trigonal carbon atoms covalently link each other forming a hexagonal network sheet, resulting in a structure that rolls up to form a single or a multi-tube. Each nanotube ends with a hemispherical structure similar to that of fullerene.
Carbon nanotubes have exceptional resistance to physical stress: subjected to axial stress, they bend over wide angles before deforming. Moreover, unlike what happens in some other polymers, these strains are elastic and disappear when the stress stops. There are three geometries in which the sheet can be rolled up to give rise to the nanotube: chair, zigzag, and chiral (Figure 2.6).
21 Figure 2.6 Nanotube structures: A) chair; B) zig-zag; C) chiral
The nanotube electrical conductivity depends on its structure: in chair conformation, it is similar to metals conductivity (106 S m-1), while in zigzag and chiral conformations it tends to a semi-metallic behavior.
The high conductivity of carbon nanotubes is due to the quantum confinement of the electrons in the material. The only tube direction in which the electrons can disperse is the length: this derives from a characteristic of the starting material, graphene. By rolling the graphene to form a tube, boundary conditions are imposed on the carbon electrons. If the diameter of the nanotube becomes a multiple of the wavelength of an electron, the nanotube will be a conductor; otherwise, it will act as a semiconductor. A perfectly structured conductive nanotube will be a ballistic conductor, in which the resistance is not zero (as in the case of superconductors) but independent of the distance traveled by the electron in the tube (in contrast to Ohm's law).
From the chemical point of view, nanotubes are remarkably stable structures, almost inert, except for the fullerene-like ends. Precisely these ends can be "activated" by transforming them into functional groups (generally carboxylic functions) by treatment with oxidants, without altering the properties of the remaining structure. The functionalized ends can react with the target substances. This property is advantageous in the development of electrochemical biosensors.
22 2.3.2. Gold nanoparticles
Many materials radically change their properties in the transition from macro to nanostructures. This is particularly evident in the case of gold. In its massive state, gold is an almost inert element, which gives rise to oxides only in the presence of powerful oxidants. At the nanometric level, gold nanoclusters are more reactive and have a central role in numerous applications.
The strategy used for the production of gold nanoparticles is that discovered in 1994 by Brust and Schiffrin [49]: a solution of tetrachloric gold acid (H[AuCl4]) is treated with sodium borohydride (NaBH4), reducing Au III to Au 0. To prevent the gold precipitation, a thiol (often alkylated) is added. Gold forms covalent bonds with thiols and the solutions thus prepared are stable for extended periods of time (Figure 2.7). The average size of gold clusters can be adjusted by varying the experimental conditions.
Figure 2.7 Functionalized gold nanoparticles: synthesis and structure
The alkyl groups of thiols can be further functionalized, allowing the gold nanoparticles to interact with molecules of biological origin without modifying their activity. These nanostructures may link bioactive elements to biosensors without polymeric immobilization, thus highly biocompatible systems can be prepared [50], [51].
23 2.3.3. Graphene
Graphene is a 2D nanostructured material, made entirely of sp2 hybridized carbon atoms, arranged in a hexagonal network (Figure 2.8). The thickness of a graphene sheet is 0.345 nm.
Graphene was first observed in 1962 with an electronic scanning microscope in catalysis research. This material was rediscovered, isolated and characterized in 2004 [52] through an exfoliation procedure starting from graphite.
Three of the four valence electrons of carbons form covalent bonds with neighboring carbon atoms, the fourth valence electron of each atom gives rise to the π delocalization.
Figure 2.8 Graphene: planar monolayer of carbon atoms arranged in repeated hexagonal structures These characteristics give to the graphene sheets a behavior similar to that of classical semiconductors: in its pure form it is not a good current conductor but, if adequately doped, it can reach an electrical conductivity comparable to that of excellent conductive metals such as gold and silver (GPH = 108 S m-1, Au = 4.1 x 10⁷ S m-1, Ag = 6.30 x 10⁷ S m-1). The real limiting factor in the conductivity of graphene is the substrate on which it is deposited. The interactions between the π-graphene orbital and the substrate orbitals slow down the speed of movement of the electrons, significantly reducing the conductivity of graphene.
24
Graphene is used in numerous applications in the biosensor field, due to its smooth interaction with biomolecules or micro-organisms [53]. Since the immune defenses of micro-organisms cannot identify and destroy this nanomaterial, graphene-based biosensors allow performing in vivo measurements.
2.3.4. Titanium dioxide nanoparticles (TiO2)
Titanium dioxide (IV), TiO2, generally called titania, belongs to the family of transition metal oxides. The most famous polymorphs of titania existing in nature are five: rutile (tetragonal), anatase (tetragonal), brookite (orthorhombic), and two high-pressure polymorphs known as Akaogiite (monoclinic) and TiO2 II (hexagonal α-PbO2 like). Titania is prepared in the form of powders, crystals, thin films, nanotubes, nanorods, and nanoparticles. Liquid phase synthesis is one of the most convenient and conventional methods used in its chemical synthesis. This method offers the advantages of controlling the stoichiometry of the reaction, its products are homogeneous, and it allows the formation of complex shapes and the preparation of composite materials.
As a bulk material, rutile represents the most common phase; however, liquid phase preparation methods generally favor the anatase structure. When the particle size is rather small (less than 30 nm), the surface energy is an important part of the total energy, and it has been observed that the surface energy of the anatase is lower than that of the rutile and brookite [54].
Titania is a broadband semiconductor, as it has energy gaps at 3.2 eV, 3.02 eV, and 2.96 eV respectively for the anatase, rutile and brookite phases. Its properties are considered to be very similar to those of an ideal semiconductor for photocatalysis, due to its stability. Titania acts as a more performing photocatalyst when it is in nanoparticles form rather than in bulk. The increase in catalytic activity has been attributed to the particle size, which allows a greater surface area to be obtained per
25
unit of mass. Moreover, its low cost and its low dangerousness and toxicity towards man and the environment allow titania nanoparticles to be widely used.
When the diameter of the crystallites forming the semiconductor falls below the value of 10 nm, each charge behaves like a particle in the box. So, the energy gap increases and the boundaries of the band shift to higher potentials [55]. Currently, TiO2 nanoparticles (TiO2 NPs) are widely used for their high stability, anticorrosive and photocatalytic properties. TiO2 NPs can be used in catalytic reactions, in the treatment of polluted water by hazardous industrial by-products, in nanocrystalline solar cells as photoactive material and in self-cleaning fabrics. In the nanomedicine sector, TiO2 NPs are under study as useful tools in advanced imaging and nano-therapy. For example, TiO2 NPs are evaluated as potential photosensitizers for use in photodynamic therapy (PDT). Furthermore, the unique physical properties make TiO2 NPs ideal for use in various skincare products [56].
26
2.4.
Room temperature ionic liquids (RTILs)
The term "ionic liquids" refers to chemical compounds consisting of different combinations of ions that are liquid at room temperature or in any cases below 100 °C. The ions used are generally of considerable size, with the cationic portion having low symmetry, these features prevent uniform packing of the ions. Generally, the cationic part is responsible for the physical properties while the anionic part is responsible for the chemical properties of the ionic liquid. One of the advantages, as a consequence of the chemical structure of ionic liquids, is that even a small change in the structure of the cation or anion can cause changes in properties such as viscosity, melting point, miscibility with water and density [57].
Ionic liquids can be divided into two families, aprotic (AIL) and protic (PIL). The difference consists in the presence of groups able to form hydrogen bonds, creating a network of bonds very similar to that of water.
The two most interesting properties of ionic liquids are: • Liquid phase in wide range of temperature
• Negligible volatility due to extremely low vapor pressure (usable in high vacuum systems).
These properties, combined with the ability of ionic liquids to dissolve a large number of organic and inorganic species, have allowed the replacement of previously used organic solvents. With the introduction of "green" technologies, the search for substitutes for organic solvents has become of particular interest. Solvents are considered dangerous chemical compounds for simple reasons: they are used in large quantities; they are usually volatile liquids that are difficult to contain and discard, are frequently toxic to humans and harmful to the environment.
The first ionic liquids were obtained by Paul Walden in 1914 [58], but this class of compounds was not particularly interesting for researchers until the 1980s when Seddon used them as non-aqueous polar solvents. Therefore, the first ionic liquids used, defined as "first generation", are those described by Seddon [59], consisting of
27
an aromatic cation (e.g. N-butylpyrimidinium or 1-ethyl-3-methylimidazole) and an inorganic anion (e.g. chloraluminate). It is evident that these compounds, although not very volatile, presented toxicity problems, especially about the aromatic cation. The ionic liquids subsequently studied were those having non-aromatic organic cations (e.g. Butylammonium + 3,4-dihydroxycinnamate). These compounds, defined as "second generation", had a limited diffusion despite their reduced toxicity, because only a few of the hundreds synthesized were liquids at room temperature [60]. Starting from the ionic liquids obtained, other systems were sought to make them compatible with the roles for which they were intended. Thus, task-specific ionic liquids (TSIL) were prepared in which the cation of a second generation ionic liquid was modified with different functional groups, thus giving new properties to the resulting compound. Many of these functionalized ionic liquids, defined as "third generation", were solid or extremely viscous at room temperature. This problem was partially worked out by solubilizing them in the non-functionalized ionic liquid, thus creating "task-specific" binary ionic liquids (BTSILs) [61].
Nowadays, to synthesize the "third generation" ionic liquids, the most commonly used salts are those having an alkylammonium, alkylphosphonium, N-alkylpyridinium or N, N-dialkylimidazolium cation (Figure 2.9). Despite their low volatility, considerable toxicity was observed for these ionic liquids due to the aromatic cation [62], [63].
Figure 2.9 (a) Alkylammonium cation; (b) alkyl phosphonium cation; (c) N, N’-dialkylimidazolium
cation; (d) N-alkylpyridinium cation.
There are two methods for the preparation of ionic liquids: metathesis of the halide salt (using silver, metals of the first group or ammonium salts of the desired anion), or acid-base neutralization reaction [64].
28 2.4.1. Non-toxic room temperature ionic liquids
The toxicity problem has long limited the use of ionic liquids, especially in the industrial field. Although less volatile than the common organic solvents, ionic liquids still required numerous precautions both for use and for disposal. It was also almost impossible to use them in a process or sensor employing biocomponents since the RTIL ions hindered the activity of numerous bioactive molecules, significantly reducing or completely blocking them. Since the toxicity of ionic liquids strongly depends on the chemical nature of the cation, researchers focused on creating ionic liquids with ions present in conventional biological systems. One of the best candidates for the role of the cation in the synthesis of highly biocompatible ionic liquids was choline, an essential micronutrient for all cells [65]. Considering the non-toxicity, biodegradability, and biocompatibility of amino acids, a widely available biomaterial, the twenty natural amino acids have been used as anions for the synthesis of ionic liquids. These choline-amino acid ionic liquids [Ch] [AA] are called "green" ionic liquids.
All the choline-amino acid ionic liquids have a very strong ionic couple, unlike the ionic liquids of previous generations in which the ionic pair was hampered by steric effects. Being [Ch] [AA] hydrophilic ionic liquids, their solubility in polar solvents is difficult. This peculiarity has been exploited for the development of miniaturized biosensors. These ionic liquids allow the bioactive components immobilization, on the working electrode (e.g. enzymes), without the problems of polymeric immobilization (enzyme inhibition, polymerization defects).
The knowledge of ionic liquids chemical and physical properties is critical to study the possibility of their applications in various fields of chemistry. The main chemical and physical properties investigated are viscosity, density, refractive index, and conductivity. The viscosity of all [Ch] [AA] ionic liquids is independent on the cutting speed, showing Newtonian behavior, and this feature is expected for all ionic liquids.
29
Viscosity covers a wide range, from the minimum value found for [Ch] [Ala] (0.72 Pa s) to the maximum obtained for [Ch] [Hys] (7063 Pa s).
It has been shown that the viscosity of ionic liquids depends on the molecular weight, structure, and symmetry both of the cation and the anion. The variability of the amino acids functional groups (R group) can give rise to many kinds of interactions (van der Waals, stacking, and hydrogen bond ). Thus, when the chemical properties of amino acids are studied, it is possible to identify two groups relative to the structure of the functional R-group. One group may be constituted by amino acids with alkyl chains as R group, another with R group characterized by heteroatoms, capable of forming hydrogen bonds.
The density ranges, for the ionic liquids studied, from 1.05 g cm-3 to 1.20 g cm-3. The density decreases with increasing molecular weight of the anion. There are two distinct trends for the two previously identified groups of [Ch] [AA]: RTILs formed by amino acids having heteroatoms in their R-group have an average density higher than those without. Furthermore, the presence of hydrogen bond can lead to an increase in density, while the substitution of a methyl group with a phenyl one, in the R-group chain, does not appear to produce any increase in density.
The refractive index of ionic liquids [Ch] [AA] decreases linearly with temperature. The refractive index values vary in the range from 1.48 to 1.54, the trend shows that the structure of the amino acid does not significantly influence the index. It should be however noted that the lowest values were observed for amino acids with the aliphatic R group, while the highest values were obtained for amino acids with an aromatic R group.
The conductivity of ionic liquids [Ch] [AA] measured at 25 ° C varies in the range from 0.12 μS cm-1 to 90.6 μS cm-1. Conductivity is mainly dependent on the number and mobility of charge carriers. The relatively low conductivity of ionic liquids [Ch] [AA] is due to the low mobility of charge carriers. This, in turn, is caused by the size of the ions, the strength of the ion pair, and the formation of hydrogen bonds.
30
2.5.
Deep Eutectic Solvents (DES)
The term Deep Eutectic Solvents (often shortened as DES) indicates a class of solvents formed by mixing two or more solids and resulting in an eutectic with a much lower melting point than each of its constituents. Similarly to RTILs, DES are liquid at room temperature. Unlike RTILs, which are constituted by ions with separated charges, DES are constituted by a mixture of Lewis or Brønsted acids and bases which act as hydrogen bond acceptors and hydrogen bond donors. In particular molar ratios, they create strong intermolecular interaction [66], [67] which help to drastically reduce the melting point of the formed mixture.
Their easy synthesis, lower toxicity, and ability to dissolve organic compounds (compared to traditional solvents or equivalent ionic liquids) have led DES to have special attention from the scientific community. DES present favorable physical properties such as low melting point, low volatility, high viscosity, high surface tension, and high thermal stability [68], [69]. Thanks to these properties, DES have found use in the last years in various fields such as organic synthesis [70], extraction [71], enzymatic reactions [72], electrodeposition [73], and chromatography [74]. All DES have a common formulation, with two constituents: one salt (inorganic or organic) and a Lewis/Brønsted acid-base couple species; the resulting structure can be expressed as 𝐶𝑎𝑡+𝑋−𝑧𝑌, where 𝐶𝑎𝑡+is a big cation (usually, but not only, ammonium, phosphonium or sulfonium cation), while 𝑋− is a halide, acting as a small Lewis base, which interacts with a Lewis/Brønsted acid (Y).
Depending on the nature of the Lewis/Brønsted acid used, DES are categorized into four different types:
• Type 1 DES: the Lewis/Brønsted acid is a non-hydrated metal halide, such as Zinc [75], Gallium [76] or Indium [77].
• Type 2 DES: they use hydrated metal halides as Lewis/Brønsted acid and the cation from choline chloride. Some examples of metals used are Cobalt, Copper, or Chrome [78].
31
• Type 3 DES: this class of DES foregoes the use of metals using instead organic molecules as Lewis/Brønsted acids. Numerous classes of organic compounds have proved useful to create DES, such as amides, carboxylic acids, and alcohols. The DES thus produced are low cost, relatively biodegradable and, sometimes, even non-toxic. Since properties of the produced DES such as solvation selectivity depend on the Y element of the synthesized eutectic, this class results particularly versatile for application [79]–[81].
• Type 4 DES: these DES differ from those previously seen since they are synthesized using an inorganic cation. A commonly used cation in this type of DES is Aluminum chloride (AlCl3), which forms DES when mixed with urea [82].
Similar to RTILs, DES often have potential windows in which they are electrochemically inert. Thanks to this, and the tunability of their other physiochemical properties, DES can be used to selectively extract compound from biological matrixes [83], [84] and directly analyze them with electrochemical methodologies without the need of further purification.
32
3. Experimental part
3.1.
Materials
3.1.1. Reagents
All chemicals used in this work are of analytical grade. In particular potassium ferricyanide, potassium phthalate, potassium dihydrogen phosphate, and sodium monoacid phosphate are produced by Merck (Kenilworth, NJ, U.S.A.); potassium chloride, D-(+)- glucose monohydrate, potassium hydroxide, nitric acid and ethyl ether are produced by Carlo Erba (Cornaredo (MI), Italia); standard olive oil, lactic acid, caffeic acid, vanillic acid, p-cumaric acid, tyrosol, gallic acid, ethanol, multi-walled carbon nanotubes (MWCNT) (O.D.=(10±1) nm; I.D.= (4.5±0.5) nm; L=3-6 μm), choline hydroxide and all the amino acids used are produced by Sigma-Aldrich (Buchs, Switzerland). Titanium dioxide, anatase form with purity 99%, as nanoparticles with 5 nm diameter is produced by NanoAmor Nanostructured and Amorphous Materials Inc. (Houston, TX, USA)
Lipase enzyme from Candida Rugosa is a commercial product of Sigma-Aldrich (Buchs, Switzerland) stored at 4 °C.
Glucose oxidase from Aspergillus Niger and alcohol dehydrogenase from
Saccharomyces Cerevisiae are produced by Sigma-Aldrich (Buchs, Switzerland) and
stored at -18 °C.
All the solutions have been prepared using deionized water (R=18.2 M/cm a 25 °C; TOC<10 g L-1) obtained using a Millipore Direct-Q UV3 (Millipore, Molsheim, France).
Ionic liquids are obtained by “liquid-solid” titration of a solution of choline hydroxide (liquid) with the amino acid of choice (solid) quantified by weighing, described in detail in section 3.2.6. Ionic liquids prepared and used in this work are Choline – Glycine ([Ch][Gly]); Choline – Serine ([Ch][Ser]) and Choline – Phenylalanine ([Ch][Phe]).
33 3.1.2. Preparation of solutions
The following solutions have been used:
• Nitric acid solution 2 mol L-1 used to activate (oxidize) MWCNT on the working electrode (DropSense ceramic electrodes) or the MWCNT used to functionalize GSI electrodes (method of functionalization is described in section 3.2.8);
• Solid mixtures of activated MWCNT and TiO2 nanoparticles at different proportions (0:100, 30:70, 50:50, 60:40, 70:30, 80:20, 90:10 e 95:5). The solids were crushed in a ceramic mortar to obtain a finely mixed solid mixture.
• Phosphate buffer (I=0.05) made from potassium dihydrogen phosphate and sodium monoacid phosphate in suitable ratios to obtain pH=7.40, at which Lipase has its maximum activity and pH=8.00, at which Alcohol dehydrogenase has its maximum activity.
• Phthalate buffer (I=0.05) at pH 5,10, at which Glucose oxidase enzyme has its maximum activity.
• In order to analyze olive and seed oils two different techniques have been tested: in the first one, the Lipase enzyme was immobilized on the electrode (incubation on the electrode), while in the second one the Lipase was mixed with the oil sample before it was deposited on the electrode for analysis (external incubation).
o For incubation on the electrode, an emulsion was prepared by mixing one of the oil samples with [Ch][Ser] RTIL and phosphate buffer pH=7.40, with a ratio of 40:40:20; 40 μL of this emulsion were deposited on the electrode. Lipase enzyme is already immobilized on the electrode together with nanomaterials and RTIL (as described in section 3.2.8). After 15 minutes (incubation time for the Lipase enzyme), the measurement was performed through cyclovoltammetry scans;
o For external incubation, an emulsion was prepared by mixing one of the oil samples with [Ch][Ser] RTIL and phosphate buffer pH=7.40, with a ratio of 40:40:20, lyophilized Lipase enzyme was added to this emulsion
34
in order to obtain a total enzymatic activity of 103,68 U/μL. The vial containing the emulsion was put in a thermostated bath at 37 °C (temperature at which the Lipase used has its maximum activity) for 15 minutes (incubation time for the Lipase enzyme). After the incubation time, the emulsion was mixed again and 40 μL were deposited on the electrode (modified as described in section 3.2.8). The emulsion was analyzed through ciclovoltammetry scans.
35 3.1.3. Screen-printed electrodes (SPE)
The screen-printed electrodes (SPE) used in this work are prepared by employing Thick Film Technology (TFT). This technique is based on serigraphic printing and allows for sequential depositions, using different “masks”, of thick film pastes (glassy carbon, silver, graphite) on a support made of isolating material. The supports used, which must provide both mechanical support and electrical insulation for the circuits, can be made of plastic (polyvinyl chloride, polycarbonate, polyester) or ceramic (Aluminum oxide, Magnesium oxide) material. The electrode array is printed on the support with a concentric geometry for the three electrodes: working electrode (graphite, glassy carbon or noble metals such as gold, platinum or silver), Counter electrode (graphite) and a reference electrode (silver) (Fig 3.1).
Fig 3.1: Screen-printed electrode printed on ceramic support by DropSens.
The circuits are then covered with a protective layer of dielectric material, leaving uncovered only the electrodes and the contacts to connect the potentiostat. In this work two types of screen-printed electrodes have been used, one of with ceramic material as substrate (Fig 3.1) produced by Dropsens, which will be referred further on as DS, the other printed on a plastic substrate by GSI Technologies (Fig. 3.2). In both cases, the working electrode had a diameter of 4 mm and a surface area of 12.56 mm2. Electrodes printed on plastic had a much lower cost and, thanks to the versatility of the material used as substrate, both the geometry and the diameter of the working electrode can be personalized by the manufacturer to meet different needs (Fig 3.2).
36 Fig 3.2: Screen-printed electrodes on plastic support, with different working electrode diameters,
manufactured by GSI Technologies.
Both SPE types can be further modified by functionalizing the working electrode with nanomaterials, membranes, enzymes, or other sensing elements.
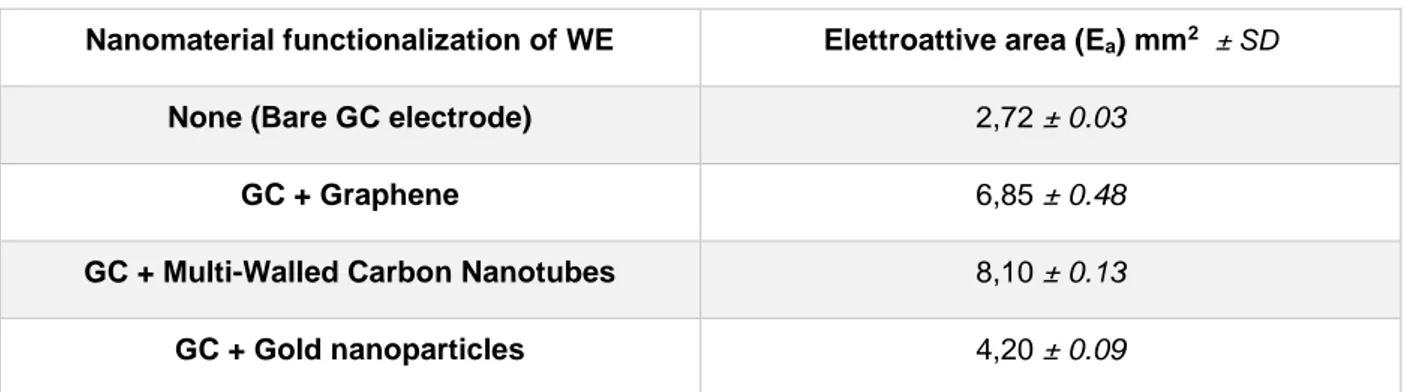
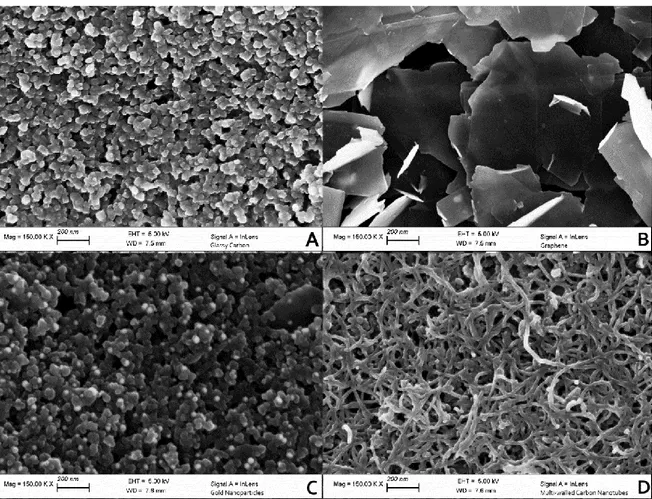
DS electrodes were bough both bare (Glassy Carbon working electrode) and already functionalized with different nanomaterials: Multi-Walled Carbon Nanotubes (MWCNT); Graphene (GPH) and Gold Nanoparticles (GNP). Both bare and nanomaterial-modified DS electrodes were characterized with SEM imaging to confirm the presence of the desired nanomaterial on the working electrode surface.
37 3.1.4. Olives sampling
Six Italian olives cultivar were studied: Frantoio (FRA), Leccino (LEC), Moraiolo (MOR), Nostrale (NOS), Canino (CAN), Itrana (ITR), produced in the center of Italy (Lazio region, Fig. 3.3).
During three harvest seasons (2016, 2017 and 2018), 42 olive samples of known cultivar and geographical origin were hand-picked and used to produce olive oils (Table 3.1). The monovarietal oils were laboratory-processed using a standardized method described in section 3.2.9. Samples were then stored in brown bottles at 4 °C. Within a few days from production, each oil sample was tested for free fatty acid content, peroxide value and polyphenols content using a CDR-FoodLab (CDR s.r.l - Ginestra Fiorentina - Firenze - ITALIA) instrument. The obtained values for all the produced oils fall inside the limits proposed by the EU for extra-virgin olive oils (acidity value< 0.8%, peroxides value < 20 meq O2/Kg oil).
38 HARVEST
2016 2017 2018
FRANTOIO_1/16 FRANTOIO_1/17
LECCINO_2/16 LECCINO_2/17 LECCINO_2/18 LECCINO_3/16 LECCINO_3/17 LECCINO_3/18 LECCINO_4/16
MORAIOLO_5/16 MORAIOLO_5/17 MORAIOLO_5/18 MORAIOLO_6/16 MORAIOLO_6/17
NOSTRALE_7/16 NOSTRALE_7/17 NOSTRALE_7/18 CANINO-8/17 FRANTOIO_9/17 FRANTOIO_10/17 FRANTOIO_11/17 FRANTOIO_12/17 FRANTOIO_13/17 FRANTOIO_14/17 FRANTOIO_15/17 ITRANA_16/17 LECCINO_17/17 LECCINO_17/18 LECCINO_18/17 LECCINO_18/18 MORAIOLO_19/17 NOSTRALE_20/17 NOSTRALE_21/17 NOSTRALE_22/18 FRANTOIO_23/18 FRANTOIO_24/18 LECCINO_25/18 LECCINO_26/18 LECCINO_27/18
39 Table 3.1 Monocultivar olive oil samples collected during 2016, 2017, and 2018 harvesting seasons.
Samples bearing the same number have been collected from the same plant in different years.
MORAIOLO_28/18 MORAIOLO_28/18 FRANTOIO_30/18
40
3.2.
Methods
3.2.1. Cyclic voltammetry
Cyclic voltammetry is a potentiodynamic electrochemistry technique: the current passing through an electrode in contact with the solution under test is measured with respect to the reference electrode. The potential applied to the working electrode varies through time, following a triangular wave function (Fig. 3.4). The current intensity measured will be proportional to the electrons exchanged in the redox processes at the working electrode, involving the analytes in solution [85].
Fig. 3.4 Classical waveform for cyclic voltammetry
Applied potential is continuously and linearly varied over time. Potential variation in one unit of time is called scan rate.
If the potential applied to the working electrode is equal to the redox potential of one of the electroactive species in solution, an increase of the current flowing through the circuit will be recorded.
When the potential value reaches the maximum (or minimum) set, the scan will change direction and go back to the initial value. The current intensity measured is
41
reported in a diagram, according to the applied potential, called voltammogram (Fig. 3.5).
Fig. 3.5 Voltammogram of a reversible process
From a voltammogram is possible to define if the analyzed system is reversible (or quasi-reversible) or irreversible.
A reversible system has some important parameters:
• Oxidation (anodic) and reduction (cathodic) peaks are symmetric;
• The potential of the reversible redox couple (E0) is centered between the anodic (Eap) and cathodic (Ecp) peaks: 𝐸0 =
𝐸𝑎𝑝+𝐸𝑐𝑝
2 ;
• The difference in potential between Eap and Ecp can be calculated from ∆𝐸 = 59
𝑛
⁄ 𝑚𝑉 at 25°C, where n is the number of electrons implied in the redox process;
• Peak current intensity (anodic iap o cathodic icp) can be calculated with the Randles-Sevcik equation: 𝐼𝑝 = (2,99 × 10⁵) × 𝑛 3 2 ⁄ × 𝐴 × 𝐶 × 𝐷1⁄2× 𝑣1⁄2 • Where:
42
• n is the number of electrons implied in the redox process; • A is the electrochemically active (cm2);
• C is the concentration of the electroactive analyte in solution (𝑚𝑜𝑙 𝐿⁄ );
• D is the diffusion coefficient for the electroactive analyte in solution (𝑐𝑚2⁄ ). 𝑠
Thus, the current measured with each cycle results linearly proportional to the analyte concentrations and increases with the square root of the scan rate.
The previous part is not applicable for irreversible redox systems or if there are other chemical reactions coupled to the redox process under examination.
In the case of irreversible processes, due for example to a slow electronic exchange, the anodic and cathodic peaks are much more separate than expected by the theory, which will further increase with the increase of the scan speed. Furthermore, the peaks are less evident and asymmetric.
In redox systems coupled with other chemical reactions, the voltammogram obtained will differ from that of a theoretical redox pair based on how much the coupled reaction subtracts one of the two members of the redox pair from the balance.
43 3.2.2. Chronoamperometry
Chronoamperometry is an analytical technique in which, after applying a fixed potential to the working electrode, the current going through it is measured. The potential applied to the working electrode must be chosen so that only the desired redox reaction happens. During the measurement, the solution must be maintained in constant stirring so that no thermal, concentration, or viscosity gradients may form. By adding aliquots of an analyte at known concentration, a graph similar to the one reported in Figure 3.6 will be obtained, in which each current intensity variation can be correlated with a concentration variation of the analyte.
Fig. 3.6 Chronoamperometry: Variations in the intensity of measured current corresponding to analyte
additions
It will then be possible to create a calibration curve (Fig. 3.7) for the analyte. The calibration curve can then be used to quantify the analyte in solutions of unknown concentration.
44 Fig. 3.7 Chronoamperometry: calibration curve
45 3.2.3. Electrochemically active area determination
The electrochemically active area is defined as the surface area of a working electrode able to perform the desired electrochemical reaction. It may differ from the geometrical area of the electrode depending on the modification and/or functionalization performed on the working electrode before the measure.
For all the electrochemically active area determination measures performed, a potassium ferricyanide solution 1 mM in KCl 0,1M was employed. These parameters were chosen because in these conditions the diffusion coefficient D (25 °C) is known. The electrochemically active area can be calculated using the Randles-Sevcik equation:
𝐼𝑝 = (2,99 × 10⁵) × 𝑛3⁄2× 𝐴 × 𝐶 × 𝐷1⁄2× 𝑣1⁄2.
By performing cyclic voltammetries with the same electrode at different scan speeds, using the potassium ferricyanide solution above mentioned, it is possible to calculate the peak current intensities for each scan rate.