UNIVERSITA' DI BOLOGNA
Corso di laurea magistrale in Biologia Marina
Feeding entrainment of locomotor activity and clock gene expression
in Senegalese sole, Solea senegalensis.
Tesi di laurea in
Adattamenti degli animali all’ambiente marino
Relatore
Presentata da
Prof. Elena Fabbri
Sara Frau
Correlatore
Dr.ssa Águeda Jimena Martín Robles
Correlatore
Prof. José Antonio Muñoz-Cueto
III Sessione
2 The sole
The fishes had for a long time been discontented because no order prevailed in their kingdom. None of them turned aside for the others, but all swam to the right or the left as they fancied, or darted between those who wanted to stay together, or got into their way; and a strong one gave a weak one a blow with its tail, which drove it away, or else swallowed it up without more ado. "How delightful it would be", said they, "if we had a king who enforced law and justice among us!" and they met together to choose for their ruler, the one who could cleave through the water most quickly, and give help to the weak ones. They placed themselves in rank and file by the shore, and the pike gave the signal with his tail, on which they all started. Like an arrow, the pike darted away, and with him the herring, the gudgeon, the perch, the carp, and all the rest of them. Even the sole swam with them, and hoped to reach the winning-place. All at once, the cry was heard: "The herring is first! The herring is first!" "Who is first?" screamed angrily the flat envious sole, who had been left far behind, "who is first?" "The herring! The herring", was the answer. "The naked herring?" cried the jealous creature, "the naked herring?" Since that time the sole's mouth has been at one side for a punishment.
La sogliola
I pesci erano da tempo infelici perché non c’era alcun ordine nel loro regno. Nessuno di loro si spostava per far passare gli altri, ma tutti nuotavano a destra o a sinistra, come volevano, o guizzavano tra quelli che volevano stare insieme, o andavano per la loro strada, quelli più forti davano colpi alla coda dei più deboli, li spingevano lontano senza troppi indugi. "Che bello sarebbe", dissero, "se avessimo un re che imponga diritti e giustizia fra noi!" così si incontrarono tutti insieme per scegliere il loro sovrano, colui che poteva fendere l'acqua più velocemente, e dare aiuto a quelli deboli. Si misero in gruppo sulla riva, e il luccio diede il segnale con la sua coda, da li cominciò tutto. Come una freccia, il luccio schizzò via, e con lui l' aringa, il ghiozzo, il pesce persico, la carpa, e tutti gli altri. Anche la sogliola nuotava con loro, e sperava di raggiungere la vincente-successivamente. Tutto a un tratto, si udì il grido: "L'aringa è prima! L'aringa è prima!" "Chi è la prima?" urlò con rabbia la sogliola invidiosa, che era stata lasciata molto indietro", chi è la prima?" "L'aringa! L'aringa," fu la risposta. "L' aringa nuda?" esclamò la creatura gelosa, "l'aringa nuda?" Da quel momento la bocca della sogliola è sempre stata da un unico lato per punizione.
El lenguado
Hacía tiempo que los peces estaban disgustados porque no había orden en su reino. Nadie contaba con los demás. Cada uno nadaba por su derecha o por su izquierda, según se le ocurría, separaba a los que querían permanecer juntos o les cortaba el paso, y el más fuerte golpeaba al más débil con la cola y lo mandaba lejos o se lo tragaba sin más
contemplaciones. "¡Qué hermoso sería si tuviéramos un rey que dictase leyes e impartiese justicia
elegir como rey al que atravesase más rápidamente tres corrientes para acudir en socorro de los débiles. Se colocaron en fila, pues, en la orilla, el esturión dio la señal de partida con su cola, y todos salieron nadando juntos. Como una flecha partió el esturión y, con él, el aren
nadaba el lenguado, con la esperanza de llegar a la meta. De repente se oyó una voz: arenque va adelante! "¿Quién está delante?
muy atrás, "¿quién está delante?" "El arenque, el
"¿el desnudo arenque?" Desde ese día, el lenguado, como castigo, tiene la boca torcida.
Figure 1
¡Qué hermoso sería si tuviéramos un rey que dictase leyes e impartiese justicia
elegir como rey al que atravesase más rápidamente tres corrientes para acudir en socorro de los débiles. Se colocaron pues, en la orilla, el esturión dio la señal de partida con su cola, y todos salieron nadando juntos. Como una flecha partió el esturión y, con él, el arenque, el gobio, la perca, la carpa y como quiera que se llamen todos.
la esperanza de llegar a la meta. De repente se oyó una voz: "¡El arenque va adelante! lante?" gritó malhumorado el tosco y envidioso lenguado, que se había qu El arenque, el arenque", fue la respuesta. "¿El desnudo arenque
Desde ese día, el lenguado, como castigo, tiene la boca torcida. Jacob and Wilhelm Grimm, Household Tales
Figure 1. The flatfish Solea Senegalensis.
3 ¡Qué hermoso sería si tuviéramos un rey que dictase leyes e impartiese justicia!" decían. Y acordaron elegir como rey al que atravesase más rápidamente tres corrientes para acudir en socorro de los débiles. Se colocaron pues, en la orilla, el esturión dio la señal de partida con su cola, y todos salieron nadando juntos. Como una y como quiera que se llamen todos. También ¡El arenque va adelante! ¡El gritó malhumorado el tosco y envidioso lenguado, que se había quedado ¿El desnudo arenque?" gritó el envidioso,
4
CONTENTS
1
GENERAL INTRODUCTION ... 61.1 Biological rhythms in living organisms: a historical overview ... 7
1.2 Types and properties of circadian rhythms ... 8
1.3 Circadian organization in vertebrates ... 10
1.4 Molecular bases of circadian rhythms ... 13
1.5 Feeding time as synchronizer... 16
1.6 The Senegalese sole: Biology and interest for Aquaculture and Chronobiology ... 19
2
OBJECTIVES ... 223
MATERIAL AND METHODS... 243.1 Animals and rearing system ... 25
3.2 Experimental design and sampling ... 25
3.3 RNA extraction ... 26
3.4 cDNA synthesis ... 27
3.5 Real Time quantitative PCR (RT-qPCR) expression analysis ... 27
3.6 Data analysis ... 28
4
RESULTS ... 304.1 Light and feeding entrainment of locomotor activity ... 31
4.2 Influence of light and feeding time on clock gene expression ... 32
4.2.1 Daily rhythms in diencephalon ... 33
4.2.2 Daily rhythms in optic tectum ... 36
4.2.3 Daily rhythms in liver ... 39
5
DISCUSSION ... 416
GENERAL CONCLUSIONS ... 487
BIBLIOGRAPHY ... 506
7
1.1 Biological rhythms in living organisms: a historical overview.
The term “Chronobiology” comes from the ancient Greek χρόνος (chrónos, meaning "time"), and biology, (the study, or science, of life). It is a field of biology that examines the timing of rhythmic phenomena in living organisms and their synchronization to geophysical cycles.
The first note about biological rhythms dates back to the 4th century BC, when Androstene, a ship captain in the service of Alexander the Great, described diurnal movements of the leaves of the Tamarindus indica (Bretzl, 1903). Much later, in 1729, Jean-Jacques d'Ortous de Mairan, a French astronomer, performed an experiment that demonstrated the existence of circadian rhythms in plants, specifically in Mimosa pudica. He was intrigued by the daily opening and closing of the heliotrope plant and performed a simple experiment where he exposed the plants to constant darkness and recorded the behaviour. De Mairan's conclusion was that the daily rhythmic opening and closing of the leaves persisted even in the absence of sunlight (Gardner et al., 2006) .
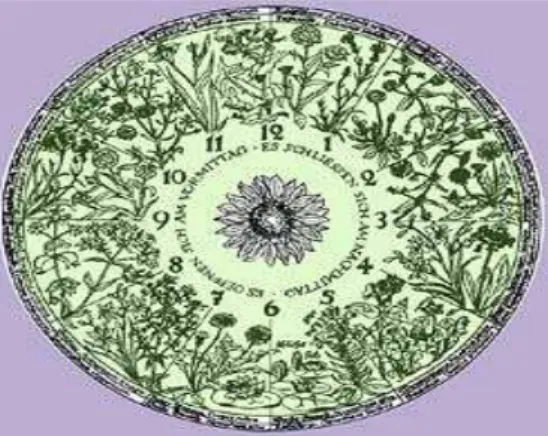
In 1751, a Swedish botanist and naturalist Carolus Linnaeus (Carl von Linné) designed an Horologium Florae (flower clock) using certain species of flowering plants. By arranging the selected species in a circular pattern, he designed a clock that indicated the time of the day when the flowers opened. (C. Linneus, 1751) (Figure 2).
Figure 2: Linneo flower clock. The time of the day can be calculated depending on the flowers that are opened or
closed in the field.
In 1832, Augustin Pyramus de Candolle studying Mimosa pudica noticed that plant leaf movements follow an almost 24-hour cycle in constant light, suggesting the existence of an internal biological clock (Robertson McClung, 2006). In 1929, Carl Von Frish demonstrated that bees have an internal clock with three different synchronization or timekeeping mechanisms.
In 1935, crossing experiments performed by Erwin Bünning with bean plants of different periodicity demonstrated that the next generation had periods of intermediate duration, supporting
8 the suggestion that circadian rhythms are heritable. He determined in plants the genetic origin of the "biological clock", a term he coined (Bünning Erwin, 1967).
In the 1950s, Colin Pittendrigh elaborated careful descriptions of the properties of circadian clock in Drosophila and other species, providing the first formal models of how circadian rhythms synchronize to local light-dark cycles (Pittendrigh C.S, 1960). His contributions to this field were so relevant that he is considered as the founder of modern Chronobiology. In 1960, Jürgen Ashoff focused on understanding the properties of circadian rhythms and how these rhythms can change in response to stimuli specifically in diurnal and nocturnal species (Ashoff J, 1960) In recent years, considerable efforts have been done to increase knowledge in this area of science.
Since the emergence of life on Earth, our planet has been subjected to daily and annual cycles of light and darkness, caused by the rotation of the Earth around its axis and around the sun. Therefore, this alternation of day and night has had deep influences in the life of the organisms from the earliest times. Evolution has favoured the development of internal mechanisms of measurement of time or biological clocks that may allow anticipation of these environmental cyclic changes, optimizing the biochemical and physiological processes. These internal cycles in living organisms are known as biological rhythms.
1.2 Types and properties of circadian rhythms
The most studied rhythm in Chronobiology is the circadian rhythm, a roughly 24-hour cycle shown by physiological processes in all living organisms. The term circadian comes from the Latin circa, meaning "around" and dies, "day", meaning "approximately a day” and it was coined by Franz Halberg. The circadian rhythm can further be broken down into routine cycles during the 24-hour day: diurnal, which describes organisms active during daytime; nocturnal, which describes organisms active in the night; crepuscular, which describes animals primarily active during the dawn and dusk hours. In the nature we know other cycles including: infradian rhythms, which have periods longer than a day (>28-hour), such as the annual migration or reproductive rhythms found in certain animals or the human menstrual cycle; and ultradian rhythms, which exhibit cycles shorter than 24 hours (<20-hour), such as the 90-minute REM cycle, or the 3-hour cycle of growth hormone production.
Circadian rhythms have some basic features: they are endogenous, so circadian rhythmicity persists in the absence of temporary environmental signals. Under these constant conditions, the rhythm enters in “free running”, whose period is approaching, but is not exactly
9 from 24 hours. Circadian rhythms are therefore genetically determined and not simple passive responses to environmental changes. There is an internal clock, an endogenous circadian pacemaker or oscillator, which is self-sustained. Under constant conditions, the periodicity of circadian rhythms in free course remains relatively invariable over a wide range of environmental temperatures, because the existence of compensatory mechanisms. A third characteristic property of circadian rhythms is their ability to be synchronized, or entrained, by external time cues, such as the light-dark cycle. Thus, although circadian rhythms can persist in the absence of external time cues, such cues are normally present and the rhythms are aligned to them. Accordingly, if a shift in external cues occurs, the rhythms will be readjusted to the new phase of the cues. This alignment is called “entrainment”. Therefore, a circadian rhythm can be defined as an oscillation of a biological parameter, dependent on a clock that is synchronized daily by environmental signals, and maintaining a period close to 24 hours in the absence of external stimuli.
These external stimuli able to entrain circadian rhythms are called zeitgebers, from a German word meaning “time givers”, and include environmental time cues such as sunlight, food, noise, or social interaction between others. Zeitgebers help to reset the biological clock to a 24-hour day. Because its stability in period and phase, the most consistent environmental signal is the 24 hours light-dark cycle. As a result, almost all circadian rhythms of the species studied up to date are synchronized in a daily manner by this cue. An environmental signal can be considered as a synchronizer if meets certain requirements (Moore-Ede et al., 1982):
• The biological rhythm must be in “free running” with a certain period before than the animal is exposed to the synchronizer and regain this period when the factor is eliminated. • Once the animal is exposed to the synchronizer, the period of the biological rhythm must be
coincident with the period of the zeitgeber. Thus, the endogenous circadian period is adjusted to the period of the environmental cycle.
• After each exposure to the synchronizer, a stable phase relationship between the endogenous rhythm and the synchronizer must be established and maintained.
• When the synchronizer is removed, the rhythm starts to "free run", from the phase determined by the environmental signal.
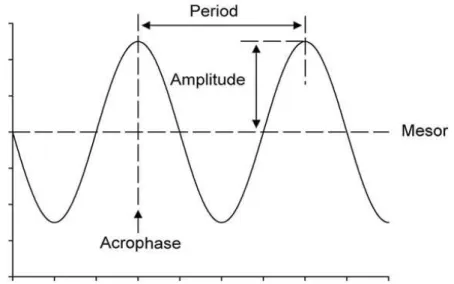
Circadian rhythms can be graphically represented in cronograms, where a sine wave can be fitted. Within each cycle, the phase is a particular value of the rhythm in the cycle and the time period at which the cycle peaks is called the acrophase. When the process is less active, the cycle is in its bathyphase or trough phase. The highest value of the rhythmic biological variable is the
10 peak or maximum and the lowest value is the nadir. The difference between the peak (or trough) and the mean value of a wave is measured by the amplitude and the period of the rhythm is the time between two points in the same phase (close to 24 h in the case of circadian rhythms).
Figure 3: Diagram of an oscillatory process characterized by its 4 parameters. Acrophase: the time at which the peak of a rhythm occurs; Amplitude: the difference between the peak and the mean value of a wave; Mesor: an estimate of central tendency of the distribution of values of an oscillating variable; Period: the time elapsed for one complete oscillation or cycle.
1.3 Circadian organization in vertebrates
In relation to the circadian rhythms and their properties, the circadian organization of an organism would involve the whole circadian system above the cellular level, its components and interactions between them. All circadian systems are composed of three basic elements, an oscillator or clock that generates and sustains the endogenous rhythmic oscillations, an input that allows the synchronization of the oscillator, and an output by which the pacemaker regulates many physiological and behavioural processes.
11
Figure 4: Conceptual model of a circadian system wich consist in three elements. The imput pathways, involved in the
entrainment of the central oscillator, which is the core of the circadian system. This molecular self-sustained oscillator controls the physiological processes of the organism by regulating output pathways.
Although there is a great complexity in the circadian organization of vertebrates, in most groups there is a "circadian axis" consisting of the retina, pineal gland and mammalian suprachiasmatic nucleus or analogous areas in other groups, together with the neural and humoral pathways that coupled these structures. The importance of each structure may vary depending on the species (Menaker, 2002).
In mammalian vertebrates, the central oscillator or the main circadian pacemaker is located in the suprachiasmatic nucleus of the hypothalamus (SCN), a pair of tiny structures that extend above the optic chiasm, on either side of the base of the third ventricle (Klein et al., 1991). It represents the primary center for the regulation of circadian rhythms. The cell bodies of neurons of the SCN are small, densely packed and they have simple dendritic trees. Lesions in this brain structure cause loss of locomotor activity rhythms and liquid intake (Stephan and Zucker, 1972). The integrity of these nuclei being essential for sleep-wake cycles, hormonal rhythms and feeding rhythms (Moore and Eichler, 1972; Moore and Klein, 1974). In addition, transplantation of SCN cells in the region of the third ventricle in animals in which this structure had been previously removed, allowed restoring rhythmicity in individuals implanted, which acquire the rhythm and the characteristic period of the donor (Ralph et al., 1990; Sawaki et al., 1984). Studies of glucose metabolism demonstrated that the SCN is metabolically active during the light period and relatively inactive during the dark phase (Schwartz et al., 1980; Schwartz and Gainer, 1977).Taken together, all these evidences have reinforced the consideration of the suprachiasmatic nucleus as the
anatomical clock structure responsible for most of the rhythms.
Figure 5: This figure illustrates the via
central pacemaker is located in mammals from the neural route used for vision.
The main synchronizer of this oscillator Entrainable Oscillator). The SCN
through a pathway that differs from the neural route used for vision innervates the circadian pacemaker
as retino-hypothalamic tract. The main mediate in the transmission of photic neurons receiving light information
is transmitted to the whole SCN, reaching the rest of nervous system) and hormonal
synchronize physiological and behavioural
structure responsible for most of the physiological and
from the retinohypothalamic tract to the suprachiasmatic mammals. The SCN receives the retina’s light information through a
of this oscillator is light, and, hence, it is
SCN receives the light information captured exclusively by the pathway that differs from the neural route used for vision. This
pacemaker originates from a subpopulation of ganglion
. The main neurotransmitters used to synchronize the clock photic information to the SCN are glutamate
information are located in its ventral region. From these neurons, the signal SCN, reaching the rest of the body throughout
and hormonal (rhythms of melatonin and corticosterone behavioural processes to the light-dark cycle.
12 and behavioural circadian
suprachiasmatic nucleus, where the through a pathway different
is called LEO (Light captured exclusively by the retina retinal projection that subpopulation of ganglion cells and is known to synchronize the clock and to glutamate and PACAP. SCN . From these neurons, the signal the body throughout neural (autonomic and corticosterone) pathways, which
1.4 Molecular bases of circadian rhythms
The generation and maintenance complex interactions between genesact as transcription factors, and regulate their
These clock proteins establish between them autoregulatory feedback loops supported by both post transcriptional and post-translatio
rhythms (Bell-Pedersent et al., 2005; Reppert and Weaver
rhythmic and self-sustained expression of clock genes occurs with a period of about 24 hours
Figure 6: The model of the core molecular mechanism of mammalian circadian rhythmicity. It is an autoregulatory
feedback loop in which the transcription factor formed by heterodimerization of CLOCK and BMAL1 proteins, activates transcription of Period and
CLOCK:BMAL1 transcription.
The first clock gene isolated and characterized in animals was the gene Drosophila (Bargiello et al., 1984; Reddy et al
domain (Period-Arnt-singleminded
(Huang et al., 1993). Furthermore, it showed that the transcription of product the PERIOD (PER) protein,
the first loop of self or negative feedback in the circadian clock and defining
repressor (Hardin et al., 1992; Zeng et al, 1994). They have identified six key genes that contribute to the regulation of the central clock in
1.4 Molecular bases of circadian rhythms
and maintenance of circadian rhythmicity in oscillators genes that have been called clock genes. They
factors, and regulate their own expression and that of abundant genes from cells. These clock proteins establish between them autoregulatory feedback loops supported by both post
translational modifications that constitute the molecular basis of circadian Pedersent et al., 2005; Reppert and Weaver, 2002). As a result of this mechanism,
sustained expression of clock genes occurs with a period of about 24 hours
The model of the core molecular mechanism of mammalian circadian rhythmicity. It is an autoregulatory transcription factor formed by heterodimerization of CLOCK and BMAL1 proteins,
and Cryptochrome genes. This transcripts formed
The first clock gene isolated and characterized in animals was the gene
, 1984; Reddy et al., 1984.). Its sequence contained a region called PAS singleminded) that was important to mediate protein
Furthermore, it showed that the transcription of Per wa
protein, and that was induced when its levels were reduced, the first loop of self or negative feedback in the circadian clock and defining Per
, 1992; Zeng et al, 1994). They have identified six key genes that contribute to the regulation of the central clock in Drosophila and that codify transcription negative or positive 13 oscillators is achieved by They encode proteins that abundant genes from cells. These clock proteins establish between them autoregulatory feedback loops supported by both
post-nal modifications that constitute the molecular basis of circadian As a result of this mechanism, sustained expression of clock genes occurs with a period of about 24 hours.
The model of the core molecular mechanism of mammalian circadian rhythmicity. It is an autoregulatory transcription factor formed by heterodimerization of CLOCK and BMAL1 proteins, genes. This transcripts formed complexes to inhibit
The first clock gene isolated and characterized in animals was the gene Period (Per) in sequence contained a region called PAS ) that was important to mediate protein-protein interaction was inhibited by its own when its levels were reduced, identifying Per as a transcriptional , 1992; Zeng et al, 1994). They have identified six key genes that contribute and that codify transcription negative or positive
14 factors (Hardin, 2005; Stanewsky, 2003). The transcriptional activators are Clock (Clk), Cycle (Cyc) and Par domain protein 1ε (Pdp1ε) and the transcriptional repressors besides a Per has been identified Timeless (Tim) and Vrille (Vri). These genes and their products are organized into two intracellular interconnected feedback loops, a central loop directed by Per/Tim and a stabilizer loop directed by Clock. In the loop Per/Tim, the heterodimer formed by CLK/CYC binds to specific sequences E -box (Enhancer Box CACGTG) located in the promoters of Per and Tim, activating transcription. The PER and TIM proteins are accumulated in the cytoplasm and then translocated to inhibit the expression of Clk and Cyc. This loop is reinforced by Clk loop in which the heterodimer CLK/CYC directly activate Vri and Pdp1ε transcription and both modulate the rhythmic expression of Clk , again by binding to E -box elements in the promoter. Levels of mRNA and clock proteins are not reached in the same time of day. For example, mRNA levels maximum of Per and Tim are observed at the beginning of the night, while his PER and TIM proteins do not reach high levels until 6 h after. Clk loop, in turn, controls the transcription of the gene Cryptochrome (Cry), which is activated by Pdp1ε. And this component is considered as a circadian photopigment in Drosophila (Emery et al., 1998, 2000; Stanewsky et al., 1998).
Many components of the circadian oscillator in Drosophila have orthologs or functional equivalents in mammals. The first clock gene that was isolated and characterized in vertebrates was called Clock (King et al., 1997; Reppert and Weaver, 1997). Clock cloning revealed that it was a transcription factor that encoded a protein (CLOCK) containing in their structure a PAS domain, and bHLH domain (bHLH-PAS family), and a terminal carboxyl rich in glutamine that corresponded to the transactivation domain (King et al., 1997; Reppert and Weaver, 1997). CLOCK showed that formed a heterodimer with other protein called Bmal1, also essential for the regulation of the clock system (Bunger et al., 2000; Gekakis et al., 1998). Both genes are expressed at high levels in the suprachiasmatic nucleus but they were also present in many other organs. Both regulatory proteins bind to E-box sequences present in the promoters of the Period genes, activating their transcription. They have been identified in mammals three genes of this family: Per1, Per2 and Per3. Two of this, Per1 and Per2, are induced by light in the suprachiasmatic nucleus, unlike Per3 (Albrecht et al., 1997; Shearman et al., 1997; Takumi et al., 1998a, 1998b; Zylka et al., 1998). Then, another two genes were identified: Cryptochrome1 and Cryptochrome2 (Cry1 and Cry2). Research on mice have shown that CRY1/CRY2 had a central role in the mammalian circadian clock, being part of the oscillator mechanism but they do not have functions as circadian photoreceptor. In fact, the circadian photoreceptor in mammals is the photopigment melanopsin. (Lucas et al., 2003; Semo et al., 2003), which is expressed in the ganglion cells of the retina, the only light input pathway in these animals (Griffin et al., 1999; Kume et al., 1999; Okamura et al.,
15 1999). The PER1, PER2, PER3, CRY1 and CRY2 proteins represent the negative elements of the feedback loop and act as inhibitors of transcription factors mediated by CLOCK/BMAL1. But in mammals the central repressor is Cry instead of Per in Drosophila. The mammalian circadian system includes all the organs, tissues and cells of the body. It is organized hierarchically, so the core suprachiasmatic nucleus is considered the central pacemaker. This central pacemaker receives light information only from the retina in mammals and through multiple routes establishes a body coordination and synchronization of all the cellular clocks with each other and with the daily cycle of 24 h. These routes include neural connections, endocrine signals, body temperature, rhythms and
indirect signals caused by a rhythmic behaviour (Dibner et al., 2010; Welsh et al., 2010). The circadian system of fish is composed of neuronal and peripheral pacemaker. It shares
many elements with the basic mammals system but their organization differs significantly. The retina and the pineal gland have been described as pacemaker of neural origin, but a central pacemaker hasn’t yet found in fish. Both retina and pineal gland are photoreceptor structure in fish and maintain an endogenous melatonin secretion rhythm, whereas in mammals the pineal gland has no direct photoreceptor function and is the SCN which indirectly controls the production of this neurohormone (Cahill, 1996; Falcón, 1999). The classical model used for the study of these
mechanisms and has laid the foundation has been in the teleost fish Danio rerio or zebrafish. Most of the clock genes known in zebrafish has been cloned by homology to Drosophila or mouse.
The situation today is quite complex, currently have been identified in D. rerio 3 Clock genes: Clock1a, Clock1b and Clock2; 3 genes Bmal: Bmal1a, Bmal1b and Bmal2; 4 genes Period: Per1a;
Per1b, Per2 and Per3, and 6 Cryptochromes: Cry1a, Cry1b, Cry2a; Cry2b, Cry3, Cry4. The first clock gene that was characterized in fish was Clock (later called Clock1a). Zebrafish
CLOCK protein contained in its structure both bHLH (basic Helix Loop Helix) and PAS binding domains to dimerize with BMAL (Brain and muscle ARNT-like protein). As in mammals, CLOCK-BMAL heterodimers would act as positive regulators of transcription through their binding to E-box regulatory sequences present in the promoter regions of Period and Cryptochromes genes.
The four Period and six Cryptochromes genes constitute the main negative elements of the circadian oscillator in fish (Delaunay et al., 2000, 2003; Kobayashi et al., 2000; Pando et al., 2001;Vallone et al.,2004: Wang et al., 2008a). In zebrafish (Danio rerio), Per1 and Per3 anticipate the light onset and provide endogenous rhythmicity, while Per2 is light-dependent, suggesting that this gene is one of the elements involved in the mechanisms of clock synchronization by light (Zhuang et al., 2000). Cry genes inhibit transcription activated by CLOCK-BMAL heterodimers, but with some particularities. Only the mammalian Cry sequences are able to inhibit transcription
16 activated by CLOCK-BMAL (Cermakian et al., Kobayashi et al., 2000). In cell lines, only Cry1a shows a light-directed expression profile, while the rest are endogenously-regulated genes. In fact, together with Per2, the light-induced expression of Cry1a represents one of the critical mechanisms underlying the synchronization by light and maintaining the amplitude of the rhythms (Tamai et al., 2007). The presence of two classes or groups of genes that are similar to mammalian and to Drosophila Crys, suggests that the central mechanism of oscillation in zebrafish shares characteristics of both circadian systems. The understanding of the molecular and cellular organization of the circadian timing system has increased considerably over the past decade. The model organisms commonly used to decipher the molecular basis of circadian rhythms have been insects such as Drosophila melanogaster and mammals such as the mouse and hamster (Mus musculus and Mesocricetus auratus). Recently, the zebrafish has emerged as a useful model to study key aspects in the circadian system of vertebrates (Idda et al., 2012; Vatine et al., 2011). Currently, many other species have been added to this list, including teleost fish such as the goldfish (Carassius auratus), the rainbow trout (Oncorhynchus mykiss), the Atlantic salmon (Salmo salar), the European sea bass (Dicentrarchus labrax), medaka (Oryzias latipes), the gilthead sea bream (Sparus aurata), the Senegalese sole (Solea senegalensis) and some reef fishes (Siganus guttatus and Halichoeres trimaculatus) (Davie et al., 2009, 2011; Del Pozo et al., 2012; Hur et al., 2012; Martín-Robles et al., 2011, 2012b; Park et al., 2007; Patiño et al., 2011; Sánchez et al., 2010; Velarde et al., 2009; Vera et al., 2013). In fact, fish have been proven to be valuable complementary models to study clock biology since they present a specific flexibility in their clock function (Idda et al., 2012).
1.5 Feeding time as synchronizer
As mentioned before, one of the main synchronizers of circadian rhythms is light. But there are other cues that can synchronize physiological rhythms, and one of the most important is feeding time (Sakamoto et al.,1998; Yoo et al., 2004). In mammals specific studies have suggested that the circadian rhythm of feeding is controlled by an additional endogenous circadian system that does not include the SCN. Under experimental conditions, when access to food is limited to a certain time of day, so when we impose restricted hours of feeding, the animals alter their physiological and behavioural rhythms to adapt them to the availability of food, being a powerful synchronizer. Several days after having set the time of feeding, they develop some kind of anticipatory activity to food delivery. This activity is called FAA (Food Anticipatory Activity), and includes an increase in locomotor activity, in body temperature, in the secretion of corticosterone and changes in several
17 metabolic parameters (Mistlberger, 1994). The persistence of this behaviour in animals in which the SCN has been eliminated and, therefore, have lost the day-night rhythmicity, has led the researchers to suggest the existence of an endogenous system synchronized by food, independent from the hypothalamic SCN, and called FEO (Food Entrainable Oscillator) (Stephan et al., 2002). The FEO exhibits a clear circadian pattern, and one of its most important characteristics is that the output signal (FAA) persists in free running in the absence of its synchronizer (food) (Mistlberger, 1994; Stephan, 1989; Stephan et al., 1979a, 1979b) . However, the anatomical substrate for the FEO is still unknown. Damage to certain brain nuclei, like the dorsomedial hypothalamus, (DMH) may reduce some of the components of the food anticipatory activity, but not all. Also, the circadian oscillations of clock genes in some brain areas outside the suprachiasmatic nucleus are synchronized by feeding regimes (Angeles-Castellanos et al., 2007; Feillet et al., 2008; Verwey et al., 2007; Wkamatzu et al., 2011). Therefore, it has been proposed that the FEO is not located in a particular region of the brain but it is widely distributed throughout the organism. Thus, FEO appears represented by a network of scattered brain structures connected with peripheral organs involved in the metabolism of food. Furthermore, by using restricted feeding programs it has been shown that feeding is the dominant synchronizer for many, if not all, peripheral organs. When animals are forced to eat during its inactivity period, an uncoupling of peripheral tissues from the central pacemaker is produced, and feeding time entrains the expression of clock genes in these tissues. In mammalian nocturnal species fed during daytime, the expression phases in organs such as liver, kidney, pancreas or heart are inverted in relation to the SCN. These changes are induced faster in the liver than in other peripheral organs, being one of the most studied tissues in mammals (Damiola et al., 2000; Hara et al., 2001; Stokkan et al., 2001). Metabolic pathways through which feeding time entrains peripheral tissues include hormonal secretion, feeding-related metabolites, changes in body temperature and changes in the intracellular redox state (Dibner et al., 2010; Konturek et al., 2004). Therefore, the SCN clock is mainly synchronized by light, while feeding time appears the dominant zeitgeber for peripheral tissues, being less relevant for the SCN phase. At the molecular level, recent studies in fish have shown that feeding is a powerful synchronizer of clock gene expression in peripheral tissues and in certain neural areas, especially in the absence of photic signals (Feliciano et al., 2011). These results suggested that, as in mammals, development of FAA is more dependent on brain areas than on peripheral tissues.
In addition to synchronization by light, fish represent an excellent model to study the synchronization by feeding time. The great plasticity of fish circadian system, allow them to synchronize with very different feeding regimes. An additional advantage of fish is that they have a higher tolerance to longer periods of fasting than mammals. The existence of a variety of feeding
18 rhythms has been documented in many species. Furthermore, these rhythms are endogenous, and they are sustained by the existence of a pacemaker or internal clock (López-Olmeda and Sánchez-Vázquez, 2010; Madrid et al., 2001). The development of food anticipatory activity (FAA) that is synchronized with the feeding regimes in the absence of other external signals (light-dark cycles) and its persistence in free run under fasting conditions suggested the existence of an oscillator synchronized by feeding (FEO) (Aranda et al., 2001; Herrero et al., 2005; Reebs and Lague 2000; Sánchez and Vázquez, 2009; Vera et al., 2007b; Vázquez et al., 1997; Sánchez-Vázquez et al., 2001). As occurs in mammals, when synchronizers are conflicting (diurnal species fed at night or vice versa), the locomotor activity rhythms are decoupled into two components, possibly one regulated by LEO and the other by the FEO. It is unclear whether LEO and FEO are independent or not in fish, although some evidences suggest that both systems are strongly connected, at least in some species (López-Olmeda et al., 2009, 2010; Sánchez-Vázquez et al., 1995, 1997).At the molecular level ecent studies have been suggested that the optic tectum and hypothalamus could be a part of the network of FEO in fish, or at least receive inputs from this oscillator (Feliciano et al., 2011). In addition, these authors have demonstrated that the fish liver is an organ with a great ability to be synchronized by feeding, regardless of the light-dark cycle (Feliciano et al., 2011; Velarde et al., 2009, 2010). This organ exhibited a high amplitude rhythmic expression of the main clock genes, which could be entrained by the last meal (Feliciano et al., 2011; Velarde et al., 2009, 2010). Although animals fed randomly once a day do not develop FAA, the expression of clock genes in the liver is significantly rhythmic, suggesting that hepatic oscillator is not responsible of this behaviour. Scheduled feeding can shift the phase of the daily rhythms of clock gene expression in the peripheral organ without changing the phase of these rhythms in brain, suggesting uncoupling of the light entrainable oscillator (LEO) from the food entrainable oscillator (Vera et al., 2013). Interestingly, fish species that have evolved in total darkness exhibit circadian clocks unable to synchronize by light whereas they maintain synchronization by feeding (Cavallari et al., 2011). Thus, it is possible that two oscillators or a network of different oscillators also exist in fish (LEO and FEO), but the connections between them as well as their molecular bases are still unknown.
It is interesting to note that some studies have demonstrated the ability of some fish to feed itself through the use of specific tools. Self-feeding systems with a photosensor have recently been used in some species: Plecoglossus altivelis altivelis (Amano et al., 2007), Danio Rerio (Del Pozo et al., 2011) and Solea senegalensis (Boluda-Navarro et al., 2009). For example, Solea senegalensis is able to use self-feeders operated by rod, string or optical sensor. The ability of self-feeding was tested in Senegalese sole under two conditions: outdoor conditions (farmer) and indoor conditions
19 (validation of three types of food demand sensor). Solea senegalensis stocked at high densities under farming conditions learned to operate the ST (string sensor) from the first day, showing a strong compensatory feeding behaviour when the reward level was modified, and the nocturnal feeding behaviour was maintained independently of the experimental conditions (Boluda-Navarro et al., 2009). In zebrafish, a self-feeding system has also been built that is triggered by an infrared sensor suitable for small-size fish, such as Danio Rerio (Del Pozo et al., 2011).
1.6 The Senegalese sole: Biology and interest for Aquaculture and Chronobiology
The Senegalese sole, Solea senegalensis, is a marine teleost fish belonging to the Class Actinopterygii, Order Pleuronectiformes, and Family Soleidae.The Soleidae family consist of 22 genera and 89 species inhabiting brackish, marine and fresh waters. They are benthic, and are characterized by its oval-shaped, flattened body,unique among fish because its corporal asymmetry. They are strongly compressed, with both eyes on the same side of the head in adults, being the ocular side slightly rounded and pigmented, while the blind side is white and totally flat. They usually mimic their background by assuming a similar coloration than the bottom. The eyes are small and can protrude above the surface of the body, so the animal can see even buried in the substrate. They normally lie on the bottom, generally covered by sand or mud. This tendency to burrow into the sand, which permits them to avoid a possible aggression, represents an innate instinct of soles that does not disappear even if the individuals are kept in captivity. The eggs are pelagic, non-adhesive and do not require parental care. The larvae are symmetrical and drift with currents (planktonic) until metamorphosis, which takes place between days 12 and 19 after hatching. During this process, they settle to the bottom and there is a migration of one eye to the other side of the body, so juveniles became asymmetrical and benthic (Bao et al., 2011). Some species of this family such as the Senegalese sole are considered of high economic value. This species inhabits mobile sand or muddy bottoms, around 100 m of depth, mainly in coastal areas, ,but they can also be found in salt or brackish lagoons connected to the sea, rivers and estuaries. They are located in subtropical climates, between 14°N-47°N and 1°W-19°W. The coasts of Senegal are the southern boundary in the Atlantic, the Canarian Islands represent the western limit and the shores of Brittany constitute the limit in the north. Its geographical distribution in the Mediterranean is fairly broad, covering the south and east of the Iberian Peninsula, the north of Africa and Middle East until the coast of Turkey (Figure 7). It is an euryhaline and eurythermal species so it can be perfectly adapted to changes in temperature and salinity (Arjona et al., 2007, 2010).They are predators principally of benthic invertebrates such as
20 polychaeta larvae, bivalve molluscs and small crustaceans. They are basically nocturnal, living hidden in the sand during the day.
From a reproductive point of view, the Senegalese sole is a gonochoristic species with separate sex and without apparent sexual dimorphism. Sex differences are only evident during the spawning season, when marked dimorphism in sex behaviour has been observed (Carazo et al., 2011). The first sexual maturity is reached between the second and third year of life in the case of males (first spermiation), and between the second and fourth year of life in the case of females (first oviposition), when the size reaches 30 cm (Dinis et al., 1999). They have an asynchronic ovarian development, showing oocytes in different stages of development (García-López et al., 2006, 2007). They have an extended breeding season, which generally occurs in spring and autumn, with peaks in May and, to a lesser extent in October (Anguis and Cañavate., 2005; Oliveira et al., 2009). Larval development is fast and highly influenced by environmental cues as temperature and light (Blanco-Vives et al., 2011; Parra and Yúfera, 2001). The metamorphosis represents a dramatic transition in its life cycle, which involves processes of tissue differentiation, recalibration of vision, biochemical, physiological, neuranatomical, behavioural and feeding changes (Rodríguez-Gómez et al., 2000; Blanco-Vives et al., 2012; Padrós et al., 2011; Schreiber, 2006).
From a commercial perspective, aquaculture has become an industry of significant importance for the economy of the Iberian Peninsula, and the Senegalese sole has been gradually incorporated to this sector. However, problems related to reproduction, growth and survival during the juvenile phases are delaying the consolidation of this species for Spanish aquaculture industry (Imsland et al., 2003). Many of the problems in the aquaculture of new species seem to be related with the extrapolation of culture protocols of well-known species such as the sea bream or the sea bass (photoperiod, temperature and feeding conditions) without previous knowledge of the specific requirements of each species. Therefore, species-specific studies are required to incorporate with success these new species to the aquaculture practice.
The Senegalese sole is also acquiring an important relevance in chronobiological studies as the number of published works focused on the sole circadian system has increased in the last few years especially focused on rhythms of locomotor activity, feeding, melatonin, sex steroids in relation to temperature and photoperiod (Anguis and Cañavate, 2005; Bayarry et al.,2004; Boluda-Navarro et al.,2009; García-López et al.,2007; Guzmán et al., 2008; Oliveira et al., 2009). The molecular mechanisms underlying sole circadian rhythms has also been explored recently, both in adults and developing sole (Martín-Robles et al., 2011, 2012a, 2012b).
Moreover, the consideration of the Pleuronectiformes Order as one of the most evolved teleost groups make the Senegalese sole a species of high interest under a comparative and
21 phylogenetic point of view. All these facts have reinforced the election of Senegalese sole as model species for the present study.
22
23
The general objective of this study was to investigate how feeding time affects the daily rhythms of locomotor activity and clock gene expression in central (diencephalon and optic tectum) and peripheral (liver) tissues in the flatfish Solea senegalensis.
To reach this general objective, the following specific objectives have been proposed:
• To acquire experience and skills in Solea senegalensis aquaculture practices: installation of tanks, water circuit, feeding and sampling.
• To set-up photoperiod control systems, locomotor activity recording dispositives and software to analyze Senegalese sole behaviour.
• To gain skills on molecular biology techniques such as RNA extraction, cDNA synthesis and real time quantitative PCR that facilitate subsequent activities.
• To analyze the daily locomotor activity of Senegalese sole in relation to the light-dark cycles and feeding regimes (diurnal vs nocturnal and random feeding) and construct the representative actograms.
• To use the molecular tools previously developed in the laboratory, to determine the daily expression profile of the clock genes Per1, Per2 and Clock in central (diencephalon and optic tectum) and peripheral (liver) tissues in this species maintained under light-dark conditions and different feeding schedules (diurnal vs nocturnal and random feeding).
24
25
3.1 Animals and rearing system
A total of 108 adult specimens of Solea senegalensis from 101 to 172 g in body weight and from 20 to 25 cm in length were used in the present study. They were collected from the “Laboratorio de Cultivos Marinos” (University of Cádiz, Puerto Real, Spain) and maintained in
250-L tanks with continuous seawater renovation and gentle aeration, at a constant temperature and salinity of 19±1°C and 39 ppt, respectivelly. Each tank was equipped with a lid containing two fluorescent lamps (Sylvania Gro-Lux, Germany) connected to an individual automatic photoperiod control system. The photoperiod was set at 12 h light:12 h dark (12L:12D) with lights on at 08:00 h local time, (Zeitgeber time 0 or ZT0). The light intensity at the water surface was 400 lux during the illumination period. Fish were fed with commercial 3-mm dry pellets (Skretting S.A., Burgos, España) at a daily ration of 0.3% body weight. This study was approved by the Animal Experimentation and Ethics Committee of the University of Cádiz (Spain) and was conducted according to international ethical standards.
3.2
Experimental design and sampling
The experiment was conducted to investigate the influence of restricted food access on Senegalese sole behaviour and daily expression of clock genes in central (diencephalon and optic tectum) and peripheral (liver) tissues. The animals were kept under 12L:12D photoperiod conditions and divided into three experimental groups depending on the feeding time: fed at midlight, i.e. middle of the light phase (ML), middark (MD), or at random (RND) times. The food was distributed by means of automatic feeders (EHEIM GmbH & co. KG, Germany) coupled to digital programmable timers (Data micro, Orbis, Spain). For ML and MD groups, the feeder was programmed to deliver food everyday at the same time 14:00 h (ZT6) and 02:00 h (ZT18), respectively. For the RND group, feeding time was chosen randomly. The feeding interval was set between 12 and 36 h, so they received the same amount of food per 24 h, as the ML and MD groups. After four weeks under these different feeding regimes, the animals were anaesthetized in MS-222 (Sigma, St Louis, MO; 100-200 mg/l of water) and sacrificed by decapitation every 4 h at six different zeitgeber time points (n=4 at each point): ZT0, ZT4, ZT8, ZT12, ZT16 and ZT20 during a 24 h daily cycle, in which ZT 0 corresponded to the light onset and ZT12 to the light offset. The selected neural (dienchepalon and optic tectum) and peripheral (liver) tissues were removed. Samples were rapidly frozen in liquid nitrogen and stored at -80° C until used.
26
Throughout the experiment, the existence of a daily activity rhythm and its synchronization to the light-dark and feeding cycles was checked. To this end, locomotor activity was registered by means of two infrared photocells (model 3S-AD62, Omron, Japan)placed in a pvc tube submerged in each tank near the corner were food was provided. One photocell was placed 10 cm below the water surface (upper photocell) and the other one was located 10 cm above the bottom of the tank (bottom photocell). The photocells were connected to a computer so that every time a fish interrupted the infrared light beam, it produced an output signal that was recorded. The number of light beam interruptions was stored every 10 min by specialized software for data acquisition.
3.3 RNA Extraction
Total RNA was extracted using the TRIsure Reagent® (Bioline, London, UK). Tissues were homogenized (50-100 mg) in 1 ml of reagent. using 3-4 stainless steel beads (2 mm diameter) in a mixer mill MM400 (Retsch, Haan, Germany). After homogenization, 0.2 ml of chloroform (AppliChem, Darmstadt, Germany) D was added and samples were vigorously shacked by hand for 15 seconds, then incubated at room temperature for 2 to 3 minutes and centrifuged at 12,000 x g for 15 minutes at 4°C. Following centrifugation, the mixture was separated into lower pale green, phenol-chloroform phase, an interphase, and a colourless upper aqueous phase containing RNA. The aqueous phase was transferred into a fresh tube and RNA was precipitated by mixing with 0.5 ml of isopropyl alcohol (Panreac, Barcelona, Spain). Samples were incubated at room temperature for 10 minutes and centrifuged at 12,000 x g for 10 minutes at 4°C. The RNA precipitated, often invisible before centrifugation, formed a gel-like pellet on the side and bottom of the tube. The supernatant was completely removed and the RNA pellet was washed once with at least 1 ml 75% ethanol prepared with diethylpyrocarbonate (DEPC)-treated water (Sigma-Aldrich, St. Louis, MO, USA). Samples were centrifuged at 7,500 x g for 5 minutes at 4°C and ethanol was removed. The RNA pellet was air-dried for 5-10 minutes and re-dissolved in DEPC-treated water (from 15 to 50
μl) and incubated for 10 minutes at 55-60ºC in a water bath. Total RNA yield and quality were determined by the 260/280 nm absorbance ratio in a NanoDrop 2000 Spectrophotometer (Thermo Fisher Scientific, Wilmington, De, USA). All ratios were between 1.8 and 2.
27
3.4 cDNA synthesis
Aliquots of 100 ng of total RNA were reverse transcribed into cDNA (20 µl final volume) using the QuantiTect Reverse Transcription Kit (Qiagen, Inc, USA). The procedure consisted in 2 main steps:
1. Elimination of genomic DNA:
The purified RNA samples were incubated in gDNA Wipeout Buffer containing DNAse at 42°C for 2 minutes to effectively remove contaminating genomic DNA. Then the RNA samples were directly used in the next step of reverse transcription.
2. Reverse transcription:
After genomic DNA elimination, the RNA samples were ready for reverse transcription using the QuantiTect Reverse Transcription Kit (Qiagen, Inc, USA) containing a master mix prepared from Quantiscript Reverse Transcriptase, Quantiscript RT Buffer, and RT Primer Mix. The entire reaction took place at 42°C during 30 minutes followed by 2 min at 95°C for inactivation. Then cDNAs were stored at -20°C until used.
3.5 Real Time quantitative PCR (RT-qPCR) expression analysis
Real time quantitative PCR (RT-qPCR) was performed in a Bio-Rad CFX96 Touch detection system using the SensiFAST SYBR No-ROX Kit (Bioline Ltd, UK). PCR reactions were developed in a 20 µl volume containing 5 ng of cDNA. Specific primers for sole Per1, Per2, and Clock (GenBank accession numbers FM180505, FM200425 and FM179317) were selected according to Martin-Robles et al.,(2012). The amplification protocol for the three genes was as follow (Figure 9):
1. Initial denaturation at 95ºC for 2:00.
2. 40 cycles of 95ºC for 0:05 and 58.3ºC for 0:30.
3. Melting curve from 70ºC to 95ºC, with an increment of 0.5ºC.
Melting curves were generated for each sample to confirm that a single product was amplified. Non-template controls were used as negative controls. The relative expression of all genes was calculated using the ΔΔCt method (Livak and Schmittgen, 2001) with Solea senegalensis
β-actin2 (Genbank accession number DQ485686) as housekeeping gene (Infante et al., 2008;
28
Figure 8: qPCR amplification protocol (Bio-Rad CFX software screen) for the clock genes Per1, Per2 and Clock of Solea senegalensis in according with Martín-Robles et al., (2012b).
3.6
Data Analysis
Statistical analysis:Statistical variation in clock genes mRNA levels among different daily time points was analyzed by one-way ANOVA followed by Tukey's post hoc comparisons test. When necessary, values were transformed to get normal distribution and homogeneity of variances. In all cases, statistical significance was accepted at p<0.05. All statistical tests were performed using the Statgraphics Plus 5.1 software (Statpoint Technologies, Warrenton, VA, USA). Data are presented as mean ± standard error of the mean (SEM). All graphics were created by means of Microsoft Office Excel 2007
Rhythm analysis:
Analysis of fish locomotor activity records, representation of actograms and Cosinor analysis were carried out using the chronobiology software “El Temps” (version 1.266; Prof. Díez-Noguera, University of Barcelona; www.el-temps.com). The Cosinor method is based on the least squares approximation of time series data with a cosine function of known period and was performed to determine whether the daily expression of the studied genes showed a regular fluctuation over a defined period (24 h in the case of circadian rhythms). Cosinor analysis also provides the statistical significance of the rhythm through an F-test of the variance accounted for by the waveform versus a straight line of zero-amplitude (null hypothesis). Therefore, if under a statistical significance of p<0.05 the null hypothesis was rejected, the amplitude could be
29
considered as differing from 0, thereby constituting evidence for the existence of a statistically significant rhythm of the given period under consideration.
30
31
4.1
Light and feeding entrainment of locomotor activity
During the experiment, all groups showed a clearly marked nocturnal activity pattern. The actograms that result from upper and bottom photocells in animals fed at ZT18 (MD group) showed a nocturnal rhythm, with an intense locomotor activity extended throughout the dark phase of the photocycle (Figure 9, middle panel). However, animals fed at ZT6 (ML group), showed a bimodal pattern of locomotor activity (Figure 9, upper panel). On one hand, sustained activity levels were found during the night, as for MD group. In addition, an increase in locomotor activity was also observed several hours before mealtime, during the light phase (food anticipatory activity or FAA), followed by a decrease after feeding (Figure 9, upper panel). The Senegalese sole randomly fed (RND group) synchronized locomotor activity to the photoperiod, showing a clear nocturnal rhythm (Figure 9, bottom panel). In contrast to the ML group, only a residual activity was observed during the light phase (Figure 9, bottom panel).
32
Figure 9: Representative actograms of Senegalese sole. The upper panel with two actograms represent the ML group,
the middle panel the MD group and the bottom panel the random group. In addition, the actograms on the left side represent the photocells in the bottom position and the actograms on the right side represent the photocells positioned at the top of the tank. Actograms are double-plotted (time scale 48 hours) for better visualization. The white and black bars at the top of the graphs indicate the light and dark periods, respectively. The red arrows indicate the feeding time.
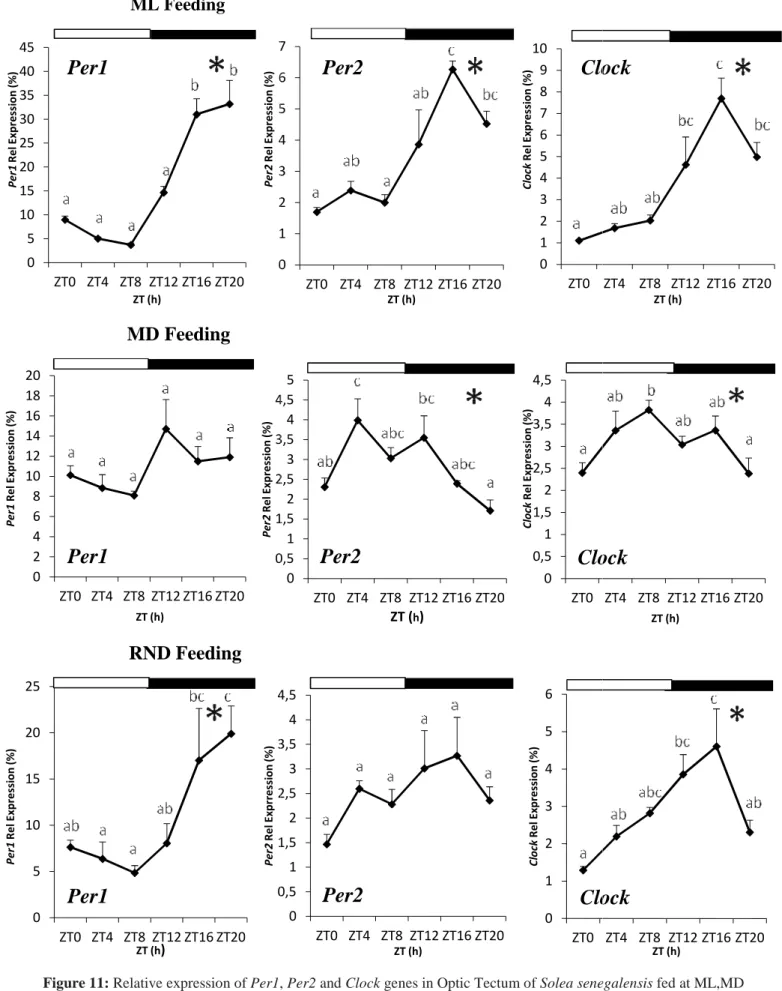
4.2 Influence of light and feeding time in clock gene expression
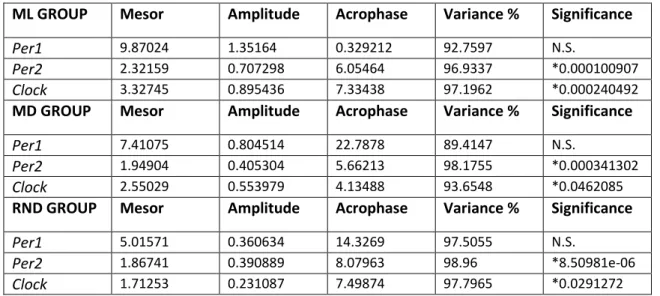
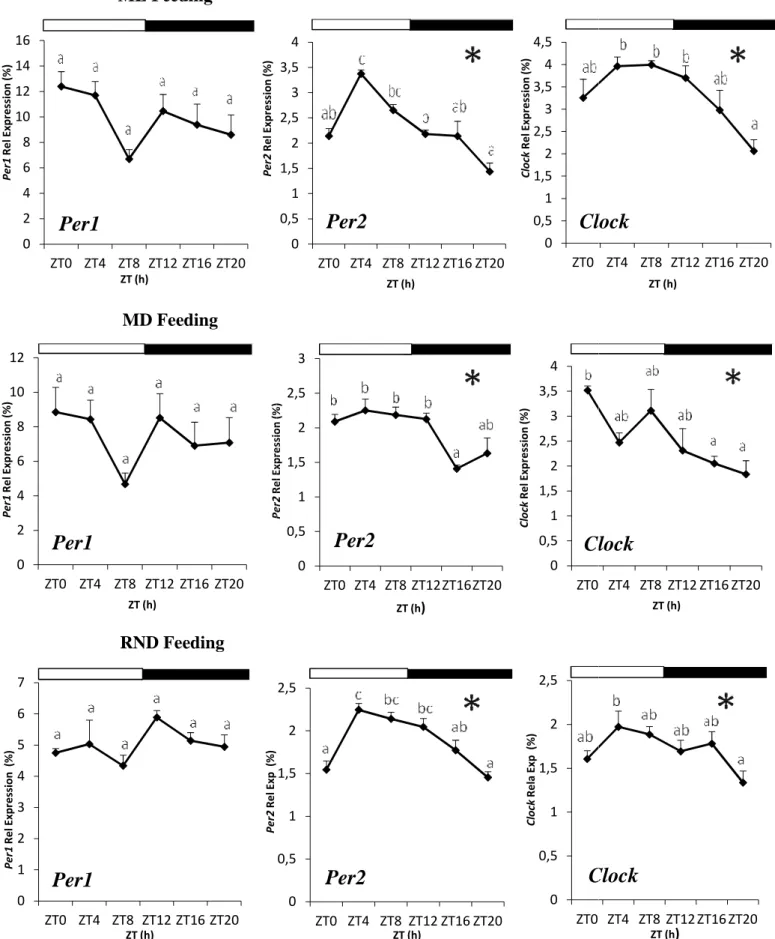
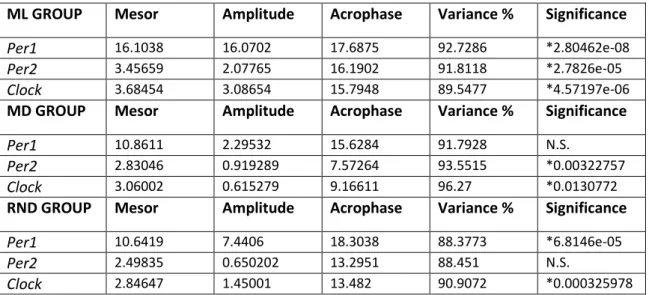
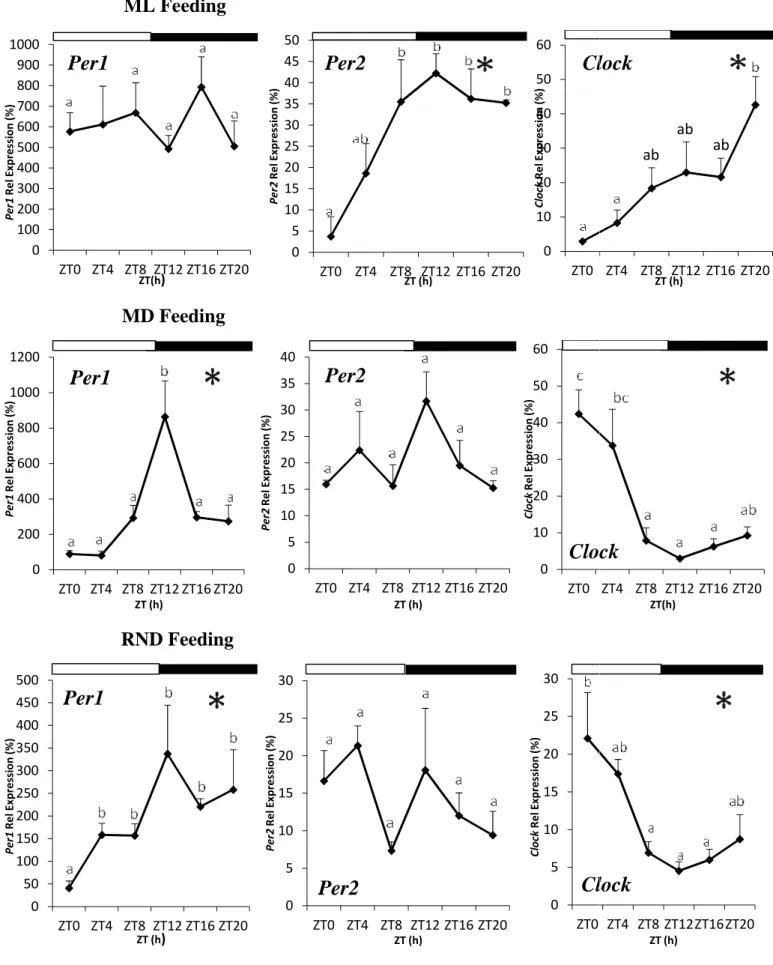
We have analyzed by Real Time quantitative PCR the daily rhythms of Per1, Per2, and Clock transcripts in two central areas such as the optic tectum and diencephalon, and a peripheral tissue such as the liver. Per1 exhibited the highest relative expression in all the tissues analyzed, being this difference especially evident in the liver (compare mesors in Tables 1-3 and the scales of
ML group
MD group
RND group
D a y s 1 5 10 15 20 25 30 D a y s 1 5 10 15 20 25 30 D a y s 1 5 10 15 20 25 3033 y axis in Figures 10,11,12). Statistical analysis including Cosinor and ANOVA indicated differences in phase depending on the feeding regime and the tissue analyzed (Tables 1-3; Figures 10, 11, 12).
4.2.1 Daily rhythms in diencephalon
In animals fed at ML (ML group), Per2 and Clock transcript levels exhibited significant daily rhythms, as evidenced by both ANOVA and Cosinor analysis (Table 1; Figure 10). Per2 presented its acrophase at ZT6.05, around the middle of the day, its expression decreasing thereafter until sunset and reaching the lowest levels at the end of the night (Table 1; Figure 10). Clock mRNA levels exhibited a similar daily profile, with its acrophase during the light phase at ZT7.33 and a comparable decrease of transcript levels throughout the dark phase (Table 1; Figure 10). In contrast, daily Per1 mRNA expression did not show statistical differences neither by ANOVA nor by Cosinor analysis (Table 1, Figure 10).
Similar to the ML group, in animals fed at MD (MD group), Per2 and Clock but not Per1 mRNA levels were revealed as rhythmic by both ANOVA and Cosinor analysis (Table 1; Figure 10). Per2 exhibited significant daily variations in expression, the acrophase being placed during the light phase at ZT5.66 (Table 1). Its expression was kept constant until lights off and then significantly decreased during the night (Figure 10). The acrophase of Clock was slightly advanced to ZT4.13 (Table 1) and then transcript levels decreased during the dark phase, rising at sunrise (Figure 10).
Randomly-fed fish (RND group) also showed Per2 and Clock significant daily rhythms, as evidenced ANOVA and Cosinor analysis (Table 1; Figure 10). Per2 reached its maximum level of expression during the second half of the light phase at ZT8.07, few hours delayed in relation to ML and MD groups (Table 1). Subsequently, its expression decreased gradually until sunrise, and increased again in the first hours of the day (Figure 10). Regarding Clock expression, it showed a similar profile than that of Per2, presenting the acrophase at ZT7.49 (Table 1; Figure 10). As for ML and MD, no significant daily rhythm in in diencephalic Per1 expression was observed (Table 1; Figure 10).
34
ML GROUP Mesor Amplitude Acrophase Variance % Significance
Per1 9.87024 1.35164 0.329212 92.7597 N.S.
Per2 2.32159 0.707298 6.05464 96.9337 *0.000100907
Clock 3.32745 0.895436 7.33438 97.1962 *0.000240492
MD GROUP Mesor Amplitude Acrophase Variance % Significance
Per1 7.41075 0.804514 22.7878 89.4147 N.S.
Per2 1.94904 0.405304 5.66213 98.1755 *0.000341302
Clock 2.55029 0.553979 4.13488 93.6548 *0.0462085
RND GROUP Mesor Amplitude Acrophase Variance % Significance
Per1 5.01571 0.360634 14.3269 97.5055 N.S.
Per2 1.86741 0.390889 8.07963 98.96 *8.50981e-06
Clock 1.71253 0.231087 7.49874 97.7965 *0.0291272
Table 1:Parameters estimated by the Cosinor analysis for clock genes (Per1, Per2 and Clock) in Diencephalon of Solea
Senegalensis under LD conditions and fed at ML, MD o RND times. The percentage of variance indicates the
percentage of experimental data explained by the cosine equation calculated by the Cosinor method. N.S., non significant rhythm; significance, p-value.
ML Feeding
MD Feeding
RND Feeding
Figure 10: Relative expression of Per1,
LD 12:12 cycles and fed at ML,MD and RND times
p<0.05). The black and the white bars at the top of the graphics rhythmic expression (Cosinor, p<0.05).
0 2 4 6 8 10 12 14 16 ZT0 ZT4 ZT8 ZT12 ZT16 ZT20 P e r 1 R e l E x p re ss io n ( % ) ZT (h) P e r 2 R e l E x p re ss io n ( % ) 0 2 4 6 8 10 12 ZT0 ZT4 ZT8 ZT12 ZT16 ZT20 P e r 1 R e l E x p re ss io n ( % ) ZT (h) P e r 2 R e l E x p re ss io n ( % ) 0 1 2 3 4 5 6 7 ZT0 ZT4 ZT8 ZT12 ZT16 ZT20 P e r 1 R e l E x p re ss io n ( % ) ZT (h) P e r 2 R e l E x p ( % )
Per1
Per1
Per1
Feeding, Per2 and Clock genes in Diencephalon of Senegalese sole maintained under fed at ML,MD and RND times. The letters indicate statistically significant differences (ANOVA,
at the top of the graphics represents the light and dark phases
0 0,5 1 1,5 2 2,5 3 3,5 4 ZT0 ZT4 ZT8 ZT12 ZT16 ZT20 ZT (h) 0 0,5 1 1,5 2 2,5 3 3,5 4 4,5 ZT0 C lo c k R e l E x p re ss io n ( % ) 0 0,5 1 1,5 2 2,5 3 ZT0 ZT4 ZT8 ZT12ZT16ZT20 P e r 2 R e l E x p re ss io n ( % ) ZT (h) 0 0,5 1 1,5 2 2,5 3 3,5 4 ZT0 C lo c k R e l E x p re ss io n ( % ) 0 0,5 1 1,5 2 2,5 ZT0 ZT4 ZT8 ZT12 ZT16 ZT20 P e r 2 R e l E x p ( % ) ZT (h) 0 0,5 1 1,5 2 2,5 ZT0 C lo c k R e la E x p ( % )
Per2
Clock
Per2
Clock
Per2
Clock
35 FeedingSenegalese sole maintained under etters indicate statistically significant differences (ANOVA,
phases. Asterisks represent
ZT4 ZT8 ZT12 ZT16 ZT20 ZT (h) ZT4 ZT8 ZT12 ZT16 ZT20 ZT (h) ZT4 ZT8 ZT12 ZT16 ZT20 ZT (h)
Clock
Clock
Clock
36 4.2.2 Daily rhythms in optic tectum
In contrast to what could be observed in the diencephalon, the expression of clock genes analyzed in the optic tectum of Senegalese sole was differentially affected by feeding regimes. In the ML-fed group, Per1, Per2 and Clock transcripts displayed significant cyclic oscillations over the 24h cycle, as revealed both ANOVA and Cosinor analysis (Table 2; Figure 11). Regarding Per1 expression, the acrophase was reached during the dark phase at ZT17.68, around the middle of the night period (Table 2; Figure 11). Per1 mRNA levels were maintained higher during the dark phase and diminished during daytime (Figure 11). As for Per1, Per2 and Clock showed a very similar expression profile, with the acrophases at ZT16.19 and ZT15.79, respectively (Table 2). The expression of both genes remained low during daytime and gradually increased to peak during the night (Figure 11).
In the MD group, statistical analysis revealed no daily variations in Per1 expression (Figure 11), neither by ANOVA nor Cosinor analysis (Table 2), whereas Per2 and Clock exhibited significant rhythmic daily profiles (Table 2). However, the expression profiles of both genes markedly differ from those observed in the ML group. Per2 peak was advanced approximately 8 h, being placed during daytime at ZT7.57 (Table 2). After that, its expression fell down throughout the night and reached the nadir around ZT20 (Figure 11). In relation to Clock, mRNA levels increased as the day progresses and reached its acrophase at the end of the light phase (ZT9.1), almost 7 hours before than in ML-fed group, decreasing thereafter (Table 2; Figure 11).
Finally, regarding the RND group, mRNA profiles resemble those observed in the ML group although Per1 and Clock but not Per2 relative expression showed significant daily rhythms by ANOVA and Cosinor (Table 2; Figure 11). The acrophase of Per1 was reached at ZT18.30, i.e. around the middle of the night (Table 2). Then, the transcript levels were maintained high during the rest of the night and progressively declined during the day, reaching the lowest expression at ZT8 (Figure 11). In turn, Clock gene expression exhibited a gradual increase from the onset of the day until the beginning of the dark period (ZT13.48), when acrophase is attained, and decreased towards the end of the dark-beginning of the light phase (Figure 11).