Università di Pisa
Facoltà di Medicina e Chirurgia
Scuola di Specializzazione in Radiodiagnostica
Direttore: Prof. Carlo Bartolozzi
Tesi di Specializzazione
Characterization of the neuroendocrine pancreatic
tumors nature by MDCT enhancement pattern: a
radio-pathological correlation
Relatore:
Chiar.mo Prof. Carlo Bartolozzi
Candidato:
Lisa Novaria
INDEX
Abstract
__________________________________________________3
Introduction
_____________________________________________5
Purpose
__________________________________________________9
Materials and Methods
_________________________________9
Results
___________________________________________________19
Discussion
_______________________________________________31
Conclusion
______________________________________________38
1. ABSTRACT
IntroductionPre-operative suspicion of neuroendocrine pancreatic lesions nature arises both from clinical (presence and the type of secreted hormone) and imaging findings. However, imaging suggestion of lesion nature is based quite only on nodular dimension and on the presence of local and distant spreading. Aim of the study was to determine the nature of neuroendocrine pancreatic lesions by analysing lesions enhancement pattern at MDCT and by comparing it with histological findings, including the MVD.
Materials and Methods
We included 45 patients submitted to surgical resection for pancreatic neuroendocrine tumor. All preoperative CT examinations were performed by a multidetector CT. Post-contrastographic study included 4 phases: early arterial (delay 15-20”), pancreatic (delay 35”), venous (delay 70”) and late phases (delay 180”). Two different patterns of enhancement were defined: pattern A, including lesions showing early enhancement (during early arterial or pancreatic phase) and a rapid wash-out; pattern B, including lesions with wash-in in the early arterial or pancreatic phase with no wash-out nor in the late phase (pattern B1), and lesions showing
Results
Sixty-six lesions were detected (30 pattern A, 26 B1 and 10 B2). At pathology 28 lesions were adenomas, 14 borderline and 24 carcinomas: 24/30 lesions showing pattern A were benign, 5 borderline and 1 carcinoma; 23/36 lesions showing pattern B were carcinomas, 9 borderline and 4 adenomas. Among the 26 B1 lesions, 13 were carcinomas, 9 borderline and 4 adenomas, while all 10 B2 lesions were malignant. Pattern A showed PPV of benignancy of 80%, and pattern B NPV of benignancy of 89%. MVD was evaluated in 22 lesions obtaining significant differences among the 3 histological and the 3 enhancement pattern. Significant differences between B1 and B2 malignant lesions existed by considering metastases (only B2 lesions) and fibrosis (all B2 lesions).
Conclusion
The enhancement pattern at CT is related to MVD and the histological type, thus representing a further criterium for suggesting nature of neuroendocrine lesions. The low MVD of B2 lesions, associated with the presence of fibrosis, may justify the delayed enhancement of these lesions.
2. INTRODUCTION
Neuroendocrine pancreatic neoplasms represent a small percentage among all pancreatic tumors, with an incidence of 1-1,5/100.000 cases [1,2]. Sporadic cases are quite unusual, representing the 1-3% of all pancreatic lesions [2,3,4,5] with a peak of incidence in the sixty years [2,6]. In patients with some hereditary syndromes (Von Hippel Lindau/MEN-1) such neoplasm can affect up to the 82% of patients [5,7]. However, although rare, this diseases have different prognosis and therapeutic management (both medical and surgical) compared to the remaining pancreatic cancers, whereby require a correct identification and definition nature in terms of benignity / malignancy.
On the basis of the WHO classification, among well differentiated neuroendocrine neoplasms also a peculiar group of tumors should be considered. It is the case of “borderline” lesions, that even if showing a benign morphological aspect, present some peculiar criteria suggesting possible malignant degeneration.
Benign neuroendocrine neoplasms are in fact secreting lesions confined to the gland, not showing microvascular invasion, presenting a low mitotic index (≤ 2 mitoses/ HPF or Ki 67 ≤2%) and diameter <2cm.
gland but they show signs of vascular invasion and increased mitotic index (>2/ HPF and/or Ki67>2%). Low-grade carcinomas (also called well differentiated neoplasms) are instead characterized by microvascular infiltration with locoregional or distant spreading and high mitotic index (2 up to 10/HPF and Ki 67 >5%). High-grade carcinomas (or low differentiated neuroendocrine carcinomas) are instead frequently metastatic at the time of diagnosis and microscopically characterized by small cells with loss of neuroendocrine differentiation [12].
The prognostic value of stratifying patients into 4 risk classes according to the WHO classification [5] [9] has been validated in a large series with long follow-up [10]. In order to have more accurate prognostic parameters, recently experts of the European Neuroendocrine Tumor Society (ENETS) proposed a new staging scheme for neuroendocrine tumors [11] [12] based on primary tumor characteristics (such as the diameter of the lesions) and local invasion (T) and the presence of lymph node metastasis (N) or distant metastases (M) [Table I ].
TABLE I. Staging of NETs of the Pancreas [14]
TNM
T-Primary Tumor
TX Primary tumor cannot be assessed T0 No evidence of primary tumor
T1 Tumor limited to the pancreas and size <2 cm T2 Tumor limited to the pancreas and size 2-4 cm
T3 Tumor limited to the pancreas and size >4 cm or invading duodenum or bile duct
T4 Tumor invading adjacent organs (stomach, spleen, colon, adrenal gland) or the wall of large vessels (celiac axis or superior mesenteric artery)
N-Regional Lymph Nodes
NX Regional lymph nodes cannot be assessed
N0 No regional lymph node metastasis N1 Regional lymph node metastasis
M-Distant Metastases
MX Distant metastasis cannot be assessed M0 No distant metastasis
M1 Distant metastasis
Staging of NETs of the Pancreas
Stage I T1 N0 M0
Stage IIa T2 N0 M0 Stage IIb T3 N0 M0 Stage IIIa T4 N0 M0 Stage IIIb Any T N1 M0 Stage IV Any T Any N M1
In addition, it was proposed to graduate neuroendocrine tumors into 3 categories (Table II).
TABLE II. Grading proposal for GEP-NETs from Rindi et al. [11]
Even if the validity of this scheme has not been yet verified with a follow-up, currently to properly classify an endocrine tumor of the gastro-entero-pancreatic district, it is essential to refer both to the WHO criteria [5, 9] and the ENETS grading and staging system [13] [12].
At the state of the art, pre-operative suspicion of lesion nature arises both from clinical and imaging finding. If clinical criterium generally adopted in order to formulate a diagnosis of benign lesion is related to the presence and the type of secreted hormone, imaging suggestion of lesion nature is based quite only on nodular dimension and on the presence of local and distant spreading [11].
To the best of our knowledge, no previous studies have been focused on additional lesion imaging characteristics that may contribute to assess lesion biological behaviour.
3. PURPOSE
Aim of our study was to evaluate the possibility to determine the benign or malignant nature of neuroendocrine pancreatic neoplasms by analysing lesions enhancement pattern at MDCT.
4. MATERIALS AND METHODS
Between January 2005 and February 2012, 45 patients referred to our Institution because of the suspicion of neuroendocrine pancreatic neoplasm, arisen at a first level imaging modality or because of a suggestive clinical syndrome.
Twenty seven patients were males, 18 females; average age was 59ys. Clinically, 11 patients complained symptoms due to hormonal secretion and, particularly, 9 patients complained symptoms referable to insulin hyperincretion, 1 to gastrine hyperincretion and 1 complained vague and low specific symptoms (abdominal pain and mild diarrhea).
Five out of 45 patients (11%) had undergone genetic analysis and resulted to be affected by MEN-1 syndrome; of these patients, 3 complained symptoms referable to insulinoma.
All preoperative CT examinations were performed by a multidetector CT 4 slice or 64 slice (Light Speed Plus, GE Medical System, Milwaukee USA; Light Speed Plus VCT, GE Medical System, Milwaukee USA). The CT study was preceded by gastroduodenal hyperdistention, obtained by oral administration of 750/1000 ml of water and by pharmacological hypotonization with Buscopan® or GlucaGen®.
CT studies were performed by acquiring basal as well as post-contrastographic scans, after intravenous administration of high-concentration iodinated contrast medium (Iomeron® 400) at 4 up to 5ml/min flow rate.
Unenhanced scans at 4 slice MDCT were acquired starting from the dome of the liver to the aortic carrefour, with a slice thickness and a reconstruction interval of 5 mm, and a pitch of 3 (High Quality-HQ modality) and a tube rotation speed of 0.8 sec, 120 Kv, 250 mA.
Unenhanced scans at 64 slice MDCT were acquired starting from the dome of the liver to the aortic carrefour, with a slice thickness and a reconstruction interval of 2,5 mm, and a beam pitch 0.984:1, and a tube rotation speed of 0.6 sec, anode voltage 120 Kv, automatic tube current modulation (smart mA, noise index 17).
Post-contrastographic study included 4 phases: - Early arterial phase (delay 15-20”).
Scans included only the pancreatic gland.
At 4 slice CT, the applied parameters were the following: slice thickness 1,25mm, reconstrution interval 0,6mm, pitch 6 (High Speed-HS modality), tub rotation speed of 0,5sec, 120 Kv, 300-350 mA.
At 64 slice CT: were acquired starting from the dome of the liver to the aortic carrefour, with a slice thickness 1,25mm and a reconstruction interval of 0,625 mm, and a beam pitch 0.984:1, and a tube rotation speed of 0.6 sec, anode voltage 120 Kv, automatic tube current modulation (smart mA, noise index 21)
- Pancreatic phase (delay 35”). This phase was acquired during the same inspiratory apnoea of the early arterial.
At 4 slice CT, scans were acquired from the mesenteric root up to the dome of the liver, and the applied parameters were: slice thickness 2,5mm, reconstruction interval 1,25mm, pitch 6 (HS), tube rotation speed 0,5 sec, 120 kV, 300-330 mA.
At 64 slice CT, were acquired starting from the dome of the liver to the aortic carrefour, with a slice thickness 1,25mm and a reconstruction interval of 0,625 mm, and a beam pitch 0.984:1, and a tube rotation speed
of 0.6 sec, anode voltage 120 Kv, automatic tube current modulation (smart mA, noise index 21)
- Porto-venous phase (delay 70”). Scans were acquired from the dome of the liver to the aortic carrefour.
At 4 slice CT, the applied parameters were: slice thickness 2,5mm, reconstruction interval 1,25mm, pitch 3 (HQ), tube rotation speed of 0,8 sec, 120 Kv, 300-330 mA.
At 64 slice CT were acquired with a slice thickness 1,25mm and a reconstruction interval of 0,625 mm, and a beam pitch 0.984:1, and a tube rotation speed of 0.6 sec, anode voltage 120 Kv, automatic tube current modulation (smart mA, noise index 21)
- Late phase (delay 180”). Scans were acquired from the dome of the liver to the mesenterial root.
At 4 slice CT the applied parameters were: slice thickness 2,5mm, reconstruction interval 1,25mm, pitch 3 (HQ), tube rotation speed 0,8 sec, 120 Kv, 300-330 mA, while at 64 slice CT scans were acquired from the dome of the liver to the aortic Carrefour, with a slice thickness 1,25mm and a reconstruction interval of 1,25 mm, and a beam pitch 0.984:1, and a tube rotation speed of 0.6 sec, anode voltage 120 Kv, automatic tube current modulation (smart mA, noise index 21).
At MDCT, we performed a qualitatively analysis of the post-contrastographic behaviour in different subsequent phases.
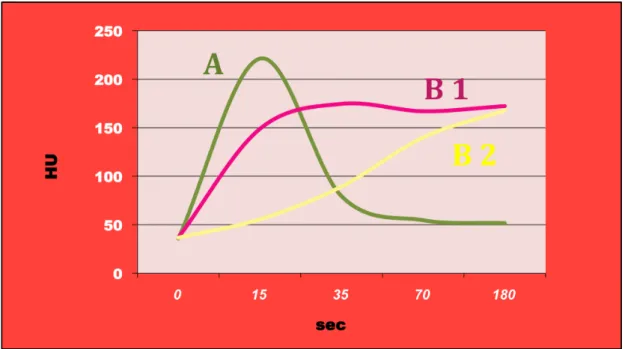
Particularly, two different patterns of enhancement were defined (Fig. 1):
Pattern A
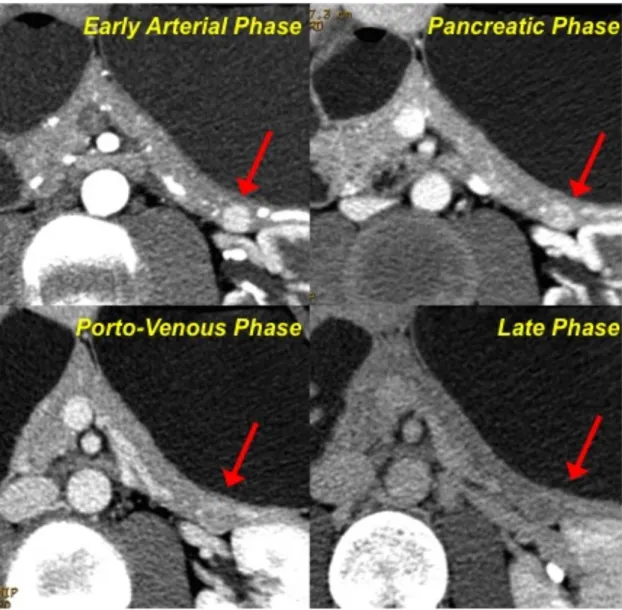
➢ including lesions showing an early enhancement (during early arterial or pancreatic phase) and a rapid wash-out, thus resulting isodense to the parenchyma in the venous/late phases (Fig. 2)
Pattern B
➢ including lesions showing wash-in in the early arterial or pancreatic phase with no wash-out nor in the late phase (pattern B1), and lesions showing enhancement only in the porto-venous and/or late phases (pattern B2) (Fig. 3, 4).
Fig. 1-Patterns of enhancement. After the iv injection of contrast
material 3 different curves of enhancement were identified: pattern A: enhancement in the early arterial or pancreatic phase and a rapid wash-out; pattern B1: wash-in in the early arterial or pancreatic phase with no wash-out nor in the late phase; pattern B2: enhancement only in the porto-venous and/or late phases.
Fig. 2-Pattern A. After contrast medium injection, the neuroendocrine
lesion located in the tail of the pancreas shows a vivacious enhancement during the early arterial phase; the wash-in is still evident during the pancreatic phase, while the lesion appears as isodense in the porto-venous and late phase.
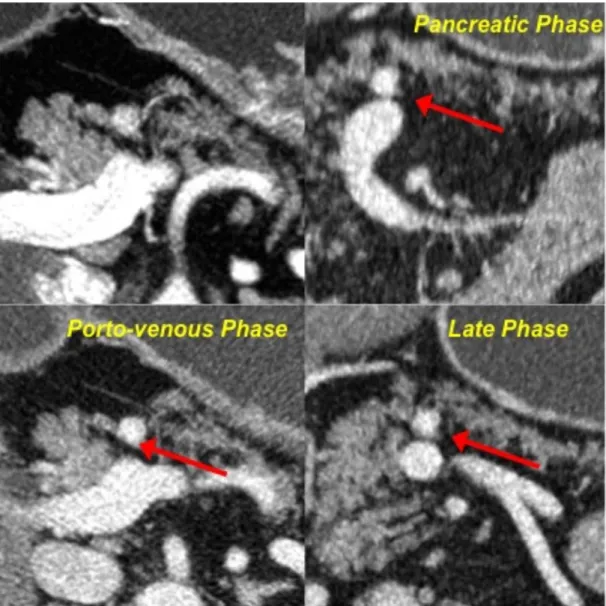
Fig. 3-Pattern B1. After contrast medium injection, the neuroendocrine
pancreatic neoplasm shows vivacious enhancement yet during the early arterial and pancreatic phase; the lesion still appears as hyperdense in respect to the surrounding parenchyma in the venous and late phases.
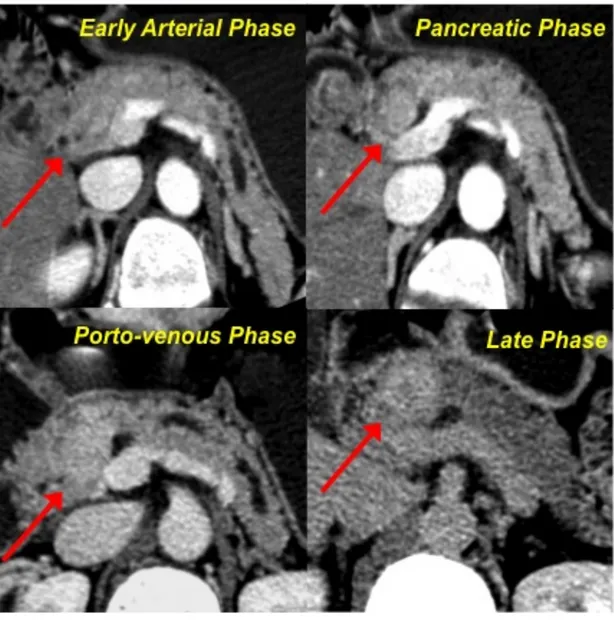
Fig. 4- Pattern B2. The lesion of the pancreatic head appears as
isodense in respect to the parenchyma in the early arterial and pancreatic phases. Only during the porto-venous phase the lesion shows a mild enhancement, that becomes really evident in the late phase.
Data obtained from MDCT examination were then related to those obtained at histology after surgical resection, including the lesion dimension and the Ki67 value (according to the WHO classification system), and the microvascular density-MVD.
In order to be observed by light microscopy, the tissues were cut into a rotary microtome to obtain sections of 1-5 µm.
For each sample, a section recovered by collection tank on a glass slide with electrostatic charge was obtained; this slide was used for immunohistochemical staining of CD34.
To analyze and process the data extracted from each histological sample, we used a dedicated system of acquisition and processing (Olympus BX-51, software AnalySIS^B). This system is composed of a microscope and a computer connected with a high resolution digital camera (resolving power: 12 MegaPixel color). The images, seen under the microscope, can be acquired with variable magnification (4X, 10X, 20X and 40X) and processed at computer. The system, thanks to a micrometric calibration made at the time of installation, allows to directly obtain the real measurements of histological sections.
Each sample was evaluated by using two different methods: ➢ Evaluation of the DMV by counting number of vessels:
for each case, 6 hypervascular fields were evaluated, at a magnification of 20X, obtaining a surface area of 0.588 mm2 for each field. For each field vessels (corresponding to the brown spots after CD34 staining) were counted. The total area analyzed for each sample was 3.528 mm2.
The program analySIS ^ B enables to automatically evaluate the relative percentage of surface vessels, by calculating the ratio between the CD34 stained area and the total area of the examined field.
5. RESULTS
At MDCT, 66 lesions were detected in 45 patients. Three patients affected by MEN-1 syndrome, presented 3, 5 and 15 lesions respectively and 2 patients, not affected by any familiar genetic syndrome, showed 2 and 3 lesions.
MDCT posed the suspicion of metastatic involvement of the liver in 7 out of 45 cases (16%).
At MDCT, 30 out of 66 (45%) lesions showed a pattern of type A; diameters of such lesions ranged between 5 and 30mm (average maximum diameter at CT-adCT: 11mm).
Thirty-six out of 66 (55%) lesions showed instead pattern B; diameters of such lesions ranged between 5 and 100mm (adCT: 37mm); 26 lesions presented pattern B1 (diameter ranging between 5 and 80mm; adCT 32mm) and 10 pattern B2 (ranging between 15 and 100mm; adCT 47mm).
All patients underwent curative surgery: 5 patients underwent tumoral enucleation, 13 pancreaticoduodenectomy, 22 left pancreatectomy, 4 total pancreatectomy and 1 regional pancreatectomy.
In the 7 cases suspected to have hepatic metastases at MDCT, a focused resection of the hepatic lesion was performed in order to obtain a pathological analysis.
Pathology assessed the neuroendocrine nature of all 66 lesions identified at MDCT. Particularly, 28 out of 66 (43%) lesions were classified as benign neuroendocrine neoplasms (adenomas), 14 out of 66 (21%) as borderline neoplasms and 24 out of 66 (36%) as low grade carcinomas. Histology confirmed the presence of liver metastases in all the 7 cases submitted to liver resection; all these patients were affected by low grade carcinomas.
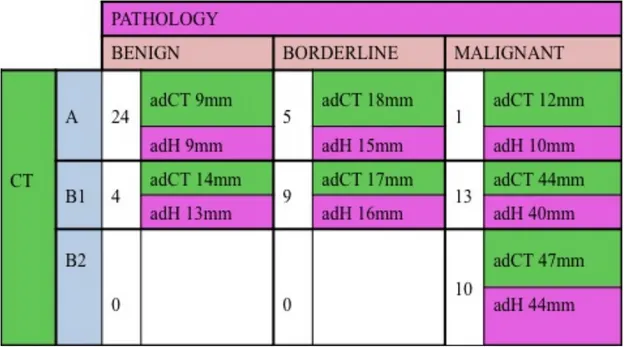
At pathology (Table III), 24 out of 30 lesions showing pattern A (80%) resulted to be adenomas (diameters ranging between 5 and 15mm; average maximum diameter at histology-adH: 9mm), 5 (17%) borderline neoplasms (10-22mm; adH 15mm) and 1 resulted to be a low grade carcinoma (maximum diameter: 10mm). The adCT of benign, borderline and malignant lesions showing pattern A was 9mm, 18mm and 12mm respectively.
Twenty-three out of 36 lesions (64%) showing pattern B resulted to be low grade carcinomas (5-70mm; adH 42mm), 9 (25%) borderline
neoplasms (7-28mm; adH 16mm) and 4 benign lesions (5-20mm; adH 13mm).The adCT of benign, borderline and malignant lesions showing pattern B was 14mm, 17mm and 45mm respectively.
More in detail, among lesions showing pattern B1, 13 out of 26 (50%), resulted to be low grade carcinomas, 9 (35%) borderline neoplasms and 4 (15%) adenomas. All the 10 lesions (100%) showing pattern B2 resulted to be low grade carcinomas.
Overall, pattern A showed a positive predictive value (PPV) in assessing benignancy of 80%, while pattern B showed a NPV in assessing benignancy of 89% and a PPV of malignancy of 64%.
Regarding the correlation between MDCT and histology about lesions dimensions, results are shown on Graph. 1 and Graph. 2. We found a good correlation both in case of lesions with pattern A (R=0,79) and pattern B (R=0,85); the correlation resulted to be excellent (R=0,91) by considering together lesions resulting hyperdense in early phases (pattern A and B1) (Graph. 3).
Graph. 2- Pattern B: dimensional correlation between CT and pathology
Graph. 3-Pattern A and B1: dimensional correlation between CT and
The evaluation of the MVD was performed in 22 out 66 lesions (30%), in particular 4 adenomas, 5 borderline lesions and 13 carcinomas.
The distribution of these lesions tumors according to their enhancement pattern is show in Graph. 4.
In each case, the total analyzed area was 3,528 mm2.
Graph. 4- Distribution of lesions according to their enhancement pattern
The graphs below (Graph. 5-6) show the average MVD values of lesions, grouped according to their enhancement pattern at CT; differences among the 3 groups were statistically significant, both by counting vessels (p = 0,0194) and by using the automatic system (p = 0.0401).
Graph.5- Radiological grading of MVD: number of vessels
Graph.6-Radiological grading of MVD: surface of vessels
By grouping lesions according to their histological type, instead, differences among the 3 groups were not statistically significant, both by
counting vessels (p = 0,210) and by using the automatic system (p = 0.0818) (Graph. 7-8).
Graph.7-Pathological grading of MVD: number of vessels
However, significant differences were obtained by considering together non-carcinomatous lesions (adenomas and borderline lesions, 9 cases); differences in the DMV were statistically significant, both by counting the number of the vessels (p = 0.0232) and by evaluating the relative surface of the vascular tissue (p = 0.0056) (Graph. 9-10).
Graph.9-MVD of adenomas/borderline lesions vs WDC: number of
Graph.10-MVD of adenomas/borderline lesions vs WDC: surface of
vessels
Graphs 11 and 12 summarize Ki67 values distribution according to the histological type and the MDCT pattern. The average value of Ki67 was 3.
Graph.12-Ki 67 values: histological type
Ki67 values ranged between 0,5 and 1,5 in adenomas and between 0,5 and 10 in carcinomas; in all 5 borderline lesions Ki67 value was 1.
Considering the radiological patterns, the values of Ki67 were between 1 and 1,5 for pattern A, between 0,5 and 7 for pattern B1 and between 0,5 and 10 for pattern B2, respectively. Interestingly, among B1 lesions, the 2 lesions with Ki67 value <1 (0,5) were benign, the 3 lesion with Ki67 value =1 were borderline and all 5 lesions with Ki67 values ≥2 were malignant (p = 0,0441).
The correlation between the radiological pattern and the corresponding values of Ki67 was practically significant (p=0.0864), while we obtained significance (p=0,0395) by correlating Ki67 values and pathological
In addition, we compared the 13 carcinomas included in this series, by analyzing presence fibrosis, lymph node metastasis and distance spreading. The comparative examination of this group revealed statistically significant differences between B1 and B2 malignant lesions (p = 0.0003). In particular, lymph node metastases were present in 3/5 B1 carcinomas and in 6/8 B2 carcinomas; distant metastases were present in 7/8 B2 carcinomas and only in 1/5 B1 carcinoma. Regarding the presence of fibrosis, it was demonstrable in 2/5 B1 carcinomas, while, interestingly, in all B2 carcinomas, and it was associated with the presence of macrophages filled with hemosiderin pigment; these pathological findings are typical of a more aged disease. This results are summarized in Graph. 13.
6. DISCUSSION
The role of imaging in the evaluation of neuroendocrine pancreatic neoplasms includes the localization of functioning neoplasms, the differential diagnosis with other pancreatic lesions, the identification of signs of malignancy and the loco-regional staging, that may help in suggesting the best therapeutic approach [15,16]. Particularly, in case of functioning neuroendocrine neoplasms, the clinical history and haematochemical data play a pivotal role in the diagnosis and imaging is mainly requested to identify and localize the neoplasm.
Not functioning neuroendocrine pancreatic neoplasms are instead frequently late diagnosed, almost in advanced stage, because of symptoms due to the mass effect or to loco-regional or distant spreading. In this case, imaging is mainly requested to give an accurate stadiation and to pose a reliable differential diagnosis with other pancreatic malignancies, especially with ductal adenocarcinoma, because of the different therapeutic approach and the significantly different prognosis [10].
In fact, not secreting neoplasms show a better prognosis and are frequently resectable in respect to other primary malignancy, even if turning out to be malignant in more than 50% of cases and presenting
a correct diagnosis of nature and an accurate evaluation of the secondary spreading in order to choose the best therapeutic approach.
Thanks to advanced imaging techniques, nowadays the detection of a small neuroendocrine neoplasm shows a high sensitivity [11-13, 17, 18-20] ranging between the 47 and the 72% [11, 12], even if it decreases sensibly (12%) in the detection of subcentimetric neoplasms. Many studies have been conducted in order to define the best diagnostic protocol at MDCT to identify the lesion [12, 13, 16, 17, 23-26].
At the state of the art, the best available criteria to formulate a suspicion of benignancy/malignancy of a neuroendocrine pancreatic lesion are the presence of a clinical syndrome, the lesion dimension (according to the WHO classification system) and the presence of signs of local or distant invasion at imaging.
Previous studies about the morphological presentation of neuroendocrine pancreatic neoplasms at MDCT reported that functioning benign neoplasms are usually small and homogeneously hypervascular [10, 21, 25], showing a wash-out yet in the porto-venous phase, while malignant tumors show generally greater dimensions, necrosis and calcifications [15, 25, 26] and a less homogeneous enhancement, particularly during the arterial phase [10, 27, 26, 28].
Anyway, when signs of locally advanced or metastatic involvement lack, the characterization in terms of nature is still challenging [29].
Recent studies demonstrate that perfusion CT is a feasible technique to assess tissue perfusion in patients with endocrine tumors of the pancreas. In particular a study of D’Assignies (2009) shows that tumor blood flow values are strongly correlated with tumoral MVD (p<0,001) and that perfusion parameters well correlate with a number of other prognostic indicators of lesion nature (35).
Aim of our study has been to assess the role of MDCT in the characterization of neuroendocrine pancreatic neoplasms in terms of benignancy/malignancy by analysing the lesion post contrastographic enhancement.
We applied a MDCT study protocol that included four subsequent phases after contrast medium injection, acquiring scans in the early arterial, pancreatic and venous phase, as reported in literature [12, 13, 17, 33, 34, 16, 21-24]; however at the end of the study (180”) we added a fourth late phase.
By analysing the enhancement behaviour of different lesions in all the post contrastographic scans in respect to the surrounding pancreatic parenchyma, focusing on the time of wash-in and wash-out, we identified two different patterns, A and B. Lesions with pattern B were subsequently classified into two patterns (B1 and B2) depending on the time of enhancement.
The major difference between pattern A and B consisted in the persistence of enhancement during the venous and late phases (B1) or in the evidence of enhancement only during the venous and/or late phase (B2).
The introduction of many subsequent post contrastographic acquisitions for the identification and characterization of neuroendocrine pancreatic neoplasms found its reason in the characteristic hypervascularity of such tumors [18, 31, 32]. In fact, insular cells, even if representing only the 1-2% of the entire parenchyma, receive a rich vascularization (10-20% of the entire pancreatic arterial flow), thanks to the presence of windowed capillaries, whom morphology and distribution ensure a rapid capillary exchanges in normal conditions [19].
In neuroendocrine neoplasms, it is possible to find out a different organization of the vascularization, due to a strong angiogenetic impulse; in small benign lesions, the multiple neovessels maintain a regular architecture and distribution, while in malignant nodules, because of a disorganized angiogenesis, neovessels result to be dysmorphic, thus leading to an abnormal lesion in and out flow [18, 30, 31, 32]. This different vascular structure is the main reason of the different post-contrastographic behaviour of malignant neoplasms, as reported in literature [12, 18, 26]. On the basis of these statements, it is then possible to affirm that the persistence of contrast enhancement during a late phase
may be considered as a prognostic sign of malignancy, being related to the lack of organization of the vascular structures and to the thrombosis into the perilesional capillaries, that delays the normal lesion wash-out [12, 18, 20].
In fact, in our study, 28 (43%) lesions resulted to be benign at histology, 24 (36%) malignant and 14 (21%) borderline. Particularly, 24 out of 30 lesions (80%) showing pattern A resulted to be benign (adH: 9mm), while only 1 (3%) resulted to be a low grade carcinoma. Regarding the 36 lesions showing pattern B, 23 (64%) resulted to be low grade carcinomas (adH: 45mm) and, particularly, all the 10 lesions (100%) showing pattern B2 at MDCT. Overall, pattern A showed then a PPV of 80% in predicting benignancy, while pattern B showed a NPV of 89% in suggesting malignancy and PPV in predicting malignancy of 64%.
On the basis of our results, the enhancement patterns resulted to well correlate with the greatest diameter in predicting lesion nature.
Average diameters of lesions showing pattern A at MDCT was 11mm and, particularly average diameters of 24 lesions with pattern A resulting to be benign nodules was 9mm, both at histology and MDCT. Average diameters of lesions showing pattern B at MDCT was 37mm and, particularly average diameters of malignant ones (23 cases) was 45mm at MDCT and 41mm at histology.
Particularly, at histology, all the 28 benign lesions showed a maximum greatest diameter <2cm, while the average diameter of low grade carcinomas was greater (41mm); only in one case, a low grade carcinoma showed a greatest diameter of 12mm and a pattern of type A. In this case, the lack of concordance has been justified on the basis of pathological analysis, that showed the absence of necrotic areas within the neoplasm and the absence of vascular abnormalities and thrombosis, probably due to the moderate mitotic activity of neoplastic cells.
Results about correlation between lesion dimensions at MDCT and histology (Graph 1-2) showed an excellent correlation (R=0.79) in case of lesions with pattern A, a very good (R=0,85) correlation between measurements in lesions with pattern B and excellent correlation (R=0,91) considering A and B1 patterns together (Graph 3).
The better correlation between measurements in cases of lesions showing pattern A and B1 may be justified because of an improved delineation of nodular edges thanks to the strong and more homogeneous enhancement. In our study we have also evaluated if the post-contrastographic patterns at MDCT could be related to microvascular density (MVD).
Some Autors demostred the correlation between MVD (expression of vessels average number per surface unit) and lesions malignancy degree: so benign neoplasms were more vascularized than carcinomas.
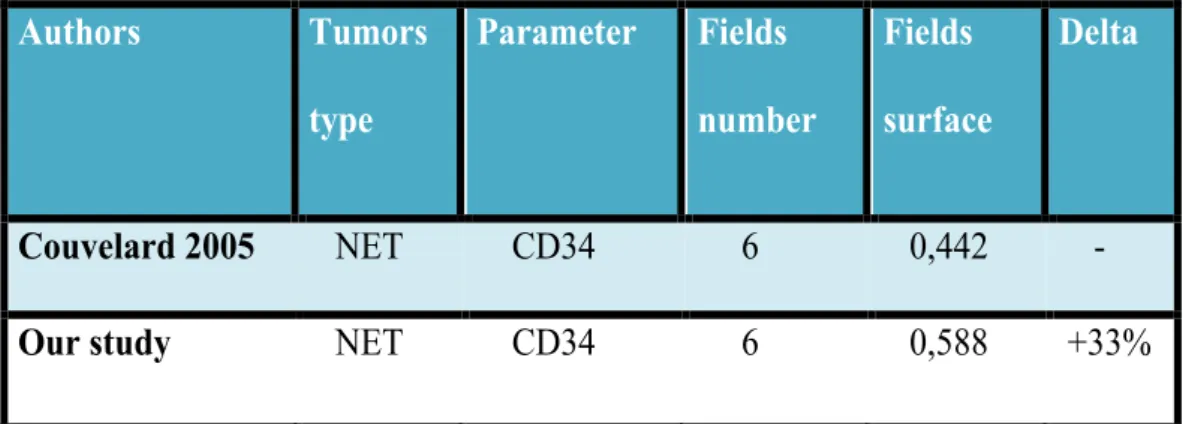
Our results are similar to those obtained by Couvelard, despite our analysis include a wider surface of tumor (+33%) (Table IV).
Authors Tumors type Parameter Fields number Fields surface Delta Couvelard 2005 NET CD34 6 0,442 -
Our study NET CD34 6 0,588 +33%
TABLE IV
In addition, even using the automated system to assess the MVD as relative vascular area, we obtained a statistically significant difference in particular between benign and borderlinevs malignant lesions. According to the pattern of enhancement, we obtained a statistically significant difference in the MVD between the three groups (p = 0.0401), and in particular cases with B2 behavior has been shown to have the lowest values of the MVD.
Considering the correlation between radiological patterns and Ki67 values, we obtained a practical significance (p=0.0864); however, interestingly, all A lesions had Ki67 values <2 and, among B1 lesions, both lesions with Ki67 value <1 (0,5) were benign, the 3 lesion with Ki67
value =1 were borderline and all 5 lesions with Ki67 values≥2 were malignant (p=0.0441) .
Also, the histological analysis showed peculiar characteristics in carcinomas with B2 pattern, with respect to malignant B1 lesions, such as the presence of fibrosis (100% of the cases B2), lymph node metastases (75% cases B2) and distance spreading (88% of cases B2 and only one B1).
These data seem to justify the malignant lesions radiological behaviour, with a wash-in only in the late stages, due to the low MVD and the presence of numerous areas of fibrosis. The well-differentiated carcinomas (B1), that are less aged than B2 carcinomas, are lesions that maintain the hypervascularization of lesions with pattern A (characterized by high MVD) and that have lower amount of fibrosis than B2 lesions, thus showing an intermediate behavior, with early enhancement, persistent in late phases.
7. CONCLUSIONS
In conclusion, MDCT may suggest the nature of a neuroendocrine pancreatic neoplasm and particularly, the lesion post-contrastographic pattern may represent a further criterium for suspecting lesion malignancy. On the basis of our results, in presence of a lesion showing
pattern A it is reasonable to suspect lesion benignancy, while lesions showing enhancement in the late phase, as showed in pattern B lesions, should be considered as suspected for not benignancy.
8. REFERENCES
1. Hemminki K, Li X et al. Incidence trends and risk factors of
carcinoid tumors. A nationwide epidemiologic study from Sweden. Cancer 2001; 92:2204-2210
2. Berge T, Linnel F et al. Carcinoid tumor. Frequency in a defined
population during a 12-year-period. Acta Pathol Microbiol Scand 1976; 84:322-330
3. Rosato L. I tumori neuroendocrini. Manuale di trattamento
diagnostico e terapeutico. Seconda edizione 2007 GS editrice
4. Capella C, Solcia E, Sobin LH et al. Endocrine tumours of the
stomach, small intestine, appendix, colon and rectum. In: Hamilton SR, Aaltonen LA, eds. Pathology and genetics of tumours of the digestive system. Lyon, IARC Press 2000; p 53-56, 77-82, 99-101, 137-138
Histological Classification of Tumours, Sec edition, Springer, Heidelberg, 2000
6. Capella C, Heitz PU, Höfler H, et al. Revised classification of
neuroendocrine tumors of the lung, pancreas and gut. Virchows Arch 1994; 425(6):547-60
7. Klöppel G, Rindi G, Anlauf M et al. Site-specific biology and
pathology of gastroenteropancreatic neuroendocrine tumors. Virchows Arch 2007; 451(suppl 1):S9-27
8. Plöckinger U, Rindi G, Arnold R et al. European Neuroendocrine
Tumour Society. Guidelines for the diagnosis and treatment of neuroendocrine gastrointestinal tumours. A consensus statement on behalf of the European Neuroendocrine Tumour Society (ENETS). Neuroendocrinology 2004; 80(6):394-424 Raven Press 773-783
9. De Lellis RA, Lloyd RV, Heitz PU et al. WHO Classification of
tumours. Pathology & genetics of tumours of endocrine organs. Lyon: IARC Press, 2004
10. Schmitt AM, Anlauf M, Rousson V et al. WHO 2004 criteria and
CK19 are reliable prognostic markers in pancreatic endocrine tumors. Am J Surg Pathol 2007; 31(11):1677-82
11. Rindi G, Klöppel G, Ahlman H, et al. all: TNM staging of foregut
grading system. Virchows Arch 2006; 449(4):395-401
12. Rindi G, Klöppel G, Couvelard A et al. TNM staging of midgut
and hindgut (neuro) endocrine tumors: a consensus proposal including a grading system. Virchows Arch 2007; 451(4):757-62
13. Rindi G, Azzoni C, La Rosa S et al. ECL cell tumors and poorly
differentiated endocrine carcinoma of the stomach: prognostic evaluation and outcome prediction by pathological analysis. Gastroenterology 2000; 116(3):532-42
14. Kulke MH, Anthony LB, Bushnell DL, de Herder WW,
Goldsmith SJ, Klimstra DS, Marx SJ, Pasieka JL, Pommier RF, Yao JC, Jensen RT; North American Neuroendocrine Tumor Society (NANETS). NANETS treatment guidelines: well-differentiated neuroendocrine tumors of the stomach and pancreas. Pancreas. 2010 Aug;39(6):735-52.
15. Pereira PL, Wiskirchen J. Morphological and functional
investigations of neuroendocrine tumors of the pancreas. Eur Radiol 2003; 13:2133-2146
16. Modlin IM, Schmid SW, Tang LH et al. Endocrine tumors of the
pancreas. In: Dervenis-Bassi. Pancreatic Tumors. Achievements and prospective. Dervenis-Bassi. Stuttgart-New York, Georg Thieme Verlag, 2000
17. Jani N, Moser AJ, Khalid A. Pancreatic endocrine tumors.
Gastroenterol Clin North Am 2007; 36:431-9.
18. Furukawa H, Mukai K, Kosuge T et al. Non functioning islet cell
tumors of the pancreas: clinical, imaging and pathological aspects in 19 patients. Japanese Journal of Clinical Oncology, 1998; 28:255-261
19. Balci NC, Semelka RC. Radiologic diagnosis and staging of
pancreatic ductal adenocarcinoma. Eur J Rad 2001; 38:105-112
20. D’Onofrio M, Mansueto G, Falconi M et al. Neuroendocrine
pancreatic tumor: value of contrast enhanced ultrasonography. Abdom Imaging 2004; 29:246-258
21. Rha SE, Jung SE, Lee KH et al. CT and RM imaging findings of
endocrine tumor of the pancreas according to WHO classification. Eur J Radiol 2007; 62:371-7
22. Oberg K, Eriksson B. Endocrine tumours of the pancreas. Best
Pract Res Clin Gastroenterol 2005; 19:753-81
23. Hermanek. Pathology and prognosis of endocrine pancreatic
tumors. In: Dervenis-Bassi. Pancreatic Tumors. Achievements and prospective. Stuttgart-New York, Georg Thieme Verlag, 2000
24. Horton KM, Hruban RH, Yeo C et al. Multi-detector row CT of
pancreatic islet cell tumors. RadioGraphics 2006; 26:453-464
25. Moayedoddin B, Booya F, Wermers RA et al. Spectrum of
malignant somatostatin- producing neuroendocrine tumors. Endocr Pract 2006; 12:394-400
26. Pedrazzoli S, Pasquali C, Sperti C et al. Clinically silent
pancreatic “somatostatinoma” in MEN1 syndrome, and literature review, G.I. Cancer 1996; 1:191-206
27. La Rosa S, Furlan D, Sessa F et al. The endocrine pancreas. In:
Lloyd RV, ed. Endocrine pathology. Differential diagnosis and molecular advances. Totowa, Humana Press 2004; 291-328
28. Anlauf M, Sipos B, Kloppel G. Tumors of the endocrine pancreas.
Pathologe 2005; 26:46-51
29. Gandolfi L, Torresan F, Solmi L et al. The role of ultrasound in
biliary and pancreatic disease. Eur J of Ultrasound 2003; 16:141-59
30. La Rosa S, Sessa F, Capella C et al. Prognostic criteria in non
functioning pancreatic endocrine tumours. Virchows Arch 1996; 429(6):323-33
31. Fidler JL, Johnson CD. Imaging of neuroendocrine tumors of the
30:73-32. Rockall AG, Reznek RH. Imaging of neuroendocrine tumours
(CT/MR/US). Best Prac Res Clin Endocrinol Metab 2007; 21:43-68
33. Kindmark H, Sundin A, Granberg D et al. Endocrine pancreatic
tumors with glucagon hypersecretion: a retrospective study of 23 cases during 20 years. Med Oncol 2007; 24:330-7
34. Solcia E, Capella C, Kloppel G et al. Tumors of the pancreas.
Atlas of tumor pathology. Third series. Fascicle 20. Washington, DC: Armed Forces Institute of Pathology 1995
35. D’Assignies G, Couvelard A, Bahrami S et al. Pancreatic
Endocrine Tumors: tumor blood flow assessed with perfusion CT reflects angiogenesis and correlates with prognostic factors. Radiology 2009 Feb; 250(2):407-16
![TABLE I. Staging of NETs of the Pancreas [14]](https://thumb-eu.123doks.com/thumbv2/123dokorg/7569765.111440/7.892.126.771.147.1027/table-i-staging-nets-pancreas.webp)
![TABLE II. Grading proposal for GEP-NETs from Rindi et al. [11]](https://thumb-eu.123doks.com/thumbv2/123dokorg/7569765.111440/8.892.218.677.304.516/table-ii-grading-proposal-gep-nets-from-rindi.webp)