Structural analysis of protein-small molecule interactions
by a crystallographic and spectroscopic approach
by
Robert Fagiewicz
A THESIS
submitted in partial fulfillment of the requirements for the degree
MASTER OF SCIENCE IN ADVANCED SPECTROSCOPY IN CHEMISTRY
Dipartimento di Chimica Industriale “Toso Montanari” Dipartimento di Chimica “Giacomo Ciamician”
ALMA MATER STUDIORUM - UNIVERSITÀ DI BOLOGNA Bologna, Italy 2017 Supervisor Simona Fermani Co-supervisors Mirko Zaffagnini Damiano Genovese
Abstract
Modern spectroscopic techniques grant various methods for a protein structure determination among with a ligand interaction. This work aims at probing the structural insights of a protein-small molecule interaction with biocrystallography and optical spectroscopies. Two independent systems were investigated in frame of this thesis. The first one involves flavoenzyme interaction with a natural nucleotide as a cofactor required for its catalytic activity and work was purely based on macromolecular crystallography. The second concerns incorporation of a synthetic fluorescent ligand into a model protein as a solution for hydrophobicity of the probe. Due to the nature of the probe optical spectroscopies (such as absorption, fluorescence lifetime, circular dichroism) were effectively employed together with crystallographic methodology.
Abbreviations
APX – ascorbate peroxidase
BODIPY – boron-dipyrromethene (also referred as pyrromethene597) BSA – bovine serum albumin
DHAR – dehydroascorbate reductase ESA – equine serum albumin
FAD – flavin adenine dinucleotide
FADH- – flavin adenine dinucleotide (reduced) GR1 – glutathione reductase (cytoplasm isoform) GR2 – glutathione reductase (chloroplast isoform) GSH – glutathione (reduced)
GSR – glutathione disulfide reductase GSSG – glutathione disulfide (oxidized) HSA – human serum albumin
MDAR – monodehydroascorbate reductase NAD+ – nicotinamide adenine dinucleotide
NADP+ – nicotinamide adenine dinucleotide phosphate
NADPH – nicotinamide adenine dinucleotide phosphate (reduced) PEG – polyethylene glycol
ROS – reactive oxygen species
Table of contents
Abstract ... iii
List of Figures ... viii
List of Tables ... xii
Acknowledgements ... xiii
Chapter 1 - Preamble ... 1
I. Structural studies of biological macromolecules – biocrystallography ... 1
II. Protein-ligand interactions ... 3
III. Aim of the study ... 5
PROJECT1 Chapter 2 - Introduction ... 7
2.1 Biological importance and catalytic mechanism of Glutathione Reductase ... 7
2.2 Glutathione Reductase role in eukaryotes ... 8
2.3 Abiotic stress defense in plants ... 8
2.4 Glutathione reductase structure and enzymatic characteristics ... 10
2.4.1 Reductive half-reaction of Glutathione reductase ... 12
2.4.2 Oxidative half-reaction of Glutathione reductase ... 12
2.5 Chlamydomonas reinhardtii as a model organism for GR studies ... 13
Chapter 3 - Methods and experimental fine points ... 15
3.1 Protein preparation and purification... 15
3.2 Dynamic Light Scattering ... 16
3.3 Crystallization ... 18
3.4 Principles of Single Crystal X-ray Diffraction ... 23
3.4.1 X-ray Diffraction ... 23
3.4.2 Synchrotron radiation source ... 25
3.4.3 Data collection ... 29
3.4.4 Data analysis and refinement ... 30
Chapter 4 - Results and discussion ... 32
4.1 Protein sample quality ... 32
4.3 Crystallization trials and optimization ... 38
4.4 Data collection, processing and model building ... 43
4.4.1 Data collection ... 43
4.4.2 Choice of the best model and resolution ... 45
4.5 FAD binding pocket and comparison with pro- and eukaryotic organisms ... 46
4.5.1 Plantae - Chlamydomonas reinhardtii ... 48
4.5.2 Animalia – Homo Sapiens ... 49
4.5.3 Fungi - Saccharomyces cerevisiae ... 50
4.5.4 Protista - Plasmodium falciparum ... 51
4.5.5 Bacteria - Rhizobium meliloti ... 52
4.5.6 Structural superimposition ... 53
4.6 Conclusions ... 54
4.6.1 Perspectives ... 56
PROJECT2 Chapter 5 - Introduction ... 58
5.1 Importance of BODIPY fluorescent probes ... 58
5.1.1 Fluorescent probes in cell imaging ... 58
5.1.2 Structure and physicochemical properties of BODIPY dyes ... 60
5.2 Synthesis and functionalization of BODIPY dyes ... 61
5.2.1 From pyrroles and acid chlorides or anhydrides ... 61
5.2.2 From pyrroles and aldehydes ... 61
5.2.3 From ketopyrroles ... 62
5.3 Bovine Serum Albumin as a model protein ... 64
Chapter 6 - Methods and experimental fine points ... 66
6.1 Chemicals and sample preparation ... 66
6.2 Absorption and fluorescence spectroscopies ... 66
6.2.1 Absorption theory and experimental conditions ... 67
6.2.2 Fluorescence theory and experimental conditions ... 69
6.2.3 Dynamic Light Scattering measurement ... 71
6.2.4 Crystallization and Single Crystal X-ray Diffraction ... 71
7.1 Absorption experiments ... 73
7.2 Fluorescence experiments ... 78
7.3 Crystallographic study ... 82
7.4 Conclusions ... 84
List of Figures
Figure 1. The schematic protocol employed in a biocrystallographic project. ... 2
Figure 2. Hemoglobin mode of action. Each hemoglobin contains four distinct iron-containing heme groups. Oxygen is loaded during respiration. Once the tissue is reached deoxygenation takes place, and metalloprotein can continue the cycle. Image taken from stepwards.com website (access on May 8th 2017). ... 3
Figure 3. Scheme of redox reaction upon GR catalytic activity. (A) Simplified representation of sulfur biochemistry in 2GSH/GSSG. Withdrawal of electrons from thiol groups leads to formation of sulfur bridge, thus oxidized form of glutathione. (B) Global representation of redox reactions with participation of FAD-bound GR and accompanying oxidation of NADPH. ... 9
Figure 4. GR homodimer with its binding sites from Escherichia coli. (A) Subunit representation of an enzyme and (B) FAD and NADPH spatial orientation within GR with surrounding residues. The catalytic activity is located at the interface between GRs monomers. Images generated with PDB viewer, PDB ID: 1GET ... 11
Figure 5. Schematic representation of oxidative and reductive half reaction of GR. Image taken from [1]. ... 13
Figure 6. Phase diagram for generic protein. ... 18
Figure 7. Scheme of a hanging drop vapor diffusion method. ... 19
Figure 8. Scheme of well numbering with a color indication respective to the crystallization kit used for GR1 and GR2 crystallization trials and optimizations. ... 22
Figure 9. Graphical representation of the Bragg diffraction from a crystal with evenly spaced planes. ... 23
Figure 10. Synchrotron facility scheme. ... 26
Figure 11. Scheme of the main elements of the storage ring. ... 27
Figure 12. ID23.1 beamline design for Macromolecular crystallography (MX). ... 29
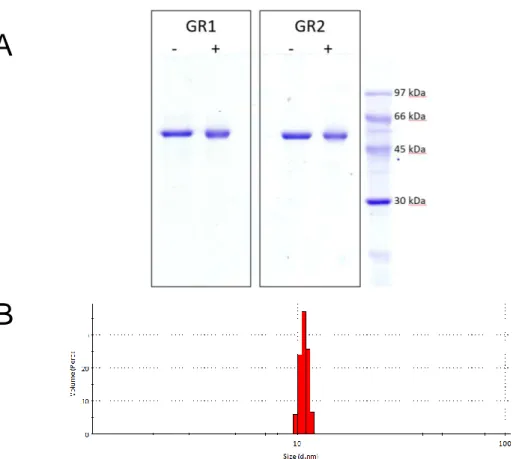
Figure 13. A: SDS-PAGE of GR1 and GR2.”+” indicates oxidized form, “-“ indicates reduced enzyme. B: DLS analysis GR1 and GR2 reported as size distribution by volume in function of hydrodynamic diameter. ... 34
Figure 14. Images of positives hints from crystallization trials for GR1. All images taken at zoom 4x under polarized light. Naming scheme: plate#/well/reagent solution. 70µm scale bar located at every top left corner. ... 39 Figure 15. Images of positives hints for GR2. Due to the size and morphology of the
crystals, they were not considered in further analysis. Labels and scale bar as in Figure 14. ... 39 Figure 16. Images of positives from optimization step for GR1. All images taken at zoom 4x under polarized light. Naming scheme: plate#/well/reagent solution. 70 µm scale bar located at every top left corner. ... 42 Figure 17. Left: images of III/C6/33B crystal manually centered on a goniometer. Right:
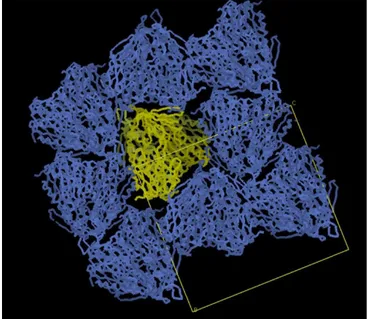
exemplary diffraction pattern of a GR1 crystal taken for a full data collection. ... 43 Figure 18. Unit cell packing for GR2. The neighboring proteins did not show clashes,
hence molecular replacement worked properly. ... 45 Figure 19. 2F0-Fc electron density map contoured at 1σ around FAD region. Visualized
with Coot. ... 46 Figure 20. Image A: ligand interaction with neighboring residues and hydrogen bonds
distances. Image B: three dimensional view on FAD binding pocket with highlighted catalytic cysteines (yellow), histidine (cyan), and tyrosine (brown). ... 48 Figure 21. Image A: ligand interaction with neighboring residues and hydrogen bonds
distances. Image B: three dimensional view on FAD binding pocket with highlighted catalytic cysteines (yellow), histidine (cyan), and tyrosine (brown). Accession code: 3DK9. ... 49 Figure 22. Image A: ligand interaction with neighboring residues and hydrogen bonds
distances. Image B: three dimensional view on FAD binding pocket with highlighted catalytic cysteines (yellow), histidine (cyan), and tyrosine (brown). Accession code: 2HQM. ... 50 Figure 23. Image A: ligand interaction with neighboring residues and hydrogen bonds
distances. Image B: three dimensional view on FAD binding pocket with highlighted catalytic cysteines (yellow), histidine (cyan), and tyrosine (brown). Accession code: 1ONF. ... 51
Figure 24. Image A: ligand interaction with neighboring residues and hydrogen bonds distances. Image B: three dimensional view on FAD binding pocket with highlighted catalytic cysteines (yellow), histidine (cyan), and tyrosine (brown). Accession code: 4DNA. ... 52 Figure 25. Structural alignment of single GR subunits. (A) Plant and human GR. (B)
Plant and bacterial GR. ... 53 Figure 26. GR1 crystals. From the top left corner: first two images are GR1 with NADP+,
next three images are GR1 reduced with NAPDH, next four images are GR1 with TCEP and remaining two are GR1 with NAPDH and TCEP. White scale bar in every corner has approximate length of 70 µm. ... 56 Figure 27. Examples of small molecules widely applied in cellular imaging as a
fluorescent probes. ... 60 Figure 28. Top: chemical structure of the chromophore of BODIPY. Bottom: BODIPY
utilized in this work (also referred as pyrromethene597). ... 60 Figure 29. Synthetic routes for BODIPY functionalized chromophore. Description of
reactions in the text in chapter 5.2. Reaction schemes taken from [47]... 63 Figure 30. Crystal structure of BSA subunits. ... 65 Figure 31. Absorption of an incident photon and emission of a fluorescence photon in a
simplified fluorophore electronic state system. ... 67 Figure 32. Set up of an absorption experiment. ... 67 Figure 33. Scheme of an absorption experiment. ... 68 Figure 34. Simplified Jablonski diagram for the fluorescence emission with an
exemplary spectra generated by combining absorption and emission spectra. ... 69 Figure 35. Excitation and emission spectra of a fluorophore. Spectra plotted at three
wavelengths (EX1, EX2 and EX3). ... 69 Figure 36. Plate for hanging drop vapor diffusion crystallization of BSA and
pyrromethene complex. A and B indicates two different crystallization conditions taken from literature [50]. P597 indicates pyrromethene597 as a supposed adduct with the protein. Composition of reservoir solutions: A – 0.2M calcium acetate, 0.1M MES (pH 6.5), 24% w/v PEG 5K Da, B – 0.175M ammonium chloride, 0.1M MES (pH 6.5), 17% PEG 5K Da. ... 72
Figure 37. Top: Calibration curve for pyrromethene597 absorption maxima at 523 nm. Bottom: Absorption profiles of pyrromethene597 at different concentrations (dye dissolved in methanol). ... 74 Figure 38. (A) UV-Vis spectra of the protein reference and an adduct of
BSA:pyrromethene597. Sample diluted 1:10 for the experiment (thus final
concentration of the protein was 0.025mM and pyrromethene597 was 0.55mM). (B) DLS size distribution by intensity, where red spectra is a BSA reference while green corresponds to BSA:pyrromethene597 adduct. ... 75 Figure 39. (A)UV-Vis profile of protein:dye adduct prepared with microtip sonication.
Sample was sonicated for 50 minutes in total and spectra was acquired every 10 minutes. The green spectra stands for the sample analyzed after 24 hours 'rest' at 4 °C. (B) UV-Vis profile of protein:dye adduct left under magnetic stirring. Spectra acquired every hour and left for 24 hours at room temperature. ... 77 Figure 40. DLS profile of BODIPY water solution (0.04 mM) prepared with microtip
sonication (60 minutes). Size distribution by intensity indicates irregular aggregates in the range between 80 - 522 nm. ... 78 Figure 41. Fluorescence spectra for protein:dye complex. The orange spectrum is a
sample taken for 50 minutes sonication, while the grey one was additionally taken for viva-spin separation. ... 79 Figure 42. Fluorescence lifetime for sonicated adduct (blue) and sonicated/separated
sample (orange). ... 79 Figure 43. Fluorescence lifetime for sonicated protein:dye solution (blue) and sonicated
and viva-spin separated solution (red). ... 80 Figure 44. Emission profiles of sonicated/separated protein:dye sample. Excitation
wavelength was equal to 405 nm and emission lifetime measured in the range from 520 nm up to 700 nm. ... 81 Figure 45. Images of crystallization positive hints. Naming scheme: well#/crystallization
condition/sample (where B stands for BSA and BP for BSA:pyrromethene597). Scale bar in the top left corner indicates 70 µm. ... 82 Figure 46. Example of pyrromethene597 fitting and subsequent refinement cycle. Only
List of Tables
Table 1. Structure Screen 1 cacodylate free - tube composition used for crystallization trials. ... 21 Table 2. Summary of GR identity with different origin enzymes that are available on
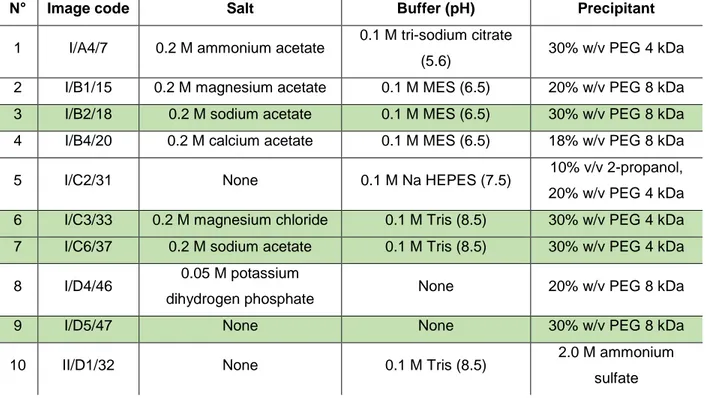
Uniprot and/or PDB database. In green is highlighted best identity of available structure, and in yellow the identity with homologous plant organism (while the structure is not known). ... 38 Table 3. List of reagent solutions for crystallization trials that gave positive results. In
green are marked reservoir solutions given priority in optimization step. ... 40 Table 4. List of reagent solutions for optimization step that gave positive results. In
yellow marked reagent solutions that gave suitable crystals for an XRD analysis. . 42 Table 5. Summary of data collection, refinement and Ramachandran plot details for the
III/C3/33B sample. ... 44 Table 6. Fitting parameters for sonicated and sonicated/separated sample. ... 80 Table 7. Data collection parameters for BSA:pyrromethene597 crystals. ... 84
Acknowledgements
I would first thank my thesis supervisor Prof. Simona Fermani from the Department of Chemistry of the University of Bologna. It would be though to list the number of times when I found help in her office. At the moment I cannot think of a person that would devote this amount of time for many enlightening conversations, explanations, and discussions in regards to this project. After working in Prof. Fermani’s group I am sure I want to continue my adventure with structural biology and I wish everyone to start scientific research with people like her. Not only a knowledgeable and highly skilled scientist but also an understanding tutor, guide, and a friend. I truly hope we will be able to cooperate during my future career.
I would also like to thank my co-supervisors: Mirko Zaffagnini (Department of Pharmacy and Biotechnology) and Damiano Genovese (Department of Chemistry). Without their enthusiastic input, many issues would remain unsolved. I am very grateful for a number of valuable comments on this thesis.
From people that are more related to my life during this degree rather than the project itself, the list is long and impossible to describe their contribution. Nevertheless they played an important role in the everyday work, study/lunch/party time, office work and more generally - my life during ASC: coordinator of the ASC network – Prof. Sylvain Cristol, local coordinators in Lille and Bologna – Prof. Cedric Lion and Prof. Marco Giorgetti and all the ASC network teachers for this amazing program, administrative officers – Francine Chanier and Aude Zeglin for helping out with all that painful paperwork, my amazing friends for the support in tough moments, and last but not least all the people from Biocrystallization and Biomineralization group at University of Bologna – Prof. Giuseppe Falini, Dr. Matteo Di Giosia, Dr. Michela Reggi, Devis Montroni and Giulia Magnabosco for making the lab work more enjoyable than ever and for hundreds of conversations (those scientific and those far away from science).
Chapter 1 - Preamble
I. Structural studies of biological macromolecules – biocrystallography
Contemporary structural biology employs various powerful techniques to investigate the structure of macromolecules at different levels and resolutions; among them X-ray or neutron diffraction (XRD), Small Angle X-ray Scattering (SAXS), Nuclear Magnetic Resonance (NMR), and Cryo-Electron Microscopy (Cryo-EM). All of them plays at the edge of physics, biology, chemistry, and engineering. The field requires very often hybrid approach, thus combining two or more techniques. Biocrystallography is the experimental science aimed to the study of the 3D structure of biological macromolecules at atomic resolution. It is based on the analysis of a diffraction pattern of a crystal, targeted by a radiation beam, in general X-ray. Although the crystallization of biological macromolecules could be the bottleneck of the entire procedure, biocrystallography remains dominant and allows for an atomic resolution structure, eventually giving access to the function evaluation.
Historically this field is not only knowledge-based but also technology and methodology driven. Regular advancements had been done in emerging aspects of biocrystallography, starting from protein expression and purification and ending up with diffraction data collection at synchrotron sources and model refinement. As Giegé et al. (2010) nicely phrased this evolution:
"Over the years with the increasing number of solved crystal structures, biocrystallography reached the mature age and transformed into structural biology."
Difficult to argue with such statement considering the number of cooperative networks doing extensive work in the structure determination by employing more and more advanced technologies. Many European institutes allow researchers to access almost any kind of instrumentation with a support of experienced scientists (i.e. EMBL, IBS, Instruct facilities).
Figure 1 represents steps that are essential in 3D structure determination by the crystallographic approach. The very first step is the preparation of the target macromolecule sample, that is based on biological methodologies (cloning, expression, purification and purity assessment). The further three steps deal with rather
interdisciplinary approaches to get high-quality diffraction data from the protein crystal. The main condition to reach this aim is to grow highly ordered single crystals. Methods were developed to screen initial conditions and pick the right method for crystal growth. The complexity of the crystallization matrix makes it more a trial and error approach, but when the first crystals are obtained an optimization procedure can be applied by rationally varying few parameters with the aim of improving morphology and dimensions. Sometimes these two steps can require a long time. The determination of the final 3D structure consists of two stages: the phase determination which is not a trivial task in the case of biological macromolecules and the structure refinement. Many software are currently available for the diffraction data analysis, phase determination and structure refinement. Being constantly updated they keep the crystallographers with most recent advancements.
A crystallographic project can be stuck at any of these stages forcing search for an alternative solutions and re-attempting the job all over again. As will be demonstrated in this work, it is the case where some problems are difficult to overcome but remains solvable to some extent. Methodology details will be provided further on in this work.
II. Protein-ligand interactions
Proteins play a vital role in living systems and are very complex molecules. Typically, the amino-acid sequence shapes the protein structure and function but very often to perform their work a protein needs a "little help" from different molecules. The 3D structure of such proteins usually shows a distinct binding site for these molecules. Any molecule bound to a protein and forming a complex with it is referred as a ligand (from Latin ligare meaning to bind). Ligands include substrates, inhibitors, activators and neurotransmitters and they can be peptides, proteins, DNA, small molecules, ions, and drugs.
A well-known example would be hemoglobin, which is a protein responsible for the oxygen transport in vertebrates. This would not be possible without iron atoms. Each hemoglobin carries four distinct, non-covalently bonded heme groups – each one accommodating one iron atom. Once it binds to dissolved oxygen atoms, the protein can transport oxygen from lungs to tissues - graphical representation shown in Figure 2.
Figure 2. Hemoglobin mode of action. Each hemoglobin contains four distinct iron-containing heme groups. Oxygen is loaded during respiration. Once the tissue is reached deoxygenation takes place, and metalloprotein can continue the cycle. Image taken from stepwards.com website (access on May 8th 2017). There are plenty of such examples, and each would have a unique mechanism. The order of interaction between the protein and a ligand lays within weak, non-covalent bonds such as salt bridges, hydrogen bonds, and Van der Waals forces. The binding site specificity is related to the nature of R-groups (amino acids side chains) mutual interaction, giving rise to a binding pocket within the protein structure.
There are 20 common amino acids, very different in chemical character, thus being able to form different bonds. This is why those interactions are usually very specific.
There are many ways for amino-acids classification, and grouping them by their chemical character is the most convenient way to visualize types of a bond they can take part in. Hydrophobic interactions and Van der Waals forces stand for an important class in protein science, thus giving a significant role to non-polar residues, such as aliphatic (Gly, Ala, Val, Leu, Ile, and Pro) and aromatic (Phe, Tyr, Trp) ones. Non-polar groups contribute to change in entropy, since they are more stable when close to each other rather than exposed to water – this would be a basic description of hydrophobic interactions. Van der
Waals forces are related to the charge of a molecule or more accurately - charge
fluctuation. This behavior results in temporary charge attraction or repulsion of the neighboring electrons and atoms - eventually giving rise to the attractive forces.
Charge-associated interactions would include acidic (Asp, Glu) and basic (Arg, Lys, His) residues (here charge-charge and ionic interactions). Ionic interactions tend to be stronger when considering amino acids containing alcohols (Ser, Thr, Tyr) or amides (Asn, Gln) because of the presence of either oxygen or nitrogen atom and their electron withdrawing properties. Their polarity makes them a good fit for hydrogen bonding, between N-H, O-H hydrogens, and a lone pair on oxygen and nitrogen at an adjacent residue.
Another important class of bonds in proteins are those forming disulfide bridges between Cys residues. Those are formed either within a peptide or between separate polypeptides. They form a covalent bond, meaning they need a catalyst to be formed or broken apart. They are responsible for many catalytic properties of certain enzymes, and an example is also given in this work.
III. Aim of the study
This thesis is based on the structural characterization of the protein-small molecule interactions in two independent systems:
1. Glutathione reductase (GR) from the photosynthetic algae Chlamydomonas
reinhardtii, which binds a flavin adenine dinucleotide (FAD) in each chain. This
subject will be referred as PROJECT1 in this thesis.
2. Bovine serum albumin (BSA) as a putative system to solubilize and carry in water solutions boron-dipyrromethene (BODIPY), a novel fluorescent dye. This subject will be referred in this thesis as PROJECT2.
PROJECT1: Glutathione reductase plays a significant role in the cell homeostasis by
maintaining a reducing environment within a cell. In photosynthetic organisms it is present in several cell compartments, thus giving rise to different isoforms. Even though its function and mode of action are believed to be well conserved in nature, there is little known about this structure of plant origin.
In Protein Data Bank (PDB) at the moment there are 36 structures of GR, but any of these from photosynthetic organisms.
The target of this project is to determine the three-dimensional structure of two GR isoforms, namely glycolytic (GR1) and chloroplastic (GR2), characterize the interaction of the protein with FAD with a focus on Rossman fold holding the cofactor and to perform a comparative study with other GRs of different origin already characterized.
This work is a collaborative project between plant physiology and biocrystallography group at the University of Bologna. The first one being responsible for biochemical characterization (including expression and purification) and latter for obtaining high-resolution structure and probing interactions. Once purified to homogeneity, the protein is taken for crystallization trials. If positive results are obtained, crystallization conditions have to be optimized to get a representative, high-quality crystals. Those are then taken to macromolecular crystallography beamline at Synchrotron light source for the diffraction data collection.
PROJECT2: Fluorophores having excellent photophysical characteristics were always in
demand in every area of natural and life sciences. First syntheses and characterization of boron-dipyrromethene fluorescent dyes were performed in 1968 but gained popularity quite recently. Their characteristics were real El Dorado in fluorescent tools as stated by Ziessel et al. (2007).
Due attractive fit in cell imaging it became an interesting aspect to investigate BODIPY interaction with proteins. One of the drawbacks of these molecules is their very low solubility in water, and their use in complex with proteins could be a smart way to overcome this problem.
Thus, the aim of this project is to develop a procedure for preparation of protein-BODIPY adduct and characterize it by a spectroscopic and crystallographic approach for probing protein-small molecule interactions. The choice of the protein was addressed toward proteins commercially available and well characterized as Bovine serum albumin (BSA). Emphasis is on spectroscopic characterization to investigate photophysical properties of the dye when incorporated in protein (optical spectroscopy approach) and structural insights to see the range of interactions and explore potential binding pocket (biocrystallographic approach). Applying hybrid methods gives a complete image of protein-small molecule behavior regarding photophysical and chemical stability, being a good starting point for further research in the area.
PROJECT1
Chapter 2 - Introduction
2.1 Biological importance and catalytic mechanism of Glutathione Reductase
Abundant in most organisms Glutathione Reductase (GR) or Glutathione Disulfide Reductase (GSR) is an enzyme that is conserved among all kingdoms, it has a well-defined role in cells and for a number of organisms, its enzymatic activity mechanism is well understood. Its key role is to resist an oxidative stress when needed and to control reducing environment of the cell. Indeed, it catalyzes the reduction reaction of glutathione disulfide (GSSG) to glutathione (GSH). [1]
Glutathione (γ-L-Glutamyl-L-cysteinyl-glycine) is a water soluble tripeptide. GSSG consists of two GSH molecules linked by the disulfide bridge, as shown in Figure 3A. Glutathione as a ubiquitous thiol-containing tripeptide participates in its reduced form (GSH) in several functions of vital importance to the cell. [2]
GR is a homodimer employing flavin adenine dinucleotide (FAD) and nicotinamide adenine dinucleotide phosphate (NADPH) to efficiently convert one molar equivalent of GSSG into two equivalents of GSH. The schematic mechanism is based on proton donation/acceptance as in Figure 3B. The enzymatic mechanism of GR is of ping-pong type and is connected to the reductive and oxidative half reaction. This process is facilitated by a few conserved residues which are discussed in details in proceeding sub-chapter.
GR catalytic activity is NADPH-dependent process involving cysteine (Cys) residues. Disulfide reduction reaction of GSSG to GSH is initiated by FAD through the nucleophilic attack. The process is based on sulfur biochemistry, thus it requires an electron relay that would link reducing NADPH with thiol/disulfide and thiol containing adapter molecule to transfer an electron to different acceptors (here GSH). [3]
2.2 Glutathione Reductase role in eukaryotes
The structure and function of GR in pro- and eukaryotes is well known for years. GR in plant eukaryotes is found in chloroplasts, mitochondria, and cytosol.
From functional aspect GR catalytic properties are essential for efficient removal of dangerous Reactive Oxygen Species (ROS) being, for instance, hydroxyl radicals (∙ OH), singlet oxygen (O12) and other electrophiles. In human cells it was reported that GR function is in fact much more than that, being responsible for metabolism and clearance of xenobiotics, regenerating antioxidants (such as vitamin C and E) to their active forms and acting as a cofactor in detoxifying enzymes. [1]
GR was first purified from baker’s yeast in 1955 by E. Racker at Yale, who also described electron donor properties of NADPH in this enzyme. Ten years later his group also verified a presence FAD and thiol group leading to the first mechanism proposal. Since then many molecular insights of this enzyme had been unrevealed along with structure determination at 3 Å resolution by Schulze et al. (1978) and up to now it remains an extensively studied flavoprotein. [4]
2.3 Abiotic stress defense in plants
ROS are generated in living organisms as byproducts of causal metabolic pathways. Abiotic and biotic stress is considered to be of critical importance in the maintenance of a cell cycle and homeostasis. Abiotic stress by simplest definition is a negative influence of non-living factors on the organism at specific conditions (here environment). This includes drought, flooding, radiation, temperature, nutrient access and wind. Each of these is unavoidable to some extent when we consider plants, and they speed up ROS formation in a cell. At low ROS levels, the cell performs its vital functions, such as cell growth, pathogenic defense and/or development. When this is not the case - thus ROS and oxidants are exceeding the levels of vital antioxidants - the resulting events may be severe for a cell, leading to protein, lipids, carbohydrates and/or nucleic acids damage. Not surprisingly this may cause cell malfunction and death.
Plants have developed powerful metabolic pathway in preventing ROS-related reactions – ascorbate-glutathione (AsA-GSH) cycle. The process starts with hydrogen peroxide
being reduced to water, utilizing ascorbate peroxidase (APX) with an ascorbate as an electron donor. Oxidized ascorbate radical gets reduced by monodehydroascorbate (MDAR) reductase but since it is a radical the reduction has to be very efficient, otherwise, dehydroascorbate and ascorbate are formed. This is the point where GSH is crucial to effectively convert dehydroascorbate into ascorbate with help of dehydroascorbate reductase (DHAR). After reduction step, GSH is oxidized to GSSG. Furtherly GSH is recovered by glutathione reductase, requiring NADPH as an electron donor.
The GSH/GSSG ratio has to be normally maintained in favor of GSH to effectively get through abiotic stress.
Figure 3. Scheme of redox reaction upon GR catalytic activity. (A) Simplified representation of sulfur biochemistry in 2GSH/GSSG. Withdrawal of electrons from thiol groups leads to formation of sulfur bridge, thus oxidized form of glutathione. (B) Global representation of redox reactions with participation of FAD-bound GR and accompanying oxidation of NADPH.
Flavoproteins plays a role of an electron relay, and reducing NADPH hence enters the cycle with the guidance of GR-FAD complex yielding 2 molecules of GSH. The scheme of this cycle is shown in Figure 3B. GSH furtherly serves as a reducing agent for disulfides and hydroperoxides or conjugates with 2-oxoaldehydes (2-OA) and electrophiles.
Summing up, disulfide reducing properties of GR makes it of critical importance in removal and/or conversion of electrophilic substances and xenobiotics. This process also demonstrates the adaptability of glutathione-based catalysis as an explanation of various chemical challenges in our understanding of evolution. [1]
2.4 Glutathione reductase structure and enzymatic characteristics
As shortly mentioned before GR crystal structure was determined in 1978 at 3 Å resolution by Schultz et al. and its characteristics was advancing through sequence assignment in 1981 (from crystallographic data at 2 Å by Thieme et al.), genetic screens and redox catalysis. Today GR is one of the best-understood enzymes. [5]
GR is a flavoenzyme belonging to the family of pyridine-nucleotide-disulfide-oxidoreductases. Despite the fact that it is found in certain isoforms in both pro- and eukaryotes it forms a stable homodimer with an approximate mass of ~110 kDa shown in Figure 4A. Each subunit contains two distinct Rossman folds accommodating FAD and NADPH. The flavin ring of a FAD molecule separates the binding sites for NADPH and their spatial orientation within an enzyme is presented in Figure 4B. In a case of GSSG, the binding takes place at the interface between GR monomers, implying that this enzyme is functional only in its homodimeric form. The cofactor binding domains are known from GR crystal structures of E. Coli, H. Sapiens, and S. Cerevisiae, where interface domain is known to be responsible for dimerization and comprises two regions involving residues located at C- and N-terminus of the protein. Significant sequence variation in GR structures occurs around position 75 (interface domain). In this region, E.Coli GR has an antiparallel intersubunit β-sheet from 71 to 80, H. Sapiens GR has an intersubunit disulfide bridge (C90–C90’), and S. Cerevisiae GR sequence from 73 to 88 formed more tight extended intersubunit antiparallel α-helices. The most important feature of the crystallized GRs is that they all contain an intersubunit in the active site. This bridge is opened when
NADPH binds to the oxidized enzyme. In this form, GR is capable of attacking GSSG and a mixed disulfide is formed.
It is commonly believed that GR structure by means of both substrate binding and the amino-acid sequence is well conserved in the course of evolution among all kingdoms. A small distinction is assumed for the subunit interface, yet as demonstrated in proceeding chapters plant GR enzyme differs quite significantly from human isoforms. Least conserved residues for a variety of organisms are Cys residues, playing usually regulatory role. [6]
In the context of function, GR being an oxidoreductase has three substrates, namely NADPH, H+ and GSSG and two products (2 molecules of GSH). Schematically its role in metabolism was already presented in Figure 3B. A similar observation can be withdrawn when considering isoforms balance, which for instance in yeast was reported to be regulated by translation initiation efficiency. [7]
GR high resolution structure has been reported for certain pro- and eukaryotic organisms varying from 1.55 Å up to 2.6 Å. It is essential to know sequence and structure similarities in order to confirm interactional features within an enzyme. Based on PBD search 8 structures from different organisms were taken under consideration being namely:
Yersinia pestis (gram-negative bacteria), Streptococcus mutans (gram-positive bacteria), Vibrio parahaemolyticus (gram-negative bacterium), Bartonella henselae
(proteobacterium), Saccharomyces cerevisiae (yeast), Plasmodium falciparum (protozoan), Escherichia coli (gram-negative bacteria) and Homo sapiens. This simply means there is no single structure being reported for plants.
Figure 4. GR homodimer with its binding sites from Escherichia coli. (A) Subunit representation of an enzyme and (B) FAD and NADPH spatial orientation within GR with surrounding residues. The catalytic activity is located at the interface between GRs monomers. Images generated with PDB viewer, PDB ID: 1GET
2.4.1 Reductive half-reaction of Glutathione reductase
Oxidized state GR (GRox) involves two cysteine (Cys47B and Cys42B for bacterial GR) residues forming disulfide bridge on the ‘back’ side of isoalloxazine ring of the FAD. The noteworthy disulfide bridge is in the proximity of histidine residue (His439A) which is hydrogen bonded to glutamic acid (Glu445A) – where both of these residues belong to the A subunit of GR homodimer. On the other side (facing NADPH) of flavin, there is also tyrosine residue which acts as a shield for FAD and stands for a gate-keeper at NADPH site. Once NADPH site is filled the tyrosine ring rotates away from flavin ring and locks the nicotinamide group of NADPH. Then hydride from NADPH reduces FAD to FADH -which furtherly transfer electron pair to the neighboring cysteine residue (Cys47B). This gives rise to stable charge transfer complex with a flavin ring. The other Cys residues are protonated by a histidine residue. [8][9] Up to this point, there is two-electron reduced enzyme (GRH2), NADP+ is then dissociated leaving space for another NADPH molecule. [10] Scheme of a simplified mechanism of this redox cycle is shown in Figure 5.
2.4.2 Oxidative half-reaction of Glutathione reductase
Oxidative part of enzymatic catalysis of GR starts with GSSG binding to reduced enzyme GRH2 accompanied by tyrosine residue reorientation, so that its hydroxyl group is pointing at disulfide bridge of GSSG. It also stabilized by other conserved residues from both subunits of homodimer – four positively and two negatively charged residues compensating substrate charge. Then the substrate is attacked by interchange residue Cysint (Cys47B) which in consequence forms a mixed disulfide bond. The His (His439A) residue withdraw the proton from Cysint accelerating the nucleophilic attack overall. Protonated His will then give off its proton in favor of one thiolate group of GSSG that is being reduced. The reaction is supposed to take place in accompany of Tyr residue. [9][11] Once the GSH group detaches from the active site, the mixed disulfide bond is being attacked by sulfur atom of CysCTC (CTC - Charge Transfer Complex) oxidizing GR back again. Second GSH molecule gets a proton from same His residue closing the cycle. The rate of these reactions was reported to be not constant in time, since one of the
protonation steps serve as a rate limiting step in terms of kinetics. [11][12] Nonetheless His plays influential role in GR enzymatic catalysis.
Current understanding of this process is rather well established, but still, there are many open questions about mechanistic details, including source and fate of protons, role of Tyr residue, which Cys residues are protonated by His and what is the order to this redox process, is it sequential or does it happen simultaneously?
2.5 Chlamydomonas reinhardtii as a model organism for GR studies
C. reinhardtii is a single-cell, eukaryotic green alga being soil and freshwater
abundant organism. Its cell wall is made of hydroxyproline-rich glycoproteins and has a large cup-shaped chloroplast with light-sensible eyespot. It is a very popular model organism in biology due to ease of culturing and simplicity of genetic manipulation. It also has notable cell cycle feature of growing photoautotrophically under light illumination and in the dark if organic carbon is supplied. Many questions in molecular biology were resolved with C. reinhardtii, demonstrating how do cells move, behave under light irradiation, recognize one another or react to changes in mineral nutrition. From the biotechnological view, it is a meaningful organism in biopharmaceuticals and biofuel production as well as a tool in hydrogen generation. [13]
There are many mutants of C. reinhardtii and they are extensively used for a study of various biological processes, like flagellar motility, photosynthesis or protein synthesis. These species are normally haploid so that the effects of mutations are seen immediately without further crosses. Those facts make this organism a very good fit for a comparative study of plant-based enzymes.
In C. reinhardtii GR is present in all cellular compartments, such as chloroplasts, mitochondria, endoplasmic reticulum, vacuoles, and cytosol. Chloroplast and mitochondrial GR is encoded by gr2, while gr1 encodes a protein that is found in the cytosol and peroxisomes (Kataya and Reumann, 2010). In Chlamydomonas reinhardtii there are two genes encoding GR: the product of GSHR1 is cytosolic, and the product of GSHR2 is plastidial (Merchant et al., 2007).
Chapter 3 - Methods and experimental fine points
This chapter deals with protein preparation, protocols and basic instrumental insights needed to determine the protein structure. Protein preparation, thus expression and purification were performed by the Plant Physiology group at Department of Pharmacy and Biotechnology (FaBit) of the University of Bologna.
3.1 Protein preparation and purification
The pET3 plasmids containing the cDNAs encoding Chlamydomonas reinhardtii proteins glutathione reductase 1 (GR1) and glutathione reductase 2 (GR2) were kindly provided by Dr. Stephane D. Lemaire from the Institut de Biologie Physico-Chimique (IBPC) in Paris (France).
Plasmids were introduced into BL21 E. Coli competent cells and positive clones from antibiotic selection were cultured in the LB (Luria-Bertani) medium. Culturing was done at 37 °C, over 16-18h with continuous shaking. About 8 mL of culture was transferred into 800 mL of fresh LB medium and again grown at 37 °C until an optical density of 0.4-0.5 at 600 nm was reached. Protein expression was induced by 0.2 mM IPTG and left for 3 hours for GR1 and for 16-18 hours for GR2 (at 30 °C). Then cells were harvested by centrifugation (8000 xg for 20 minutes), the pellet was washed with buffer and pelleted again before storage at -80 °C. Frozen pellet was re-suspended in binding buffer (20 mM Tris-HCl, 0.5 mM NaCl, 5 mM imidazole, pH 7.9) and taken for 3 cycles of French Press. Cell debris was removed by centrifugation and supernatant containing recombinant enzyme was recovered. Purification was done with Ni-NTA affinity column and after extensive washing with step-gradient concentration of imidazole (30 and 60 mM), the elution was performed in the presence of 250 mM imidazole. Eluted fractions were desalted using PD-10 columns (GE-Healthcare) equilibrated with Tris-HCl 30 mM, pH 7.9. Purified recombinant proteins were concentrated using Centricon filters and stored at -20 °C.
The electrophoretic analysis was done with SDS-PAGE with 12% acrylamide gels and stained with Coomassie Blue (40% ethanol, 12% acetic acid, 0.25% Coomassie Blue R-250). Bleaching was done with destaining solution (40% ethanol, 10% acetic acid).
3.2 Dynamic Light Scattering
To check the oligomeric state of the protein, Dynamic Light Scattering (DLS) measurements were performed. DLS is a technique that measures the dimension of particles in solution, in a submicron range. The measurement is based on relating Brownian motion to the size of a particle. The larger the particle the slower the Brownian motion. For the DLS measurement, the temperature has to be accurately known since it requires viscosity information for data evaluation. The velocity of the Brownian motion is defined by the translational diffusion coefficient. For this reason, it is essential to keep the temperature stable throughout the experiment.
The DLS spectrophotometer is constituted by a laser light source illuminating the sample contained in the cell, which causes the scattering of light recorded by the detector. It measures the time-dependent fluctuations in scattered light from a solution of molecules to determine the hydrodynamic radius (RH) from the Stokes-Einstein equation
d(H) = kT 3πηD Where:
d(H) – hydrodynamic diameter D – translational diffusion coefficient k – Boltzmann’s constant
T – absolute temperature η – viscosity
The diameter in DLS measurement is referred as how particle diffuse in a fluid thus it is named hydrodynamic diameter. This statement directly entails other parameters to be of high importance such as concentration and chemical character of a sample. The translational diffusion coefficient is dependent in fact on the size of the particle, ionic strength of the medium (affecting diffusion speed), surface structure (surface change can affect apparent size of the particle), and non-spherically shaped particles.
DLS from a physical point of view is dominated by the scattering phenomenon. This can be split into two elementary types of scattering being namely Rayleigh and Mie scattering. The first one says that if the particles are small compared to the wavelength of the laser used (typically ~600nm), then the light scattered from the particle will be isotropic. The
Rayleigh theory tells us that intensity of light scattered is inversely proportional to the particle diameter to the power of six
I ∝ d6 and
I ∝ 1 λ4
In practice, this means that if there is a hypothetic particle 50 nm in size it will scatter 106 as much light as a 5 nm particle. This implies a conclusion that light from large particles will suppress the light scattered from the small ones. Mie concept of scattering says that if the size of particles become similar to that of the wavelength of incoming light then a complex function of maxima and minima in respect to the angle is observed.
The DLS measurement to be reliable needs to be correlated with either two independent signals or same signal in a time domain in search for similarity degree. If the intensity of a signal is compared with itself at a particular point in time and a time much later, then for a randomly fluctuating signal it is obvious that the intensities are not going to be related in any way. Knowledge of the initial signal intensity will not allow the signal intensity at time t = ∞ to be predicted. However, if the intensity of a signal at time = t is compared to the intensity a very small time later (t + δt), there will be a strong relationship or correlation between the intensities of two signals. The two signals are strongly or well correlated. If the particles are large the signal will be changing slowly and the correlation will persist for a long time. If the particles are small and moving rapidly then the correlation will reduce more quickly. [14]
The DLS measurements were done with a Zetasizer Nano ZS, Malvern, with a laser source He-Ne (633 nm, 5 mW) at a temperature of 25 °C, in a 100 μL cuvette with 30 mM Tris-HCl 30 mM (pH 7.9), and the concentration of analyzed samples was 1 mg/mL for each protein (CrGR1and CrGR2). The correlator compares the intensity of scattering in subsequent time intervals and sends the data to a software to be analyzed. The reported hydrodynamic radii (RH) for each protein sample have been averaged from the values obtained from five measurements each one composed of ten runs of 10 seconds.
3.3 Crystallization
In XRD experiment it is crucial to have high-quality crystals. To achieve that many strategies have been explored with varying outcomes. Normally the protein purity is essential along with its properties under physiological conditions (such as solubility and activity). These properties make often crystallization rather unpredictable, thus requiring trials, and optimizations if satisfactory conditions are found.
Crystallization is a process purely dominated by the laws of the physical chemistry. In this context, there is no difference in crystallizing sodium chloride (NaCl) or macromolecular complex. The difference relies on a method of bringing the molecule of interest to the supersaturation level. While for low molecular weight compounds (either organic or inorganic) this is not considered a problem, for proteins the supersaturation level cannot be reached for example by simple solvent evaporation or extensive heating and dissolving. To crystallize means to gradually decrease the solubility of an analyte so that it will precipitate and eventually transition from liquid to solid phase would result in a crystalline material. Schematic phase diagram for protein is presented in Figure 6. The undersaturated region stands for a region of the soluble protein. Then the solution overcome the solubility curve entering the metastable region and even though in the supersaturated conditions the nucleation cannot take place, but when the crystalline nucleus are formed they can grow crystals. The labile zone is a region when crystals can nucleate and growth takes place quicker and is less stable. The last step in crystallization apart from nucleation and crystal growth is termination step. It takes place when supersaturation is lost due to solid phase formation and solubility curve is reached. Crystallization of proteins is normally facilitated through addition of several compounds affecting the physicochemical character of the solution, like for instance protein concentration, precipitating agent nature and concentration, ionic strength, pH,
temperature and dielectric constant of the solvent. The precipitant promotes macromolecule aggregation, by reducing solvation shell of the protein since they will compete for water molecules. To reach this there are few groups of compounds utilized, such as salts, polymers, and organic solvents. For example, salts will increase the ionic strength due to dissociation and will stabilize protein through interaction with solvent-accessible charged residues. Polymers increase molecular crowding. Polymer and protein will compete for water molecules brought by hydrogen bonds with hydroxyl moiety and eventually amplify protein-protein interaction. A similar mechanism is accepted for organics that withdraw the water molecules form solvation shell of the macromolecule. Next important compositional feature of crystallization solution is the buffer that determines pH. Its value affects the charge distribution on a protein surface (pKa and pI values). The pH range is also critical for protein stability. The crystallization solution composed of precipitant, buffer and salt/additive is commonly referred as a reservoir solution. Last crucial parameter in crystallization is the temperature since it directly affects the protein solubility and crystal growth rate. It is necessary to keep it constant to have controlled crystallization growth conditions.
Up to now, there are certain methods for carrying out crystallization step and this includes vapor diffusion, micro batch, dialysis and free-interface diffusion.
Vapor diffusion is found to be very effective method for macromolecule crystallization and rely on a straightforward principle. The protein sample and respective reservoir solution chosen for crystallization are placed on a siliconized coverslip (in a small volume) and left for vapor equilibration with ‘mother solution’ being reagent mixture in sizeable volume (with respect to the drop). The scheme of such setup is presented in Figure 7 for the case of a hanging drop. The equilibration is finalized when the concentration of the reagent in the drop is equal to the one in the reservoir (here water leaving the drop). As the concentration of protein gradually increases it eventually reach supersaturation domain and starts to either
Figure 7. Scheme of a hanging drop vapor diffusion method.
crystallize or precipitate – salting out. This strategy is cost effective, allows for many experiments at once and gives easy access to the crystals. [15]
Batch crystallization is based on mixing the protein sample with reservoir solution in a small amount to form a micro-drop that is then covered with an oil to avoid or limit evaporation. The oil diffusive properties are varying, for example covering micro-drop with paraffin oil reduce the diffusion completely while AI’s oil (1:1 mixture of silicon and paraffin oil) will permit some extent of diffusion, hence bringing protein to the supersaturated state. In dialysis crystallization method, the protein solution is equilibrated against a large volume of reservoir solution through a membrane. The gradual increase of precipitant concentration will eventually lead to nucleation zone and crystal growth of the protein. Last, most effective (probably) and not accessible method is a crystal growth in microgravity conditions. The advantage of this approach is the reduction of a convective motions and sedimentation, meaning the crystal growth is more uniform, fewer contaminants present within the crystal and most importantly the quality of the crystals was reported to be of outstanding quality. Many successful and interesting examples of this method are listed in [16].
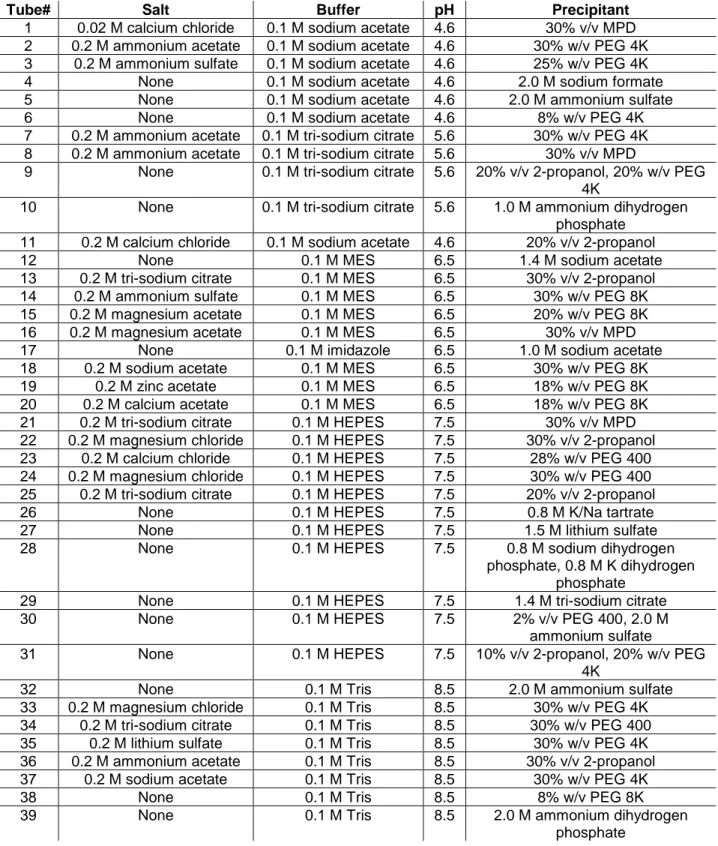
Crystallization experiments were manually performed by the hanging drop vapor diffusion method, using a 24-well Linbro plate from Molecular Dimension. For the trial crystallization Structure Screen 1 cacodylate free from Molecular Dimensions had been used (MD1-01-CF). It contains 50 screening solutions and most of them were tested. The reservoir solution compositions of MD1-01-CF is presented in Table 1 and extensive kits can be found in an additional information 1. For optimization, two extra kits were applied: JCSG-plus (MD1-37) from Molecular Dimensions and Crystal Screen 2 from Hampton Research by picking a tailored composition. Some optimizations required manual preparation and are indicated as ‘manual’ in this work.
The protein solution was maintained at a concentration of 10 mg/mL for all crystallization trials and was suspended in buffer and 2% EDTA solution. 2 μL of protein was placed on a siliconized coverslip and mixed with another 2 μL of mother solution from the reservoir (700 μL). Each well was vaseline-sealed and left in an incubator at 20 ± 1 °C. Control check was done every week under an optical microscope (Leitz Wetzlab SM-LUX) equipped with a digital camera Motic 5.0 MP. Figure 8A presents prepared plates for GR1
and 8B for GR2 for crystal screen and Figure 8C presents optimized conditions for GR1. A number of crystallization trials differ for GR1 and GR2 due to different volumes available at given time.
Table 1. Structure Screen 1 cacodylate free - tube composition used for crystallization trials.
Tube# Salt Buffer pH Precipitant
1 0.02 M calcium chloride 0.1 M sodium acetate 4.6 30% v/v MPD 2 0.2 M ammonium acetate 0.1 M sodium acetate 4.6 30% w/v PEG 4K 3 0.2 M ammonium sulfate 0.1 M sodium acetate 4.6 25% w/v PEG 4K
4 None 0.1 M sodium acetate 4.6 2.0 M sodium formate
5 None 0.1 M sodium acetate 4.6 2.0 M ammonium sulfate
6 None 0.1 M sodium acetate 4.6 8% w/v PEG 4K
7 0.2 M ammonium acetate 0.1 M tri-sodium citrate 5.6 30% w/v PEG 4K 8 0.2 M ammonium acetate 0.1 M tri-sodium citrate 5.6 30% v/v MPD
9 None 0.1 M tri-sodium citrate 5.6 20% v/v 2-propanol, 20% w/v PEG 4K
10 None 0.1 M tri-sodium citrate 5.6 1.0 M ammonium dihydrogen phosphate
11 0.2 M calcium chloride 0.1 M sodium acetate 4.6 20% v/v 2-propanol
12 None 0.1 M MES 6.5 1.4 M sodium acetate
13 0.2 M tri-sodium citrate 0.1 M MES 6.5 30% v/v 2-propanol 14 0.2 M ammonium sulfate 0.1 M MES 6.5 30% w/v PEG 8K 15 0.2 M magnesium acetate 0.1 M MES 6.5 20% w/v PEG 8K 16 0.2 M magnesium acetate 0.1 M MES 6.5 30% v/v MPD
17 None 0.1 M imidazole 6.5 1.0 M sodium acetate
18 0.2 M sodium acetate 0.1 M MES 6.5 30% w/v PEG 8K
19 0.2 M zinc acetate 0.1 M MES 6.5 18% w/v PEG 8K
20 0.2 M calcium acetate 0.1 M MES 6.5 18% w/v PEG 8K 21 0.2 M tri-sodium citrate 0.1 M HEPES 7.5 30% v/v MPD 22 0.2 M magnesium chloride 0.1 M HEPES 7.5 30% v/v 2-propanol 23 0.2 M calcium chloride 0.1 M HEPES 7.5 28% w/v PEG 400 24 0.2 M magnesium chloride 0.1 M HEPES 7.5 30% w/v PEG 400 25 0.2 M tri-sodium citrate 0.1 M HEPES 7.5 20% v/v 2-propanol
26 None 0.1 M HEPES 7.5 0.8 M K/Na tartrate
27 None 0.1 M HEPES 7.5 1.5 M lithium sulfate
28 None 0.1 M HEPES 7.5 0.8 M sodium dihydrogen
phosphate, 0.8 M K dihydrogen phosphate
29 None 0.1 M HEPES 7.5 1.4 M tri-sodium citrate
30 None 0.1 M HEPES 7.5 2% v/v PEG 400, 2.0 M
ammonium sulfate
31 None 0.1 M HEPES 7.5 10% v/v 2-propanol, 20% w/v PEG
4K
32 None 0.1 M Tris 8.5 2.0 M ammonium sulfate
33 0.2 M magnesium chloride 0.1 M Tris 8.5 30% w/v PEG 4K 34 0.2 M tri-sodium citrate 0.1 M Tris 8.5 30% w/v PEG 400 35 0.2 M lithium sulfate 0.1 M Tris 8.5 30% w/v PEG 4K 36 0.2 M ammonium acetate 0.1 M Tris 8.5 30% v/v 2-propanol 37 0.2 M sodium acetate 0.1 M Tris 8.5 30% w/v PEG 4K
38 None 0.1 M Tris 8.5 8% w/v PEG 8K
39 None 0.1 M Tris 8.5 2.0 M ammonium dihydrogen
40 None None - 0.4 M K/Na tartrate
41 None None - 0.4 M ammonium dihydrogen
phosphate
42 0.2 M ammonium sulfate None - 30% w/v PEG 8K
43 0.2 M ammonium sulfate None - 30% w/v PEG 4K
44 None None - 2.0 M ammonium sulfate
45 None None - 4.0 M sodium formate
46 0.05 M potassium dihydrogen phosphate
None - 20% w/v PEG 8K
47 None None - 30% w/v PEG 1.5K
48 None None - 0.2 M magnesium formate
49 0.2 M lithium sulfate None - 2% w/v PEG 8K
50 0.2 M lithium sulfate None - 15% w/v PEG 8K
Figure 8. Scheme of well numbering with a color indication respective to the crystallization kit used for GR1 and GR2 crystallization trials and optimizations.
3.4 Principles of Single Crystal X-ray Diffraction 3.4.1 X-ray Diffraction
Single crystal X-ray diffraction is an analytical technique used for determining the atomic and molecular structure of a crystal. Crystalline material causes diffraction of an X-ray beam directed onto it. Once the crystal is grown it is mounted on a goniometer in order to place it in certain positions with respect to the incident beam (exemplary image provided in discussion chapter). Gradual rotation of a crystal gives a set of specific diffraction patterns. When focused, monochromatic and, coherent X-ray beam hits the crystal it will scatter light in many directions, appearing on a detector as regularly spaced spots – called reflections. Each of those is located at a specific position from the origin and has some intensity. Spots are named reflections because each of them corresponds to an X-ray beam reflected from an individual and evenly spaced planes within a crystal. Since the image is two-dimensional, and the ultimate aim is to get three-dimensional electron density map of the molecule determining the scattering, those images are taken at many different crystal orientations.
The X-ray diffraction is described by the Bragg’s law of diffraction (graphical representation in Figure 9). In Bragg’s model, each reflection has a set of evenly spaced planes in the crystal, passing through the centers of the atoms
of the crystal lattice. These planes are classified with Miller indices (h,k,l) (or formally reciprocal lattice vector components) and spacing between the planes d. Bragg proposed that X-rays are scattered ‘mirror-like’ from the planes. As a consequence of this assumption, the beam scattered from adjacent planes will interfere constructively when the angle θ (between the plane and the beam) will result in path-length difference equal to integer multiple n of the beam wavelength.
Figure 9. Graphical representation of the Bragg diffraction from a crystal with evenly spaced planes.
2d sin θ = nλ
In more practical terms, reflection is indexed when Miller indices are established from known wavelength and scattering angle 2θ. This operation gives unit-cell dimensions, angles, and the space group. To obtain all the data required for structure determination that information has to be complemented by Fourier transform calculations that take into account relative intensities of the reflections. [17][18][19]
A Fourier transform is a mathematical method for decomposing a signal into the frequencies that make it up. In spectroscopic analysis (or any other practical applications) this operation can be reversed to Fourier synthesis of a frequency domain representation that combines the contributions of all the different frequencies to recover the original function of time. This combined with chemical knowledge of a protein is essential in processing the electron density map to get valuable insights into a structure.
From more theoretical approach the electron density f(r) throughout the crystal is assessed, where r corresponds to a three-dimensional position vector within the crystal. To reach this there is a need to collect all the data about its Fourier transform F(q), and then invert it mathematically (Fourier synthesis) in order to access the density defined in a real space. This is done with the formula
f(r) = 1
(2π)3∫ F(q)e iq∙rdq
where the integral is calculated over all values of q. The vector q in a real space represents a point in reciprocal space, meaning it corresponds to a specific oscillation in electron density as one move in the direction in which q is pointing. The length of q resembles 2𝜋 divided by the oscillation wavelength. Then the Fourier transform will be expressed as
F(q) = ∫ f(r) e−iq∙rdr
And here the integral is taken over all possible values of the position vector r in the crystal. The Fourier transform result is normally a complex number, that has a magnitude |F(q)| and phase φ(q) with the relation
F(q) = |F(q)|eiφ(q)
X-ray diffraction experiment gives the intensities of the reflections, thus magnitudes |F(q)| but does not provide any information about the phases φ(q). There are certain methods
to overcome this problem and its choice depends on the information available. Molecular Replacement (MR) is one way to go and is used only when a similar structure (threshold of ~30% for protein identity) is known. The model helps in regulating and determining molecule position and orientation. Here, the protein taken into consideration has similar structures characterized and uploaded on PDB, hence molecular replacement was found to be a good solution for the phase problem and allowed for electron density map generation. Other methods for solving the phase problem include:
• Multiple Isomorphous Replacement (MIR) – where new diffracting centers are introduced to the lattice by soaking the crystal in a solution containing heavy atoms (and since they are electron-rich the contribution to the diffraction diagram will be pronounced).
• Single or Multi-wavelength Anomalous Diffraction (SAD or MAD) – these two methods are based on an anomalous scattering of the inner electrons of heavy atoms. Here heavy atoms are considered those that can be naturally present in the protein as a cofactor or an amino acid (such Fe atoms or selenomethionine) and will absorb X-rays at a particular wavelength (absorption edge) and emit them with some delay. This delay causes phase shift that helps to localize them within the structure.
3.4.2 Synchrotron radiation source
X-ray is a type of an electromagnetic radiation, generated in parcels of energy called photons. Its range of wavelength is between 0.01 and 10 nm. They are divided into two different-in-energy waves, first one called soft x-ray, and higher in wavelength called hard x-ray. The energy range of x-rays lays in a range from 100 eV up to 100 keV. From a physical point of view, there are two atomic processes that are responsible for x-rays generation. The first one called white radiation (or Bremsstrahlung radiation), and the second one being K-shell emission. Both of those are related to heavy atoms elements and choice of an element depends on energy/application required. Due to their penetrating nature, they found to be an excellent tool for probing morphology of matter. [20] In scientific research, synchrotron radiation is preferred for an analysis due to its excellent properties.
Synchrotron radiation is a special type of light generation source in wide wavelength range and is considered as one of the most powerful radiation sources due to its collimation and linear polarization. [21] By definition synchrotron is a particle accelerator in which leading magnetic field is time-dependent, and as the name suggest particle beam is traveling in a synchronized path. If particles enriched with high energy are in rapid motion and travel in a curved path (induced by the
magnetic field) the synchrotron radiation is generated (as an energy loss in a form of a photon). The scheme of a synchrotron light source is presented in Figure 10. The radiated power is given by the relativistic Larmor formula while the force on the emitting electron is given by the Abraham–Lorentz–Dirac force. The radiation pattern can be distorted from isotropic dipole pattern into an extremely forward-pointing cone of radiation. Synchrotron radiation is the brightest artificial source of X-rays. The planar acceleration geometry appears to make the radiation linearly polarized when observed in the orbital plane, and circularly polarized when observed at a small angle to that plane.
The magnetic field in the synchrotron is varying in time in order to accelerate particles if almost relativistic speed is reached then the frequency of the electromagnetic field is adjusted to follow their abnormal circulation time. The objective is to adapt parameters in such a way that as particles gain energy, all of them reach the same (thus constant) circulation path. The advantage of such design is vacuum chamber in shape of a thin torus (or ring). The profile of the ring makes more efficient use of a magnetic field. The toroid shape of large scale synchrotrons was found to follow strong focusing principle. [22]
The principal structures found at synchrotron are common for every facility of this kind (any details given here are associated
to ESRF – European
Synchrotron Radiation Facility in Grenoble). First, the storage ring, is an element giving characteristic shape to the facility. It is almost 900 m long tube, where electrons are kept at relativistic speeds and consequently have to be kept at low pressures (~10-9 mbar). As they travel in the ring they pass through different types of magnets (described below) to ultimately generate x-rays. Booster synchrotron is an element responsible for accelerating electrons before being injected to the storage ring. Having around 300 meters pre-accelerator must give an energy of 6 billion electron volts (6 GeV) to the particles. It is in use only a few times a day for few minutes when storage ring needs to be re-filled. It can inject parcels of 6 GeV electrons every 50 ms.


![Figure 5. Schematic representation of oxidative and reductive half reaction of GR. Image taken from [1]](https://thumb-eu.123doks.com/thumbv2/123dokorg/7421660.98983/27.918.108.814.302.652/figure-schematic-representation-oxidative-reductive-reaction-image-taken.webp)