Alma Mater Studiorum - Università di Bologna
SCUOLA DI SCIENZE
Dipartimento di Chimica Industriale “Toso Montanari”
Corso di Laurea Magistrale in
Chimica Industriale
Classe LM-71- Scienze e Tecnologie della Chimica Industriale
Synergistic Catalysis: Michael
addition of acyl-pyridines
Tesi di laurea sperimentale
CANDIDATO
Cecilia Poderi
RELATORE
Prof. Andrea Mazzanti
CORRELATORE
Dr. Ramon Rios Torres
___________________________________________________________________________________________________________
Anno Accademico 2016-2017
Abstract
A new diastereo- and enantioselective strategy for the functionalization of 2-acetyl-pyridine with α,β-unsaturated aldehydes has been investigated through synergistic catalysis. In particular, the aim of the work was to use cinnamaldehydes bearing different substituents on the phenyl group and to study its effect on the yield, conversion and stereoselectivity of the reaction. The reaction mechanism involves combined iminium ion and transition metal catalysis in a synergistic fashion and proceeds with two consecutives Michael additions, followed by final intramolecular aldol condensation to yield the formation of three new stereogenic carbons, with high to excellent stereoselectivities. The structures of the molecules obtained were fully characterized by NMR spectroscopy. After having assigned the relative configuration by NOE-NMR and 2D-COSY experiments, conformational analysis was performed by DFT calculations to find the most stable molecular conformations. The absolute configuration of each diastereoisomer was then eventually assigned by quantum mechanical simulations of the Electronic and Vibrational Circular Dichroism spectra.
Abstract
In questo progetto è stata sviluppata una strategia di funzionalizzazione diastero- ed enantioselettiva di 2-acetil-piridina con aldeidi cinnamiche α,β-insature attraverso catalisi sinergica. In particolare, lo scopo del lavoro è stato quello di utilizzare aldeidi cinnamiche con diversi gruppi sostituenti sul fenile e studiarne l’effetto sulla resa, sulla conversione e sulla stereoselettività della reazione. Il meccanismo di reazione prevede due cicli catalitici separati che combinano immino-catalisi e organometallo-catalisi, e la reazione procede tramite due addizioni di Michael consecutive seguite da una condensazione aldolica intramolecolare, portando alla formazione di tre centri stereogenici con elevati eccessi enantiomerici. La struttura delle molecole ottenute è stata determinata tramite spettroscopia NMR assegnando la configurazione relativa attraverso esperimenti NOE-NMR e 2D-COSY; in seguito è stata svolta l’analisi conformazionale tramite calcoli DFT, ottenendo la conformazione molecolare più stabile. La configurazione assoluta di ogni diastereoisomero è stata successivamente attribuita tramite simulazioni quanto meccaniche degli spettri di Dicroismo Circolare Elettronico e Vibrazionale.
Index
1 Introduction ... 1
1.1 Asymmetric organic synthesis ... 2
1.2 Enantioselective organocatalysis ... 3
1.3 Multicatalysis ... 6
1.3.1 Synergistic catalysis ... 7
1.3.2 Transition-metal and iminium catalysis ... 8
1.4 Domino reactions ... 12
2 Aim of the thesis ... 14
3 Results and Discussion ... 16
3.1 Scope of reaction with enals ... 16
3.2 Reaction with 2-propyonil-pyridine ... 20
3.3 Identification and characterization ... 22
3.3.1 HPLC purification ... 22
3.3.2 Characterization of compound 3i-major ... 23
3.3.3 Characterization of compound 3i-minor ... 34
3.3.4 Characterization of compound 3f-major ... 45
3.3.5 Characterization of compound 3f-minor ... 49
4 Conclusions... 52
5 Experimental Part ... 53
5.1 General ... 53
5.2 Procedures and spectroscopic data of synthesized compounds. ... 54
6 Appendix ... 70
6.1 Density Functional Theory (DFT) ... 70
6.2 Electronic Circular Dichroism (ECD) ... 72
6.3 Vibrational Circular Dichroism (VCD) ... 75
1
1 Introduction
This thesis is focused on the development of a new enantioselective synthetic strategy for the synthesis of pyridine derivatives, containing three stereogenic centres.
The first part of this project has been carried out at the University of Southampton under the supervision of Dr. Ramon Rios Torres. During this period, we performed the synthesis of the desired products and the characterizations by means of 1H-NMR, 13 C-NMR, HRMS, OR, HPLC and IR, with the support of Gabriela Sitinova. Afterwards, we investigated relative and absolute configurations of the products at the University of Bologna by means of 2D-COSY and NOE-NMR experiments, ECD and VCD spectroscopies supported by quantum mechanical calculations.
2
1.1 Asymmetric organic synthesis
Natural compounds often present very complex scaffolds with a well-defined three-dimensional structure. This complexity is generally correlated with a defined stereochemistry of the products. Thus, the synthesis of chiral compounds has become an important issue in organic chemistry. Furthermore, chirality plays an important role in determining the characteristics of a substance. In fact, although the structures of two enantiomers are similar, each one individually could show different biological activity and different properties, such as pharmacokinetics, toxicology etc.(1) An evident example is drug Thalidomide (Figure 1), prescribed in the 1950’s as sleeping drug and sedative for pregnant women. Unfortunately, it was not known that, while the (R)-thalidomide presents sedative properties, the (S)-thalidomide shows teratogen effects, involving the initiation of functional and structural disabilities.(2)
Figure 1. Thalidomide enantiomers structures.
For this reason, the opportunity to achieve enantiopure products through asymmetric synthesis has become a mandatory target in organic chemistry. Asymmetric synthesis is defined as a method for the preparation of chemical compounds, which aims to bias the synthesis in favor of producing one enantiomer over another one.
In order to improve asymmetric synthesis a catalytic strategy has to be used in many cases. Catalysis consists in a powerful method that improve the efficiency, sustainability and economicity of a chemical process and could be also used to discover new chemical reactions.
In particular, this thesis was focused on enantioselective catalysis, consisting in a kind of catalysis that allows the obtainment enantiopure products using a substechiometric amount of catalyst.
3
1.2 Enantioselective organocatalysis
The purpose of enantioselective catalysis is to control the stereochemistry of a reaction and obtain enantiopure products by means of an organic catalyst, instead of obtaining a racemic mixture.
The increasing number of diseases leads to the necessity of synthesizing new chiral and non-racemic compounds as pharmaceuticals. However, synthesis of drug candidates with one or more non-racemic asymmetric centres is difficult to achieve with classical asymmetric methods. Thus, new enantioselective strategies are required to achieve this target.(3) The conventional synthetic methodologies employed to obtain chiral molecules involve the use of asymmetric metal complexes as catalysts.(4) However, such transformations are not applicable on the industrial scale. In fact, the efficiency, simplicity and economicity of these methods have to be improved when it needs to be used in pharmaceutical synthesis. For this reason, over the past ten years, the field of enantioselective organocatalysis has gained a significant impact in chemical synthesis.(5) Even if these strategies are still in progress, their reproducibility to a large amount of reactions makes it complementary to the conventional ones.
Organocatalysis has several advantages comparing with metal catalysis, such as a fewer toxicity, economicity and sustainability. In addition, most of the organocatalytic reactions are often easier to perform.(5)
Five different types of organocatalysis can be distinguished: a) secondary amine catalysis via enamines; b) secondary amine catalysis via iminium ions; c) phase transfer catalysis; d) nucleophilic catalysis and Brønsted base catalysis; and e) H-bonding catalysis (Scheme 1).
4
Scheme 1. Examples of: a) secondary amine catalysis via enamines;(6) b) secondary amine catalysis via iminium ions;(7) c) phase transfer catalysis;(8) d) nucleophilic catalysis and Brønsted base catalysis(9) and e) H-bonding catalysis.(10)
Aminocatalysis consists in a type of organo-catalyzed synthesis that employs primary or secondary amines, involving the formation of an iminium ion or an enamine intermediates. While the enamine intermediate increase the electron density on the -carbon encouraging the electrophile attack (Figure 2b), the iminium ion decrease the electron density at the carbonyl atom activating the -carbon at the nucleophile attack
5 (Figure 2a).(11) The formation of the enamine intermediate occurs when a secondary amine reacts with a carbonyl compound through dehydration, while iminium catalysis occurs when a secondary amine reacts in presence of an α,β-unsaturated compound.
Figure 2. a) Iminium ion and b) enamine intermediates.
If a stereogenic centre is introduced on the secondary amine, this can induce an enantioselective iminium-catalysed addition. There are different kinds of chiral catalysts used for aminocatalysis, such as Jørgensen-Hayashi catalyst,(12) MacMillan catalysts(13) and proline.(14)
Enantioselective aminocatalysis combined with transition-metal catalysis in a synergistic fashion is known as a powerful strategy for the synthesis of potential targets, improving the efficiency of the synthesis.(15) For this reason, a new multicatalytic methodology combining aminocatalysis and metal Lewis catalysis has been explored in this project. In the next section the principal types of multicatalysis will be discussed, with a particular focus on transition metal and iminium catalysis methodologies, which were employed in this work.
6
1.3 Multicatalysis
Enantioselective multicatalysis is a key towards sustainable synthetic strategies, which are becoming more and more used in organic chemistry. It consists in the combination of two catalytic cycles that conclude into one final product. Multicatalysis can be classified into four types, as shown in Figure 3.(9) Bifunctional catalysis a) consists in both electrophile and nucleophile that are activated by the same catalyst but from two different sites. Cascade catalysis b) occurs when the starting reagent is activated sequentially from two different catalysts and then attached by a nucleophile. Double activation catalysis c) involves the activation of a single starting material by two different catalysts and successively attached by a nucleophile and for this reason is very similar to the previous one. Finally, synergistic catalysis d) consists in two different catalysts that activate two different starting materials by two catalytic cycles, concluding into one product.(16)
7
1.3.1 Synergistic catalysis
This project was based on synergistic catalysis as methodology for the synthesis of enantioselective compounds. This synthetic strategy presents many benefits, such as the opportunity to perform previously unachievable chemical transformations, the improvement of the efficiency of existing reactions and an higher enantioselectivity. Thus, synergistic catalysis became rapidly a powerful method used by different research groups.(16a) The aim of this kind of catalysis is to create two reactive species, one with higher HOMO (nucleophile) and the other one with lower LUMO (electrophile) comparing with the starting reagents (Figure 4).(15)
Figure 4. HOMO-LUMO energy levels in synergistic catalysis.
Another advantage is that the catalytic cycles can be optimized separately, since the modification of one catalyst does not affect the other. Despite the many benefits of synergistic catalysis, it has some disadvantages as well, such as auto-quenching, concentrations of the catalytic species and mostly in terms of economy, when using two catalysts to create one single bond is less efficient than mono-catalytic reactions. Usually in nature, the large structure of the proteins allows separating the catalytic sites and overcoming the problem, but this does not happen in laboratory experiments. Organic chemistry overcame this problem by a careful selection of the catalysis; as example, in recent years a new method using transition metal catalyst and organic catalysis has been studied, showing a high compatibility.(15b) In the next paragraphs the mechanisms and the most important synergistic catalysis studies using the combination of transition metal and iminium catalysis is reported.
8
1.3.2 Transition-metal and iminium catalysis
MacMillan and co-workers in 2000 reported the first example of enantioselective iminium catalysis, performing a Diels Alder cycloaddition via enal activation, using a secondary amine as catalyst.(13)
The mechanism involved the formation of the E-iminium ion (XXII) to avoid interactions between the double bond of the carbonyl-compound and the methyl substituents of the catalyst. Furthermore, the benzyl group blocks the Re-face forcing the Si-face attack (Scheme 2).
Scheme 2. Mechanism of Diels Alder cycloaddition via enal activation by MacMillan.
Synergistic catalysis combining amino-catalysis and transition metal catalysis has been known only using enamine and transition metal catalysis since Cordova’s report from 2006.(15b) However, while enamine catalysis only allows electrophilic reactions, iminium catalysis expands amino-catalytic reactions, introducing nucleophilic additions.
Cordova in 2011 reported the first example of combined iminium catalysis and transition-metal catalysis for an enantioselective silyl addition to enals, based on MacMillan’s work (described above). The reaction was afforded with high yield and good enantioselectivity (Scheme 3).(17)
9
Scheme 3. Enantioselective silyl addition to enals by Cordova et al.
Later, Cordova and co-workers used the same method to perform a β-alkylation of enals using dialkyl-zinc reagent and Jørgensen catalyst (XXIX) as shown in Scheme 4.(18) The mechanism involved a transmetalation between the dialkyl-zinc reagent and the copper (I) salt, which generated an organocuprate compound. The organocuprate compound reacted with the activated iminium form of the enal. In order to improve the enantio- and regioselectivity Cordova and team used different copper ligands, finding out that triphenylphosphine led to the best results.
Scheme 4. β-alkylation of enals by Cordova.
One of the most important examples reported in the literature was developed by Rios group, involving the activation of azaarenes by combined metal Lewis acid and iminium catalysis (Scheme 5).(15c)
10
Scheme 5. Benzoxazole β-addition to enals by Rios.
This method relied on the alkylazaarene activation through coordination of metal to the aromatic nitrogen. Then, activated azaarene (XXXVII) would attack the enal (XXVII), which was previously activated via iminium catalysis. An accurate screening of metal Lewis acid was made in order to select the metal with higher efficiency. palladium(II)acetate showed good results, achieving low diastereoselectivity, good enantioselectivity and satisfying yields, when an electron-withdrawing group is installed on the benzoxazole ring.
The proposed mechanism of this reaction is reported in Scheme 6.
11 Recently, a cascade synergistic diastereo- and enantioselective functionalization of alkyl quinolines using α,β-unsaturated aldehydes has been explored by Jørgensen and co-workers (Scheme 7).(19) This new activation method allowed obtaining products with good yields and good enantioselectivity (XL).
Scheme 7. Synergistic diastereo- and enantioselective functionalization of
12
1.4 Domino reactions
Enantioselective construction and preparation of natural compounds could result a big challenge for organic chemistry. In fact, building a very complex three-dimensional structure requires the development of new powerful synthetic strategies, involving catalytic cycles. Organocatalytic domino reactions(20) are one of the common economic and effective approaches that follow the rules of green and sustainable chemistry.(21) According to Tietze, a domino reaction is defined as a reaction in which two or more bond-forming transformations occur on the base of the functionalities formed in the previous steps. It is not allowed to make any change in the reaction, such as an addition of reagents or other additives or conditions modification.(22)
The efficiency of such reaction can be determined by the number of bonds generated, which leads to a complexity increase. The reactions can be performed as single, two, or multicomponent transformations, depending on how many reagents are used in the process.(23) The use of two-component and multicomponent domino reactions in organic synthesis is increasing constantly. Most of the examples of known domino reactions involve the use of chiral amines as catalyst,(24) which are ideal for the design of new asymmetric organocatalytic reactions and for the development of new catalytic cascade processes. Usually, domino reactions are distinguished by the type of reaction step and also by the type of activation mode.
In particular, Michael-Aldol domino reactions found a great amount of applications in organic synthesis. The first report of domino asymmetric process appeared in early 2000s from Barbas research group and involved combining iminium ion and enamine activation.(25) In 2007, Jørgensen and co-workers reported a powerful domino reaction between malononitrile and unsaturated aldehydes, consisting in an enantioselective Michael–Michael-Aldol reaction that built cyclohexenes in excellent yields and enantio-selectivities, but in moderate to good diastereoselectivities.(26)
Considered the state of art, in 2010, Rios et al. developed a Michael-Michael-Aldol domino enantioselective synthesis of spiro-compounds. High diastereo- and enantioselectivity were obtained, using Jørgensen-Hayashi catalyst (XXIX), in the presence of benzoic acid (Scheme 8).(27)
13
Scheme 8. Mechanism of spiro-cyclisation by Rios.
The mechanism consisted of two consecutives Michael additions catalysed by iminium ion intermediates. After the second Michael addition an intramolecular aldol condensation occurred, and thanks to the final dehydration it led to the desired product (XLV). In this project a similar kind of reaction mechanism was investigated, which will be described in the next section.
14
2 Aim of the thesis
Based on the state of art regarding synergistic catalysis and domino reactions,(19,27) this work was focused on the development of a new enantioselective strategy for the synthesis of pyridine derivatives, via domino Michael-Michael-Aldol reaction.
An asymmetric functionalization of 2-acetyl-pyridine (1) with α,β-unsaturated carbonyl compounds (2) by means of iminium ion and transition metal synergistic catalysis was reported. In order to verify the reproducibility and applicability of this reaction the synthesis using cinnamaldehydes bearing different substituents on the phenyl groups was studied (Scheme 9).
Scheme 9. Functionalization of 2-acetyl-pyridine with different cinnamaldehydes.
A mechanism involving synergistic catalysis was proposed, consisting in two catalytic cycles where the organic catalyst is the Jørgensen-Hayashi pyrrolidine (2-diphenyl-trimethylsilyloxy-methyl-pyrrolidine), and the other catalyst is a metal Lewis acid Zn(acac)2 (Scheme 10). Both configuration of Jørgensen catalyst (R) and (S) (XXIX)
15
Scheme 10. Proposed catalytic cycle of β-functionalization of 2-acetyl-pyridine with
cinnamaldehyde.
As evident from Scheme 10, the process occurs by Michael-Michael-Aldol reaction, yielding to the creation of three stereogenic centres.
A complete characterization of the final compounds (3) was performed, including the determination of the relative and absolute configurations, which were assigned by 2D-COSY and NOE-NMR experiments, and using Electronic and Vibrational Circular Dichroism (ECD and VCD) and comparing experimental results with that obtained by quantum mechanical calculations (TD-DFT and DFT).
16
3 Results and Discussion
3.1 Scope of reaction with enals
Using conditions determined from a previous reaction screening (Zn(acac)2 and benzoic
acid dissolved in dichloromethane, at room temperature up to four days) a reaction scope employing cinnamaldehydes bearing different substituted phenyl groups (2) was studied (Scheme 11). The reactions were conducted using the enantiopure organo-catalysts
XXIX, obtaining the two diastereoisomeric products (3).
Scheme 11. Functionalization of 2-acetyl-pyridine (1) with different cinnamaldehydes (2).
The reaction occurred through the synergistic catalytic mechanism shown in Scheme 12, using a metal Lewis catalyst and an organo-catalyst to activate the starting materials. The 2-acetyl-pyridine (1) interacts with the Lewis acid Zn(acac)2, which coordinates the
oxygen and the nitrogen increasing the nucleophilicity of the α-carbon (5). Simultaneously, the Jørgensen catalyst reacts with the cinnamaldehyde yielding the iminium ion where the double bond is on the opposite side of the bulky substituent of the
17 secondary amine (6). Thanks to the iminium ion formation, the -carbon is activated to the nucleophile attack, and the creation of the first chiral centre occurs (7). After the first Michael addition, the addition of a second cinnamaldehyde molecule occurs by the same catalysis of the first one and the second chiral centre is created (9). Finally, the intramolecular aldol condensation, followed by dehydration, leads to the desired product and creates the third chiral centre (3).
Scheme 12. Catalytic cycle of β-functionalization of 2-acetyl-pyridine (1) with
cinnamaldehydes (2).
As shown in Scheme 12 the product (3) contains three stereogenic centres: two of them were determined by the catalyst (the ones bound to the aryl groups) while configuration of the third one depended on the last intramolecular aldol reaction. For this reason, only two diastereoisomers (major and minor) were obtained, which are epimers at the central stereogenic centre. Using 2-acetyl-pyridine almost all the starting materials led to the double addition products (3). The obtainment of the mono-addition product (8) was expected using 2-propyonil-pyridine instead (Paragraph 3.2). The effect on conversion,
18
yield, diastereoisomeric ratio and enantiomeric excess of using different enals is summarized in Table 1.
Table 1. Scope of reaction with different cinnamaldehydes.
Entry R J.c.(a) Conv.(b) d.r.
(c) (major : minor) e.e. major(d) (%) Yield(e) (major) 3a H R 57% 6:1 > 99 40% 3b 2-Br R 87% > 99% > 99 28% 3c 2-OMe R 68% > 99% -(f) 37% 3d 4-OMe R 31% 4:1 97 30% 3e 4-Br R 56% 5:1 -(f) 43% 3f 4-CF3 R 80% 5:1 >99 55% 3g 4-Me R 31% 7:1 >99 10% 3h 2-Cl R > 99% 8:1 >99 57% 3i 4-CN R > 99% 4:1 >99 40% 3l 3-Cl R 52% 5:1 >99 42% 3m 4-Cl R 80% 5:1 >99 56% 3n 4-F R 65% 5:1 >99 53% 3o 4-NO2 R 65% 6:1 >99 85%
(a) J.c. = Jørgensen-Hayashi catalyst configuration. (b) Diastereoisomeric ratios were calculated from the crude NMR comparing the aldehyde signals of the diastereoisomers. (c) Conversions were calculated from the crude NMR comparing the aldehyde signal of the starting cinnamaldehyde and the one of the product. (d) Enantiomeric excess was determined by chiral HPLC analysis as shown below in the text. (e) Yields were calculated from the isolated diastereoisomers after column chromatography. (f) products that are in course of analysis.
The data of Table 1 show that the products were obtained with good to high diastereoisomeric ratios and excellent enantioselectivities. Hence, good results were obtained mostly with an electron-withdrawing group in the para position on the phenyl, for example 3f, 3i or 3o. On the other hand, worse results appeared when an
electron-19 donating group was contained in the phenyl (3d and 3g), increasing the yield of mono-addition by-product (as determined by 1H-NMR spectroscopy). Furthermore, the presence of an electron-withdrawing substituent in the ortho position seemed to favour an higher diastereoselectivity (3b and 3h), because the bulky group promoted only one diastereoisomer over the other when the formation of the second chiral centre occurred. Finally, moderate results were acquired with an electron-withdrawing group in the meta position (3l and 3c).
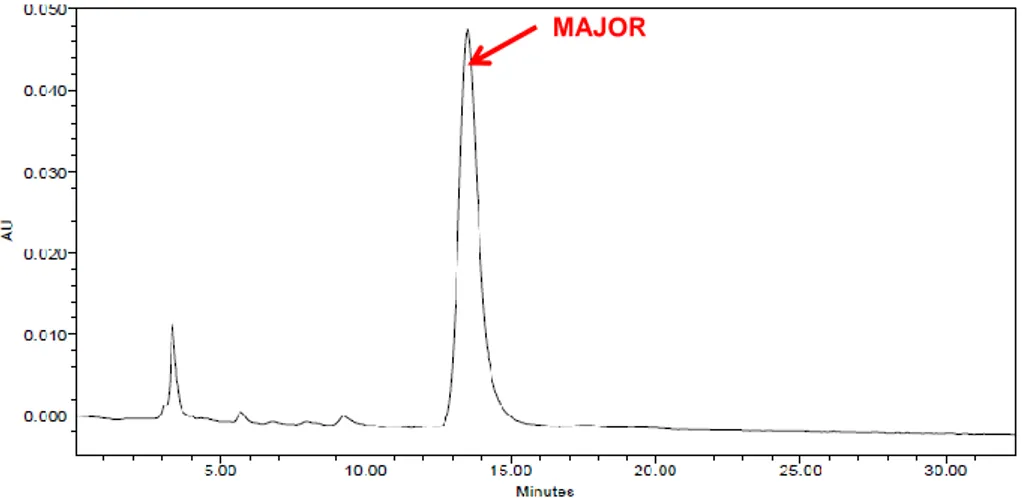
Enantioselectivity and enantiomeric excesses were determined using chiral stationary phase (CSP) HPLC. In particular, the major diastereoisomers resulting from reactions with (R) and (S)-Jørgensen-Hayashi catalyst were analysed by CSP-HPLC using cellulose-based Chiralcel OD-H or OZ-H column. An example of HPLC results for the mixture of 3i major enantiomers was reported in Figure 5.
Figure 5. HPLC results for product 3i-major. OD-H column, eluent mixture =
n-hexane:i-PrOH 80:20, flow rate = 1 mL/min.
Comparing the product obtained with (R)-catalyst and the product obtained with (S)-catalyst, which exhibited the same 1H-NMR spectrum, two single peaks at two different retention times could be observed, which means that two different enantiomers were obtained using Jørgensen-Hayashi catalyst with a different configuration. Furthermore, the enantiomeric excess was more than 99%, in almost all cases. HPLC analysis results for all the major products are reported in the experimental section (Paragraph 6.2).
20
3.2 Reaction with 2-propyonil-pyridine
The reaction mechanism was verified by performing the reaction employing other acetyl-pyridines. As anticipated in the paragraph before, employing 2-propyonil-pyridine (11) no double addition product was obtained (Scheme 13). The products were analysed by NMR spectroscopy.
Scheme 13. Functionalization of 2-propionyl-pyridine (16) with cinnamaldehyde (2).
Only the mono-addition compound was observed (12), because the methyl group in α-position highers the steric hindrance preventing the addition of a second molecule of cinnamaldehyde (Scheme 14).
Scheme 14. Catalytic cycle of β-functionalization of 2-propionyl-pyridine (11) with
21 Two reaction conditions using different metal catalysts were investigated as shown in
Table 2. The conditions that gave the best conversion were found as the first
combination with the Zn(acac)2 as Lewis acid.
Table 2. Screening of reaction with propionyl-pyridine using different catalysts.
Solvent Lewis acid
J.c. 1 day 4 days
Conv. d.r. (maj.:min.) Conv. d.r. (maj.:min.)
Toluene Zn(acac)2 R 74% 3.4:1 74% 2:1
22
3.3 Identification and characterization
In order to study the stereochemistry and the mechanism of the reaction it was important to identify the relative and the absolute configuration of the two diastereoisomers obtained from the reaction. The analysis were carried out for the diastereoisomers of compounds 3i and 3f, and successively extended to the other products. The relative configuration of the products was determined by means of 2D-COSY and NOE-NMR experiments.
Moreover, the standard method used to assign the absolute configuration is X-ray anomalous scattering, but in the last years other methods that do not require the preparation of enantiopure single crystals showed to be reliable and feasible. They are based on chiro-optical techniques such as optical rotation, Electronic Circular Dichroism (ECD) and Vibrational Circular Dichroism (VCD), supported by quantum mechanical TD-DFT and DFT calculations (see Appendix). In this case, the absolute configuration of 3i diastereoisomers was assigned by ECD spectroscopy, while the absolute configuration of 3f diastereoisomers was determined by VCD spectroscopy.
3.3.1 HPLC purification
Before assigning the configuration, the major and minor diastereoisomers of compound
3i must be purified by means of semi-preparative HPLC. The HPLC purification of the
major diastereoisomer of 3i was performed on CSP-HPLC, using a cellulose-based HPLC column (Phenomenex Cellulose2, Figure 6).
Figure 6. Semi-preparative HPLC of 3i-major fraction with Phenomenex Cellulose2
Column. Injection Volume = 10 µL, Run Time = 32 min, eluent mixture = n-hexane/i-PrOH 30:70, λ = 254 nm, flow rate = 5 mL/min, tr(major) =14 min.
23 The minor diastereoisomer was obtained starting from a mixture of the two diastereoisomers containing about 60% of the minor (Figure 7). Reverse phase HPLC was used with a LunaC18 column and acetonitrile/H2O as eluent.
Figure 7. Semi-preparative HPLC of 3i-minor fraction with LunaC18 Column.
Injection Volume = 10 µL, Run Time = 23 min, eluent mixture = azeotropic ACN/H2O mixture:H2O 40:60, λ = 254 nm, flow rate = 5 mL/min, tr(minor) = 16 min.
After purifying the two diastereoisomers of 3i by HPLC, the interest was focused on the determination of the relative and the absolute configuration of each diastereoisomer.
3.3.2 Characterization of compound 3i-major
The 1H-NMR spectrum of compound 3i-major is reported in Figure 8.
Figure 8. 1H-NMR of compound 3i-major (600 MHz in CD3CN).
The chemical shift of H-3 was assigned at 4.70 ppm, because it was the only doublet in the aliphatic region for the coupling with H-2. Starting from this, it was possible to
MINOR
H-7
24
assign the signals of all the protons in the aliphatic area by means of 2D-COSY experiment (Figure 9).
Figure 9. 2D-COSY experiment of compound 3i-major (600 MHz in CD3CN),
showing correlation between H-3 and H-2 (red), H-2 and H-1 (blue), H-1 and H-6 (orange) and H-6 and H-5 (green).
H-2 was identified at 5.12 ppm from the correlation with H-3. In the same way, H-1
signal was determined at 3.58 ppm by the correlation with H-2 and also diastereotopic protons H-6a and H-6b at 3.05 ppm and 2.58 ppm were identified by the correlation with
H-1. The discrimination of the chemical shifts of H-6a and H-6b was made in a second
moment by means of NOE-NMR experiments (See below in the text).
H-6 2,60 H-6 3.05 H-1 3.58 H-3 4.70 H-2 5.12 2 ,6 0 3 .0 5 3 .5 8 4 .7 0 5 .1 2
25
Relative configuration
The relative configuration was then assigned on the base of NOE-NMR experiments. A first experiment was run by saturation of H-3 signal (Figure 10).
Figure 10. Top: NOE-NMR spectrum obtained from the irradiation of H-3 (600 MHz
in CD3CN). Red: irradiated signal, green: control signals, blue: signals of interest.
Bottom: 1H-NMR spectrum.
The experiment showed that H-3 presented a large NOE effect with H-2 signal at 5.12 ppm. This led to the conclusion that H-3 and H-2 are positioned on the same side of the molecule (syn position). Furthermore, the spectrum showed that H-3 was close also to the aromatic signal at 6.98 ppm, which represented the ortho-positioned protons of the 3-aryl group (H-9). Finally, a weak NOE effect between H-3 and aldehydic proton H-7, at 9.45 ppm, was observed. This first experiment fixed the relative stereochemistry of the two stereogenic carbons C-2 and C-3.
H-2 {H-3} H-7 H-9 H-7 H-13 H-9 H-2 H-5 H-3 H-1 H-6aH-6b
26
A second experiment was obtained by saturating H-2 signal at 5.12 ppm (Figure 11). As expected NOE effect between H-2 and H-3 at 4.70 ppm (control signal) was observed.
Figure 11. Top: Aliphatic region of NOE-NMR spectrum obtained from the
irradiation of H-2 (600 MHz in CD3CN). Red: irradiated signal, green: control
signals, blue: signals of interest. Bottom: 1H-NMR spectrum.
The spatial proximity between H-2 and ortho protons of the 1-aryl group H-13 (7.36 ppm) was observed. This suggested that 1-aryl group and H-2 were in the syn position. The spectrum showed also a weak NOE correlation with the signal at 2.60 ppm, which was assigned to the diastereotopic proton H-6b on the same side of H-2. The very small NOE effect between H-2 and H-1 (3.60 ppm) confirmed that these two aliphatic protons were in the anti relationship. This disposition is further confirmed by the very large coupling constant connecting H-2 with H-1 (12.5 Hz), suggesting a dihedral angle close
H-6b H-3 {H-2} H-13 H-1 H-7 H-13 H-9 H-2 H-5 H-3 H-1 H-6a H-6b
27 to 180°. Thus, this spectrum determined the stereochemistry of C-1 and allowed distinguishing the two diastereotopic protons H-6a and H-6b.
In the third NOE-NMR experiment (Figure 12), the H-1 signal at 3.60 ppm was saturated. The NOE effects observed confirmed the previous suggestions; H-1 showed spatial proximity with 3.05 ppm signal (H-6a), with 6.98 ppm signal (H-9), with 7.30 ppm signal (H-13) and a weak NOE effect with H-2.
Figure 12. Top. Aliphatic region of NOE-NMR spectrum obtained from the
irradiation of H-1 (600 MHz in CD3CN). Red: irradiated signal, green: control
signals, blue: signals of interest. Bottom: 1H-NMR spectrum.
{H-1} H-9 H-13 H-6a H-2 H-7 H-13 H-9 H-2 H-5 H-3 H-1 H-6a H-6b
28
Finally, saturation of aldehydic signal at 9.45 ppm (H-7) was performed, in order to obtain preliminary information about the conformation of aldehydic moiety (Figure 13).
Figure 13. Top: NOE-NMR spectrum obtained from the irradiation of H-7 (600 MHz
in CD3CN). Red: irradiated signal, blue: signals of interest. Bottom: 1H-NMR
spectrum.
Given the large NOE observed on H-5 and the weak NOE on H-3, the aldehydic proton is mainly localized close to H-5 (7.30 ppm).
With the information collected from the NOE-NMR experiments, it was possible to assign the 1S*,2R*,3S* relative configuration of the compound 3i-major (Figure 14).
{H-7} H-5 H-3 H-7 H-13 H-2 H-5 H-3 H-1 H-6aH-6b H-9
29
Figure 14. 3D structure (left) and relative configuration (right) of compound 3i-major.
Conformational analysis
Having assigned the 1S*,2R*,3S* relative configuration of 3i-major diastereoisomer, the project was focused on conformational analysis. In this case the molecule was rather rigid but some degrees of freedom could be identified, such as the rotation of the aldehydic group, the rotation of the pyridine group and rotation of carbonyl group. A conformational search was preliminarily performed by means of molecular mechanics force field (MMFF 94). The conformations with lower energy found were then optimized by DFT computations, which were carried out at the B3LYP/6-31G(d) level of theory. The 1S,2R,3S absolute configuration was assumed for the 3i-major diastereoisomer and eight conformations were identified (Figure 15). For all the optimized geometries, frequency analysis was performed to confirm they were true energy minima (no imaginary frequencies were found).
30
Figure 15. Conformations found by DFT calculations, optimized at the
B3LYP/6-31G(d) level and relative energies of compound 3i-major.
The results asserted that only conformations GS4 and GS3 should be appreciably populated (Boltzmann population is higher than 0.5%). These two conformations correspond to the 180° rotation of the CHO moiety.
Absolute configuration
Once the 1S*,2R*,3S* relative configuration of compound 3i-major was found, the absolute configuration had to be assigned by means of ECD technique.
The ECD spectrum of 3i-major was recorded in the UV region between 180 nm and 400 nm (Figure 16). The spectrum showed a positive broad band at 275 nm, two positives signals centred at 245 nm and 210 nm and two negative bands at 225 nm and 200 nm. The most intense region of the spectrum was the positive branch at 245 nm.
GS1 GS2 GS3 GS4 GS6 GS7 GS8 GS5 E(kcal/mol) = 8.166 Boltzmann Pop. % < 0.1 E(kcal/mol) = 10.322 Boltzmann Pop. % < 0.1 E(kcal/mol) = 2.206 Boltzmann Pop. % = 2.4 E(kcal/mol) = 0.000 Boltzmann Pop. % = 97.5 E(kcal/mol) = 11.661 Boltzmann Pop. % < 0.1 E(kcal/mol) = 6.103 Boltzmann Pop. % < 0.1 E(kcal/mol) = 4.095 Boltzmann Pop. % < 0.1 E(kcal/mol) = 13.637 Boltzmann Pop. % < 0.1
31
Figure 16. Experimental ECD spectrum of 3i-major in acetonitrile. See the details in
the Section 6.
The simulations of the ECD spectra were carried out using the TD-DFT method and using the populated geometries GS3 and GS4 previously optimized at the B3LYP/6-31G(d) level of theory. In order to have redundancy of data and to get more reliability, calculations were performed using four different functionals: the hybrid functionals CAM-B3LYP, BH&HLYP, M06-2X and B97XD that includes empirical dispersion (Figure 17). The basis set employed was 6-311++G(2d,p) for all the functionals.
-20 -10 0 10 20 30 40 50 190 210 230 250 270 290 310 330 350 370 390 mdeg nm
32
Figure 17. TD-DFT simulated spectra of the two conformations GS3 and GS4 of 3i-major performed using functionals CAM-B3LYP, BH&HLYP, M06-2X, B97XD
and the 6-311++G(2d,p) basis set. The spectrum was obtained using a 0.25 eV line width at half height.
All the simulation showed a positive band at 235-245 nm, a positive signal at about 210 nm and a negative one around 200 nm, in agreement with the experimental results (shown in Figure 16). In all calculations, GS3 presented a more intense Cotton effect between 215 and 225 nm, while GS4 did not exhibit a negative band in that region. In order to obtain the calculated spectrum to be compared with the experimental ECD, TD-DFT spectra of both conformations were weighted according with the populations determined by Boltzmann distribution. In this case, the simulations obtained for the two conformation were not very different, so errors in the conformational ratio did not change the final spectrum at a great extent. Figure 18 shows the comparison between the averaged simulated spectra obtained for each functional (coloured lines), compared with the experimental spectrum (black line).
-100 -80 -60 -40 -20 0 20 40 60 80 100 120 190 215 240 265 290 315 340 365 390 CAM-B3LYP GS3 GS4 -100 -80 -60 -40 -20 0 20 40 60 80 100 120 190 215 240 265 290 315 340 365 390 BH&HLYP GS3 GS4 -100 -80 -60 -40 -20 0 20 40 60 80 100 120 190 215 240 265 290 315 340 365 390 ωB97XD GS3 GS4 -100 -80 -60 -40 -20 0 20 40 60 80 100 120 190 215 240 265 290 315 340 365 390 M06-2X GS3 GS4 Δε Δε Δε Δε nm nm nm nm
33
Figure 18. TD-DFT simulations compared with the experimental ECD spectrum of 3i-major. Black line: experimental spectrum. Coloured lines: simulated spectra. All
the simulations were carried out for the 1S,2R,3Sabsolute configuration.
The simulated spectra were scaled and shifted in order to obtain the best overlap with the experimental one (y axes scaling factors: 0.45, 0.5, 0.44, 0.37, x axes shift factors: 7, 7, 8, 10 nm for CAM-B3LYP, BH&HLYP, B97XD, M06-2X, respectively). The comparison between all the simulated averaged spectra with experimental one was very good and the 1S,2R,3S absolute configuration can be reliably assigned to 3i-major (Figure 19). -40 -30 -20 -10 0 10 20 30 40 50 190 210 230 250 270 290 310 330 350 370 390 ωB97XD -40 -30 -20 -10 0 10 20 30 40 50 190 210 230 250 270 290 310 330 350 370 390 M06-2X -40 -30 -20 -10 0 10 20 30 40 50 190 210 230 250 270 290 310 330 350 370 390 BH&HLYP -40 -30 -20 -10 0 10 20 30 40 50 190 210 230 250 270 290 310 330 350 370 390 CAM-B3LYP Calc.
Exp. Calc.Exp.
Calc. Exp. Calc. Exp. mdeg mdeg mdeg nm nm nm mdeg nm 3i-major 1S,2R,3S
34
Figure 19. Comparison between the sum of all weighted simulated spectra and
experimental spectrum of compound 3i-major.
3.3.3 Characterization of compound 3i-minor
In order to assign the relative configuration of compound 3i-minor the same procedure used for 3i-major was actuated. The chemical shift of H-3 was assigned to the broad signal at 4.40 ppm that is the only aliphatic signal that shows HMBC correlation with the aldehydic carbon C-7 (Figure 20).
Figure 20. 1H-NMR spectrum of compound 3i-minor (600 MHz in CDCl3).
-50 -40 -30 -20 -10 0 10 20 30 40 50 190 210 230 250 270 290 310 330 350 370 390 CAM-B3LYP WB97XD M06-2X BH&HLYP Experimental mdeg nm 3i-major 1S,2R,3S H-7 H-3
35 Starting from H-3 signal, it was possible to assign the peaks of all the protons in the aliphatic region by means of 2D-COSY experiment (Figure 21). H-2 was identified from the correlation with H-3 in the signal at 4.83 ppm. In the same way, H-1 signal was determined at 3.20 ppm by the correlation with H-2 and also the diastereotopic protons
H-6a and H-6b at 3.60 ppm and 2.98 ppm were identified thanks to the correlation with H-5. The discrimination of chemical shifts of H-6a (equatorial position) and H-6b (axial
position) was made by means of NOE-NMR experiments (see below in the text).
Figure 21. Aliphatic region of the 2D-COSY experiment of compound 3i-minor (600
MHz in CDCl3), showing correlation between H-3 and H-2 (red), H-2 and H-1 (blue),
H-1 and H-6 (orange) and H-6 and H-5 (green).
H-2 4.82 H-3 4.40 H-6 3.60 H-1 3.28 2.98H-6 4.82 4 .4 0 3 .6 0 3 .2 8 2 .9 8
36
Relative configuration
As well as for 3i-major, a first NOE-NMR experiment was performed by saturating H-3 signal (Figure 22).
Control signals from the aldehydic proton H-7 (9.55 ppm) and from aromatic protons of the 3-aryl-group (7.48 ppm) were observed. Furthermore, a NOE effect was present on the H-2 signal at 4.82 ppm.
Figure 22. Top: Aliphatic area of NOE-NMR spectrum obtained from the irradiation
of H-3 (600 MHz in CDCl3). Red: irradiated signal, green: control signals, blue:
signals of interest. Bottom: 1H-NMR spectrum.
A second experiment saturating H-2 signal (4.83 ppm) was then performed as shown in
Figure 23. Proton H-2 gave NOE effect on H-3 (control signal), as expected. Differently
from the major product, a large NOE effect was observed on the aromatic protons H-9 (7.40 ppm). This suggested that H-2 and H-9 were close in the space. Furthermore, the
H-7 H-9 H-7 H-13 H-9 H-2 H-3 H-1 H-6b H-6a H-5 {H-3} H-2
37 spectrum showed intense NOE effect with the aliphatic signal at 3.28 ppm of H-1, and a weak enhancement on the aromatic protons of 1-aryl-group at 7.20 ppm (H-13, para system). This spectrum suggested the relative stereochemistry of C-1, C-2 and C-3; in fact, H-2 and H-1 must be positioned on the same side of the molecule (syn position), due to the large NOE effect. Differently, H-3 and H-2 were in the anti position, since
H-2 showed a large NOE effect on H-9.
Figure 23. Top: NOE-NMR spectrum obtained from the irradiation of H-2 (600 MHz
in CDCl3). Red: irradiated signal, green: control signals, blue: signals of interest.
Bottom: 1H-NMR spectrum.
In order to have redundant information about the relative configuration a “control” NOE-NMR experiment was acquired by saturation of 1 (Figure 24). NOE effect on 2,
H-13, and H-6a (2.98 ppm) was obtained, as expected. In addition, correlation between H-1
and H-9 reinforced the hypothesis made before that H-3 and H-1 are in the anti position.
H-3 H-9 H-1 H-13 {H-2} H-7 H-13 H-9 H-2 H-3 H-1 H-6b H-6a H-5
38
Figure 24. Top: Aliphatic area of NOE-NMR spectrum obtained from the irradiation
of H-1 (600 MHz in CDCl3). Red: irradiated signals, green: control signals, blue:
signals of interest. Bottom: 1H-NMR spectrum.
Finally, in order to obtain information about the preferred conformation of the aldehydic group, a third experiment saturating aldehydic proton H-7 at 9.55 ppm was carried out (Figure 25). The experiment showed large NOE effect on H-5 (7.43 ppm), while a weak NOE effect on H-3 was observed, which led to the conclusion that the proton H-7 of the aldehydic group is localized mainly towards H-5.
H-9 H-13 {H-1} H-2 H-6a H-7 H-13 H-9 H-2 H-3 H-1 H-6b H-6a H-5
39
Figure 25.Top: NOE-NMR spectrum obtained from the irradiation of H-7 (600 MHz in CDCl3). Red: irradiated signals, blue: signals of interest. Bottom: 1H-NMR
spectrum.
With the information collected from the above-mentioned spectra, it was possible to assign the 1S*,2S*,3S* relative configuration to the compound 3i-minor (Figure 26). As conclusion, the relative configuration of minor product differed from the major product in the disposition of H-2, which in one case was positioned on the same side of
H-3 (major), and in the other case was in the syn position with H-1 (minor).
H-7 H-13 H-9 H-2 H-3 H-1 H-6b H-6a {H-7} H-5 H-3 H-5
40
Figure 26. 3D structure (left) and relative configuration (right) of compound 3i- minor.
Conformational analysis
Using the same procedure adopted for 3i-major a conformational search was performed for 3i-minor. The conformers with lowest energy were then optimized by DFT computations at the B3LYP/6-31G(d) level of theory. The 1S,2S,3S absolute configuration was assumed and six structures were minimized (Figure 27).
41
Figure 27. Conformations found by DFT calculations, optimized at the
B3LYP/6-31G(d) level and relative energies of compound 3i-minor.
Results from Figure 27 showed that only conformation GS1 and GS2 were populated (Boltzmann population is higher than 0.5%). The two conformations derive from a 180° rotation of the aldehydic group, as for 3i-major and the experimental NOE-NMR results well agreed with the lowest energy conformation GS1.
Absolute configuration
Once the relative configuration and DFT conformation of compound 3i-minor were found, the absolute configuration was assigned by means of ECD technique. The spectrum acquired in the region between 180 nm and 400 nm was investigated and compared with the one of 3i-major (Figure 28).
GS1 GS2 GS3 GS4 GS5 GS6 E(kcal/mol) = 0.000 Boltzmann Pop. % = 98.8 E(kcal/mol) = 2.619 Boltzmann Pop. % = 1.2 E(kcal/mol) = 8.193 Boltzmann Pop. % < 0.1 E(kcal/mol) = 8.219 Boltzmann Pop. % < 0.1 E(kcal/mol) = 8.219 Boltzmann Pop. % < 0.1 E(kcal/mol) = 15.150 Boltzmann Pop. % < 0.1
42
Figure 28. Comparison between the ECD experimental spectra of 3i-minor (red) and 3i-major (black). See details of ECD analysis in the Section 6.
The experimental spectrum of 3i-minor showed a very broad band at 350 nm. The most intense region of the spectrum exhibited a positive signal at 240 nm and a negative one at 220 nm. As evidence from Figure 28 the experimental spectrum confirmed that
3i-minor was diastereoisomer with 3i-major. Differently from 3i-major, 3i-3i-minor did not
show a negative branch at 215 nm.
Once the experimental spectrum was obtained, ECD simulations were performed using the functionals described in the Paragraph 3.3.2 for 3i-major. The TD-DFT simulations of the ECD spectra were carried out using the most stable geometries GS1 and GS2 and assuming the 1S,2S,3S absolute configuration (Figure 29).
-20 -15 -10 -5 0 5 10 15 20 25 30 35 190 210 230 250 270 290 310 330 350 370 390 nm mdeg 3i-major 3i-minor
43
Figure 29. TD-DFT simulated spectra of the two conformations GS1 and GS2 of 3i-minor performed using functionals CAM-B3LYP, BH&HLYP, M06-2X,
B97XD and the 6-311++G(2d,p) basis set. The spectra were obtained using a 0.25 eV line width at half height.
All the simulated spectra showed a positive band around 240 nm and a negative signal at 215 nm, according with experimental results. Conformation GS2 exhibited and extra “shoulder” band at 200 nm, while GS1 presented a smooth spectrum in that area. Furthermore, GS1 seemed to be shifted to the left compared with GS2. In conclusion,
GS1 showed more similarity with the experimental spectrum, leading to verify that it
was the most populated conformation.
In order to obtain the averaged simulated spectrum to be compared with the experimental ECD, the spectra were weighted according with the populations determined by Boltzmann distribution based on the DFT calculations. The comparison between the experimental spectrum (black line) and the average simulated spectra obtained for each functionals (coloured lines) is shown in Figure 30.
-70 -60 -50 -40 -30 -20 -10 0 10 20 30 40 50 60 70 80 90 190 215 240 265 290 315 340 365 390 CAM-B3LYP GS2 GS1 -70 -60 -50 -40 -30 -20 -10 0 10 20 30 40 50 60 70 80 90 190 215 240 265 290 315 340 365 390 BH&HLYP GS2 GS1 -70 -60 -50 -40 -30 -20 -10 0 10 20 30 40 50 60 70 80 90 190 215 240 265 290 315 340 365 390 M06-2X GS2 GS1 Δε Δε Δε nm nm nm -70 -60 -50 -40 -30 -20 -10 0 10 20 30 40 50 60 70 80 90 190 215 240 265 290 315 340 365 390 ωB97XD GS2 GS1 Δε nm
44
Figure 30. TD-DFT simulations compared with the experimental ECD spectrum of 3i-minor. Black line: experimental spectrum. Coloured lines: simulated spectra. All
the simulations were performed for 1S,2S,3S absolute configuration.
The simulated spectra were scaled and shifted in order to obtain the best overlap with experimental one (y axes scaling factors: 0.5, 0.6, 0.5, 0.45; x axes shift factors: 10, 9, 10, 12 nm for CAM-B3LYP, BH&HLYP, B97XD, M06-2X, respectively).
Comparing all the weighted simulated spectra with experimental one (Figure 31) the 1S,2S,3S absolute configuration was reliably assigned to 3i-minor.
-40 -30 -20 -10 0 10 20 30 40 50 190 210 230 250 270 290 310 330 350 370 390 CAM-B3LYP -40 -30 -20 -10 0 10 20 30 40 50 190 210 230 250 270 290 310 330 350 370 390 BH&HLYP -40 -30 -20 -10 0 10 20 30 40 50 190 210 230 250 270 290 310 330 350 370 390 ωB97XD -40 -30 -20 -10 0 10 20 30 40 50 190 210 230 250 270 290 310 330 350 370 390 M06-2X Calc. Exp. Calc. Exp. Calc. Exp. Calc. Exp. mdeg mdeg mdeg nm nm nm mdeg nm 3i-minor 1S,2S,3S
45
Figure 31. Comparison between the sum of all weighted simulated spectra and
experimental spectrum for compound 3i-minor.
3.3.4 Characterization of compound 3f-major
Another approach for the determination of absolute configuration was employed in the case of compound 3f. In fact, the absolute configuration of 3f-major was determined by means of VCD techniques.
The IR and VCD region between 1350 cm-1 and 1850 cm-1 was investigated (Figure 32). The most intense region of IR spectrum showed a broad band centred at 1674 cm-1, due to the stretching of the two C=O groups. In parallel, VCD spectrum presented a negative signal at 1792 cm-1, which was attributed to the C=O stretching of the aldehydic group, and a positive signal at 1780 cm-1, due to stretching C=O of the ketone moiety. The attribution was made on the base of the results of the DFT calculations.
-40 -30 -20 -10 0 10 20 30 40 50 60 190 210 230 250 270 290 310 330 350 370 390 CAM-B3LYP WB97XD M06-2X BH&HLYP Experimental mdeg nm 3i-minor 1S,2S,3S
46
Figure 32. IR and VCD results for compound 3f-major. Top: VCD experimental
spectrum. Bottom: IR experimental spectrum. See details in Section 6.
Once the experimental spectrum was recorded, IR and VCD simulations were performed using DFT computations. In this case the same preliminary considerations about relative configuration and DFT conformations made for 3i-major were used. Thus, it was possible to perform VCD calculations starting from the same absolute configuration (1S,2R,3S) and conformations (GS3 and GS4) found for 3i-major, substituting the cyano functional group with the CF3 group as shown in Figure 33.
-0,015 -0,01 -0,005 0 0,005 0,01 1350 1450 1550 1650 1750 1850 l (cm-1) -0,1 0 0,1 0,2 0,3 0,4 0,5 0,6 0,7 0,8 1350 1450 1550 1650 1750 1850 l (cm-1) ε Δε Experimental VCD Experimental IR
47
Figure 33. Most populated conformations of 3f-major, using the absolute
configuration 1S,2R,3S.
These structures were optimized by means of DFT calculations (B3LYP functional, 6-31G(d) basis set) and the simulated spectra were compared with experimental spectra as shown in Figure 34. 3f-major GS4 E (kcal/mol) = 0.000 Boltzmann Population = 97.4% 3f-major GS3 E (kcal/mol) = 2.155 Boltzmann Population = 2.6%
48
Figure 34. Comparison between simulated and experimental VCD spectra (top) and
between simulated and experimental IR spectra (bottom).
The simulated spectra were scaled and shifted in order to obtain the best overlap with experimental one (for VCD spectrum: x axis scaling factor: 0.975, y axis shift factor: 0.015 Δε, y axis scaling factor: 0.00001; for IR spectrum: x axis scaling factor: 0.975, y axis shift factor: 0.75 Δε, y axis scaling factor: 0.00001). VCD simulations finally assigned the 1S,2R,3S absolute configuration to 3f-major, according with results obtained by ECD spectroscopy.
-0.015 -0.01 -0.005 0 0.005 0.01 0.015 0.02 0.025 1350 1450 1550 1650 1750 1850 λ (cm-1) Calculated VCD Experimental VCD x 102 Δε -0.3 -0.1 0.1 0.3 0.5 0.7 0.9 1.1 1.3 1.5 1350 1450 1550 1650 1750 1850 λ (cm-1) ε Calculated IR Experimental IR
49
3.3.5 Characterization of compound 3f-minor
As well as for 3f-major the IR and VCD region between 1550 cm-1 and 1850 cm-1 was observed for 3f-minor (Figure 35).
Figure 35. IR and VCD of compound 3f-minor. Top: VCD experimental spectrum. Bottom: IR experimental spectrum.
The most intense IR signal was analysed, such as the band at about 1700 cm-1. In parallel, VCD spectrum presented a signal at about the same wavelength (1700 cm-1), corresponding to the stretching of the carbonyl group bonded to the pyridine group. It was possible to perform VCD calculations starting from the same absolute configuration (1S,2S,3S) and conformations (GS1 and GS2) found for 3i-minor, substituting the cyano functional group with the CF3 group, as shown in Figure 36.
-0,2 -0,1 0 0,1 0,2 0,3 0,4 0,5 0,6 0,7 0,8 1550 1650 1750 1850 l (cm-1) ε -0,004 -0,003 -0,002 -0,001 0 0,001 0,002 0,003 1550 1650 1750 1850 l (cm-1) Δε Experimental VCD Experimental IR
50
Figure 36. Most populated conformations of 3f-minor, using the absolute
configuration 1S,2S,3S.
These structures were optimized by means of DFT calculations (B3LYP functional, 6-31G(d) basis set) and the results were compared with experimental spectra as shown in
Figure 37.
The simulated spectra were scaled and shifted in order to obtain the best overlap with experimental one (for IR spectrum: x axis scaling factor: 0.96, y axis shift factor: 0.75 Δε, y axis scaling factor: 0.001; for VCD spectrum: x axis scaling factor: 0.96, y axis shift factors: 0.008 Δε, y axis scaling factor: 0.00001).
3f-minor GS1 E (kcal/mol) = 0.000 Boltzmann Population = 98.4% 3f-minor GS2 E (kcal/mol) = 2.454 Boltzmann Population = 1.6%
51
Figure 37. Comparison between simulated and experimental VCD spectra (top) and
between simulated and experimental IR spectra (bottom).
As result, VCD simulations assigned the 1S,2S,3S absolute configuration to 3f-minor. Thus, VCD configurations well agreed with ECD results and reinforced the hypothesis made for the absolute configuration of each diastereoisomer.
-0,005 -0,003 -0,001 0,001 0,003 0,005 0,007 0,009 0,011 1550 1650 1750 1850 l (cm-1) -0,2 0 0,2 0,4 0,6 0,8 1 1,2 1,4 1,6 1550 1650 1750 1850 l (cm-1) Calculated VCD Experimental VCD x 102 Calculated IR Experimental IR Δε ε
52
4 Conclusions
A enantioselective strategy for the synthesis of pyridine derivatives by means of synergistic catalysis was investigated. The obtainment of enantiopure compounds bearing three stereogenic centres (3) was achieve via highly enantioselective Michael-Michael-Aldol cascade reaction between 2-acetyl-pyridine (1) and α,β-unsaturated compounds (2). The mechanism involved a multicatalytic strategy, combining iminium catalysis and transition metal catalysis in a synergistic fashion. A reaction scope using different cinnamaldehydes (2) was performed in order to clarify the applicability and reproducibility of the reaction. As conclusion, the desired products were obtained with excellent enantioselectivities, good diastereoselectivities and moderate yields. The relative configurations of the products were determined by means of 2D-COSY and NOE-NMR experiments, while the absolute configurations was attributed by ECD and VCD spectroscopies supported by quantum mechanical calculations, which allowed verifying the stereochemistry of the reaction.
53
5 Experimental Part
5.1 General
Purifications: For the chromatography stationary phase Silica gel 60 F254 (Merck) for
the TLC and silica gel 60 Å (230-400 mesh, Sigma Aldrich) were employed. To purify the products for the assignment of relative and absolute configuration HPLC WatersTM 600 instrument was used, with detection fixed at 254 nm. Phenomenex Luna C18 (5 μm, 100 Å, 250 × 10 mm) was employed to purify 3i-major fraction. The mobile phase consisted of an azeotropic mixture CH3CN/H2O (90:10), obtained by distillation (b.p. =
76-77 °C), and H2O. Lux Cellulose2 (5 μm, 250 × 10 mm) was used for 3i-minor
fraction, employing a mixture of n-hexane:i-PrOH as eluent.
NMR spectra: NMR spectra were recorded using a spectrometer operating at a field of
9.4 T (400 MHz for 1H, 100.6 MHz for 13C) and a field of 14.4 T (600 MHz for 1H, 150.8 MHz for 13C). Chemical shifts are given in ppm relative to the chloroform peak (7.26 ppm, 77.16 ppm) or relative to the internal standard tetramethylsilane (1H and 13C). The assignment of the 13C signals was obtained by means of DEPT and J-MOD experiments. The protons assignments were possible by means of NOE-NMR and 2D-COSY experiments, the spectra of 3i-major were obtained at 600 MHz in CD3CN, while
the ones of 3i-minor were recorded at 600 MHz in CDCl3.
ECD spectra: were recorded with a JASCO J-810 spectropolarimeter at +25 °C.
Compounds were dissolved in acetonitrile using a concentration of about 10-4 M, in order to obtain a maximum absorbance of about 1 in the UV spectrum, and a 0.2 cm path length. Spectra were recorded in the 180-400 nm interval, and 16 scans were summed to register the final spectrum.
VCD spectra: were recorded with a ChiralIR-2X FT-VCD spectrometer (Biotools, Inc.)
equipped with single PEM at 36kHz and 4 cm-1 resolution, at +25 °C. Compounds were dissolved in CDCl3using a concentration of about 10-2 M, in order to obtain a maximum
absorbance of about 0.6 in the IR spectrum, and a 0.1 cm path length. Spectra were recorded in the 1000-2000 cm-1 interval, and 12 blocks of 3120 scans, were summed to get the final spectrum.
54
5.2 Procedures
and
spectroscopic
data
of
synthesized compounds.
Some of the cinnamaldehydes used for the reaction were bought commercially (2a, 2c,
2d, 2e, 2m, 2n, 2o), while few other were synthesized on site by Wittig reaction (2b, 2f, 2g, 2h, 2i, 2l).(28)
Synthesis of cinnamaldehydes (2b, 2g, 2l): A suspension of 20 mmol (1 eq) triphenylphosphoranylidene-acetaldehyde (11) and 40 mmol (2 eq) of benzaldehyde (12) in 5 mL of toluene was stirred at +40 oC up to 3 days. The reaction was monitored by TLC and 1H-NMR. The mixture was separated by chromatography column using a
EtOAc:n-hexane mixture in 1:15 ratio. The product (2) was obtained as a yellow solid
and then characterized by 1H-NMR spectroscopy.
COMPOUND 2b: (E)-3-(2-bromophenyl)acrylaldehyde 1 H NMR (400 MHz, CDCl3, TMS, +25 °C): δ 9.63 (d, J = 7.5 Hz, 1H), 7.73 (d, J = 15.5 Hz, 1H) 7.50 (d, J = 7.5 Hz, 1H), 7.27 (m, , 2H), 7.14 (td, J = 7.8, 1.5 Hz, 1H), 6.53 (dd, J = 15.5, 7.5 Hz, 1H). Yield = 30% COMPOUND 2g: (E)-3-(p-tolyl)acrylaldehyde 1 H-NMR (400 MHz, CDCl3, TMS, +25 °C): δ 9.52 (d, J = 7.7 Hz, 1H), 7.33 – 7.27 (m, 3H), 7.06 (d, J =8.3 Hz, 2H), 6.52 (dd, J = 15.9, 7.7 Hz, 1H), 2.23 (s, 3H). Yield = 34%
55 COMPOUND 2l: (E)-3-(3-chlorophenyl)acrylaldehyde 1 H NMR (400 MHz, CDCl3, TMS, +25 °C): δ 9.57 (d, J = 7.6 Hz, 1H), 7.36 (m, 1H), 7.30 (ddd, J = 5.4, 3.6, 1.8 Hz, 1H) 7.28-7.20 (m, 3H), 6.52 (dd, J = 16.0, 7.6 Hz, 1H). Yield = 63%
General procedure for the synthesis of compounds 3a-o: In a vial, the (R)-Jørgensen catalyst (XXIX) (13 mg, 20 mol%), the Zn(acac)2 (2.5 mg, 5 mol%), 2-acetyl-piridine
(1) (24.2 mg, 0.2 mmol), cinnamaldehyde (2) (0.6 mmol) and the benzoic acid (12.2 mg, 20 mol%) were added. Then the mixture was dissolved in 3mL of CH2Cl2 and left to
react under stirring up to 4 days. The reaction was monitored by TLC and 1H-NMR. Crude was purificated by chromatography column using different ratios of
n-hexane:EtOAc between 2:1 and 6:1. The product (3) was obtained as a brown or red oil.
Product was then characterized by 1H-NMR and 13C-NMR, IR spectroscopies and HRMS.(29)
COMPOUND 3-a: 2-2''-picolinoyl-1',2',3',6'-tetrahydro-[1,1':3',1''-terphenyl]-4'-carbaldehyde
Eluent mixture: n-hexane:EtOAc = 2:1 d.r. (major:minor) = 6:1 Major diastereoisomer 1 H-NMR (400 MHz, CDCl3, 7.26 ppm, +25 °C): δ 9.49 (s, 1H), 8.75 (ddd, J = 4.8, 1.6, 0.9 Hz, 1H), 7.77 (ddd, J = 7.7, 7.7, 1.6 Hz, 1H), 7.63 (d, J = 7.5 Hz, 1H), 7.42 (d, J = 7.5 Hz, 2H), 7.24 – 7.05 (m, 8H), 6.80 – 6.72 (m, 2H), 5.08 (dd, J = 12.5, 5.4 Hz, 1H), 4.61 (dd, J = 5.4, 1.9 Hz, 1H), 3.61 (ddd, J = 12.5, 11.2, 6.1 Hz, 1H), 3.10 (ddd, J = 20.8, 6.1, 4.9 Hz, 1H), 2.63 (dddd, J = 20.8 Hz, 11.2 Hz, 2.4 Hz, 1.9 Hz, 1H).