POLITECNICO DI MILANO
Scuola di Ingegneria Industriale e dell’Informazione
Management Engineering
Boosting Public Administration efficiency:
A feasibility study on the Italian digital payments system pagoPA.
Author:
Tachimiri Tania – 863515
Supervisor: Noci Giuliano
Co-Supervisor: Benedetti Michele Ernesto
Academic Year: 2017/ 2018
Index
Abstract ... 1
Sommario ... 2
Introduction ... 3
1. Literature review ... 5
1.1 Literature review methodology ... 5
1.2 Public Administration, how big is Government expenditure? ... 9
1.3 Citizens-Centric Approach of Public Administration ... 19
1.4 Strategy 2020 ... 25
1.5 A Digital Agenda for Europe ... 26
1.6 State of the art of digital services in Europe ... 36
1.7 SEPA (Single Euro Payment Area) ... 43
1.8 Digital payments ... 45
1.9 Digital payments to public administration ... 54
1.10 Agenda Digitale Italiana ... 59
1.10.1 The strategic directions in terms of digital innovation for public administration ... 61
1.11 pagoPA ... 64
2. Research question ... 72
3. Research methodology... 74
4. The pagoPA project: a feasibility study ... 86
4.1 Analysis of pagoPA development ... 86
4.2 Introduction to the feasibility study ... 94
4.3.1 The School meals process ... 95
4.3.2 The waste tax process ... 114
4.3.3 Administrative sanctions against the Highway Code process ... 133
5. Conclusions and limitations ... 152
6. Appendix ... 167
6.1 Appendix A: pagoPA state of the art survey ... 167
6.2 Appendix B: School meals ... 173
6.3 Appendix C: Waste tax ... 176
6.4 Appendix D: Administrative sanctions ... 179
Figure Index
Figure 1 - Expenditures on GDP; Government at a Glance 2017, 2017 ... 9
Figure 2 - Components of Digital-Era Governance; Dunleavy et al., 2006 ... 15
Figure 3 - Overview e-government solutions; Palvia & Sharma, 2007 ... 17
Figure 4 - Improving or deterioration of public administration among Europe from 2009 to 2014. Scale from 1 to 10; Curry, 2014 ... 22
Figure 5 - Views of public sector executives in 20 European states on the performance of public administration over the last five years. Scale from 1 to 10; Curry, 2014 ... 22
Figure 6 - View of the public-sector executives in 20 European states on the importance of public administration reform trends. Scale from 1 to 10; Curry, 2014 ... 23
Figure 7 - Structure of eGovernment Action Plan 2016-2020; European Commission, 2016 .... 36
Figure 8 - Average scores of top-level benchmarks across the 2016 life events; European Commission 2017b ... 37
Figure 9 - Number of countries per stage of maturity; European Commission 2017b ... 38
Figure 10 - Penetration versus Digitisation; European Commission, 2017b ... 40
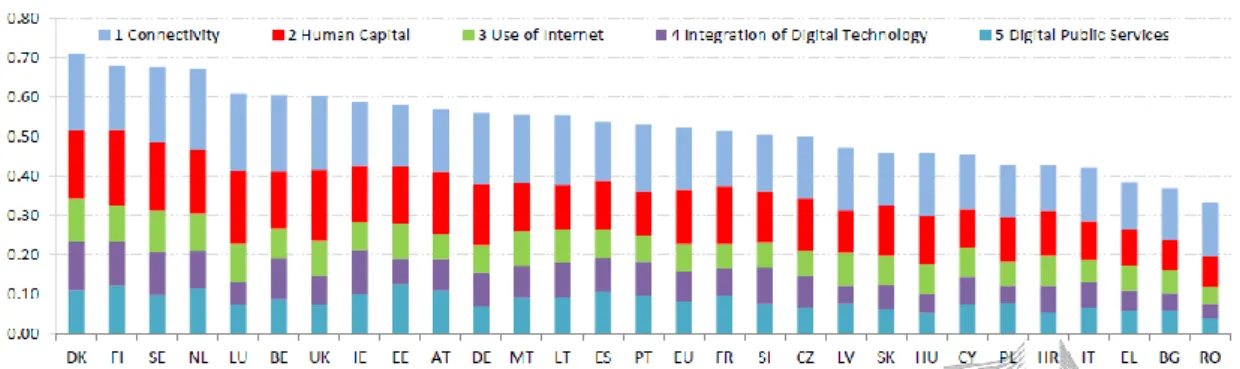
Figure 11 - Ranking of EU Member States according to DESI index; European Commission 2017a ... 41
Figure 12 - European States positions about DMI index; Osservatorio Agenda Digitale, 2017 .. 43
Figure 13 - Categorization of electronic payment systems; Al-Maaitah, 2015 ... 47
Figure 14 - The economic cycle of payments; Zandi et al., 2016 ... 49
Figure 15 - Roadmap for a national payment strategy; McKinsey&Company, 2013 ... 51
Figure 16 - E-government and the role of e-payment; Treiblmaier et al., 2004 ... 55
Figure 17 – Piano Triennale per L’Informatica structure; Presidenza del Consiglio dei Ministri 2017 ... 62
Figure 18 - Actors involved in the pagoPA system; Agenzia per l'Italia Digitale, 2017b ... 66
Figure 19 - Payment life cycle; Agenzia per l'Italia Digitale, 2017b ... 67
Figure 20 - Description of the model 1 workflow; Agenzia per l'Italia Digitale, 2017b ... 69
Figure 21 - Description of the model 3 workflow; Agenzia per l'Italia Digitale, 2017b ... 70
Figure 22 - Methodology framework ... 74
Figure 23 - Progresses on the pagoPA project by Digital Transformation Team ... 75
Figure 25 - Geographical distribution of the pagoPA survey respondents ... 86
Figure 26 - Comparison between sizes of respondents and national Municipalities, pagoPA survey ... 87
Figure 27 - Knowledge of the pagoPA project (eGovernment Observatory, 2018) ... 87
Figure 28 - Municipalities who joined the pagoPA project and how (eGovernment Observatory, 2018) ... 88
Figure 29 - Expected barriers from the pagoPA joining process (eGovernment Observatory, 2018) ... 89
Figure 30 - Addressed barriers during the pagoPA activation process (eGovernment Observatory, 2018)... 90
Figure 31 - Technological solutions for accountability (eGovernment Observatory, 2018) ... 91
Figure 32 - Complementary services for the pagoPA experience (eGovernment Observatory, 2018) ... 92
Figure 33 - Linear regression - population band and children ... 100
Figure 34 - Waste tax: linear regression population and debt positions ... 117
Figure 35 - Administrative sanctions: linear regression population and debt positions ... 138
Figure 36 - Administrative sanctions: linear regression population band and digital fines ... 138
Figure 37 - Administrative sanctions: standard costs (Marchio, 2013) ... 141
Table index
Table 1 - Literature review database structure ... 6
Table 2 - Bibliography structure ... 8
Table 3 - Digital Single Market progresses ... 34
Table 4 - pagoPA project funds (Agenzia per l'Italia Digitale, 2014) ... 64
Table 5 - Features of selection and processes selected for the analysis ... 77
Table 6 - School meals: framework ... 98
Table 7 -School meals: Children per population band ... 99
Table 8 - School meals: payment request channels ... 101
Table 9 - School meals: payment channels ... 101
Table 10 - School meals: reconciliation by channel ... 102
Table 11 - School meals: standard data ... 103
Table 12 - School meals: traditional process... 104
Table 13 - School meals: traditional process... 105
Table 14 - School meals: front-office digitisation ... 106
Table 15 - School meals: AS IS process ... 108
Table 16 - School meals: AS IS process ... 109
Table 17 - School meals: digitisation tools ... 110
Table 18 - School meals: back-office digitisation ... 111
Table 19 - School meals: Server annual cost ... 112
Table 20 - School meals: software maintenance cost ... 112
Table 21 - School meals: comparison costs and savings ... 113
Table 22 - Waste tax: framework ... 116
Table 23 - Waste tax: population band and debt positions ... 117
Table 24 – Waste tax: data clearance ... 118
Table 25 - Waste tax: notification channels ... 118
Table 26 - Waste tax: payment channels ... 119
Table 27 - waste tax: reconciliation phase ... 119
Table 28 - Waste tax: standard data ... 120
Table 29 - Waste tax: traditional process... 122
Table 30 - Waste tax: traditional process... 123
Table 32 - Waste tax: AS IS process ... 127
Table 33 - Waste tax: AS IS process ... 128
Table 34 - Waste tax: digitization tools ... 129
Table 35 - Waste tax: Virtual private server costs ... 130
Table 36 - Waste tax: percentage of data clearance by hand ... 131
Table 37 - Waste tax: software maintenance costs ... 131
Table 38 - Waste tax: costs and savings comparison ... 132
Table 39 - Administrative sanctions: debt positions per population band ... 137
Table 40 - Administrative sanctions: digital fines per population band ... 139
Table 41 - Administrative sanctions: notification channel ... 139
Table 42 - Administrative sanctions: payment channels ... 140
Table 43 - Administrative sanctions: reconciliation timing per channel ... 140
Table 44 - Administrative sanctions: traditional process ... 143
Table 45 - Administrative sanctions: traditional processTable 46 - Administrative sanctions: traditional process... 143
Table 47 - Administrative sanctions: traditional process ... 144
Table 48 - Administrative sanctions: AS IS processTable 49 - Administrative sanctions: traditional process... 144
Table 50 - Administrative sanctions: AS IS process ... 147
Table 51 - Administrative sanctions: AS IS processTable 52 - Administrative sanctions: AS IS process ... 147
Table 53 - Administrative sanctions: AS IS process ... 148
Table 54 - Administrative sanctions: AS IS process ... 148
Table 55 - Administrative sanctions: digitization tools ... 149
Table 56 - Administrative sanctions: percentage of non-digitize back-office ... 150
Table 57 - Administrative sanctions: annual server and software maintenance costs ... 150
1
Abstract
The trend to implement digitization projects in recent years is affecting every sector and determining epochal changes, also in the Public Administration.
A significant part of digitization projects is developed without the awareness of what the result will be and the related benefits regarding efficiency, effectiveness and economic impact.
In a world where reducing spending seems to be the primary goal, especially in a country like Italy where the public debt weighs on every decision, implementing strategic digitization projects without a timely analysis of the possible results could result in a counterproductive and sometimes even harmful choice. Indeed, digitization seems to become synonymous with savings, but applying technologies to inefficient processes risk only to amplify the intrinsic problems.
The objective is to exploit the new technologies to review the underlying processes and try to simplify and optimize them, achieving tangible benefits both in economic and quality terms.
The thesis aspires to analyze one of the most significant strategic digitization projects implemented by the Italian Government in recent years, pagoPA: a digital payment system whose beneficiary is the Italian Public Administration.
Despite being a project developed on a national scale, the relative feasibility study that measured the real impact on the system has never been carried out or at least made public. Streamlining the processes in the Public Administration is essential for improving relations between citizens and the public administration, for reducing bureaucracy and for restoring the fundamental role of service provider of the State.
Digitization is a means, not an end, and therefore must be applied appropriately according to the characteristics and scope of the phenomenon to be governed and about the type of service for which it is intended to exploit it.
2
Sommario
La tendenza ad attuare progetti di digitalizzazione negli ultimi anni sta riguardando ogni settore e determinando cambiamenti epocali, anche nella Pubblica Amministrazione. Una parte significativa di questi progetti viene sviluppata senza la consapevolezza di quale sarà il risultato finale ed i relativi benefici in termini di efficienza, efficacia ed impatto economico.
In un mondo in cui ridurre la spesa sembra essere diventato il principale obiettivo, soprattutto in un Paese come l’Italia dove il debito pubblico pesa su ogni decisione, attuare progetti strategici di digitalizzazione senza un’analisi puntuale dei possibili risultati potrebbe rivelarsi per certi aspetti una scelta controproducente e delle volte persino dannosa. Nell’immaginario comune infatti digitalizzazione è ormai diventato sinonimo di risparmio, ma applicare tecnologie a processi inefficienti rischia solo di amplificarne i problemi intrinseci.
L’obiettivo concreto è viceversa quello di sfruttare le nuove tecnologie per rivedere i processi sottostanti e cercare di semplificarli e ottimizzarli, conseguendo benefici tangibili sia in termini economici che di qualità.
L’elaborato si propone di analizzare uno dei più grandi progetti strategici di digitalizzazione attuati dallo stato italiano negli ultimi anni, pagoPA, ovvero un sistema di pagamento il cui beneficiario è la Pubblica Amministrazione Italiana.
Pur essendo un progetto sviluppato su scala nazionale non è mai stato effettuato, o per lo meno reso pubblico, il relativo studio di fattibilità che ne misurasse l’impatto reale sul sistema Paese. Lo snellimento e l’efficientamento dei processi nella Pubblica Amministrazione rappresenta il viatico essenziale per il miglioramento dei rapporti tra il cittadino e la PA, per la “deburocratizzazione” e per il ripristino del ruolo fondamentale di erogatore di servizi dello Stato.
La digitalizzazione è un mezzo, non un fine, e pertanto deve essere applicata adeguatamente in funzione delle tipicità e della portata del fenomeno da governare nonché in relazione alla tipologia di servizio per il quale si intenda sfruttarla.
3
Introduction
The analysis starts with a critical review of the literature present about the European Public Administration context and the digital payments development.
The context description aims at understanding those trends that lead us to need improving Public Administration efficiency and performing spending reviews on Governments expenditures.
The trends are described both form the Public Administration side and from the citizens one, which are the main stakeholders.
After analyzing the trends, the next step is to figure out how the European Governments planned to face them through the Europe 2020 and European Digital Agenda strategies which, thanks to targeted digitization actions, want to improve the Public Administration efficiency creating a Digital Single Market.
For these strategies to succeed, the need to monitoring actions and reforms is crucial, and it is a core responsibility of the European Commission which shared the results mainly through the Progress Report, in which is detailed described the DESI index, and the Benchmark Report.
Finally, to achieve the goal of a Digital Single Market, a core part is missing because all the laws to improve trades would be not useful if payments cannot be made securely and practically. Indeed, a complementary initiative was needed: the creation of a single euro payments area.
So, the digital payments section starts with the aim of demonstrating that digitizing payments is the right means to achieve financial inclusion, growth and most of all efficiency goals.
All the digital payment benefits should be exploited to improve efficiency in the Public Administration sector, and there are some State who already applied this strategy. So, some good practices are described to understand which are the related critical success factor.
4
The last step of the literature review is about Italy and how it is following Europe 2020 and European Digital Agenda goals, and how pagoPA, the Italian strategy about digital payments, implementation was structured and carried on detailing its strategy, its execution, and its regulations.
The result of the literature review analysis is a gap in the pagoPA project development. Indeed, a feasibility study about the potential project impact is missing which is the core result of this thesis.
A focus has been made on three different payment processes performed by Municipalities to highlights the impacts regarding efficiency and effectiveness, understood as full-time equivalent of human resources works.
5
1. Literature review
The literature review goal is critically analyzing the available knowledge on a specific topic to discover if some details are missing or gaps are present with the aim to develop new knowledge about the specific theme.
1.1 Literature review methodology
The first chapter of this thesis is aimed at understanding why digital payments could be the right mean to improve the efficiency in the context of Public Administration.
Indeed, the first half describes the context and the strategies determined by the European Union to enhance the growth of Europe and improve the efficiency of its services; goals became even more critical after the 2008 financial crisis.
The second part describes the benefits provided by digital payments, some example of their application in the Government context and the strategy implemented by the Italian Government.
The tools used are common for both part, even if the tag or keyword used to do the research are of course dissimilar, and, as we will see later, also the type of documents founded and used are different. The primary tools were Google Scholar and the online database provided by the Politecnico of Milano called Scopus, but, after reading some papers, some journal turned out to be more useful and suited for this thesis (e.g. Government Information Quarterly). So, the second step was searching directly on these journal websites and, regarding the part of European strategies, directly on the European Commission website.
The title and the abstract determined the utility of the paper in the first moment. If the paper turned out to be useful, was stored in a database in which have been writing some specific features of the paper as title, publishing year, authors, paper typology, publishing place.
The selected papers have been read in detail, and their brief description was added in the database.
6
The database was created to keep track of each paper and to perform a quantitative analysis of the literature review. Below an example of one paper stored in the database described.
FILE’S NAME Antecedents of the Adoption of E-Payment Services in the Public S
TITLE Antecedents of the Adoption of E-Payment Services in the Public Sector
AUTHOR/S
Treiblmaier, Horst Pinterits, Andreas Floh, Arne
PUBLICATION DATE 2004
PUBLICATION STATE Austria
PUBLICATION TYPE Paper
JOURNAL International Conference on Information Systems
SOURCE TYPE Primary
BRIEF DESCRIPTION
The paper describes the importance of payments roles in the e-government context and the aim is to describe those factors influencing citizens behaviour in public e-payments usage as trust and previous experiences. KEYWORDS Digital payments Innovation E-government INTERESTING FEATURES Table page 4
CHAPTER E-government PA digital payments
USED (how many times per chapter)
1 1
Table 1 - Literature review database structure
After storing each paper, the quantitative analysis has been done. The main purpose is providing an immediate view of the paper analysed and try to extract some useful findings from the available knowledge on this thematic.
156 documents have been downloaded for the literature review, but only 115 resulted useful.
7
The analysis has been divided into two parts, according to the structure of the literature review: the context of the European Union, the trend affecting it and the strategies implemented and the one about digital payments, their benefits, and pagoPA, the Italian system for digital payments to Public Administration.
Table 1 above shows in detail the paper analysed for each chapter of the literature review.
The article is the main kind of document used to describe either the context and the payments sections and the second widespread documents are the Report.
Intuitively, about the context most of the documents have been written by the European Union (53%), while for the second one there is a dominance of the Italian one, that could be explained because half of the second part concern the Italian strategy of payment digitization.
Most of the documents are prime source (72%), mainly because a crucial role has been attributed to the European and Italian strategy explanation, so governmental source has been used.
Also, the most quoted authors respect the importance given to the explanation of the two strategies, in which official sources have been chosen, because for the context is the European Commission and, for the second one, the Agenzia per l’Italia Digitale, the owner of the pagoPA project.
Lastly, it is interesting for this thesis, notice that regarding the pagoPA chapter no scientific article has been written, and only official sources exist. The subject is therefore unexplored.
8
9
1.2 Public Administration, how big is Government expenditure?
This chapter aims to describe the context and trends that governments are facing stressing how much is their expenditure and the importance of reducing it through more efficient processes.
“The public government is the part of national economy providing basic goods or services that either or not, or cannot be, provided by the private sector. It consists of national and local governments, their agencies and their chartered bodies. Indeed, the public sector is one of the largest sectors of any economy.”1
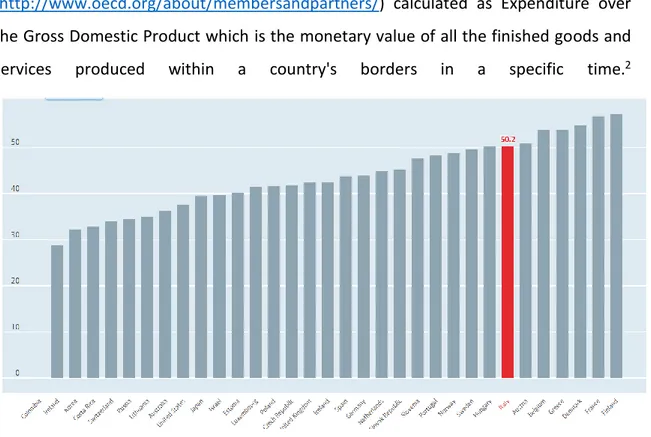
As reported in the (Government at a Glance 2017, 2017) in the figure below is shown how much is the government expenditure in each OECD country (http://www.oecd.org/about/membersandpartners/) calculated as Expenditure over the Gross Domestic Product which is the monetary value of all the finished goods and services produced within a country's borders in a specific time.2
Figure 1 could be approximated as the size of the government for each represented
1 (http://www.businessdictionary.com/definition/public-sector.html, accessed 15 January 2018)
2 ( https://www.investopedia.com/terms/g/gdp.asp#ixzz59a68CD9N )
Figure 1 - Expenditures on GDP; Government at a Glance 2017, 2017 Figure 1 - Expenditures on GDP; Government at a Glance 2017, 2017
10
country. It is easy to highlight that for Italy the government expenditures account almost for the 50% of the GDP.
Furthermore, this data got worse after the 2008 financial crisis (Beding et al., 2013) that hit Europe, lowering the Europe GDP by 4% worsening the situation (European Commission, 2009) and the trust of citizens to governments, as will be described in the next chapter.
Other data that could highlight the problems generated by the 2008 crisis is that 10% of active European population became unemployed contributing to an average 7% deficits and 80% debts of GDP. (European Commission, 2010)
The 2008 crisis is not the only trend that is affecting governments, as outlined in the Report “Global trends affecting the public sector” by (Barber, Levy, & Mendonca, 2007) sustaining that governments and companies are facing a new era in term of macroeconomics, social and environmental and business trends.
Regarding the macroeconomics ones can be noticed a geographical shift in terms of economic activity: EU economy accounted for the 31,4 % of the global GDP in 2004, while in 2014 there was a decrease to 23,8%; contrary to countries as China that has
grown by ten percentage points over the same period.3 Also, McKinsey considers an
aggravating factor the shift of the average population age in developed countries: the aging process leads to an increasing need for government money for example to cover retirement plans and healthcare system; exasperated by the declining of working population both due to a low birth and employment rate.
Another factor that affects European economy is the average growth rate, calculated as the GDP growth, of Europe that is lower than the one of our economic competitors. In 2017 was 2.7% for the Euro Area, while was 6.8% for the China economy and 7.2% for
the Indian one.4
3
(http://ec.europa.eu/eurostat/statistics-explained/index.php/The_EU_in_the_world_-_economy_and_finance ).
11
According to Josè Manuel Barroso, previous president of the European Commission by 2004 to 2014, the main reasons are the low investments in innovation and R&D, reduced use of Information and Communication Technologies (hereafter ICT) and tardiness in embracing innovation.
A subsequent trend that is affecting the Governments is the one of performing spending
reviews: “Spending reviews refer to the systematic and in-depth scrutiny of baseline expenditures with the objective to detect efficiency savings and opportunities for cutting low-priority or ineffective expenditures in a coordinated effort” (Vandierendonck, 2014).
Due to the problems highlight above and the financial crisis consequences, governments are trying to reduce expenses. The need to enhance expenditure performances is clear. According to European Commission, the tactical purpose of performing a spending review is about improving the efficiency of each public euro spent, and it is considered the most sustainable approach to get to the result. Different ways exist to perform it, but only building a performance culture at all levels of government could cause a good
result. ” (Vandierendonck, 2014) The after-crisis timing could contribute to give a boost
in performing this activity, and some of the European countries are trying to do it. The push came above all from a legislative perspective because in 2011 a Stability Law was drafted in which was defined the expenditure benchmark, which limited expenditure to the GDP growth and the Member States must present a detailed plan which shows costs and revenues, planned actions to decrease cost and their expected impact. The result in many cases was placing a ceiling on expenditure budget. It is crucial to highlight that spending review, and spending cuts are not the same because the former means to save public money, discovering expenditures margins, and create
growth-enhancing projects removing inefficiency while the latter could cause a
decrease in services quality and it is usually not sustainable over time. Indeed, spending review is not always synonymous with cuts, but the underlying assumption is that public
spending can be more efficient. (Vandierendonck, 2014)
Furthermore, has been demonstrated that the increase in government spending does not result in increased efficiency. (Kjurchiski, 2014)
12
So, a consequence of those trends for Governments it improves the effectiveness, calculated as output on outcome (Vecchi, n.d.) which is “the accuracy and completeness
with which users achieve certain goals, indicators include quality of solution and error rates(Frøkjær et al., 2000), providing better and customize services to citizens. To reach
this goal is necessary to invest more in research, personnel, and new technologies. This more significant amount of money could be provided by increasing taxes or reducing expenditures, but both are not tempting solutions for citizens.
So, to improve the output with less budget, the remaining solution is to work instead on the efficiency of the processes calculated as output on input (Vecchi, n.d.)(Aubyn, 2007) which is “the relation between the accuracy and completeness with which users
achieve certain goals and the resources expended in achieving them” (Frøkjær et al.,
2000)
As highlighted above, improving efficiency and, consequently, effectiveness is even more relevant in countries like Italy where the government accounts for more than the 50% of the GDP.
In the context of Public Administration, which is the administrative organization of governments (Marume, 2016), the idea of improving efficiency born in 1980 with the
New Public Management theory. Indeed, since 1970 most of western country become
unsatisfied with their own public administration's methods of bureaucracy and shortage of managerial competencies (Hughes, 2012)(Lynn, 2006). Four were the primary cause of this unsatisfaction: i) a general critic to the size and scope of government, ii) the creation of economic theories, iii) private sector changes and iv) technology changes. As described in the incipit of this chapter, the size of the government is enormous, so rose the idea of pursuing spending review actions to contain costs and the excessive weight
of public expenditure on GDP. (Vandierendonck, 2014)
Instead, economic theories as public-choice theory claimed that markets are more efficient in providing services to citizens because all people act on self-interest, so they are not able to serve the public interest. (Shaw, 2008) As a consequence, Governments are not able to correct market failures and should learn from the private world how to
13
become efficient. New theories claim that private sector strategies could be valid also for the public sector(Treiblmaier, Pinterits, & Floh, 2004) and governments should adopt a market culture. (Lynn, 2006) While technologies change offered different means
through which pursuing efficiency, re-engineering internal processes and build a new kind of relationship with citizens, as the private sector did. Furthermore, this period of
changes was accompanied by a greater awareness of citizens on their right of an effective and efficient government, for example, they started to require information also thanks to the introduction of ICT technologies that made cheaper some activities as
communication ones. (Lynn, 2006) (Hughes, 2012)The result should have been a
customer-driven Government as we will see in the next chapter. (Thomas, 2013) For all these reasons, 80’ was the period of shift between the traditional public administration to public management. The first difference it is in the worlds used to describe them: administration means “to serve” instead of management that means “to control or gain results.” (Hood, 1995)
Kettl (20055) summarized some characteristics of this new paradigm, and the one
concerning the arguments of this thesis are:
- A concern for productivity: being more efficient in the use of public revenues which also implies the capability to measure the policies implemented
- Service orientation: responsiveness to citizens as service recipients
Results of the application of NPM according to (Pollitt, 2000) could be one or more of the followings:
- Savings
- Improved processes
- Improved efficiency
- Greater effectiveness
- Increase capacity/flexibility/resilience of the administrative system
5
https://books.google.it/books?hl=it&lr=&id=l50FBD7Z0YEC&oi=fnd&pg=PP1&dq=kettl+1997+the+global
14
NPM results also lead to a comparison of Government with the private sector (European
Commission, 2014) (Mihaiu et al., 2010). Regarding business trends, the comparison is changing the structure of the Public Administration itself removing the current governments’ departments and stressing the importance of productivity and flexibility in each industry, and it is also modifying the way to manage organizations as the usage of data-driven approaches that allows a more systematic and accurate decisions process. Governments also need to develop and acquire the most diversified knowledge also relying on benchmarks with the private sector, because it has been proven that this is the secret of the most successful private organizations. (Barber et al., 2007)
According to some authors as (D’Orta, 2009), (Dunleavy et al., 2006)and (Osborne, 2018) after almost 40 years from NPM movement development, it is considered a failure in almost all its part. Three are the main reason. First the unbridgeable differences between private and public sector, and the unsolved decision about who should be the employer of civil servants and what are his specific limits and true. Second the basic misunderstanding of what “Efficiency” really means, indeed it was thought that measuring the performances and give consequent reward and punishments to civil servants was enough to improve the organization’s results, while the focus should have been in improving the quality of services to citizens. (Arpaia et al., 2016)
Last, the impossibility to use private and managerial concept into a world governed by specific and strict rules.
However, some idea carried out from NPM still exists and are improving efficiency
mainly through performance measurement instruments and the importance of citizens centricity. The use of ICT instruments could facilitate both these ideas. Indeed,
a new movement born after NPM and, according to (Dunleavy et al., 2006) is called the Digital era governance. The figure below summarized the main idea of the movement which implies both internal and external change in public organizations.
15
Figure 2 - Components of Digital-Era Governance; Dunleavy et al., 2006
As we saw ICT is one of the global trends affecting more our economy, indeed It is estimated that half of the productivity growth derives from investment in ICT, that the digital economy is growing at seven times the rate (Al-Khouri, 2014)of the rest of the economy and 3% of GDP derived from ICT services. (European Commission, 2014a) (Rossetti, 2017)
The world is becoming digital and Public Administration should exploit those new technologies: this context was the right boost for eGovernment development.
EGovernment is the delivery of information or services through digital channels. (Kanaan, Hassan, & Shahzad, 2016) (Cordella & Bonina, 2012)(Gasova & Stofkova, 2017) (Proskuryakova, 2011)(Moroz, 2017)(Shanab et al., 2013) (Cenini, 2006) (Venkatesh et al.,2012)
Much definition has been suggested by different experts and organizations to clarify the role and the boundaries of eGovernment.
• “E-Government refers to the use by government agencies of information
technologies (such as Wide Area Networks, the Internet, and mobile computing) that have the ability to transform relations with citizens, businesses, and other
16 arms of government. These technologies can serve a variety of different ends: better delivery of government services to citizens, improved interactions with business and industry, citizen empowerment through access to information, or more efficient government management. The resulting benefits can be less corruption, increased transparency, greater convenience, revenue growth,
and/or cost reductions”6
• “Electronic government (hereafter e-Government) refers to a situation in which
administrative, legislative and judicial agencies (including both central and local governments) digitize their internal and external operations and utilize networked systems efficiently to realize better quality in the provision of public services.” (Urs, 2012)
• “E-government is defined as utilizing the Internet and the world-wide-web for
delivering government information and services to citizens” (Kumar, 2018)
As stated by (Palvia & Sharma, 2007) exists much different definition, but all of them have some common point: eGovernment regards an interaction between citizens and Public Administration through information technologies, and the primary goal is improving the delivery of services to businesses, citizens and others part of the government itself. (Misra, 2006)
So eGovernment implies a relation with multiple subjects and could be classified into three main classes (Palvia & Sharma, 2007):
• Government to citizens (G2C) that regards facilitation of information exchange in both directions
• Government to business (G2B) as in public procurement
• Government to government (G2G) sharing information efficiently and rapidly A 4th cluster exists, is called Government to employees (G2E) but according to this classification is only used internally for example to calculate retirement benefits.
17
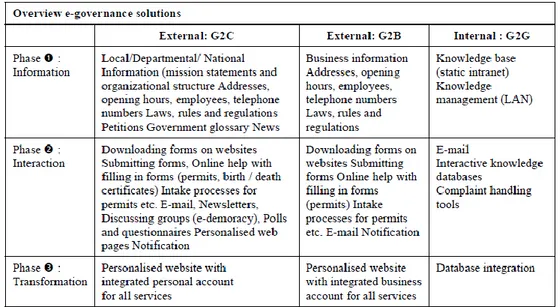
EGovernment has been categorized not only according to the stakeholders involved but also to its mean phases:
• Information: in this phase, public administrations catalog information and to provide them through digital channels to improve the relationship with citizens. All the information should be updated, complete and precise and easy to find • Interaction: administration should deliver platforms or channels to allow a 2-way
communication
• Transformation: an internal review of all the administrative processes is crucial to delivering efficient and timely services, first an internal database integration with web users interfaces to allow citizens to execute transaction as pay taxes, renew driver’s licenses and change their address
The table below shows the integration between the two classifications.
Recently has been added another phase, called the integration phase which implies a shift from the administrative/ bureaucratic-center organization to a citizens-center one. (Ferrara et al., 2016)
More eGovernment is structured and close to citizens ‘needs, more are the advantages that creates for the entire society.
Figure 3 – Overview e-government solutions; Palvia & Sharma 2007 Figure 3 - Overview e-government solutions; Palvia & Sharma, 2007
18
The main ones are well explained in the Report “Using technology to improve public services and democratic participation” (Davies, 2015).
First, a significant cost saving estimated by European Commission by 15% to 20% that could also be increased if the digital by default strategy will be followed that means that digital must be the default option in developing services. In this case, the total saving could be by 6.5€ and 10€ billion annually for the European Union.
Another excellent opportunity for the Government could be to reduce the administrative burdens which are the costs that both citizens and business must deal with when they face public administrations due to some information requirements regulations.
Two main strategies exist to reduce these obligations; the first one is called “once only registration data” so basic information is yield just one time, in 2015 only in 48% of cases Public Administration applied it. If correctly applied this principle could bring a saving of € 5 billion per year inside the European Union. The second one is another step forward and implies databases integration inside public administrations to coordinate different agencies and actors.
eGovernment is also an opportunity to enhance citizens’ trust reform the organizational structured making it more citizen-centric and increasing transparency with an open data strategy.
Indeed, research was conducted by (Thompson S. H., Srivastava, & Jiang, 2008) where is showed that trust in eGovernment is strictly and positively related to the information quality, the system quality and the service quality that in turn are related to citizens’ satisfaction.
Trust is also related to the trust in Government, so it is not enough to improve the quality of the websites or its layout, but more profound actions are needed to gain citizens’ trust, for example, showing them the practical advantages of policies and reforms. It is essential to gain it because there is no a digital alternative for citizens, unlike the case of the e-commerce market, and unsatisfied citizens could switch back to traditional channels.
19
In this context we should consider the challenges of eGovernment as problems related to security and privacy of data, the research mentioned above also shows that trust in eGovernment websites is positively related with citizens’ trust in technology, so the action to increase it should be taken towards the whole ICT system. It is not a specific problem of eGovernment.
Specific ones instead are dealing with digital divide and digital skills training process, both problems concerning citizens skills and behavior.
1.3 Citizens-Centric Approach of Public Administration
This chapter purpose is describing the status of the primary stakeholders of governments services, so citizens and their relation and opinion about Public Administrations, also highlighting some trends they are facing.
As stated before, since NPM developed and still in digital era governance, citizens centricity is one of the primary objectives that Governments should pursue.
Indeed, citizens are expecting from public sector the same service level that is already a standard in the private one. (Dunleavy et al., 2006)
Has been showing that 50% of England people, which were considered the best in Europe in terms of e-participation, index which measures the access of online government initiatives (Osservatorio Agenda Digitale, 2017) are expecting to use government services also in the evening and during the weekend. So, Governments should answer to new citizens’ needs and collaborate with them to gain a better result (Jain & Kesar, 2008) (Massa, Willen, & Zuazua, 2009).
Indeed, according to (Osborne, 2018) two new features are becoming important in the relation between Public Administrations and citizens:
- Customer experience and life experience associated with a service, so the way the service is provided and the impact it could generate and the citizens’ life
20 - Preparation for change: institutions should be flexible and adapt themselves the
external change and possibly the should help citizens during the change
Indeed, maybe the more challenging trends for the Italian bureaucracy: governments need to adapt themselves to new technologies that are changing citizens’ behavior in their daily routine and, also, the way they interact with each other and businesses. So, citizens got used to communicating and exchanging information and data in a rapid and personalized way.
Insights about people are nowadays essential to provide customized services that could improve the perception of Public Administration and, thanks to the Internet, collect the needed information about citizens is not so difficult anymore.
Citizens now could have easier access to public information thanks to Internet, but also thanks to the Freedom of Information Act, in place in the United States since 1966, and came into force in Italy in 2016 with the legislative decree n.97. The decree states the
freedom of access of anyone to data and documents held by public administrations
giving more accountability to the Government.7
The Governments task is not only to place citizens in the middle of the system but also to teach them how to behave to help governments in managing global trends. For example, healthcare prevention is useful for citizens but also in terms of money for the governments that could invest them in research or other activities. (Barber et al., 2007) This shape of citizens’ role inside the Public Administration leads to a change in the government boundaries that were created more than 50 years ago for most of European States.
In Italy government was structured and entered into force the 1st January 1948 thanks to the creation of the Italian Constitution and it is described in detail by the second part: legislation of the Republic. Of course, many things changed in 70 years and to deal with
7
http://www.funzionepubblica.gov.it/sites/funzionepubblica.gov.it/files/Decreto_legislativo_25maggio_ 2016_recante_Revisione_e_semplificazione_delle_disposizioni_in_materia_di_prevenzione_della_corru zione_pubblicita_e_trasparenza.pdf
21
these trends is necessary to carry on joint action besides the Government boundaries. For example, during the latest years, there was an increase of the Public-Private Partnership (PPP) contracting out that is the realization of activities that involve risk-sharing, co-financing and co-delivering of public services by public and private entities together. 8
So, both citizens and governments influence each other.
The way Governments are dealing with trends during the last years combined with the 2008 financial crisis lowered the trust of citizens in Public Administrations. 9
We can assess trust in government as “both a driver of government effectiveness and economic development, and an outcome measure for government action.”(Government at a Glance 2017, 2017) Citizens’ trust increases the acceptance of public policies, allows inclusive governmental processes, enhances investments and consumptions, and confident citizens are more willing to pay taxes.
This latest point was a statement by Scholz and Lubell (1998) that claimed: “
Compliance involves a … risky relationship; citizens undertake some immediate costly effort like paying taxes, and face some risk that future collective benefits expected in return for compliance ... may not materialize unless the government and other citizens maintain their side of the bargain “ (Borgonovi & Burns 2015)
So, trust in governments is one of the key aspects to address dealing with global trends. In 2014 a research was conducted by the Coordinating for Cohesion in the Public Sector of the Future (COCOPS) to discover to the current state of the public sector and the perception of citizens among different features.
The following figures report the data.
8
http://unsdsn.org/wp-content/uploads/2015/05/150529-The-Roles-of-Public-and-Private-Development-Finance.pdf
9Curry, 2014: blogs.lse.ac.uk/europpblog/2014/07/31/new-public-administration-reforms-are-required-to-meet-the-challenges-posed-by-europes-austerity-policies/
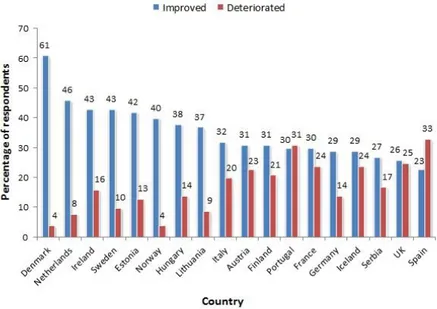
22 We can notice that during the financial crisis the perception of governments’ reform is quite good, also in Italy. However, the interesting thing is seeing how is citizens’ perception of specific performances.
Figure 4 – Improving or deterioration of public administration among Europe from 2009 to 2014. Scale from 1 to 10; Curry, 2014
Figure 4 - Improving or deterioration of public administration among Europe from 2009 to 2014. Scale from 1 to 10; Curry, 2014
Figure 5 - Views of public sector executives in 20 European states on the performance of public administration over the last five years. Scale from 1 to 10; Curry, 2014
23
The worst score is attributed to the citizens’ trust in government revealing a new trend that European governments should face that combined with a poor perception of social cohesion make this data more alarming.
Also, more updated data, form the (Government at a Glance 2017, 2017) shows that trust (42%) it is worse than pre-crisis level (45%).
This chart also highlights a dangerous situation if we compare it with the trends described in the previous chapter.
We have seen that the Governments’ system should be citizens-centric (Kunstelj & Vintar, 2004)(Carter & Bélanger, 2005), but the citizens’ participation and involvements have a low score, and that Governments should chase efficiency and the perception of bureaucracy reducing is also low. (Sinni, 2017)
Indeed, a recent developing paradigm is the one about Open Government which stress the importance of involving citizens in the public administration decisional processes and highlight the importance of transparency suggesting that it is a citizen’s right to should be able to access public information. Also, Open Government claims that new technologies are the right mean to improve the efficiency of public organizations and increase the participation. 10
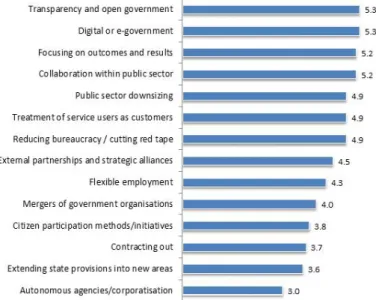
To provide a comprehensive view, also public-sector executives have been interviewed to discover, from an internal point of view which are the most significant reforms to pursue soon.
Instead, the ideas of civil servants, are aligned with the global trends because the importance of chasing efficiency, public-sector downsizing and reducing
10http://open.gov.it/ (9-06.2018)
Figure 6 - View of the public-sector executives in 20 European states on the importance of public administration reform trends. Scale from 1 to 10; Curry, 2014
24
bureaucracy and accountability and digital evolution of the sector are considered as the core reforms.
So, the problem could be the communication with citizens that don’t perceive correctly the reforms made.
Moreover, citizens are now used to services build around them, easy to use and intuitive when they deal with the private sector, so a comparison with the government services is it obvious.
In the process of adapting services to citizens’ needs, Governments should remember that are obliged to ensure the service delivery, even if that means increased costs keeping more channels available. This could happen because not all citizens have digital skills or they do not possess the right instruments. (Barzilai-Nahon, 2006) (European Union, 2015) The latter case is more accessible to settle because institutes could provide that instruments, but the latter one is a huge problem, and it is called digital divide. (Arpaia et al., 2016)
So, this new era could produce new
asymmetries and imbalances and the digital agendas that will be described in the next chapters, was created with the purpose to include as much as possible companies and markets in the world of digital relations and reduce the digital divide. (Agenzia per l’Italia Digitale, 2013) (Ebbers et al., 2016)
Data show that European actions are working. Indeed the digitally excluded are 16% in 2015, while was the 23% in 2011 and a 3% decreases in the offline channels usage. (European Commission, 2017c)
There are many changes that Governments should face; the European Union created a joint strategy to do that.
25
1.4 Strategy 2020
This chapter explains how Europe and the European Government are going to deal with trends described above, creating a common strategy to face them.
As stated in the Report “Europe 2020: A European strategy for smart, sustainable and inclusive growth” drafted by the (European Commission, 2010) because of one of the worst financial crisis ever happened in developed countries and thanks to the emerging of the ICT technologies, the European Union settled some guidelines to preserve the European role in the global context. The Strategy 2020 is the vision of the 21st century
Europe.
Three mutually reinforcing pillars are considered the basis for the European economic growth (Lazzaro, 2013):
- Knowledge and innovation should be the basis of the European economy to enable a smart growth
- At the same time, the economy should be greener, more competitive and more efficient to make this growth sustainable in time
- As we saw in the chapter about global trends, Europe needs to cooperate to avoid duplication of resources, so needs a high-employment economy delivering
social and territorial cohesion
After identifying the vision, European Commission translates them into five operational goals setting a target that Europe should reach until 2020.
The first one regards the employment of population that should reach on average the 75% starting from the 2010 one that was 69%, but this target also includes the goals to comprehend more women, older workers, and migrants inside the workforce.
The second is about investments. Indeed 3% of European GDP on average should be used for Research & Development expenditures that also include innovation ones. Another one is about meeting the 20/20/20 climate target so to reduce the gas emissions by 20% compared to 1990 ones.
26
One about educational level, so the leavers of early schools should be under the 10% and that 40% of the younger generation (30-34) should have completed a tertiary degree.
The last target regards national poverty that should be decreased to 25% making sure that 20 million people come out of poverty.
The targets are intertwined: for example, expenditure in R&D could improve sustainable technologies and helps to reach the climate target.
These numbers represent the critical parameters that EU Commission will see in 2020, but to make this target achievable for each European country, this should be transformed according to each country context, so national targets raised.
Furthermore, for each pillar were drafted some Flagship initiatives which share one concept: maximize the output with the minimum amount of resources. Improving efficiency is the key.
For the goal of this thesis, the important one is a part of the Smart Growth pillar and is “A Digital Agenda for Europe” that was created to develop a Digital Single Market through an ultra-fast internet connection and interoperable applications to deliver sustainable economic and social benefits.
1.5 A Digital Agenda for Europe
In this Chapter will be described in detail the flagship initiatives of the Europe 2020 strategy which is one of the most crucial action to pursue the Public Administrations digitzation.
This flagship initiative was established on the 19th of May 2010 through an official communication of the European Commission.11
27
The primary goal is the establishment of a Digital Single Market that allows Europe to pursue a smart growth, as we saw in the previous chapter.
The Commission identified some problems that could obstruct the smart growth of Europe.
First, the fragmentation of the European digital markets, indeed we should remember that Europe is composed of 28 different States, each one with its culture and its level of digitization.
So, could be difficult to match all the different needs and IT structures, bringing to a lack of interoperability.
There are also some broader problems, not related with European and the public worlds that are the increase in cybercrime and a consequent reduction in trust of IT networks. (European Commission, 2014a)
These two problems could be direct consequences of low expenditures in IT networks and R&D in general that could bring to discover safer technologies for citizens.
Of course, we should also consider the problem of the “demand-side” so the citizens with possible lacks in IT skills and digital literacy.
To deal with these problems, pursuing the goals of the European Strategy 2020, the Digital Agenda for Europe delineated seven areas divided in 23 specific actions which should receive priority: the main idea was improving the ICT structure and networks to promote innovation and increasing standard systems interoperability, facilitating citizens interactions with Public Administrations.
The transversal action and the most important one about the topic in discussion is the realization of a Digital Single market for Europe (DSM)
The Digital Single Market is the adaption of the Single Market, created in 1993 between the 28 EU States and four non-EU, with the arrival of Internet and ICT technologies.
28
The Single Market was created with the idea that free movement could improve efficiency in resources allocation and boost the competition (European Commission, 2015).
The Digital Single Market could be considered the right framework provided by Europe to exploit all the opportunities provided by the ICT technologies.
A definition is needed and for the European Commission is “A Digital Single Market is
one in which the free movement of goods, persons, services, and capital is ensured and where individuals and businesses can seamlessly access and exercise online activities under conditions of fair competition, and a high level of consumer and personal data protection, irrespective of their nationality or place of residence.”(European
Commission, 2015).
Achieve this condition in all the European Union could ensure a smart growth because was estimated that break down all the existing barriers within States could correspond to an increase of € 415 billion in the European GDP and can facilitate the creation of better services, also thanks to more available money to conduct Research&Innovation. Also, savings for citizens will be a significant amount, indeed will be around 11.7 billion each year. Reaching this number will not be easy because in 2015 was estimated that only 38% of citizens felt confident to buy product or services from another State in Europe and only 7% of small-medium enterprises sell in foreign States. The latter number should be alarming because SMEs represent the 99% of all European enterprises.
So, two types of actions will be done by the European Commission that are harmonizing the rules of digital purchasing between the EU States and creating some contractual rights to control sales of tangible goods.
Three pillars were identified by the European Commission to implement the Digital Single Market.
The first one is “Better access for consumers and businesses to online goods and services across Europe.”
29
Selling in its own State should be as easy as selling cross-border, and the delivery costs should be affordable. Now, are estimated to be from two to five times higher.
Furthermore, some online sellers, segment the market by geographical location in which different prices are applied. This is one of the causes of customers’ dissatisfaction and low trust in the cross-border online purchase (European Commission, 2015).
To allow States to sell abroad is not enough to enlarge the geographical location, but the copyright laws should change because 45% of companies willing to sell cross-border are facing this barrier. Also in developing new digital content, not all the available technologies inside the European Union could be shared among the Member States due to this law. So, a sharing framework could improve the digital growth of all the Union. Also, a financial action is needed to ensure that VAT will be paid only one time inside the State Member where the supplier is located through an electronic registration and a payments system.
The second pillar concern the “creation of the right conditions for digital network and services to flourish.” To make transaction inside the European Union easier, an appropriate digital network should be built. Indeed, European Commission wants to set up right rules for the telecom sector creating the Telecom Single Market that will increase competition providing better services and ensure the connectivity level that Europe requires. One legislative measure will affect the Audio-visual Service Directive (Directive 2010/13/EU) to update the law with new technologies and create new channels and model for the distribution of information and contents.
90% of Internet information was created in just two years, mainly by platforms used by citizens indeed they enable companies to provide information to customers and to exploit e-commerce. The European economy, due to its fragmentation, it is not able to exploit all the potential of this technology. (European Commission, 2015) A vast amount of information could also be used in a wrong manner, for example spreading illegal content. So, platform and in broader sense information on the internet should be controlled to allow transparency of data.
30
As we saw in Chapter 1.2, transparency of public administration’s data it is not well perceived by citizens. This problem could be more significant if we think about citizens’ data that lies on Internet and cyber threats and, consequently, the 72% of Internet Users stated that they are worried about personal data. Regulation at national and EU levels exists to prevent these threats, but a more joined approach is preferable to keep up new technologies also exploiting a Public-Private-Partnership approach. European Commission hopes that the General Data Protection Regulation (COM (2012)11 final) will increase trust and protect citizens.
The third pillar on which the Digital Single Market is based is the maximization of the potential growth of the digital economy.
This basic concept is that “Digitisation of all sectors will be needed if the EU is to maintain
its competitiveness and Digital Economy could also make society more inclusive”
(European Commission, 2015).
Data are considered one of the primary drivers for economic growth and having fragmented databases and source of information will not help Europe building the Digital Single Market.
Indeed, as we saw above, just copyrights law and the geographical lock-in issue are problems for data unification and systems interoperability, for this purpose initiatives as “Free flow of data” and the “European Interoperability Framework” will be carried on by the European Commission.
Has been estimated that, if a correct framework is applied, data economy will be worth 4 % of GDP, so € 739 billion.
So, many actions should be taken to improve the digital economy inside Europe; the investments are programmed to be around € 21.4 billion, each action will be carried out on improving productivity and efficiency.
Monitoring the results of its policies is one of the prerogatives of the European Commission.
31
Figure 7 shows the results achieved. (European Commission, 2014c)
Furthermore, in May 2017 a mid-term review of the Digital Single Market Strategy has been done.12 (European Commisson, 2016)
The mid-term review paper highlights once more the main goals of Europe while dealing with technological changes, quoting the exact words of the European Commission: “It is essential that EU businesses grasp the opportunities of digital
technology to remain competitive at global level, that EU startups can scale up quickly, with full use of cloud computing, big data solutions, robotics and high-speed broadband, thereby creating new jobs, increased productivity, resource efficiency and sustainability.”(European Commission, 2017d)
An update on progress and results it is appropriate; a focus will be made on Italy.
32
Thematic area Action Italian status
EU States: actions complete EU States: actions delayed EU States: risk of delay EU States: actions on track EU: actions Not data available Deadline
Digital Single Market
Implement laws to support the digital single market
No data 25 2 / / 1 2011
Transpose the VAT Directive Delayed 16 12 / / / 2013
Interoperability and standards
Implement European Interoperability Framework
Complete 15 10 / / 3 2013
Implement Malmö and Granada declarations
Complete 22 6 / / 2 2013
Trust and security
Establish pan-European Computer Emergency Response Teams
Complete 25 1 / / 2 2012
Carry out cyber-attack simulations Complete 22 / 1 5 / 2020
Implement harmful content alert hotlines
Complete 16 7 / / 5 2013
Set up national alert platforms No data 12 11 / / 5 2012
Very fast internet Develop national broadband plans Complete 14 9 / / 5 2012
Facilitate broadband investment Complete 9 / 4 14 1 2020
Use structural funds to finance the roll-out of high-speed networks
33
Thematic area Action Italian status
EU States: actions complete EU States: actions delayed EU States: risk of delay EU States: actions on track EU: actions No data available Deadline
Very fast internet Implement European Spectrum Policy Programme (ESPP)
On track 16 / 4 8 / 2020
Research and innovation
Double annual public spending on ICT research and development
No data 4 / 17 5 2 2020
Engage in large-scale pilots financed by the Competitiveness and Innovation Programme
Complete 19 / 3 5 1 2020
Enhancing e-Skills
Promote long-term e-skills and digital literacy policies
Delayed 13 12 / / 3 2011
Implement provisions on disability in Telecoms Framework and AVMS
Delayed 22 3 / / 3 2011
Mainstream eLearning in national policies
Complete 13 / / 13 2 2020
ICT for social challenges
Agree on common additional functionalities for smart meters
No data 10 9 / / 9 2011
Include specifications for total lifetime costs for public lighting in public procurement
34
Thematic area Action Italian status
EU States: actions complete EU States: actions delayed EU States: risk of delay EU States: actions on track EU: actions Not data available Deadline
ICT for social challenges
Make eGovernment services fully interoperable
Complete 9 / 6 13 / 2020
Ensure that Points of Single Contact
function as fully fledged
eGovernment centres
No data 8 / 7 11 2 2020
Agree a common list of key cross-border public services
No data 2 18 / / 8 2011
Fulfil obligations under European Rail Traffic Management System (ERTMS)
Complete 10 11 / / 7 2015
35
As we can see in table 3 above13, one of the main problems is the not availability of some data. If European Union wants to carry on these actions to ensure a full Digital Single Market, each Member State must contribute. About Italy, the most concerning data are the missing ones about doubled the public spending on ICT research and developments because if the main idea it is beeing more efficient, costs should be tracked.
Instead, if we look the demand part, the main problem is the delayed action about digital skills and digital literacy policies because citizens should be supported during the innovation process also to increase trust in Public Administration that, as we saw, it is not well perceived.
We just saw that not all the actions outlined in the Digital Agenda for Europe had a positive outcome, so the European Commission decided that there was the need to stress more the importance of Public Administration digitization and to accelerating the digital transformation. This announced with a Communication called “EU eGovernment Action Plan 2016-2020” (European Commission, 2016) The main idea is stressing the benefits and savings due to the realization of the Digital Single Market so the reduction of administrative burdens increasing the public administration efficiency and how ICT could improve economic benefits and the relation with citizens thanks to coordinated actions and funding sources.
The main actions to pursue are the same of the European Digital Agenda, as the “digital by default” and the “once only” principles and all the services should be designed with characteristics of accessibility, transparency, interoperability and cross-border usability. The Action Plan wants to be an accelerator, suggesting specific actions to pursue and stress the importance of the key enablers, the transverse project as the digital identity, that would facilitate the success of the actions established in the Digital Single Market
13Data from European Commission website
36
Strategy. Also, also in 2017, took place the Tallin declaration on eGovernment during which was confirmed the common interest on the new eGovernment Action Plan, but, at the same time, was stressed the importance of transparency and authentication systems to perform online transactions. (European Union, 2017)
Figure 7 - Structure of eGovernment Action Plan 2016-2020; European Commission, 2016
1.6 State of the art of digital services in Europe
Monitoring these actions and reforms, it is a core responsibility of the European Commission, and it is shared mainly through a Progress Report in which is detailed described the DESI index and the Benchmark Report which are the topics of this chapter.
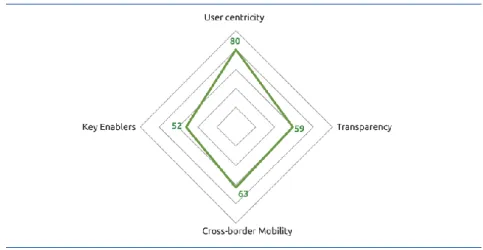
The main goal of the Benchmark Report it is highlights the status of the 28 States Member of European Union and other six including Switzerland, Iceland, Montenegro, Norway, Serbia and Turkey dealing with the modernization of services provided. Four multiple indicators covering the central policies were selected and compared (European Commission, 2017c) but only three are appealing for this thesis:
- User Centricity - indicates if citizens expectations are met and the availability of public services