JHEP08(2011)086
Published for SISSA by SpringerReceived: April 18, 2011 Accepted: August 4, 2011 Published: August 19, 2011
Charged particle transverse momentum spectra in pp
collisions at
√
s = 0.9 and 7 TeV
The CMS collaboration
Abstract: The charged particle transverse momentum (pT) spectra are presented for pp
collisions at√s = 0.9 and 7 TeV. The data samples were collected with the CMS detector at
the LHC and correspond to integrated luminosities of 231 µb−1and 2.96 pb−1, respectively.
Calorimeter-based high-transverse-energy triggers are employed to enhance the statistical
reach of the high-pT measurements. The results are compared with leading and
next-to-leading order QCD and with an empirical scaling of measurements at different collision
energies using the scaling variable xT≡ 2pT/
√
s over the pT range up to 200 GeV/c. Using
a combination of xT scaling and direct interpolation at fixed pT, a reference transverse
momentum spectrum at √s = 2.76 TeV is constructed, which can be used for studying
high-pT particle suppression in the dense QCD medium produced in heavy-ion collisions
at that centre-of-mass energy.
JHEP08(2011)086
Contents 1 Introduction 1 2 The CMS detector 2 3 Event selection 3 4 Primary vertex 5 5 Track selection 76 Event classification by leading-jet energy 7
7 Corrections and systematic uncertainties 10
8 Results 12
9 Interpolation to 2.76 TeV 16
10 Summary 17
The CMS collaboration 22
1 Introduction
The charged particle transverse momentum (pT) spectrum is an important observable for
understanding the fundamental quantum chromodynamic (QCD) interactions involved in proton-proton collisions. While the energy dependence of the bulk of particle production
with pT below a few GeV/c is typically described either empirically or with
phenomeno-logical models, the rest of the spectrum can be well described by a convolution of parton distribution functions, the hard-scattering cross section from perturbative calculations, and fragmentation functions. Such a prescription has been generally successful over a
large range of lower energy pp and p¯p collisions [1–7]. Along with measurements of the
jet production cross section and fragmentation functions, measurements of high-pT
spec-tra provide a test of factorised perturbative QCD (pQCD) [8] at the highest collision
energy to date.
In addition to its relevance to the understanding of pQCD, the charged particle
spec-trum in pp collisions will be an important reference for measurements of high-pT particle
suppression in the dense QCD medium produced in heavy-ion collisions. At the
Rela-tivistic Heavy Ion Collider (RHIC), the sizable suppression of high-pT particle production,
JHEP08(2011)086
pp collisions, was one of the first indications of strong final-state medium effects [9–12].
A similar measurement of nuclear modification to charged particle pT spectra has been
one of the first heavy-ion results at the Large Hadron Collider (LHC) [13]. The reference
spectrum for the PbPb collisions at √sNN = 2.76 TeV per nucleon can be constrained by
interpolating between the pp spectra measured at√s = 0.9 and 7 TeV.
In this paper, the phase-space-invariant differential yield E d3Nch/dp3 is presented for
primary charged particles with energy (E) and momentum (p), averaged over the pseu-dorapidity acceptance of the Compact Muon Solenoid (CMS) tracking system (|η| < 2.4). The pseudorapidity is defined as –ln[tan(θ/2)], with θ being the polar angle of the charged particle with respect to the counterclockwise beam direction. The number of primary
charged particles (Nch) is defined to include decay products of particles with proper
life-times less than 1 cm. Using the integrated luminosities calculated in refs. [14,15] with an
estimated uncertainty of 11% and 4% at √s = 0.9 and 7 TeV, respectively, the differential
cross sections are constructed and compared to a scaling with the variable xT≡ 2pT/
√ s.
Such a scaling has already been observed for p¯p measurements at lower collision
ener-gies [4, 5, 16, 17]. For consistency with the CDF measurements at √s = 0.63, 1.8, and
1.96 TeV, the pseudorapidity range of the xT distributions has been restricted to |η| < 1.0.
Finally, using the new measurements presented in this paper, as well as previously
measured pp and p¯p cross sections, an estimate of the differential transverse momentum
cross section is constructed at the interpolated energy of √s = 2.76 TeV, corresponding to
the nucleon-nucleon centre-of-mass energy of PbPb collisions recorded at the LHC.
The paper is organised as follows: section2contains a description of the CMS detector;
section3describes the trigger and event selection; sections4and5detail the reconstruction
and selection of primary vertices and tracks; section 6 explains the characterisation of
events based on the leading-jet transverse energy; section 7 describes the various applied
corrections and systematic uncertainties; section 8 presents the final invariant differential
yields and comparisons to data and simulation; and section 9 discusses the interpolation
procedures used to construct a reference spectrum at √s = 2.76 TeV.
2 The CMS detector
A detailed description of the CMS experiment can be found in ref. [18]. The central feature
of the CMS apparatus is a superconducting solenoid of 6 m internal diameter, providing an axial magnetic field of 3.8 T. Immersed in the magnetic field are the pixel tracker, the silicon strip tracker, the lead tungstate crystal electromagnetic calorimeter (ECAL), and the brass/scintillator hadron calorimeter (HCAL). Muons are measured in gas ionisation detectors embedded in the steel return yoke.
The CMS experiment uses a right-handed coordinate system, with the origin at the nominal interaction point, the x axis pointing to the centre of the LHC ring, the y axis pointing up perpendicular to the plane of the LHC, and the z axis along the counterclock-wise beam direction. The azimuthal angle, φ, is measured in the (x, y) plane.
The tracker consists of 1440 silicon pixel and 15 148 silicon strip detector modules and measures charged particle trajectories within the nominal pseudorapidity range |η| < 2.4.
JHEP08(2011)086
The pixel tracker consists of three 53.3 cm-long barrel layers and two endcap disks on each side of the barrel section. The innermost barrel layer has a radius of 4.4 cm, while for the second and third layers the radii are 7.3 cm and 10.2 cm, respectively. The tracker is designed to provide an impact parameter resolution of about 100 µm and a transverse momentum resolution of about 0.7 % for 1 GeV/c charged particles at normal incidence (η = 0) [19].
The tracker was aligned as described in ref. [20] using cosmic ray data prior to the
LHC commissioning. The precision achieved for the positions of the detector modules with respect to particle trajectories is 3–4 µm in the barrel for the coordinate in the bending plane (φ).
Two elements of the CMS detector monitoring system, the beam scintillator counters
(BSC) [18,21] and the beam pick-up timing for the experiments devices (BPTX) [18,22],
were used to trigger the detector readout. The BSCs are located at a distance of 10.86 m from the nominal interaction point (IP), one on each side, and are sensitive in the |η| range from 3.23 to 4.65. Each BSC is a set of 16 scintillator tiles. The BSC elements have a time resolution of 3 ns, an average minimum ionising particle detection efficiency of 95.7%, and are designed to provide hit and coincidence rates. The two BPTX devices, located around the beam pipe at a position of z = ±175 m from the IP, are designed to provide precise information on the bunch structure and timing of the incoming beam, with better than 0.2 ns time resolution.
The two steel/quartz-fibre forward calorimeters (HF), which extend the calorimetric coverage beyond the barrel and endcap detectors to the |η| region between 2.9 and 5.2, were used for further offline selection of collision events.
The detailed Monte Carlo (MC) simulation of the CMS detector response is based on
geant4 [23]. Simulated events were processed and reconstructed in the same manner as
collision data.
3 Event selection
This analysis uses data samples collected from 0.9 and 7 TeV pp collisions in the first months
of the 2010 LHC running, corresponding to integrated luminosities of (231 ± 25) µb−1
and (2.96 ± 0.12) pb−1, respectively [14, 15]. This section gives a brief description of the
requirements imposed to select good events for this analysis. A more detailed description
of the CMS trigger selections can be found in ref. [24].
First, a minimum bias trigger was used to select events with a signal in any of the BSC tiles, coincident with a signal from either of the two BPTX detectors, indicating the presence of at least one proton bunch crossing the interaction point. From this sample, collision events were selected offline by requiring a coincidence of BPTX signals, indicating the presence of both beams.
To select preferentially non-single-diffractive (NSD) events, at least one forward calorimeter (HF) tower with energy deposition E > 3 GeV in each of the forward and backward hemispheres was required. Events with beam-halo muons crossing the detector were identified and rejected based on the time difference between BSC hits on either side
JHEP08(2011)086
of the interaction point. Beam-induced background events, producing anomalous numbers of low-quality tracks, were rejected by requiring that at least 25% of the charged particles reconstructed in the pixel-silicon tracking system satisfied the highPurity criterion. This
criterion, described in ref. [25], consists of numerous selections on the properties of the
tracks, including the normalised χ2, the compatibility with the beamline and primary
ver-tices, the number of hit layers, the number of ‘3D’ layers, and the number of lost layers. The selection on the fraction of highPurity tracks was only applied to events with more than 10 tracks, providing a clean separation between real pp collisions and beam backgrounds. The remaining non-collision event fraction, determined by applying the same selections to events where only a single beam was crossing the interaction point, is estimated to be less
than 2 x 10⁻⁵. Events were required to have at least one primary vertex, reconstructed
according to the description in the following section from triplets of pixel hits. A further requirement, namely at least one vertex found from fully reconstructed tracks (see next section for details) with number of degrees of freedom (N dof ) greater than four, was im-posed to improve the robustness against triggered events containing multiple pp collisions, i.e., “event pileup”. The loss in event selection efficiency from the fully-reconstructed-track vertex compared to the pixel vertex alone was determined entirely from data, based on a subset of early runs with negligible event pileup. The percentage of events remaining after
each selection step is presented in table 1.
For a large part of the 7 TeV data collection, the minimum bias trigger paths had to be prescaled by large factors because of the increasing instantaneous luminosity of the
LHC. In order to maximise the pT reach of the charged particle transverse momentum
measurement at this centre-of-mass energy, two high-level trigger (HLT) paths were used
that selected events with minimum uncorrected transverse jet energies (ET) of 15 and
50 GeV, based only on information from the calorimeters. While the higher threshold path
was not prescaled during the 7 TeV data-taking period corresponding to the 2.96 pb−1 used
in this analysis, the lower threshold path had to be prescaled for a significant fraction of this sample. The 0.9 TeV data sample consists of 6.8 million minimum bias triggered events, while the 7 TeV sample is composed of 18.7 million minimum bias events, and 1.4
(5.6) million events selected with the HLT minimum-ET values of 15 (50) GeV.
The selection efficiency for NSD events was determined based on simulated events from
the pythia [26] event generator (version 6.420, tune D6T [27]) that were subsequently
passed through a Monte Carlo simulation of the CMS detector response. The resulting event selection efficiency as a function of the multiplicity of reconstructed charged particles
is shown for 7 TeV collisions in figure 1(a). The corresponding event selection efficiency
is calculated by the same technique for the 0.9 TeV data (not shown). Based on events
simulated with phojet [28, 29] and pythia, the remaining fraction of single-diffractive
(SD) events in the selected sample was estimated to be (5 ± 1)% and (6 ± 1)% for the 0.9 and 7 TeV data, respectively.
JHEP08(2011)086
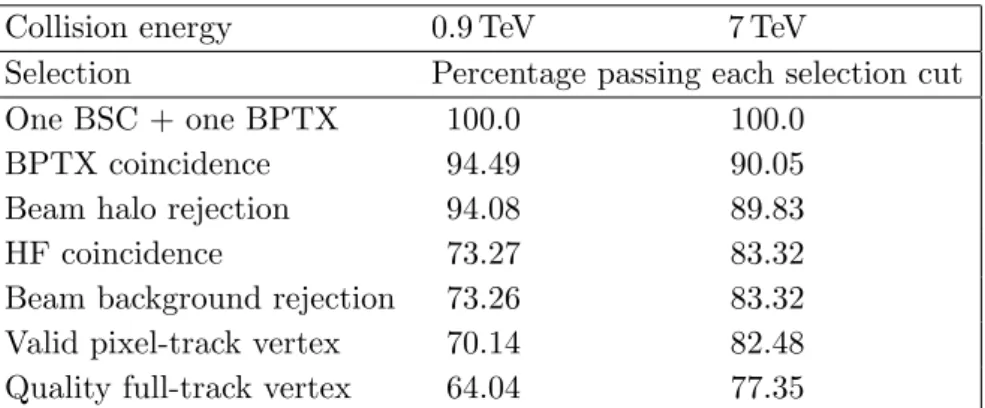
Collision energy 0.9 TeV 7 TeV
Selection Percentage passing each selection cut
One BSC + one BPTX 100.0 100.0
BPTX coincidence 94.49 90.05
Beam halo rejection 94.08 89.83
HF coincidence 73.27 83.32
Beam background rejection 73.26 83.32
Valid pixel-track vertex 70.14 82.48
Quality full-track vertex 64.04 77.35
Table 1. Summary of event selection steps applied to the 0.9 and 7 TeV collision data sets and the percentage of events from the original minimum bias samples that remain after each step.
Charged particle multiplicity
0 10 20 30 40 50 selected SD or f selected NSDε 0.0 0.2 0.4 0.6 0.8 1.0 1.2 CMS Simulation PYTHIA 7 TeV NSD selection efficiency pixel vertex (NSD) track vertex (NSD) Selected event SD fraction
pixel vertex (SD) track vertex (SD) (a) [cm] 0 PV z -15 -10 -5 0 5 10 15 [cm] 1 PVz -15 -10 -5 0 5 10 15 1 10 2 10 -1 Ldt = 10.2 nb
∫
= 7 TeV s CMS (b)Figure 1. (a) The efficiency (εselectedNSD in eq. (7.2)) for selecting non-single-diffractive (NSD) events as a function of the multiplicity of reconstructed charged particles in the tracker acceptance (|η| < 2.4) after applying the full event selection described in the text, including a single pixel-track vertex (filled circles) and additionally requiring a fully-reconstructed-track vertex with N dof > 4 (open circles) as described in section4. Also, the remaining single-diffractive (SD) fraction (fSDselected in eq. (7.2)) as a function of charged particle multiplicity for the same selections (solid and dashed lines). (b) Correlation between the z positions, z0
PV and zPV1 , of the two vertices with the most
associated tracks for measured events with more than one fully-reconstructed-track vertex satisfying the quality selections.
4 Primary vertex
In this analysis, two separate algorithms are employed to determine the primary vertex position. The first is a highly efficient algorithm based on pixel triplet tracks that requires a minimum of just a single track consistent with the beam-spot position. The position of the beam-spot, taken as the centre of the region where the LHC beams collide, is calculated for each LHC fill based on the average over many events of the three-dimensional fitted
JHEP08(2011)086
vertex positions [25]. The second vertex-finding algorithm, based on fully reconstructed
tracks with hits also in the silicon strip tracker, is less efficient in selecting low-multiplicity events, but more robust in discriminating against event pileup. Since pileup is significant over the majority of the analysed data sample, only the fully-reconstructed-track vertex is used to construct the raw charged particle momentum spectra. The raw spectra are subsequently corrected for the fraction of events with fewer than four tracks (and the fraction of tracks in such low-multiplicity events), based on a subset of the event sample selected with the more efficient pixel-track vertex requirement during collision runs with negligible event pileup.
To determine the z position of the pixel vertex in each event, tracks consisting of three
pixel hits are constructed with a minimum pTof 75 MeV/c from a region within a transverse
distance of 0.2 cm from the beam axis. The x and y positions of the pixel vertex are taken from the transverse position of the beam axis. Fitted tracks are selected based on the requirement that the transverse impact parameter is less than three times the quadratic sum of the transverse errors on the track impact parameter and the beam axis position.
The selected tracks are then passed to an agglomerative algorithm [30], which iteratively
clusters the tracks into vertex-candidates. The procedure is halted when the distance
between nearest clusters, normalised by their respective position uncertainties, reaches 12. Only vertices consisting of at least two tracks are kept, except when the event contains a
single reconstructed track, which occurs in 1.67% (0.99%) of the events at√s = 0.9 (7) TeV.
In the case of multiple vertex-candidates, only the vertex with the most associated tracks is kept. While this occurs in as many as 20% of events, the rejected vertex typically has very few associated tracks and is highly correlated in z position to the vertex with the most associated tracks. These characteristics imply that the rejected vertices are not from event pileup, but rather from tracks in the tails of the impact parameter distribution that are not agglomerated into the primary vertex.
The fully-reconstructed-track vertex algorithm begins from a set of tracks selected according to their transverse impact parameter to the beam-spot (< 2 cm), number of hits
(> 6), and normalised χ2 (< 20). These tracks are passed to an adaptive vertex fitter, in
which tracks are assigned a weight between 0 and 1 according to their compatibility with the
common vertex [25]. Quality vertices are further required to have more than four degrees of
freedom (N dof ), corresponding to at least four tracks with weights of approximately one. For events with multiple reconstructed vertices passing the quality selection, the correlation between the z positions of the two vertices with the most associated tracks is shown in
figure 1(b). Other than the diagonal region without multiple vertices, expected from the
algorithmic parameter of at least a 1 cm separation, the uncorrelated positions of the two vertices are indicative of random event pileup.
The event pileup rate is estimated from the fraction of events with multiple recon-structed vertices, after correcting for vertices that are not found because of their proximity. The beam conditions varied over the analysed minimum bias data samples, such that the corrected fraction of pileup events is in the range (0.4–7.5)%. The uncertainty on the event pileup fraction, determined from the largest correction to the multiple-vertex fraction, is a constant factor of 0.2% and 1.2% for the 0.9 and 7 TeV data, respectively.
JHEP08(2011)086
5 Track selectionThis analysis uses tracks from the standard CMS reconstruction algorithm, which consists of multiple iterations of a combinatorial track finder based on various seeding layer
pat-terns [31]. After each iteration, hits belonging unambiguously to tracks in the previous
step are removed from consideration for subsequent steps.
In order to minimise the contribution from misidentified tracks and tracks with poor momentum resolution, a number of quality selections are applied. These include the
high-Purity selection mentioned in section 3, the requirement of at least five hits on the track,
the normalized χ2per degree of freedom divided by the number of tracker layers used in the
fit less than a maximum value which varies from 0.48 and 0.07 depending on η and pT, and
a relative momentum uncertainty of less than 20%. Furthermore, to reject non-primary tracks (i.e., the products of weak decays and secondary interactions with detector mate-rial), only the pixel-seeded tracking iterations are used, and selections are placed on the impact parameter of the tracks with respect to the primary vertex position. Specifically, the transverse and longitudinal impact parameters are required to be less than 0.2 cm and also less than 3 times the sum in quadrature of the uncertainties on the impact parameter and the corresponding vertex position. In the case of multiple quality reconstructed ver-tices in the minimum bias event samples, tracks that pass the impact parameter selections with respect to any vertex are used in the analysis. The number of events, by which the
track pT distribution is normalised, is then scaled by a factor to account for the event
pileup fraction. In contrast, for the jet-triggered samples, tracks are selected based on the impact parameter with respect to the single vertex responsible for the trigger. The primary vertex of the hard-scattering process is identified as the vertex with the largest value of
P p2
T for the associated fitted tracks.
With the above-mentioned selections applied to the reconstructed tracks, the algo-rithmic efficiency determined from simulated pythia events is greater than 85% (80%) for tracks with transverse momentum above 2.0 (0.4) GeV/c averaged over |η| < 2.4
(fig-ure 2(a)). In the same kinematic region, misidentified and non-primary tracks are each
below 1%, while multiple reconstruction occurs for less than 0.01% of tracks.
6 Event classification by leading-jet energy
All events in this analysis are classified according to the transverse energy of the most ener-getic reconstructed jet, defined as the leading jet. Jets are reconstructed from calorimeter
deposits alone using the anti-kT algorithm [32] with cone radius R =p(∆φ)2+ (∆η)2 =
0.5. The measured energy of the jet is adjusted according to corrections based on a MC description of the CMS calorimeter response with a 3–6% uncertainty on the jet energy scale [33].
The motivation for classifying events according to the leading-jet transverse energy
is twofold. First, the degrading effect of the local-track density on the high-pT tracking
performance (e.g., inside a jet) can be parametrised according to this variable. Based on events simulated with pythia in minimum bias and QCD samples with various thresholds
JHEP08(2011)086
η -2 -1 0 1 2 A lg or ith m ic e ffi ci en cy 0.5 0.6 0.7 0.8 0.9 1 PYTHIA 7 TeV > 0.4 GeV/c T p > 2.0 GeV/c T p CMS Simulation (a) [GeV/c] T p 1 10 102 trε × A 0.0 0.1 0.2 0.3 0.4 0.5 0.6 0.7 0.8 0.9 1.0 PYTHIA 7 TeV <20 GeV T 0<E <40 GeV T 20<E <60 GeV T 40<E <80 GeV T 60<E <100 GeV T 80<E <120 GeV T 100<E <200 GeV T 180<E <400 GeV T 380<E CMS Simulation (b) Fake rateFigure 2. (a) The algorithmic tracking efficiency for two different momentum ranges as a function of η. (b) The product of geometrical acceptance (A) with tracking efficiency (εtr) (upper points) and the misidentification (‘fake’) rate (lower points) as a function of transverse momentum for tracks with |η| < 1 in bins of corrected leading-jet transverse energy.
on the hard-scattering scale (ˆpT), the efficiency and misidentification rates of the selected
tracks are estimated as a function of transverse momentum in bins of leading-jet transverse
energy (see figure2(b)). Second, as discussed in section 3, calorimeter-based triggers with
leading-jet transverse energy thresholds of 15 GeV (Jet15U) and 50 GeV (Jet50U) were used
to extend the pT reach of the 7 TeV measurement.
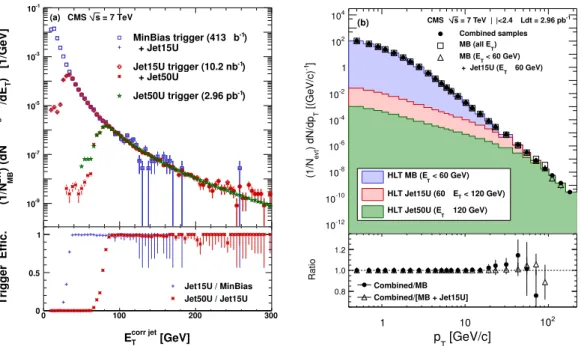
To avoid potential biases from the jet-trigger selection, it is desirable to operate in a region where the trigger is fully efficient. The region above which the jet trigger with an uncorrected energy threshold of 15 GeV becomes fully efficient is determined by first
plotting the leading-jet ET distribution for a sample of events selected with the prescaled
minimum bias trigger and the offline selections described in section 3. This distribution
is then compared to the subset of those events which also fire the 15 GeV jet trigger as a function of corrected transverse energy. The resulting ratio is the trigger efficiency curve
presented in the lower panel of figure3(a). The 15 GeV jet trigger achieves more than 99%
efficiency at a corrected energy of ET = 45 GeV. The analogous procedure is repeated
on a sample of events selected by the 15 GeV jet trigger to determine that the 50 GeV jet
trigger becomes fully efficient above ET= 95 GeV. For the trigger efficiency study, an early
subset of the data (10.2 nb−1) was used, because the minimum bias and lower-threshold jet
triggers were highly prescaled in the later runs. In the upper panel of figure 3(a), the ET
distributions from the jet-triggered sample are normalised per equivalent minimum bias event by matching their integrals in the regions where the triggers are fully efficient.
For the 7 TeV analysis, events are divided into three classes based on leading-jet ET:
below 60 GeV, between 60 and 120 GeV, and above 120 GeV. Since each event is uniquely
JHEP08(2011)086
[GeV] corr jet T E 0 100 200 300 ) [1/GeV]T /dE Leading Jet ) (dN Evt MB (1/N 10-9 -7 10 -5 10 -3 10 -1 10 ) -1 b µ MinBias trigger (413 + Jet15U ) -1 Jet15U trigger (10.2 nb + Jet50U ) -1 Jet50U trigger (2.96 pb = 7 TeV s (a) CMS [GeV] corr jet T E 0 100 200 300 Trigger Effic. 0 0.5 1 Jet15U / MinBias Jet50U / Jet15U T p 1 10 102 ] -1 [(GeV/c) T ) dN/dp evt (1/N -12 10 -10 10 -8 10 -6 10 -4 10 -2 10 1 2 10 4 10 < 60 GeV) T HLT MB (E < 120 GeV) T E ≤ HLT Jet15U (60 120 GeV) ≥ T HLT Jet50U (E -1 Ldt = 2.96 pb ∫ |<2.4 η = 7 TeV | s CMS Combined samples ) T MB (all E < 60 GeV) T MB (E 60 GeV) ≥ T + Jet15U (E (b) [GeV/c] T p 1 10 102 Ratio 0.8 1.0 1.2 Combined/MB Combined/[MB + Jet15U]Figure 3. (a) Upper panel: distributions of the corrected transverse energy of leading jets nor-malised by the number of selected minimum bias events NEvt
MB. Lower panel: the efficiency turn-on
curves for the jet triggers with uncorrected energy thresholds of 15 and 50 GeV. (b) Upper panel: the three contributions to the charged particle transverse momentum spectrum and their sum (solid circles). Open squares show the minimum bias spectrum for all values of leading-jet ET; open
tri-angles show the spectrum with the addition of only the lower threshold jet trigger. Lower panel: the ratio of the combined spectrum to minimum bias only (solid circles) and with the addition of only the lower threshold jet trigger (open triangles).
the sum of the spectra from the three ranges, each corresponding to a fully-efficient HLT selection (i.e., minimum bias, 15 GeV jet trigger, and 50 GeV jet trigger). The contributions to the spectra from the jet-triggered events are normalised per selected minimum bias event; the fraction of minimum bias events containing a leading jet with greater than either 60
or 120 GeV is calculated as shown in figure 3(a) by matching the fully-efficient regions of
the leading-jet ETdistributions. The three contributions to the combined charged particle
transverse momentum spectrum are shown in figure 3(b). The lower panel of that figure
compares the combined spectrum first to the minimum bias spectrum alone and then to a spectrum constructed with the addition of only the lower-threshold jet trigger. These
are all in good agreement within their respective statistical uncertainties. A pT-dependent
systematic uncertainty of 0–4% is attributed to the normalisation of the contributions from
the triggered samples. This value is determined by changing the leading-jet ET ranges that
separate the three samples (e.g., to ET = 40 and 100 GeV), by basing the normalisation
directly on the HLT prescale values, and by comparing the normalisations determined from different subsets of the full data sample.
JHEP08(2011)086
7 Corrections and systematic uncertaintiesTo obtain the final phase-space-invariant charged particle differential momentum distribu-tion, a number of corrections must be applied to the raw distributions of reconstructed charged particles, according to the following equation:
Ed 3N ch dp3 (pT, η) = P M,Ejet T
Ntrackraw (M, ETjet, pT, η) · wtr(pT, η, ETjet) · wev(M )
2πpT· ∆pT· ∆η ·PMNselected(M ) · (1−fNSD0 ) −1 · (1+fpileup) · w ev(M ) , (7.1) where Nraw
track is the raw number of tracks in a bin with transverse momentum width ∆pT
and pseudorapidity width ∆η, and Nselected is the number of selected events. An event
weight wev (see eq. (7.2)) is applied as a function of the multiplicity of reconstructed
charged particles (M ), while a track weight wtr (see eq. (7.3)) is applied for each M and
leading-jet transverse energy (EjetT ), as a function of pT; the final results are summed over
M and ETjet. The number of selected events is corrected for the fraction of NSD events
(fNSD0 ) that have zero reconstructed tracks in the tracker acceptance of |η| < 2.4 (about
5%) and for the pileup event fraction (fpileup).
The multiplicity-dependent event weight wev accounts for the efficiency of the event
selection for accepting NSD events (εselectedNSD ) and for the fraction of SD events (fSDselected)
that contaminate the selected sample (about 5% overall):
wev(M ) =
1 εselected
NSD
(1 − fSDselected). (7.2)
The correction factor wtr, by which each track is weighted, is calculated for each bin
in transverse momentum, pseudorapidity, and leading-jet transverse energy. This factor
accounts for the geometric detector acceptance (A) and algorithmic tracking efficiency (εtr),
as well as the fraction of tracks corresponding to the same, multiply reconstructed charged particle (D), the fraction of tracks corresponding to a non-primary charged particle (S), and the fraction of misidentified (‘fake’) tracks that do not correspond to any charged particle (F ):
wtr(pT, η, ETjet) =
(1 − F ) · (1 − S)
A · εtr· (1 + D) . (7.3)
The common uncertainty related to the triggering and event selection efficiency is
dis-cussed in detail in ref. [34]. Contributions from uncertain diffractive-event fractions and
detector inefficiencies in the BSC and HF combine to contribute a scale error of ±3.5% to
the total systematic uncertainty at√s = 7 TeV (see table2). At√s = 0.9 TeV, the
diffrac-tive fractions are slightly better constrained, hence an uncertainty of ±3.2% is assigned.
Using simulated events generated with pythia tune D6T, the various terms in eq. (7.3)
are estimated by matching selected reconstructed tracks to simulated tracks based on the requirement that they share 75% of their hits. As an example, the algorithmic efficiency
(εtr) versus η is presented in figure2(a). The slight asymmetry between the positive and
JHEP08(2011)086
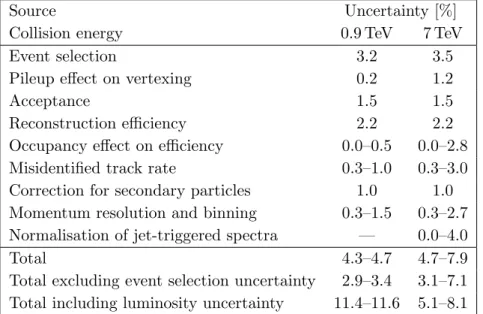
Source Uncertainty [%]
Collision energy 0.9 TeV 7 TeV
Event selection 3.2 3.5
Pileup effect on vertexing 0.2 1.2
Acceptance 1.5 1.5
Reconstruction efficiency 2.2 2.2
Occupancy effect on efficiency 0.0–0.5 0.0–2.8
Misidentified track rate 0.3–1.0 0.3–3.0
Correction for secondary particles 1.0 1.0
Momentum resolution and binning 0.3–1.5 0.3–2.7
Normalisation of jet-triggered spectra — 0.0–4.0
Total 4.3–4.7 4.7–7.9
Total excluding event selection uncertainty 2.9–3.4 3.1–7.1
Total including luminosity uncertainty 11.4–11.6 5.1–8.1
Table 2. Summary of the various contributions to the estimated systematic uncertainty.
of dead channels in the tracker. The systematic uncertainties assigned to the various track-ing corrections are discussed below and are summarised, along with the total systematic
uncertainty, in table2.
The uncertainty on the geometrical acceptance of the tracker was estimated from three sources. First, the efficiency of the pixel hit reconstruction was estimated from a data-driven technique involving the projection of two-hit combinations (called tracklets) onto the third layer in search of a compatible hit. The observed efficiency of (99.0 ± 0.5)% leads to a 0.3% uncertainty on the acceptance of pixel-seeded tracks. Second, the variation of the geometrical acceptance was estimated for a variety of generator tunes including
pythia8 [35] and the Perugia0 [36] tune of pythia. Third, the variation was estimated
after shifting the generated beam-spot and modifying the width of the generated z vertex distribution. The latter two effects each contribute a 1% shift in the acceptance.
In a similar fashion, using the different generator tunes results in a 2% shift in the reconstruction efficiency. An additional series of checks was performed by varying the cuts imposed during the track selection and in the determination of the corresponding MC-based corrections. The resulting variation in the corrected results contributes another 1% to the reconstruction efficiency uncertainty.
Since the dependence of the reconstruction efficiency on local hit density has been parametrised in terms of leading-jet transverse energy, both the uncertainty on the jet energy scale and the accuracy of the jet-fragmentation description become relevant. The former contribution is estimated by convolving the dependence of the tracking efficiency on
the leading-jet transverse energy (see figure2(b)) with a 4% uncertainty in the jet energy
scale [33]. The latter contribution is estimated by comparing the pythia-based corrections
to herwig++ [37]. The resulting pT-dependent uncertainty on the occupancy is in the
range (0.0–2.8)%.
Based on studies of different generator tunes and MC samples with different hard-scattering scales, the assigned uncertainty to the misidentified-track correction grows
lin-JHEP08(2011)086
early as a function of pT from 0.3 to 3.0%. An additional check was performed for tracks
with pTabove 10 GeV/c to correlate the reconstructed track momentum with the deposited
energy in the projected ECAL and HCAL cells. For the selected tracks in this analysis,
there is no evidence of any excess of high-pT misidentified tracks characterised by atypically
little energy deposited in the calorimeters. The correction for secondaries and feed-down from weak decays is assigned a 1% systematic uncertainty, which is large compared to the
scale of the contributions, but intended to account for the uncertainties in the K0S and Λ
fractions [38].
The tendency for finite bin widths (up to 40 GeV/c) and a finite transverse momentum
resolution (rising from 1 to 5% in the range pT = 10–150 GeV/c) to deform a steeply falling
spectrum is corrected based on the shape of the pTspectrum and the MC-based pTresponse
matrix. The effect of momentum resolution alone is 0.5–2.5%, while the wide binning results in an additional correction ranging from a fraction of a percent up to approximately 20%
in the widest high-pT bins. The correction for the two effects is determined by fitting
an empirical function to the differential yield, smearing it with the MC-based momentum resolution, re-binning into the bins of the final invariant yield, and dividing by the original fitted form. The quoted systematic uncertainty of 0.3–2.7% is estimated by varying the fitted form of the spectrum and by performing multiple iterations of the unsmearing with successively more accurate input spectra.
In addition to the uncertainties from the event selection efficiency weighting and the tracking corrections described above, the total systematic uncertainty contains a contri-bution from the uncertainty on the estimation of the event pileup fraction of 0.2 and 1.2% for the 0.9 and 7 TeV data, respectively. In the cases where the total integrated luminosity is used to normalise the results, this contributes an additional 4% (11%) scale
uncertainty [14, 15] for √s = 7 (0.9) TeV. Assuming that the various pT-dependent
con-tributions are uncorrelated, the total systematic uncertainty is determined from their sum
in quadrature, as indicated in table 2.
8 Results
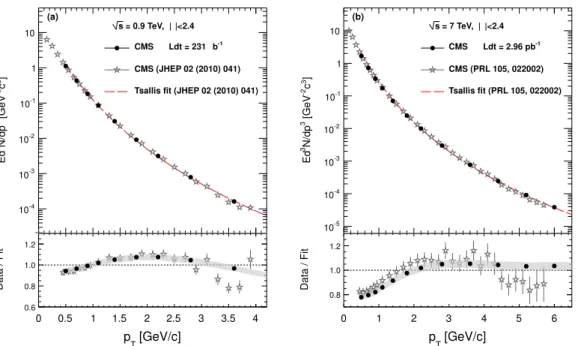
After applying the corrections described in the previous section, the resulting invariant
differential yields for charged particles within |η| < 2.4 are shown for a limited pT range in
figures4(a)and4(b)in order to quantify the agreement with previous CMS measurements
at √s = 0.9 and 7 TeV [24, 34]. At each energy, both CMS measurements are divided
by a Tsallis fit [39] to the earlier measurement and the ratios compared in the lower
panels. For the earlier measurements, the error bars indicate the statistical plus systematic uncertainties added in quadrature. The bands around the new measurements represent all contributions to the systematic uncertainty, except the contribution from the common event selection. Statistical uncertainties are negligible on the new measurements in this
pT range. Below pT = 4 GeV/c for the 0.9 TeV sample and below pT = 6 GeV/c at
√ s = 7 TeV, which are the limits of the previously published CMS spectra, the new results are in reasonable agreement with the earlier measurements. However, the measured spectra do
JHEP08(2011)086
[GeV/c] T p 0 0.5 1 1.5 2 2.5 3 3.5 4 ] 3c -2 [GeV 3 N/dp 3 Ed -4 10 -3 10 -2 10 -1 10 1 10 s = 0.9 TeV, |η|<2.4 -1 b µ Ldt = 231 ∫ CMS CMS (JHEP 02 (2010) 041) Tsallis fit (JHEP 02 (2010) 041)(a) [GeV/c] T p 0 0.5 1 1.5 2 2.5 3 3.5 4 Data / Fit 0.6 0.8 1.0 1.2 [GeV/c] T p 0 1 2 3 4 5 6 ] 3c -2 [GeV 3 N/dp 3 Ed -5 10 -4 10 -3 10 -2 10 -1 10 1 10 s = 7 TeV, |η|<2.4 -1 Ldt = 2.96 pb ∫ CMS CMS (PRL 105, 022002) Tsallis fit (PRL 105, 022002) (b) [GeV/c] T p 0 1 2 3 4 5 6 Data / Fit 0.8 1.0 1.2
Figure 4. (a) Upper panel: the invariant charged particle differential yield from the present analysis (solid circles) and the previous CMS measurements at √s = 0.9 TeV (stars) over the limited pT
range of the earlier result. Lower panel: the ratio of the new (solid circles) and previous (stars) CMS results to a Tsallis fit of the earlier measurement. Error bars on the earlier measurement are the statistical plus systematic uncertainties added in quadrature. The systematic uncertainty band around the new measurement consists of all contributions, except for the common event selection uncertainty. (b) The same for√s = 7 TeV.
of the small difference between the two CMS measurements at √s = 7 TeV is attributed
to the different tracking algorithms used in the two measurements, as well as the different pythia tunes used to determine the tracking corrections.
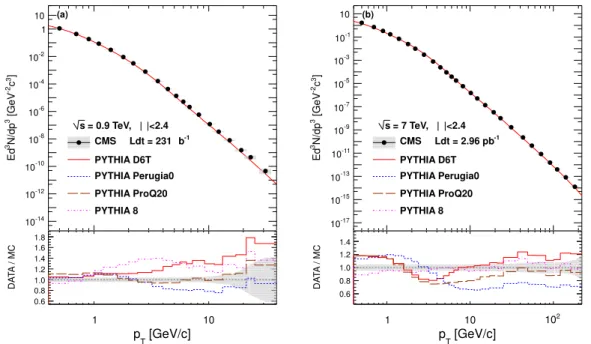
In the upper plots of figures 5(a)and 5(b), the charged particle differential transverse
momentum yields from this analysis are displayed for √s = 0.9 and 7 TeV, respectively.
The latter distribution covers the pTrange up to 200 GeV/c, the largest range ever measured
in a colliding beam experiment. Also shown in the figures are various generator-level MC
predictions for the yields [27, 35, 36, 40]. The lower plots of figures 5(a) and 5(b) show
the ratios of the data to the various MC predictions. As already observed in ref. [34],
there is a deficit of pT < 1 GeV/c particles in the predicted 7 TeV spectra for several
of the popular pythia tunes. For the whole pT range above 1 GeV/c, pythia8 is the
most consistent with the new 7 TeV result (within 10%). This provides an important
constraint on the different generator parameters responsible for sizable variations among
the tunes. A similar but slightly larger spread is observed in figure 5(a) for different
generator parameters at√s = 0.9 TeV, where the CMS measurement is most consistently
described by the ProQ20 tune.
As discussed in ref. [41,42], a robust prediction of pQCD hard processes is the
JHEP08(2011)086
[GeV/c] T p 1 10 ] 3c -2 [GeV 3 N/dp 3 Ed -14 10 -12 10 -10 10 -8 10 -6 10 -4 10 -2 10 1 10 |<2.4 η = 0.9 TeV, | s -1 b µ Ldt = 231 ∫ CMS PYTHIA D6T PYTHIA Perugia0 PYTHIA ProQ20 PYTHIA 8 (a) [GeV/c] T p 1 10 D A TA / M C 0.6 0.8 1.0 1.2 1.4 1.6 1.8 [GeV/c] T p 1 10 102 ] 3c -2 [GeV 3 N/dp 3 Ed -17 10 -15 10 -13 10 -11 10 -9 10 -7 10 -5 10 -3 10 -1 10 10 |<2.4 η = 7 TeV, | s -1 Ldt = 2.96 pb ∫ CMS PYTHIA D6T PYTHIA Perugia0 PYTHIA ProQ20 PYTHIA 8 (b) [GeV/c] T p 1 10 102 D A TA / M C 0.6 0.8 1.0 1.2 1.4Figure 5. (a) Upper panel: the invariant charged particle differential yield at √s = 0.9 TeV compared with the predictions of four tunes of the pythia MC generator. Lower panel: the ratio of the new CMS measurement to the four pythia tunes. The grey band corresponds to the statistical and systematic uncertainties added in quadrature. (b) The same for√s = 7 TeV.
variable xT: Ed 3σ dp3 = F (xT)/p n(xT, √ s) T = F 0(x T)/ √ sn(xT, √ s) , (8.1)
where F and F0 are independent of√s, and the slow evolution of the power-law exponent
n with xT and
√
s (n ' 5–6) is due to the running of αs and changes in the parton
distribution and fragmentation functions. In the upper plot of figure 6(a), the 0.9 and
7 TeV pp measurements from this analysis are compared to the empirical scaling observed
from measurements over a range of lower p¯p collision energies by plotting √snE d3σ/dp3.
For the purpose of reporting the CMS results as differential cross sections, the integrated luminosities for the analysed data samples were measured according to the descriptions
in ref. [14, 15]. Also, to compare with the published results from the CDF experiment at
√
s = 0.63, 1.8, and 1.96 TeV, the pseudorapidity range has been restricted to |η| < 1.0.
Whereas an exponent n = 5.5 was found in ref. [42] from a global fit to only the previous
p¯p measurements from √s = 0.2 to 1.96 TeV, the xT scaling presented in this paper is
optimised for use in an interpolation between the CDF and CMS measurements from√s =
0.9 to 7 TeV. Within this range, the best scaling is achieved with an exponent of n = 4.9 ± 0.1. This is consistent with the predictions of next-to-leading-order (NLO) calculations,
where the scaling is also found to be optimised for this value of the exponent [42]. From
the lower panel of figure 6(a), it is apparent that the NLO calculations over-predict the
JHEP08(2011)086
T x -4 10 10-3 10-2 10-1 ] 3c -2 [mb GeV 3 /dp σ 3 Ed 4.9 /GeV)s ( 5 10 7 10 9 10 11 10 13 10 15 10 17 10 19 10 21 10 |<1.0) η ) + X (| -+h + 0.5(h → ) p pp( ) -1 CMS 7 TeV (2.96 pb ) -1 b µ CMS 0.9 TeV (231 CDF 1.96 TeV CDF 1.8 TeV CDF 0.63 TeV Global power-law fit(a) T x -4 10 10-3 10-2 10-1 Data/NLO 0.5 1.0
1.5 s = 0.9 TeV s = 1.96 TeV s = 7 TeV
T x 0.01 0.02 0.03 0.04 0.05 0.06 0.07 / Fit 3 /dp σ 3 Ed 4.9 /GeV)s ( 0.5 1 1.5 2 2.5 3 3.5 = 2.76 TeV s (GeV/c) for T p 10 20 30 40 50 60 70 80 90 (b) CMS 7 TeV (2.96 pb-1) + fit ) + fit -1 b µ CMS 0.9 TeV (231 CDF 1.96 TeV + fit interpolations T 2.76 TeV x
(corrected by NLO ratios)
T x 0.01 0.02 0.03 0.04 0.05 0.06 0.07 NLO ratio 1.0 1.2 1.4 1.6 1.8 3 (s = 0.9, 1.96, 7 TeV / s = 2.75 TeV) /dp σ 3 Ed 4.9 ) s Ratio of ( = 0.9 TeV s s = 1.96 TeV s = 7 TeV
Figure 6. (a) Upper panel: inclusive charged particle invariant differential cross sections, scaled by√s4.9, for |η| < 1.0 as a function of the scaling parameter xT. The result is the average of the
positive and negative charged particles. Lower panel: ratios of differential cross sections measured at 0.9, 1.96, and 7 TeV to those predicted by NLO calculations for factorisation scales ranging from 0.5–2.0 pT. (b) Upper panel: ratios of the scaled differential cross sections to the global power-law
xTfit described in the text (coloured markers) and fits to these ratios (similarly coloured thin lines).
The expected ratio for √s = 2.76 TeV after applying NLO-based corrections to each of the three measurements as described in the text (solid blue lines). The uncertainty from the NLO parameters is represented by the shaded band. The upper axis translates xT to pTfor
√
s = 2.76 TeV. Lower panel: ratios of the NLO-calculated cross sections at three different energies, scaled by √s4.9, to the cross section calculated at√s = 2.75 TeV. The width of the bands represents the variation of the factorisation scale by a factor of two.
of the relatively good agreement in the inclusive jet spectrum [43,44], which suggests that
the fragmentation functions are not well tuned for LHC energies.
The CMS results are consistent over the accessible xT range with the empirical xT
scaling given by eq. (8.1) and established at lower energies. This quality of the scaling
is more easily seen in the upper panel of figure 6(b), where the points show the ratio of
the various differential cross sections, scaled by √s4.9, to the result of a global
power-law fit to the CDF and CMS data from figure 6(a). The fitting function is of the form
F0(xT) = p0 · [1 + (xT/p1)]p2, where p0, p1, and p2 are free parameters, and the region
below pT= 3.5 GeV/c has been excluded to avoid complications from soft-particle
produc-tion. Considering the somewhat na¨ıve power-law function and the expected non-scaling
effects [45], the new measurement is in reasonable agreement with the global power-law fit
JHEP08(2011)086
9 Interpolation to 2.76 TeVIn order to construct a predicted reference charged particle differential cross section at √
s = 2.76 TeV for comparison with the measured PbPb heavy-ion spectrum, two different
techniques are used in partially overlapping transverse momentum regimes. In the high-pT
range from 5.0–200 GeV/c, where approximate xTscaling is expected to hold, the estimated
2.76 TeV cross section is derived from a common xT-scaling curve, based on the CDF and
CMS measurements shown in figure 6(a). In the low-pT range from 1.0–20 GeV/c, it is
possible to interpolate directly between the several measured cross section values as a
function of √s at each fixed pT value.
As discussed in the previous section, the upper panel of figure6(b) shows the residual
difference from perfect xT scaling with exponent n = 4.9 for the 0.9 and 7 TeV CMS
measurements and for the 1.96 TeV CDF measurement [4,5] . The √s and xT dependence
of the residuals are not unexpected, since this behaviour is predicted by NLO calculations.
This can be seen in the lower panel of figure6(b), which shows the predicted deviation from
perfect xTscaling for calculated NLO cross sections at several collision energies with respect
to a reference centre-of-mass energy of 2.75 TeV [42]. The calculations were performed using
the CTEQ66 parton distribution functions [46], DSS fragmentation [47], and a factorisation
scale µ = pT [42]. Taking the magnitude of the xT-scaling violation from NLO (ranging
from 0–20%), each of the three measurements in data (i.e., 0.9, 1.96, and 7 TeV) can be corrected separately to arrive at an expectation for the 2.76 TeV cross section. The three
independent interpolations based on NLO-corrected xT scaling are shown as solid blue
lines in the upper panel of figure 6(b). The combined ‘best estimate’ (shown as a shaded
band) has an associated uncertainty that covers the deviations of up to 12% observed by
varying the factorisation scale from µ = 0.5 pT to µ = 2.0 pT for each of the three collision
energies. The error band is expanded below pT ≈ 8 GeV/c to include the full difference
between the 1.96 and 7 TeV results, since the evolution of the spectra below this value —
corresponding to xT= 0.0023 (7 TeV), 0.0082 (1.96 TeV), and 0.018 (0.9 TeV) — is no longer
consistently described by xT scaling and the NLO-based corrections. In addition to the
12% contribution from the uncertainty on the NLO-based correction, the final uncertainty on the interpolated cross section has an additional component to account for possible correlations in the luminosity uncertainty between the three measurements. This term, taken as equal to the smallest individual uncertainty (4%), is added in quadrature.
The direct interpolation of cross sections at a fixed value of pT is done using CDF
measurements at √s = 0.63, 1.8 and 1.96 TeV [4, 5, 17], the new CMS measurements
at √s = 0.9 and 7 TeV, as well as an earlier result at √s = 2.36 TeV [24]. The latter
measurement is converted to a differential cross section assuming the total inelastic cross
section of 60.52 mb from pythia. At each energy, an empirical fit to the pT distribution
is first constructed to provide a continuous estimation independent of different binning.
Then, in arbitrarily small pT bins, these empirical fits are evaluated and the evolution of
the cross section with √s is parametrised by a second-order polynomial. Two examples of
these fits are shown in figure 7(a) for pT = 3 and 9 GeV/c. The uncertainty on the value
JHEP08(2011)086
with an additional 4% added in quadrature to account conservatively for any correlation in the luminosity uncertainty between the different measurements.
To arrive at a single interpolated spectrum over the full pTrange, a linear combination
of the two techniques is used with weights that vary linearly across the overlap range from
pT = 5 GeV/c (only direct interpolation at fixed pT) to pT = 20 GeV/c (only xT scaling with
NLO-based residual correction). In the pT range where the two techniques overlap, the
different methods agree to within their respective systematic uncertainties. (The fixed-pT
interpolation value is typically around 8% lower than the xT interpolation.) The resulting
predicted 2.76 TeV differential cross section is shown in the upper panel of figure7(b), and
its ratio with respect to various pythia tunes at that centre-of-mass energy in the lower panel. The uncertainty on the predicted cross section, shown by the grey band in the lower panel, is the weighted sum (where applicable) of the uncertainties derived from the two
methods described in the preceding paragraphs. Also shown in the lower panel of figure7(b)
is the ratio of the predicted 2.76 TeV cross section to that found by simply scaling the CMS
measured 7 TeV result by the expected 2.75 TeV to 7 TeV ratio from NLO calculations [42].
The interpolation used in the recent ALICE publication [13] is a few percent lower than the
result quoted in this paper, but consistent within the respective systematic uncertainties. The behavior of the various generators compared to the interpolated 2.76 TeV cross section
is broadly similar to the 0.9 TeV invariant yields presented in figure7(b). The ProQ20 tune
agrees most closely (within 15%) with the interpolated cross section above 2 GeV/c. Future analysis of a recently recorded 2.76 TeV pp collision sample will provide verification of this result and a reduction in the systematic uncertainties.
10 Summary
In this paper, measurements of the phase-space-invariant differential yield E d3Nch/dp3 at
√
s = 0.9 and 7 TeV have been presented for primary charged particles, averaged over the pseudorapidity acceptance of the CMS tracking system (|η| < 2.4). The results have been shown to be in reasonable agreement with the previously published CMS measurements at √
s = 0.9 and 7 TeV [24, 34] and, except for the surplus of tracks at very low transverse
momentum, with pythia leading-order pQCD. The 7 TeV data are most consistent with
pythia8, which agrees at the 10% level over the full pT range of the measurement. In
con-trast, the 0.9 TeV data are considerably better described by the ProQ20 tune. Additionally,
the consistency of the 0.9 and 7 TeV spectra has been demonstrated with an empirical xT
scaling that unifies the differential cross sections from a wide range of collision energies onto a common curve. Furthermore, within the theoretical uncertainties of the NLO
cal-culations, the residual breaking of xT scaling above pT ≈ 8 GeV/c is consistent between
the measured cross sections and the NLO calculations.
This result has removed a large uncertainty from an important ingredient of existing and future PbPb measurements, namely the pp reference spectrum corresponding to the energy of the 2010 PbPb run: 2.76 TeV per nucleon. By employing a combination of
tech-niques to interpolate between the results presented here at√s = 0.9 and 7 TeV, including
refer-JHEP08(2011)086
[TeV] s 1 10 ] 3c -2 [mb GeV 3 /dp σ 3 Ed 10-2 -1 10 (a) = 3 GeV/c T p |<1.0) η ) + X (| -+h + 0.5(h → ) p pp( ) -1 CMS 7 TeV (2.96 pb CDF 1.96 TeV ) -1 b µ CMS 2.36 TeV (0.2 CDF 1.8 TeV ) -1 b µ CMS 0.9 TeV (231 CDF 0.63 TeV [TeV] s 1 10 3 ] x 10 3c -2 [mb GeV 3 /dp σ 3 Ed -5 10 -4 10 = 9 GeV/c T p = 2.76 TeV interpolated value s scaling interp. T x [GeV/c] T p 1 10 102 ] 3c -2 [mb GeV 3 /dp σ 3 Ed -14 10 -12 10 -10 10 -8 10 -6 10 -4 10 -2 10 1 2 10 |<1.0 η = 2.76 TeV, | s CMS Interpolation PYTHIA D6T PYTHIA Perugia0 PYTHIA ProQ20 PYTHIA 8NLO rescaled CMS 7 TeV (F. Arleo et al.) = 64 mb) mb σ ALICE (scaled by (b) [GeV/c] T p 1 10 102 Interp. / Others 0.6 0.8 1.0 1.2 1.4 1.6
Figure 7. (a) Interpolations between measured charged particle differential cross sections at different√s for the two example values of pT= 3 and 9 GeV/c. Second-order polynomial fits to the
measured data are shown by the solid lines. The open squares show the resulting interpolated cross sections for√s = 2.76 TeV. The open circle on the lower panel represents the corresponding estimate from the xT-scaling approach in the overlap region where both can be estimated. (b) Upper panel:
the predicted 2.76 TeV charged particle differential transverse momentum cross section, based on the combined direct pT interpolation and NLO-corrected xT-scaling techniques described in the
text. Lower panel: ratios of combined interpolation to predictions from several pythia tunes, an NLO-based rescaling approach [42], and the ALICE interpolation used in ref. [13].
ence at √s = 2.76 TeV has been constructed over a large range of transverse momentum
(pT = 1–100 GeV/c) with systematic uncertainties of less than 13%.
Acknowledgments
We wish to congratulate our colleagues in the CERN accelerator departments for the excel-lent performance of the LHC machine. We thank the technical and administrative staff at CERN and other CMS institutes, and acknowledge support from: FMSR (Austria); FNRS and FWO (Belgium); CNPq, CAPES, FAPERJ, and FAPESP (Brazil); MES (Bulgaria); CERN; CAS, MoST, and NSFC (China); COLCIENCIAS (Colombia); MSES (Croatia); RPF (Cyprus); Academy of Sciences and NICPB (Estonia); Academy of Finland, MEC, and HIP (Finland); CEA and CNRS/IN2P3 (France); BMBF, DFG, and HGF (Germany); GSRT (Greece); OTKA and NKTH (Hungary); DAE and DST (India); IPM (Iran); SFI (Ireland); INFN (Italy); NRF and WCU (Korea); LAS (Lithuania); CINVESTAV, CONA-CYT, SEP, and UASLP-FAI (Mexico); PAEC (Pakistan); SCSR (Poland); FCT (Portu-gal); JINR (Armenia, Belarus, Georgia, Ukraine, Uzbekistan); MST and MAE (Russia);
JHEP08(2011)086
MSTD (Serbia); MICINN and CPAN (Spain); Swiss Funding Agencies (Switzerland); NSC (Taipei); TUBITAK and TAEK (Turkey); STFC (United Kingdom); DOE and NSF (USA). Individuals have received support from the Marie-Curie programme and the European Re-search Council (European Union); the Leventis Foundation; the A. P. Sloan Foundation; the Alexander von Humboldt Foundation; the Associazione per lo Sviluppo Scientifico e Tecnologico del Piemonte (Italy); the Belgian Federal Science Policy Office; the Fonds pour
la Formation `a la Recherche dans l’Industrie et dans l’Agriculture (FRIA-Belgium); and
the Agentschap voor Innovatie door Wetenschap en Technologie (IWT-Belgium).
Open Access. This article is distributed under the terms of the Creative Commons
Attribution Noncommercial License which permits any noncommercial use, distribution, and reproduction in any medium, provided the original author(s) and source are credited.
References
[1] F. Arleo and D. d’Enterria, Single inclusive pion pT-spectra in proton-proton collisions at
√
s = 22.4 GeV: data versus perturbative QCD calculations,Phys. Rev. D 78 (2008) 094004
[arXiv:0807.1252] [SPIRES].
[2] PHENIX collaboration, A. Adare et al., Inclusive cross section and double helicity asymmetry for π0 production in p + p collisions at√s = 200 GeV: implications for the
polarized gluon distribution in the proton,Phys. Rev. D 76 (2007) 051106
[arXiv:0704.3599] [SPIRES].
[3] PHENIX collaboration, A. Adare et al., Inclusive cross section and double helicity
asymmetry for π0 production in p + p collisions at√s = 62.4 GeV,Phys. Rev. D 79 (2009)
012003[arXiv:0810.0701] [SPIRES].
[4] CDF collaboration, T. Aaltonen et al., Measurement of particle production and inclusive differential cross sections in p¯p collisions at√s = 1.96 TeV,Phys. Rev. D 79 (2009) 112005
[arXiv:0904.1098] [SPIRES].
[5] CDF collaboration, T. Aaltonen et al., Measurement of particle production and inclusive differential cross sections in p¯p collisions at√s = 1.96 TeV,Phys. Rev. D 79 (2009) 112005
[arXiv:0904.1098] [SPIRES].
[6] ATLAS collaboration, G. Aad et al., Charged-particle multiplicities in pp interactions measured with the ATLAS detector at the LHC,New J. Phys. 13 (2011) 053033
[arXiv:1012.5104] [SPIRES].
[7] ALICE collaboration, K. Aamodt et al., Transverse momentum spectra of charged particles in proton-proton collisions at√s = 900 GeV with ALICE at the LHC,Phys. Lett. B 693
(2010) 53[arXiv:1007.0719] [SPIRES].
[8] A.S. Yoon, E. Wenger and G. Roland, Convoluting jet spectra with fragmentation functions: a cross-check of the charged particle pT spectrum,arXiv:1003.5928[SPIRES].
[9] B.B. Back et al., The PHOBOS perspective on discoveries at RHIC,Nucl. Phys. A 757
(2005) 28[nucl-ex/0410022] [SPIRES].
[10] STAR collaboration, J. Adams et al., Experimental and theoretical challenges in the search for the quark gluon plasma: the STAR collaboration’s critical assessment of the evidence from RHIC collisions,Nucl. Phys. A 757 (2005) 102[nucl-ex/0501009] [SPIRES].
JHEP08(2011)086
[11] PHENIX collaboration, K. Adcox et al., Formation of dense partonic matter in relativisticnucleus nucleus collisions at RHIC: experimental evaluation by the PHENIX collaboration,
Nucl. Phys. A 757 (2005) 184[nucl-ex/0410003] [SPIRES].
[12] BRAHMS collaboration, I. Arsene et al., Quark gluon plasma an color glass condensate at RHIC? The perspective from the BRAHMS experiment,Nucl. Phys. A 757 (2005) 1
[nucl-ex/0410020] [SPIRES].
[13] ALICE collaboration, K. Aamodt et al., Suppression of charged particle production at large transverse momentum in central Pb-Pb collisions at√sN N = 2.76 TeV,Phys. Lett. B 696
(2011) 30[arXiv:1012.1004] [SPIRES].
[14] CMS collaboration, Measurement of CMS luminosity, CMS Physics Analysis Summary,
CMS-PAS-EWK-10-004(2010).
[15] CMS collaboration, Absolute luminosity normalization, CMS Detector Performance Summary,CMS-DP-2011-002(2011).
[16] UA1 collaboration, C. Albajar et al., A study of the general characteristics of
proton-anti-proton collisions at√s = 0.2 TeV to 0.9 TeV,Nucl. Phys. B 335 (1990) 261
[SPIRES].
[17] CDF collaboration, F. Abe et al., Transverse momentum distributions of charged particles produced in ¯pp interactions at√s = 630 GeV and 1800 GeV,Phys. Rev. Lett. 61 (1988) 1819
[SPIRES].
[18] CMS collaboration, S. Chatrchyan et al., The CMS experiment at the CERN LHC,2008
JINST 3 S08004[SPIRES].
[19] CMS collaboration, CMS physics TDR: volume I, detector performance and software,
CERN-LHCC-2006-001(2006) [SPIRES].
[20] CMS collaboration, S. Chatrchyan et al., Alignment of the CMS silicon tracker during commissioning with cosmic rays,2010 JINST 5 T03009 [arXiv:0910.2505] [SPIRES]. [21] A.J. Bell, Design and construction of the beam scintillation counter for CMS, Master’s
thesis, University of Canterbury, Christchurch, New Zealand (2008).
[22] T. Aumeyr, Beam phase and intensity monitoringll for the compact muon solenoid experiment, Master’s thesis, Vienna University of Technology, Vienna, Austria (2008). [23] Geant4 collaboration, Geant4: a simulation toolkit,Nucl. Instrum. Methods A 506 (2003)
250[SPIRES].
[24] CMS collaboration, V. Khachatryan et al., Transverse momentum and pseudorapidity distributions of charged hadrons in pp collisions at√s = 0.9 and 2.36 TeV,JHEP 02 (2010)
041[arXiv:1002.0621] [SPIRES].
[25] CMS collaboration, Tracking and vertexing results from first collisions, CMS Physics Analysis Summary,CMS-PAS-TRK-10-001(2010).
[26] T. Sj¨ostrand, S. Mrenna and P.Z. Skands, PYTHIA 6.4 physics and manual,JHEP 05
(2006) 026[hep-ph/0603175] [SPIRES].
[27] P. Bartalini, (ed. ) et al., Proceedings of the first international workshop on multiple partonic interactions at the LHC (M P I08),arXiv:1003.4220[SPIRES].
[28] F.W. Bopp, R. Engel and J. Ranft, Rapidity gaps and the PHOJET Monte Carlo,
JHEP08(2011)086
[29] R. Engel, J. Ranft and S. Roesler, Hard diffraction in hadron hadron interactions and inphotoproduction,Phys. Rev. D 52 (1995) 1459[hep-ph/9502319] [SPIRES]. [30] F. Sikler, Study of clustering methods to improve primary vertex finding for collider
detectors,Nucl. Instrum. Meth. A 621 (2010) 526 [arXiv:0911.2767] [SPIRES]. [31] CMS collaboration, W. Adam, Track and vertex reconstruction in CMS, Nucl. Instrum.
Meth. A 582 (2007) 781[SPIRES].
[32] M. Cacciari, G.P. Salam and G. Soyez, The anti-kt jet clustering algorithm,JHEP 04 (2008)
063[arXiv:0802.1189] [SPIRES].
[33] CMS collaboration, Determination of the jet energy scale in CMS with pp collisions at √
s = 7 TeV, CMS Physics Analysis Summary, CMS-PAS-JME-10-010(2010).
[34] CMS collaboration, V. Khachatryan et al., Transverse-momentum and pseudorapidity distributions of charged hadrons in pp collisions at√s = 7 TeV,Phys. Rev. Lett. 105 (2010)
022002[arXiv:1005.3299] [SPIRES].
[35] T. Sj¨ostrand, S. Mrenna and P.Z. Skands, A brief introduction to PYTHIA 8.1, Comput.
Phys. Commun. 178 (2008) 852[arXiv:0710.3820] [SPIRES].
[36] P.Z. Skands, The Perugia tunes,arXiv:0905.3418[SPIRES].
[37] M. Bahr et al., HERWIG++ physics and manual, Eur. Phys. J. C 58 (2008) 639
[arXiv:0803.0883] [SPIRES].
[38] CMS collaboration, V. Khachatryan et al., Strange particle production in pp collisions at√ s = 0.9 and 7 TeV,JHEP 05 (2011) 064[arXiv:1102.4282] [SPIRES].
[39] C. Tsallis, Possible generalization of Boltzmann-Gibbs statistics,J. Stat. Phys. 52 (1988) 479
[40] A. Buckley, H. Hoeth, H. Lacker, H. Schulz and J.E. von Seggern, Systematic event generator tuning for the LHC,Eur. Phys. J. C 65 (2010) 331[arXiv:0907.2973] [SPIRES].
[41] F. Arleo, S.J. Brodsky, D.S. Hwang and A.M. Sickles, Higher-twist dynamics in large transverse momentum hadron production,Phys. Rev. Lett. 105 (2010) 062002
[arXiv:0911.4604] [SPIRES].
[42] F. Arleo, D. d’Enterria and A.S. Yoon, Single-inclusive production of large-pT charged particles in hadronic collisions at TeV energies and perturbative QCD predictions,JHEP 06
(2010) 035[arXiv:1003.2963] [SPIRES].
[43] CMS collaboration, S. Chatrchyan et al., Measurement of the inclusive jet cross section in pp collisions at√s = 7 TeV,arXiv:1106.0208[SPIRES].
[44] ATLAS collaboration, G. Aad et al., Measurement of inclusive jet and dijet cross sections in proton-proton collisions at 7 TeV centre-of-mass energy with the ATLAS detector,Eur. Phys.
J. C 71 (2011) 1512[arXiv:1009.5908] [SPIRES].
[45] R. Sassot, P. Zurita and M. Stratmann, Inclusive hadron production in the CERN-LHC era,
Phys. Rev. D 82 (2010) 074011[arXiv:1008.0540] [SPIRES].
[46] P.M. Nadolsky et al., Implications of CTEQ global analysis for collider observables,Phys.
Rev. D 78 (2008) 013004[arXiv:0802.0007] [SPIRES].
[47] D. de Florian, R. Sassot and M. Stratmann, Global analysis of fragmentation functions for pions and kaons and their uncertainties,Phys. Rev. D 75 (2007) 114010[hep-ph/0703242]
JHEP08(2011)086
The CMS collaborationYerevan Physics Institute, Yerevan, Armenia
S. Chatrchyan, V. Khachatryan, A.M. Sirunyan, A. Tumasyan
Institut f¨ur Hochenergiephysik der OeAW, Wien, Austria
W. Adam, T. Bergauer, M. Dragicevic, J. Er¨o, C. Fabjan, M. Friedl, R. Fr¨uhwirth,
V.M. Ghete, J. Hammer1, S. H¨ansel, M. Hoch, N. H¨ormann, J. Hrubec, M. Jeitler,
W. Kiesenhofer, M. Krammer, D. Liko, I. Mikulec, M. Pernicka, H. Rohringer,
R. Sch¨ofbeck, J. Strauss, A. Taurok, F. Teischinger, P. Wagner, W. Waltenberger,
G. Walzel, E. Widl, C.-E. Wulz
National Centre for Particle and High Energy Physics, Minsk, Belarus V. Mossolov, N. Shumeiko, J. Suarez Gonzalez
Universiteit Antwerpen, Antwerpen, Belgium
L. Benucci, E.A. De Wolf, X. Janssen, J. Maes, T. Maes, L. Mucibello, S. Ochesanu, B. Roland, R. Rougny, M. Selvaggi, H. Van Haevermaet, P. Van Mechelen, N. Van Remortel Vrije Universiteit Brussel, Brussel, Belgium
F. Blekman, S. Blyweert, J. D’Hondt, O. Devroede, R. Gonzalez Suarez, A. Kalogeropoulos, M. Maes, W. Van Doninck, P. Van Mulders, G.P. Van Onsem, I. Villella
Universit´e Libre de Bruxelles, Bruxelles, Belgium
O. Charaf, B. Clerbaux, G. De Lentdecker, V. Dero, A.P.R. Gay, G.H. Hammad, T. Hreus, P.E. Marage, L. Thomas, C. Vander Velde, P. Vanlaer
Ghent University, Ghent, Belgium
V. Adler, A. Cimmino, S. Costantini, M. Grunewald, B. Klein, J. Lellouch, A. Marinov, J. Mccartin, D. Ryckbosch, F. Thyssen, M. Tytgat, L. Vanelderen, P. Verwilligen, S. Walsh, N. Zaganidis
Universit´e Catholique de Louvain, Louvain-la-Neuve, Belgium
S. Basegmez, G. Bruno, J. Caudron, L. Ceard, E. Cortina Gil, J. De Favereau De Jeneret,
C. Delaere1, D. Favart, A. Giammanco, G. Gr´egoire, J. Hollar, V. Lemaitre, J. Liao,
O. Militaru, S. Ovyn, D. Pagano, A. Pin, K. Piotrzkowski, N. Schul
Universit´e de Mons, Mons, Belgium
N. Beliy, T. Caebergs, E. Daubie
Centro Brasileiro de Pesquisas Fisicas, Rio de Janeiro, Brazil G.A. Alves, D. De Jesus Damiao, M.E. Pol, M.H.G. Souza
Universidade do Estado do Rio de Janeiro, Rio de Janeiro, Brazil
W. Carvalho, E.M. Da Costa, C. De Oliveira Martins, S. Fonseca De Souza, L. Mundim, H. Nogima, V. Oguri, W.L. Prado Da Silva, A. Santoro, S.M. Silva Do Amaral, A. Sznajder, F. Torres Da Silva De Araujo
JHEP08(2011)086
Instituto de Fisica Teorica, Universidade Estadual Paulista, Sao Paulo, Brazil
F.A. Dias, T.R. Fernandez Perez Tomei, E. M. Gregores2, C. Lagana, F. Marinho,
P.G. Mercadante2, S.F. Novaes, Sandra S. Padula
Institute for Nuclear Research and Nuclear Energy, Sofia, Bulgaria
N. Darmenov1, L. Dimitrov, V. Genchev1, P. Iaydjiev1, S. Piperov, M. Rodozov,
S. Stoykova, G. Sultanov, V. Tcholakov, R. Trayanov, I. Vankov University of Sofia, Sofia, Bulgaria
A. Dimitrov, R. Hadjiiska, A. Karadzhinova, V. Kozhuharov, L. Litov, M. Mateev, B. Pavlov, P. Petkov
Institute of High Energy Physics, Beijing, China
J.G. Bian, G.M. Chen, H.S. Chen, C.H. Jiang, D. Liang, S. Liang, X. Meng, J. Tao, J. Wang, J. Wang, X. Wang, Z. Wang, H. Xiao, M. Xu, J. Zang, Z. Zhang
State Key Lab. of Nucl. Phys. and Tech., Peking University, Beijing, China Y. Ban, S. Guo, Y. Guo, W. Li, Y. Mao, S.J. Qian, H. Teng, L. Zhang, B. Zhu, W. Zou Universidad de Los Andes, Bogota, Colombia
A. Cabrera, B. Gomez Moreno, A.A. Ocampo Rios, A.F. Osorio Oliveros, J.C. Sanabria Technical University of Split, Split, Croatia
N. Godinovic, D. Lelas, K. Lelas, R. Plestina3, D. Polic, I. Puljak
University of Split, Split, Croatia Z. Antunovic, M. Dzelalija
Institute Rudjer Boskovic, Zagreb, Croatia V. Brigljevic, S. Duric, K. Kadija, S. Morovic University of Cyprus, Nicosia, Cyprus
A. Attikis, M. Galanti, J. Mousa, C. Nicolaou, F. Ptochos, P.A. Razis Charles University, Prague, Czech Republic
M. Finger, M. Finger Jr.
Academy of Scientific Research and Technology of the Arab Republic of Egypt, Egyptian Network of High Energy Physics, Cairo, Egypt
Y. Assran4, S. Khalil5, M.A. Mahmoud6
National Institute of Chemical Physics and Biophysics, Tallinn, Estonia
A. Hektor, M. Kadastik, M. M¨untel, M. Raidal, L. Rebane
Department of Physics, University of Helsinki, Helsinki, Finland V. Azzolini, P. Eerola, G. Fedi
Helsinki Institute of Physics, Helsinki, Finland
S. Czellar, J. H¨ark¨onen, A. Heikkinen, V. Karim¨aki, R. Kinnunen, M.J. Kortelainen,
T. Lamp´en, K. Lassila-Perini, S. Lehti, T. Lind´en, P. Luukka, T. M¨aenp¨a¨a, E. Tuominen,