Titolo
Results of the validation campaign of neutronic codes and
recommendations for the correct application to LFR systems
Descrittori
Tipologia del documento: Rapporto Tecnico,
Collocazione contrattuale: Accordo di programma ENEA-MSE su sicurezza nucleare e reattori di IV generazione
Argomenti trattati: Reattori nucleari veloci, Neutronica
Sommario
Questo documento descrive il lavoro svolto per il secondo obiettivo della task A.1 della Linea Progettuale 2 dell’Accordo di Programma tra ENEA e MiSE (AdP PAR2016 LP2 A.1_b), in cui è stata ulteriormente estesa la base di validazione degli strumenti di analisi neutronica utilizzati nella progettazione di nocciolo. Il lavoro riguarda la modellazione – a mezzo del codice stocastico MCNP – del reattore nucleare di ricerca a potenza zero LR-0, situato presso il centro ricerche CV-Řež (Repubblica Ceca). L’esecuzione di analisi volte alla valutazione delle distribuzioni di flusso e potenza in alcune posizioni dedicate, riservate nella sezione di prova appositamente progettata e realizzata durante il corso della precedente annualità dell’AdP, ha consentito il confronto delle grandezze calcolate con i valori ricavati dall’analisi sperimentale al termine di una campagna di irraggiamento in nocciolo. Grazie alla flessibilità del reattore, la sezione di prova impiegata consente infatti di avere, al centro del nocciolo, una regione rappresentativa di un LFR, realizzata per mezzo di un blocco di piombo in cui sono state inserite sei barrette di combustibile. I dati sperimentali impiegati per la validazione sono stati ricavati dal conteggio dei gamma emessi dagli isotopi Sr92 e Np239, rispettivamente, indicativi delle distribuzioni di potenza e di flusso. La stessa misurazione è stata eseguita anche in diciotto barrette di un elemento di combustibile (driver), permettendo così di ricostruire una mappa 3D delle distribuzioni di potenza e di flusso neutronico nell’intero sistema. Il buon accordo tra i risultati delle misurazioni e delle simulazioni hanno permesso di compiere un ulteriore passo verso la validazione dei codici neutronici per la progettazione di nocciolo dei reattori nucleari refrigerati a piombo.
Note
Autori: G. Grasso1, M. Sarotto1, P. Console Camprini1
1 ENEA Copia n. In carico a: 2 NOME FIRMA 1 NOME FIRMA
0 EMISSIONE 30/11/17 NOME G. Grasso M. Tarantino M. Tarantino
FIRMA
TABLE OF CONTENTS
Acronyms and Abbreviations ... 3
1. Introduction ... 4
2. Description of the LR-0 reactor and experimental set-up ... 6
3. MNCP model of the experimental set-up ... 9
4. Comparison between experimental results and measurements ... 10
4.1. Rationale of experimental data ... 10
4.2. Brief description of the methodology: first route ... 11
4.3. Main C/E results of the first route ... 12
4.4. Brief description of the methodology: second route ... 14
4.5. Main C/E results of second route ... 14
5. Concluding remarks and discussion ... 18
Acronyms and Abbreviations
ALFRED Advanced Lead-cooled Fast Reactor European Demonstrator AdP Accordo di Programma (Programmatic Agreement)
C/E Calculated-to-Experimental
FA Fuel Assembly
LEADER Lead-cooled European Advanced DEmonstration Reactor FP Framework Program
GIF Generation IV International Forum
keff Effective multiplicationfactor
LFR Lead Fast Reactor LWR Light Water Reactor MCNP Monte Carlo N-Particle
MiSE Ministero dello Sviluppo Economico (Italian Ministry for Economic Development)
SS Stainless Steel
1. Introduction
This work is inserted in the framework of the 2016 Annual Realization Plan (PAR 2016) of the Programmatic Agreement (Accordo di Programma, AdP,) between ENEA and MiSE (Ministero dello Sviluppo Economico), and specifically in the second Project Line (LP2) concerning international collaborations for the development of technologies for Generation IV nuclear energy systems [1]. Focusing on Lead Fast Reactors (LFRs), and more specifically on ALFRED – the Advanced Lead-cooled Fast Reactor European Demonstrator – the LP2 of the AdP is meant to the refinement of the technological bases required for advancing the project, initially conceived in the Lead-cooled European Advanced DEmonstration Reactor (LEADER) project of the 7th EURATOM Framework Program (FP7) [2], towards higher readiness levels.
Within this ambitious objective, the core design activities are encompassed. In the PAR 2013 and 2014, the “LEADER” core configuration was upgraded by engineering some punctual aspects [3-4]. A new, engineered configuration being available, the line of activities shifted towards the assessment of the impact of data, model, manufacturing and operational uncertainties on the anticipated performances expected from the system, mainly in terms of actual margins to the ambitious safety limits to respect.
The simulation tools and data being one of the main sources of uncertainties, their validation against experiments1 is the mandatory step for assessing the confidence to be credited to the results produced by their application. Whilst validation activities concerning the thermal-hydraulic analyses were widely carried out in the past, starting from the PAR 2015 [5] it was decided to undertake a similar effort related to the methodologies and tools for neutronic analyses.
The validation activity performed in AdP PAR 2016 here presented is based on the experimental campaign carried out in the LR-0 reactor, located at the CVR research centre in Řež, Czech Republic [6]. Thanks to the extreme flexibility of LR-0 and the advanced post-irradiation measurement techniques at CVR, it was possible to conceive an experimental arrangement in the dry channel at the centre of the reactor, permitting the execution of experiments of neutrons propagation in lead and measurements of flux and power distribution in test fuel pins located within the lead assembly [5, 7].
The LR-0 reactor and the lead test section in the dry channel are summarily described in §2, along with the selected observables and the measurement techniques adopted to retrieve the reference experimental data. The simulation model of the experimental set-up is briefly described in §3. The neutronic analysis was carried out with the stochastic code MCNP (Monte Carlo N-Particle) ver. 6.1 [8], so as to exploit the capability for detailed heterogeneous modelling of the experiment; the ENDF/B-VII.1 [9] was selected as accompanying neutron data library.
The comparison between calculation and experimental results – expressed through the Calculated-to-Experimental ratio (C/E) – is reported in §4. Starting from the experimental data, whose rationale is summarily described in §4.1, the calculations were performed by following two different routes: a more “analytical” one (§4.2), in which only basic MCNP
1 Validation of a simulation code is the process of systematic comparison of calculated vs experimental results,
so as to retrieve sufficient information to assess – as a function of confidence levels that can be required to the code – the intervals around the calculated results within which the experimental results can be expected to lie.
results are retrieved, and then combined analytically to estimate the experimental observables (§4.3); and a more “automatic” one (§4.4), in which the MCNP code is asked to perform a full burn-up calculation so as to provide results almost directly comparable with experimental data (§4.5).
Finally, the main concluding remarks that can be drawn from the validation activity (carried out in PAR2016) are briefly summarised in §5.
2. Description of the LR-0 reactor and experimental set-up
The LR-0 is a zero-power pool-type Light Water Reactor (LWR) originally meant and conceived for measuring the neutron-physical characteristics of Water-Water Energetic Reactor (VVER) type reactors. Its extreme flexibility however allows arranging a variety of core configurations, permitting the investigation of phenomena also in support to different systems. Thanks to this, a special test section was conceived [5, 7] to locally reproduce the conditions of a LFR, and optimized to ALFRED specificities by extensive pre-test analyses conducted with MCNP.
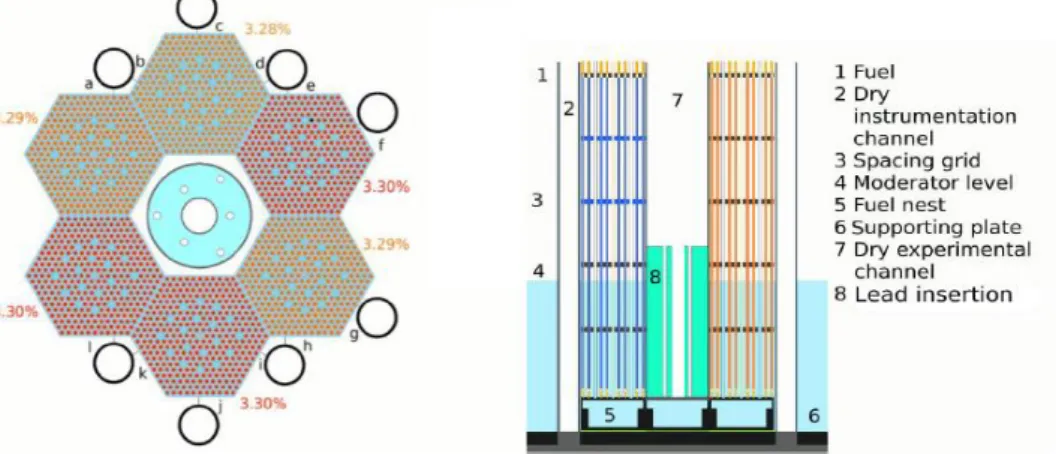
As depicted in the left part of Figure 2.1, six VVER-type Fuel Assemblies (FAs) were arranged on a hexagonal ring (representing the most compact critical configuration) leaving the central position free to insert a dry test section. The driver core is therefore made of six FAs, with a UO2 fuel having an U235 enrichment varying in the range between 3.28 and 3.3 wt.%.
Another key feature of the LR-0 reactor is the possibility to tune the criticality by adjustments of the water level and positioning of control rods. For the envisaged configuration, it was possible to achieve criticality by moderator level only, as depicted in the right part of Figure
2.1: therefore the core doesn’t contain control rods without any distortion of the neutron flux in neighbouring regions.
Within the dry central channel is positioned the ALFRED test section: a Stainless Steel (SS) cylindrical shell filled by lead, as shown in the right part of Figure 2.2. In the SS-Pb test section, six fuel pins having the 3.6 wt.% U235 enrichment were inserted.
In this experiment, along with the standard detector placeholders available for similar configurations (see left part of Figure 2.2), the neutron spectrum was measured also by stilbene and hydrogen proportional detectors placed in the central hole of the SS-Pb cylindrical shell (see left part of Figure 2.1). The measurements were done in the centre of the module to assure symmetrical influence of lead. As sketched in the right part of Figure 2.1, the SS-Pb module height was chosen greater than critical moderator level to restrict the diffusion of thermalized neutrons from upper part to the detectors. It can be also noticed that the lead insertion improves the neutronic balance in the core by decreasing leakages, when compared with the void channel. The level of lead purity was 99.97%: therefore, a very low Cd contamination (which is lead accompanying element with an high capture cross section) was present. Furthermore, activation analysis and fission density measurements were simulated in different positions of the module to evaluate the influence of lead layers [7].
The main aim of the experiment was the assessment of the capability of simulation codes to predict the power and flux distributions. In order to obtain information on these observables, the measurement of related quantities was chosen, like the distribution of fission and capture reaction rates in the fuel pins irradiated in LFR-representative conditions. For this purpose, the six fuel pins in the SS-Pb test section were inserted at two different distances from the centre (see left part of Figure 2.1) and irradiated to generate measurable amounts of fission and activation products. The measurement of these products was possible by dismounting the irradiated pins for gamma scanning in the post-irradiation examination laboratory of CVR, provided with a high-precision Germanium detector. Since many radioactive fission and activation products are present in the irradiated fuel, each emitting a variety of gamma radiations often overlapping in the characteristic energy, reference isotopes were selected as those with relevant half-lives and un-biased characteristic energy. The screening resulted in
the identification and selection of the Sr92 and Np239 isotopes – the former being a fission product, hence representative of the power distribution; the latter, created by transmutation from U238, providing instead information on the flux distribution.
To challenge the capability of MCNP in reproducing the neutron flux and power distributions in the six experimental pins located within the lead assembly, the data selected as reference were only the gammas emitted from a 5 cm high segment of the fuel column, positioned at 30.5 cm from its bottom end, as sketched in the right part of Figure 2.2 (red segment on one fuel pin). Being however the neutron flux and power distributions integral functions, the gammas emitted from analogous segments in eighteen pins of a driver FA were also measured in order to obtain a full 3D map of the flux and power distribution into the core.
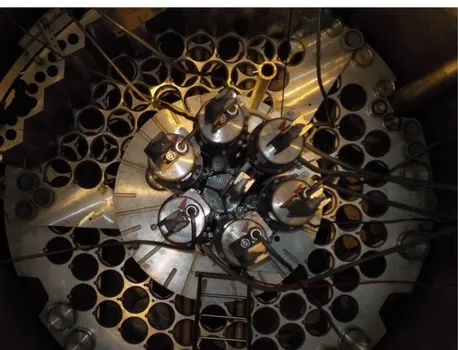
To conclude the description of the LR-0 reactor and the experimental set-up, some pictures are reported in:
Figure 2.3, showing the ALFRED test section and its positioning in the dry central channel;
Figure 2.4, showing the whole assembling of the ALFRED configuration in LR-0.
Figure 2.1 Critical configuration of the LR-0 core for the ALFRED-related experiments.
Figure 2.2 LR-0 core layout and neutrons detector positions (left); cylindrical SS shell in central dry test section with six fuel pins inserted (right).
Figure 2.3 View of the ALFRED test section (left) and its positioning in the central hexagonal channel (right).
3. MNCP model of the experimental set-up
As mentioned in §1, due to the local nature of the phenomena being investigated, the MCNP code ver. 6.1 was used, coupled with the most recent ENDF/B-VII.1 nuclear data library. Stochastic codes, indeed, have the capability to better reproduce local phenomena – provided that a sufficient statistic is ensured by tuning the parameters of the simulations, whose optimization is part of the validation process itself (object of the study) – thanks to the exact heterogeneous description of the model geometry and the continuous treatment of the energy dependence of neutron-matter interactions.
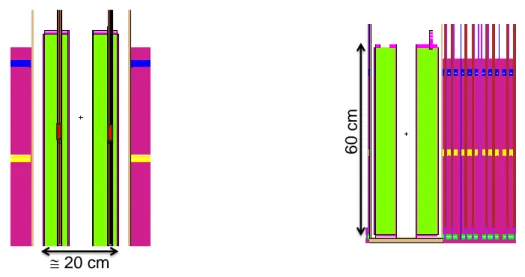
Figure 3.1 shows a couple of vertical sections of the experimental set-up as plotted by MCNP, together with an indication of its overall dimension. The lead part (green), the SS casing (pink) and two of the six fuel pins inserted in the SS-Pb test section appear evident in the left plot. Similarly to the right part of Figure 2.2, the 5 cm high fuel segment where the gammas are measured are indicated in red.
The right part of Figure 3.1 depicts a section of one driver FA with the critical moderator level (magenta) set according to experimental measurements [10]. The value of the multiplication factor (keff) resulted 0.996: therefore, a 0.4% accuracy was obtained by the MCNP – ENDF/B-VII.1 model in the evaluation of the critical mass.
Figure 3.1 MCNP model of the experimental set-up: XZ (left) and YZ (right) sections. 20 cm 60 cm 20 cm 60 cm
4. Comparison between experimental results and measurements
4.1. Rationale of experimental data
As described in §2, the measured post-irradiation quantities were the gammas emitted by six fuel pins in the SS-Pb dry test section and eighteen pins in a driver FA [10]. Figure 4.1
indicates their positions in the test section (named PPA-PPF) and in the FA (named PP1-PP18). The features of the measured gammas emitted by Sr92 (deriving from U235 and U238 fission) and by Np239 (deriving from U238 capture) are as follows:
1384 keV energy from Sr92 decay having 2.7 h half-life; 277 keV energy from Np239 decay having 2.35 d half-life.
Figure 4.1 Position of the measured pins in the driver FA (PP1-PP18, left) and in the central SS-Pb test section (PPA-PPF, right).
In the post-processing analyses with two different calculation routes (mentioned in §1 and briefly summarised in §4.2 and §4.4) account was taken of:
the irradiation in the reactor, 2.5 h long;
the delay before and the duration of measurements: for Sr92, measurements were performed about 2 h after irradiation and lasted about 260 s each; for Np239, measurements started after about 2 d and lasted about 850 s each;
the half-life of U239: being 23.5 minutes, it was neglected in the first route analysis reported in §4.2, by assuming that Np239 is directly created from U238 capture;
the yields of emission of the gammas of interest: 90% for the 1384 keV gamma emitted by Sr92 (by far the main one); 14.44% for the 277 keV gamma emitted by Np239.
All the values adopted for the nuclear data in the post-processing analyses were taken from [9], by considering also their uncertainty wherever applicable (that means, in all passages of the first route, while only for the gamma yields in the second one due to the integral results hindering the effect of the single contributions).
4.2. Brief description of the methodology: first route
The data supplied from CVR did not include the reactor power during irradiation and hence the level of flux. Therefore, the comparison between the experimental data and the MCNP results was performed by a two steps approach.
In the first step, the number of gammas (NPAx) measured from the fuel pins in the driver FA (PP1-PP18, see Figure 4.1) were converted – in the light of the measurement delay and duration – into Sr92 and Np239 concentrations (Nx) at the end of irradiation; by comparing these values with the MCNP results, a scaling factor for the flux () was retrieved. The logical passages in the first step are therefore:
𝑁𝑃𝐴𝑥(𝑡𝑒𝑛𝑑_𝑚𝑒𝑎𝑠) → 𝑁𝑥(𝑡𝑒𝑛𝑑_𝑖𝑟𝑟) → 𝜑 (4.1)
where “tend_irr” and “tend_meas” indicate the time at the end of irradiation and at the end of measurement, respectively2.
In the second step, the flux scaling factor () was directly used to normalize the reaction rates as computed by MCNP, so as to evaluate the Sr92 and Np239 concentrations (Nx) at the end of irradiation in the test pins (PPA-PPF, see Figure 4.1). Applying then the decay laws, from the inventory of Sr92 and Np239 isotopes the number of gammas emitted during the measurement time was estimated for comparison with experimental data. The logical passages in this second step are the same, but in reversed order than those in the first step:
𝜑 → 𝑁𝑥(𝑡𝑒𝑛𝑑_𝑖𝑟𝑟) → 𝑁𝑃𝐴𝑥(𝑡𝑒𝑛𝑑_𝑚𝑒𝑎𝑠) (4.2) Therefore:
Pins PP1-PP18 of the driver FA were used to retrieve the absolute flux level during irradiation;
Pins PPA-PPF in the SS-Pb test section were specifically used for the validation of the MCNP results concerning the measured gammas.
The post-processing of the MCNP results started from the measured gammas in the driver fuel pins and was performed by solving analytically the Bateman’s equations, in order to calculate the Np239 and Sr92 concentrations in the measurement positions and the related flux scaling factor (4.1). In some details, the isotopes concentrations at the end of irradiation were derived from the measured gammas according to the decay law during the waiting and measuring times:
𝜕𝑁𝑥
𝜕𝑡 = −𝜆𝑥𝑁𝑥 (4.3a)
where “x” represents the decay constant of the isotope considered. The solution of (4.3a) resulted to be:
𝑁𝑥(𝑡𝑒𝑛𝑑_𝑖𝑟𝑟) = −exp(−𝜆 𝑁𝑃𝐴𝑥(𝑡𝑒𝑛𝑑_𝑚𝑒𝑎𝑠)
𝑥(𝑡𝑒𝑛𝑑_𝑚𝑒𝑎𝑠−𝑡𝑒𝑛𝑑_𝑖𝑟𝑟)−exp(−𝜆𝑥(𝑡𝑏𝑒𝑔_𝑚𝑒𝑎𝑠−𝑡𝑒𝑛𝑑_𝑖𝑟𝑟) (4.3b)
where “tbeg_meas” indicates the time when measurements begun.
Afterwards, the flux scaling factor was obtained from the isotopes concentration at the end of irradiation by solving:
2
𝜕𝑁𝑥
𝜕𝑡 = 𝑓𝑦→𝑥− 𝜆𝑥𝑁𝑥 (4.4a)
where the “fyx” term represents either capture or fission producing the “x” isotope Np239 and Sr92, respectively. The solution of (4.4a) resulted to be:
𝜑 = 𝑁𝑥(𝑡𝑒𝑛𝑑_𝑖𝑟𝑟)∙𝜆𝑥
V∙𝑁𝑦∙𝜎𝑦→𝑥𝑓/𝑐∙(1−exp(−𝜆𝑥∙𝑡𝑒𝑛𝑑_𝑖𝑟𝑟)) (4.4b)
where:
“V” is the fuel volume of the sampled segment;
“Ny” is the concentration of the father isotopes (i.e., U235 and U238); “𝜎𝑦→𝑥𝑓/𝑐” represents the capture (for U238
) and fission (for U235 and U238) microscopic cross sections: actually, the latter includes also the fission yield of Sr92.
In the second step, conversely, equation (4.4b) was adopted to evaluate the isotopes concentration in the sampled segments of the test fuel pins at the end of irradiation, by using the flux scaling factor as obtained from the driver pins through the first step. Finally, starting from the isotopes concentration, equation (4.3b) was used to calculated the number of gammas emitted during the measurement time.
4.3. Main C/E results of the first route
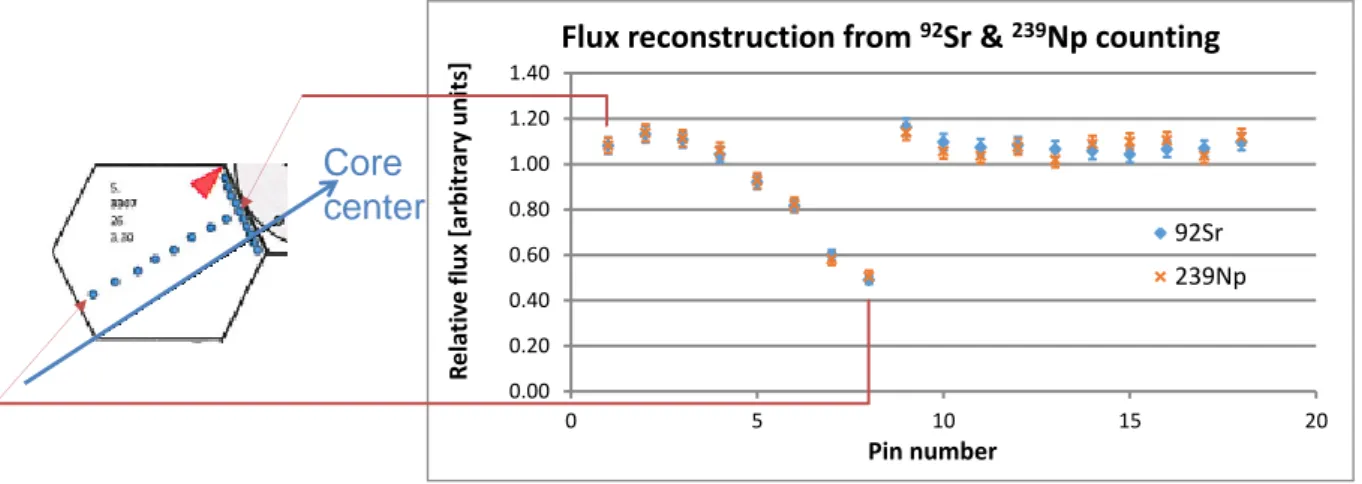
Following the approach described in §4.2, the main results of the first step are summarised in Figure 4.2 reporting the flux shape reconstruction in the driver fuel pins (PP1-PP18). It can be noticed that the data coming from the counting of gammas emitted by Sr92 and Np239 resulted in optimal agreement. As a general consideration, it is also reported that the estimates of the reactor power level, as associated to the flux normalization factors independently obtained from the count rates of both isotopes, are found in good agreement on the value of about 2.2 mW.
Figure 4.2 Flux reconstruction from measured gamma in the driver fuel pins (PP1-PP18). The second step of the approach yields the C/E values for the measured gammas emitted by the 5 cm high segment of the fuel pins irradiated in the SS-Pb test section. The results obtained are summarised in:
0.00 0.20 0.40 0.60 0.80 1.00 1.20 1.40 0 5 10 15 20 R el at iv e flu x [ar bi tr ar y uni ts] Pin number
Flux reconstruction from 92Sr & 239Np counting
92Sr 239Np
Core center
Figure 4.3, reporting the C/E values of the count rates of the gammas emitted by Sr92 and hence referring to the radial power distribution;
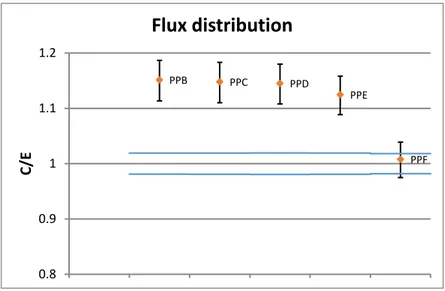
Figure 4.4, reporting the C/E values of the count rates of the gammas emitted by Np239 and hence referring to the radial flux distribution3.
Figure 4.3 C/E values of the number of gamma emitted by Sr92 in the six fuel pins irradiated in the SS-Pb test section.
Figure 4.4 C/E values of the number of gamma emitted by Np239 in the six fuel pins irradiated in the SS-Pb test section.
Figure 4.3 and Figure 4.4 report also the measurement (supplied directly by CVR) and calculation uncertainties, the latter obtained by propagating the minimum and maximum range values for all parameters accounted for in the evaluation (§4.1). It can be noticed that the calculation predictions for the Sr92 gammas are statistically well distributed and almost in a good agreement (Figure 4.3) with the experiment; for the Np239 gammas, instead, the distribution of the calculated results seems to suggest for a systematic over-estimation with respect to measured data (Figure 4.4). Overall it can be observed that the confidence level of
3 It is worth mentioning that, for Np239 counts, only 5 values are reported, in spite of the 6 experimental pins
positioned in the SS-Pb test section, coherently with the information supplied by CVR. PPA PPB PPC PPD PPE PPF 0.8 0.9 1 1.1 1.2 C/E
Power distribution
PPB PPC PPD PPE PPF 0.8 0.9 1 1.1 1.2 C/EFlux distribution
the MCNP results is of about 10-15% in both cases, that represents a remarkable result for this kind of experiment.
4.4. Brief description of the methodology: second route
The second methodology that has been utilised to compare the results from the MCNP6.1 simulation and the experimental outcome, consists of a complete burn-up calculation through the CINDER90 tool, embedded in the MCNP code.
First, MCNP carries out a steady-state flux calculation, according to the corresponding eigenvalue problem. Flux is reported in a multi-group structure (63 groups) and nuclear data parameters are produced accordingly: fission multiplicity and energy recoverable from fission.
Bateman’s equations are then solved for a certain list of nuclides, selected by the user for each material. Total power is inserted as well as burning period, divided in suitable time-steps. Simulation precision is selected by the user, in terms of minimum threshold for nuclide accountancy.
The burn-up simulation is aimed at the determination of Np239 content, in the 18 fuel pins from the driver FA, and for 6 experimental pins inside the test section.
Nuclear data tables used for neutron transport are taken from the ENDF/B-VII.1 library and nuclides produced in the burning process not considered in this set were omitted from transport, since the expected amount is negligible to impact transport properties.
The specified irradiation time, 2.5 hours, is set; being a short period, only 1 burn-up time-step is selected.
The burn-up is at first calculated for the 18 pins in the driver FA, and results are compared with counts from samples as reported from experimental campaign, considering latency times and progressive counting times. Thus, the overall coefficient of proportionality between the simulation (Calculated NPA) and the real test (Experimental NPA) is obtained. This step is required because the reactor power was not specified, as a blind check for the simulations. Since however MCNP requires a power level to perform burn-up, a fictitious value of 1 kW was assumed.
As a lumped, single parameter, the overall coefficient of proportionality takes into account, along with the whole effect of power normalization, also the counting efficiency and the detector yield. The yield of the detected gamma among all those emitted by Np239 decay (14.44%) is instead explicitly considered in the calculation. This coefficient of proportionality is produced by averaging the single estimates obtained from each of the 18 pins. Once the average coefficient of proportionality is produced, it is used to multiply the results obtained for the 6 experimental pins, inside the irradiation volume. The expected counts are then computed and compared with experimental outcomes, in terms of C/E values.
4.5. Main C/E results of second route
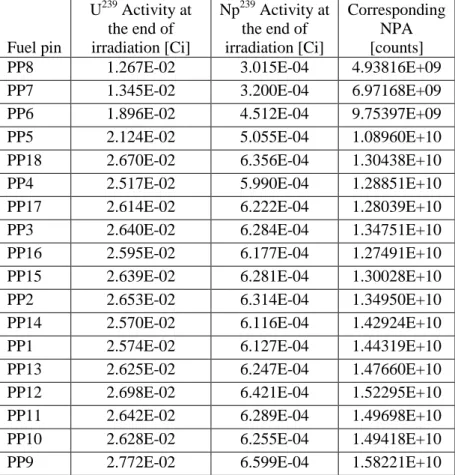
The MCNP simulation provided the concentrations of Np239 and U239 after 2.5 h irradiation in all 18 fuel pins in the driver core, as reported in Table 4.1, and in the 6 experimental pins in
the SS-Pb test section. Decay equations are employed starting from initial concentrations, referred to the irradiation end.
The considered U239 and Np239 decay constants are as follows: - U239 decay constant [s-1]: 5.02281e-04
- Np239 decay constant [s-1]: 3.40515e-06
The Np239 activity, after the specified latency time, is calculated considering also the single pin counting time. The disintegrations corresponding to decay events, integrated over the counting time interval, are reported in the last column of Table 4.1.
Table 4.1 Concentrations of U239 and Np239 inside 18 fuel pins calculated at irradiation end (for 1 kW operation), and corresponding Np239 counts during measurement interval.
Fuel pin U239 Activity at the end of irradiation [Ci] Np239 Activity at the end of irradiation [Ci] Corresponding NPA [counts] PP8 1.267E-02 3.015E-04 4.93816E+09 PP7 1.345E-02 3.200E-04 6.97168E+09 PP6 1.896E-02 4.512E-04 9.75397E+09 PP5 2.124E-02 5.055E-04 1.08960E+10 PP18 2.670E-02 6.356E-04 1.30438E+10 PP4 2.517E-02 5.990E-04 1.28851E+10 PP17 2.614E-02 6.222E-04 1.28039E+10 PP3 2.640E-02 6.284E-04 1.34751E+10 PP16 2.595E-02 6.177E-04 1.27491E+10 PP15 2.639E-02 6.281E-04 1.30028E+10 PP2 2.653E-02 6.314E-04 1.34950E+10 PP14 2.570E-02 6.116E-04 1.42924E+10 PP1 2.574E-02 6.127E-04 1.44319E+10 PP13 2.625E-02 6.247E-04 1.47660E+10 PP12 2.698E-02 6.421E-04 1.52295E+10 PP11 2.642E-02 6.289E-04 1.49698E+10 PP10 2.628E-02 6.255E-04 1.49418E+10 PP9 2.772E-02 6.599E-04 1.58221E+10
The evolution calculation for Np239 during latency time and counting interval is obtained through the following formula, which takes into account also the source term due to U239 decay:
𝑑𝑁𝑁𝑝
𝑑𝑡 = −𝜆𝑁𝑝𝑁𝑁𝑝+ 𝜆𝑈𝑁𝑈 (4.5)
The source term is the simple decay of U239 along time, according to the following straightforward relation:
Finally, the Np239 total counts related to the measurement period are expressed in terms of ti and tf, the times marking the beginning and the end of detection counting respectively, measured from a reference initial time 𝑡 = 0 set at the end of irradiation:
𝐶 = 𝐴𝑁𝑝0 𝑒−𝜆𝑁𝑝𝑡𝑖−𝑒−𝜆𝑁𝑝𝑡𝑓 𝜆𝑁𝑝 + 𝜆𝑁𝑝𝐴𝑈0 𝜆𝑁𝑝−𝜆𝑈 𝑒−𝜆𝑈𝑡𝑖−𝑒−𝜆𝑈𝑡𝑓 𝜆𝑈 − 𝐴𝑈0 𝜆𝑁𝑝−𝜆𝑈𝑒 −𝜆𝑁𝑝𝑡𝑖 − 𝑒−𝜆𝑁𝑝𝑡𝑓 (4.7)
where 𝐴𝑥0 is the activity of isotope 𝑥 at time 0.
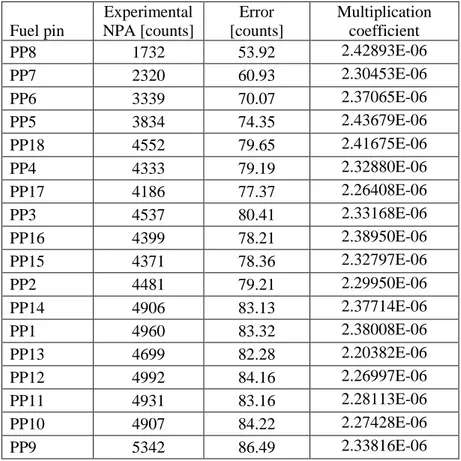
The comparison performed with the provided experimental counts to obtain the coefficient of multiplication is shown in Table 4.2.
Table 4.2 Counts for Np239 inside 18 fuel pins as measured during the experimental time interval. Estimates for the coefficient of multiplication are inferred for all the samples by comparison with the
calculated counts as in the last column of Table 4.1.
Fuel pin Experimental NPA [counts] Error [counts] Multiplication coefficient PP8 1732 53.92 2.42893E-06 PP7 2320 60.93 2.30453E-06 PP6 3339 70.07 2.37065E-06 PP5 3834 74.35 2.43679E-06 PP18 4552 79.65 2.41675E-06 PP4 4333 79.19 2.32880E-06 PP17 4186 77.37 2.26408E-06 PP3 4537 80.41 2.33168E-06 PP16 4399 78.21 2.38950E-06 PP15 4371 78.36 2.32797E-06 PP2 4481 79.21 2.29950E-06 PP14 4906 83.13 2.37714E-06 PP1 4960 83.32 2.38008E-06 PP13 4699 82.28 2.20382E-06 PP12 4992 84.16 2.26997E-06 PP11 4931 83.16 2.28113E-06 PP10 4907 84.22 2.27428E-06 PP9 5342 86.49 2.33816E-06
From the 18 single estimates, the average coefficient of multiplication obtained is 2.33465E-06, by which the actual reactor power level can be retrieved as 2.3 mW, well in line with the estimate made through the first computational route (§4.3).
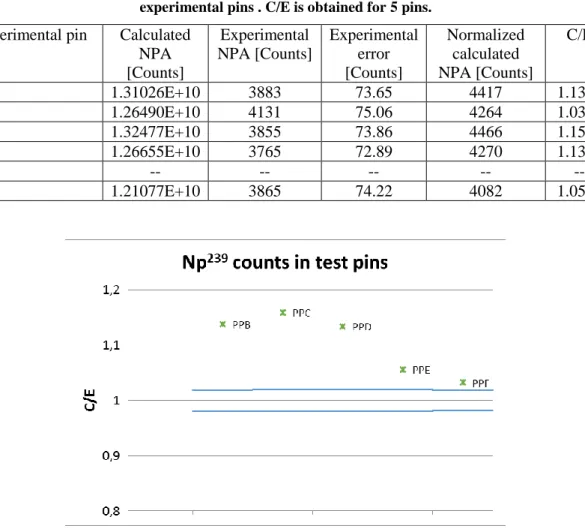
By using the coefficient of multiplication as obtained from the 18 driver pins, normalized values have been retrieved for the calculated counts of the 5 experimental pins4 irradiated in the SS-Pb test section at the centre of the core (Table 4.3). These normalized counts are then compared with the experimental ones to obtain the aimed C/E, shown in the last column of Table 4.3 and visually represented in Figure 4.5 along with the experimental uncertainty,
4 As in the results for the first route, experimental data on the Np239 counts are provided for 5 pins out of the 6
reported as the domain comprised between the blue lines. Calculation precision is below 1% and not indicated in the graph.
Table 4.3 Comparison between calculated and measured Np239 counts (NPA) inside the experimental pins . C/E is obtained for 5 pins.
Experimental pin Calculated NPA [Counts] Experimental NPA [Counts] Experimental error [Counts] Normalized calculated NPA [Counts] C/E PPB 1.31026E+10 3883 73.65 4417 1.1376 PPF 1.26490E+10 4131 75.06 4264 1.0323 PPC 1.32477E+10 3855 73.86 4466 1.1585 PPD 1.26655E+10 3765 72.89 4270 1.1341 PPA -- -- -- -- -- PPE 1.21077E+10 3865 74.22 4082 1.0561
Figure 4.5 C/E values for the Np239 counts in 5 experimental pins. Calculation precision is below 1%. Blue lines report experimental uncertainty interval.
5. Concluding remarks and discussion
When addressing the core design (and in perspective the licensing) of a new reactor concept as the ALFRED LFR, a thorough validation of neutronic calculation codes (and data libraries) is deemed necessary to prove, to the largest extent, the validity of the results and the appropriateness of the design methodologies and tools. To meet this objective, the PAR2015 activity was devoted to the validation of neutronic codes in the evaluation of integral parameters, such as the critical mass, the spectral indexes, the control elements and void worth, etc. in LFR-representative conditions [5].
This technical report describes the achievements in the second year of activity (PAR2016). It was based on the experimental measurements carried out in the LR-0 zero-power reactor at the CVR research centre in Řež (Czech Republic) and it was devoted to the validation of local parameters, such as the fission and capture reaction rates – hence the power and flux distributions – in fuel pins inserted in a lead test section. Due to the local extent of these phenomena, the stochastic MCNP6.1 code was chosen as reference code, coupled with the ENDF/B-VII.1 nuclear data library.
The designed experimental set-up was assembled in the central dry channel of the reactor, to introduce a SS-Pb module reproducing an (almost) LFR-representative configuration in spite of the thermal flux in the driver FAs. In fact, the SS-Pb test section couples to the driver core which is being used as a source of fission neutrons only. Hence, the selected parameters of the six fuel pins inserted in the test section can be investigated almost independently from the driver FAs. The measured quantities related to the fission and capture reaction rates were the gammas emitted from a 5 cm high segment of the fuel column by the Sr92 and Np239 isotopes formed during irradiation. The same investigation was carried out in eighteen fuel pins in a driver FA, thereby providing a 3D map of the flux and power distributions in the core.
Since MCNP – the code to be validated – allows for two different approaches for retrieving the inventories of Sr92 and Np239 (as the sources of the measured gammas) at the end of irradiation, the comparison between measurements and results was performed by two different routes.
1. In the first route, the measurement results in the eighteen driver pins were used to estimate the power level of the reactor during the test by solving analytically the Bateman’s equations for the build-up of Sr92 and Np239 isotopes, eventually providing a flux scaling factor. Reciprocally, the latter was used for the six pins in the SS-Pb test section, to retrieve the Sr92 and Np239 isotopes concentrations and consequently the number of gammas emitted by them, in order to be compared with the experimental measurements.
2. In the second route, an explicit burn-up calculation was performed to retrieve the Np239 concentration at the end of irradiation, so as to evaluate the number of gammas emitted by it, again for comparison with the experimental measurements.
Focusing on the results of this study, and including – along with the flux and power distributions – also information on integral parameters as obtained in performing the calculations themselves, several observations can be drawn:
the discrepancy between the predicted and experimental reactor criticality (according to the observed moderator level) was found to be 0.4%, which – corresponding to approximately 0.6$ – is deemed sufficiently accurate;
the two blind estimates for the reactor power level, obtained independently from the two calculation routes adopted in the present study, are well in line (2.2 mW according to the first route, 2.3 mW from the second route);
the overall accuracy on estimating the Sr92 and Np239 counts measured during the post-irradiation examination of the 6 experimental pins inserted in the SS-Pb test section is found to be within 15% for both the Sr92 case, related to the fission – hence power – distribution, and the Np239 case, related to the capture – hence flux – distribution: due to the very local nature of the observables assumed for this validation, the resulting accuracy is deemed sufficient.
A specific point of discussion is worth for the results obtained for the Np239 counts. Both the implemented routes of analysis lead to a systematic overestimation with respect to the experimentally measured results, which raises doubts on possible sources of bias in the calculations. A literature survey pointed out that discrepancies between the calculated and experimental compositions of spent LWR fuel assemblies [11] and between the observed and calculated criticality of experimental assemblies [12] have been already observed, and that in all these cases the overestimation of the U238 capture cross-section in commonly used data libraries was suggested as responsible for such discrepancies. Should such an overestimation be confirmed, it might be the main responsible also for the systematic overestimation of the results calculated in the present study.
Overall, the post-processing analyses in the test pins inserted in lead allowed to validate flux and power reconstruction techniques in an (almost) LFR-representative condition by providing:
an assessment of the confidence to be credited to the results of MCNP simulations to what concerns flux and power distributions, to the sake of mastering safety-relevant aspects in fixing the related safety margins. In this experiment, the confidence level of the MCNP – ENDF/B-VII.1 results for the local flux and power distributions resulted to be of about 10-15%;
significant feedbacks to the neutronic analyst for the correct modelling of the reactor system in order to ensure the obtained results fall in the domain of validity of the assessed confidence levels.
References
[1] OECD/NEA, 2014. Technology Roadmap Update for Generation IV Nuclear Energy Systems, www.gen-4.org.
[2] Grasso, G., et al., 2014. The core design of ALFRED, a demonstrator for the European lead-cooled reactors. Nucl. Eng. Des. 278:287-301.
[3] Grasso, G., et al., 2014. Ottimizzazione del progetto di nocciolo di ALFRED. Technical Report ADPFISS-LP2-050, ENEA.
[4] Lodi, F., et al., 2015. Characterization of the new ALFRED core configuration. Technical Report ADPFISS-LP2-085, ENEA.
[5] Sarotto, M. and Grasso, G., 2016. Results of the validation campaign of neutronic codes and recommendations for the correct application to LFR systems. Technical Report ADPFISS-LP2-115, ENEA.
[6] http://cvrez.cz/en/infrastructure/research-reactor-lr-0/
[7] Losa, E. and Košťál, M., 2015. Design and preparation of experiment for validation of neutronic codes. Technical Report 1157, CVR.
[8] MCNP6TM user’s manual Version 1.0, 2013. Technical Report LA-CP-13-00634, Rev. 0, Los Alamos National Laboratories.
[9] Chadwich, M.B., et al., 2011. ENDF/B-VII.1 Nuclear Data for Science and Technology: Cross Sections, Covariances, Fission Product Yields and Decay. Nucl.
Data Sheets 112(12).
[10] Losa, E., 2017. Personal communications by emails on 13-14 September.
[11] Trkov, A., et al., 2005. Revisiting the U-238 thermal capture cross section and gamma-ray emission probabilities from Np-239 decay. Nucl. Sci. Eng. 150:336-348. [12] Courcelle, A., et al., 2011. Experimental validation of U238 cross-sections