Random Assisted Browsing of Rushes Archives
Tijana Janjusevic
1, Sergio Benini
2, Ebroul Izquierdo
1and Riccardo Leonardi
21 MMV, Queen Mary, University of London, Mile End Rd, London, E1 4NS, UK 2 DEA-SCL, Universit`a di Brescia, via Branze 38, 25123 Brescia, Italy
Email: {firstname.lastname}1@elec.qmul.ac.uk ,2@ing.unibs.it
Abstract— How to efficiently browse a large video database if
its content is unknown to the user? In this paper we propose new approaches for browsing initialisation, exploration and content access of a rushes archive, where the span of information stored can be huge and difficult to understand at a glance. Exploring and navigating through raw footage is assisted by organising the video material in a mean-ingful structure and by adopting appropriate visualisation solutions. Un-annotated content is organised in hierarchical previews, while browsing is enabled by novel methods of random exploration and random content access to preview nodes. User tests conducted on professional users in a real-work scenario aim at demonstrating how the hierarchical visualisation and the proposed random browsing solutions assist the process of accessing and retrieving desired content.
Index Terms— Visualisation, Random access, Browsing,
Hi-erarchical previews, Rushes
I. INTRODUCTION
In the last years, following the development of mul-timedia systems for storing, organising and retrieving video-content, new task domains and user requirements evolved. In the scope of professional broadcasting and film-making industry, the original raw footage, referred to as rushes is filmed and stored with the idea to be used and reused as necessary. This material is mainly unstructured, unedited, redundant and it is often characterised by the presence of natural sounds, speech (in case people are filmed) and few or no on-screen text.
The utility of rushes lies in the fact that different editing ideas and tasks can be produced by using the same raw material, if this can be properly found and accessed. However, in spite of the proliferation of rushes storage, such increasing availability of raw videos has not been accompanied by a parallel increase of their accessibility. Due to the fact that only a limited number of people in the production team know what rushes repository contains, the majority of this content usually remains unexplored. In addition to this, the level of available metadata is gen-erally very low or non-existing, since manual annotation of content is extremely time consuming.
Such a distinctive nature of rushes requires additional retrieval system functionalities and opens space for further development of rushes-dedicated applications [1], [2], [3]. One of the main need is that of providing the user with This research work was partially supported by EU project RUSHES
(FP6-045189).
tools for quick understanding and efficiently exploring the available rushes content, in order to enable its reuse in the production of new multimedia assets.
This work proposes an exploratory tool for dealing with a rushes repository in the early unstructured part of the browsing task, when the rushes content is still unknown to the user. In order to enable content comprehension, the proposed visualisation displays a collection of rushes previews, where the content is organised in a hierarchical structure based on low-level visual features. A novel random access schema for initialising the browsing and exploring the hierarchically organised database is then proposed and evaluated among professional users in a real working scenario.
A. Rushes retrieval and browsing
In general, there are two types of systems for acquir-ing information from the rushes repository: query-based retrieval systems and browsing tools.
A query is a formal request for retrieving information from a database. It is devised by the user when he is looking for a specific thing. Typically the query success depends on how clear is the idea in the user’s mind about the nature of the searched object and how the query is formulated.
Most existing systems initialise the query using one or more key-words. Retrieval is then usually based on text-matching on the specified key-words which, in the case of rushes content, are extracted either from manual annotation or from automatic speech transcripts, as in [1]. In case there is no speech in the video, speech-to-text modules are useless, and speech-to-text-based search for rushes becomes a tough task, since most rushes database are mainly un-annotated.
Therefore in the more recent applications, text-based search methods are often combined with visual-based search. In this case the visual content needs to be pre-processed and described in terms of low-level or semantic descriptors. For example, in the framework proposed in [2], both key-word and image queries can feed the system. For the text-based queries, similar segments are retrieved through automatic-speech-recognition transcripts. In case of a query-by-example, the user can set one image as a query and the system is able to retrieve images showing similar concept vectors.
In [3] the retrieval of rushes is based purely on visual information. The proposed system describes video files
using visual elements which are automatically computable and presentable to the user. The proposed solution for the initial representation of the repository is using the micro-icons for all video files and the query is initialised by selecting one visual element. This approach only consid-ers the situation in which the user can define his task through the visual elements. If that is not the case user should be able to use more flexible way of exploring, such as browsing. Browsing would allow him to go through the collection and find some alternative way to initiate his task and retrieve the desired data item.
Another retrieval system based on a visual-query is described in [4], where the query is initialised by the user by one or more images which can come from outside the system (e.g., from Google Image search). The user can then select objects inside the image, or specify which is the feature (colour or texture) or visual-characteristic that makes it a good query image.
Among the retrieval systems designed for rushes explo-ration and use, the majority focus almost exclusively on the retrieval efficiency and forgets about the importance of the user initial engagement with the system and the fact that the database content is completely unknown to him. For example, in the already cited [2], in order to select an image as a valid query-by-example, the user has first to find the image within the repository or to use an image which does not belong to the database. Visual elements proposed in [3] can also be anti-productive, since they can mislead the user about the content they represent. In general, all systems that employ visual similarity as a base for retrieval also lack a good method for initialising the query for an unknown repository.
From the user’s point of view, the basic difference between content browsing and search & retrieval is the limited knowledge about how to formulate the query and about what to expect from the content set. Therefore a query is not always the best method for starting the retrieval process in case of un-known content. In this sense, content browsing tools are preferable since they support the user in building a query step by step, adding new search directions thus reducing the searched content set.
In fact, according to [5] browsing is a strategy that can be utilised to get familiar with the system and understand what is there, how to find it and where. While browsing, the user performs exploring and searching action, where direction is changed dynamically, depending on the imme-diate results obtained from the system. For these reasons, accessing the content, especially in the initial retrieval stage, is an extremely important operation for building the query in the user’s mind.
Direct access to content is proposed in [6], where for exploring rushes the user starts from the visualisation of the complete content set. With a strategy similar to [7], i.e., by selecting one of the available low-level features, visual content is accordingly clustered, and depending on the current size of the content set, a fraction of the segments is selected as a content preview. The user can
then decide to select a subset of clusters that seems to be relevant and discard the others, or repeat clustering on the current content set using another feature. Possible drawbacks lies in the fact that since the user might not be completely aware of the searched content, the selection of a relevant feature to perform the clustering is not trivial. Moreover, by starting from the whole content set, the risk of overwhelming the user with too many information is sensible.
In order to browse and analyse BBC rushes, authors in [8] re-adapted their MediaMill system, which is originally trained to index the 101 high-level concepts for news. This approach basically ports the retrieval system developed originally for edited videos directly to the rushes domain, without addressing most of rushes peculiarities, such as for example the limited user knowledge on content and the high-level of redundancy of such raw material. B. Paper aim and organisation
In this work we exploit information visualisation tech-niques for creating an intuitive and easy interface to guide a professional user through an unknown rushes content database. We propose a novel way of browsing through the content, which adopts random exploration, until enough domain knowledge is obtained. Browsing initialisation does not require external image search or text-based query specification, but by hierarchical preview visualisation we enable fast content grasping and effective retrieval entirely within the system and the observed content. At each step of the retrieval process, information overflow for the user is avoided by displaying only content previews with a limited number of key-frames.
The document is organised as follows. In Section II we briefly present the method for the hierarchical organisation of the database, which enables the hierar-chical visualisation described in Section III. Section IV introduces the random browsing and other access methods employed during the user’s interaction; Section V contains the evaluation approach and discusses the obtained results. Conclusion and future work are stated in Section VI.
II. HIERARCHICAL PREVIEWS OF RUSHES To empower the browsing process and accelerate the perception of the database content by the user, the raw ma-terial is arranged in a structure of hierarchical previews.
In general a hierarchical organisation supports fast understanding of a database, since it splits its content into smaller subsets on different levels and emphasises the relationships between different sets. For example, an ideal arrangement of videos as in Figure 1, with each node labelled with one semantic category, would enable a fast access and a complete understanding of the database structure. In this case, a professional user could efficiently browse all “news” segments separately from the “documentaries”. Then, on a lower level, it would be helpful for exploration to have the news separated into different “reports”, and so on on lower levels.
video database news documentaries anchor reports history nature sports politics
Figure 1. Hierarchical arrangement of a video database based on semantic labels. Unfortunately this approach remains unfeasible for rushes, since this material is mostly un-annotated.
Unfortunately semantic clustering is not applicable to rushes, since this content lies mostly un-annotated in databases, without the help of semantic labels. Therefore one feasible approach when dealing with such material, is to hierarchically arrange content by performing a visual clustering on a set of key-frames extracted from the database.
Even if the reliability of the visual clustering algorithm might strongly affect the effectiveness of the search, the provision of a content preview (or summary) as collection of key-frames fully matches with the browsing strategy, as they allow for fast exploration of large unknown content sets, without the requirement to specify a query in advance. In addition to this, the availability of hierarchical previews is relevant since (i) it supports the user in quickly gaining an overview of the unknown content set, (ii) it organises material by similarity, and (iii) it selects representative content for visualisation.
A. Preview structure
The proposed hierarchical summary is obtained by a visual clustering of N key-frames of the database, which have been extracted from shots and sub-shots as suggested in [9]. As described in [10], key-frames are first divided into non-overlapping blocks. Block color components in the LUV color space are used as training vectors to a Tree-Structured-Vector-Quantization algorithm to com-pute code-books of increasing size 2m(m = 0, 1, 2, . . .)
until a pre-determined constraint on distortion is satisfied (or a maximum code-book size is reached). Then, an attempt is made to reduce the number of code-words in the interval [2m−1, 2m] without exceeding the imposed
distortion. By doing so, the key-frame visual content is represented through the obtained dictionary of visual words. Grouping is then achieved by a hierarchical clus-tering algorithm which employs the cross-effect of the two dictionaries on the two key-frames for estimating mutual similarity. A hierarchical summary S = {L1, L2, . . . , Ln}
organised on n levels Li, where the number of levels
n << N is finally obtained by exploiting the properties of the dendrogram tree and the codebook distorsions associated to different branches of the dendrogram (see [10] for further details).
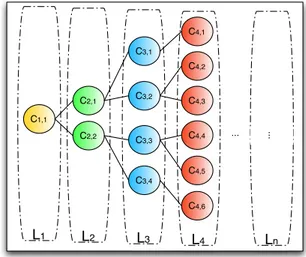
As shown in Figure 2, each level Li of the hierarchy
contains the whole set of N key-frames organised in a number of visually similar clusters Ci,j, i.e. Li =
{Ci,1, Ci,2, . . . , Ci,χi} where χi is the cardinality of Li
and where χ(i−1) < χi ,∀i. Such organisation enables
structured exploration: once the user identifies an interest-ing key-frame, he can interactively request more similar content from the same cluster, or refine his search by descending into the hierarchy, thus restricting the scope of his quest. L2 L3 L4 L1 C1,1 C2,1 C2,2 C3,1 C3,2 C3,3 C3,4 C4,2 C4,3 C4,1 C4,4 C4,5 C4,6 Ln ... ...
Figure 2. Structure of the hierarchical preview.
Even if the grouping of similar content is based on visual similarity rather than semantics, the proposed ar-rangement assists the browsing process by reducing the semantic gap between low-level features and high-level concepts familiar to the user.
III. HIERARCHICAL VISUALISATION OF RUSHES REPOSITORY
Considering the hierarchical organisation of the con-tent, the most straightforward way of presenting it to the user is applying a hierarchical visualisation approach which provides, at the same time, an easy initialisation of the browsing.
A number of information visualisation techniques for displaying hierarchical structures have been proposed in the past, such as Hyperbolic Tree [11], Treemaps [12], [13] and Cone Trees [14], [15]. These visualisation so-lutions, though helpful for solving the problem of visual clutter for large number of tree-nodes, do not always serve as efficient aid for the user, since the excess complexity of the user interface sometimes induces an additional obstacle for performing the browsing task.
Regarding the proposed visualisation, our first aim is therefore to keep a low-level of complexity, while preserv-ing the information about the structure. For example the solutions for hierarchical video/image browsing described in [16], [17] and [18] are characterised by a lower level of interface complexity. In these applications, the exploration is mostly initialised by selecting one of the displayed key-frames. However applying these solutions to a large
rushes archive and considering the limited display space, it is not clear how to initialise the exploration if no signif-icant or query-similar key-frame is in the first visualised set.
Our second aim is therefore to assist user’s initialisation of browsing. Solutions presented in [16], [17] and [18] either limit the set of the displayed key-frames or reduce the image sizes in order to present them all. Both choices negatively affect the beginning of the browsing, since user might not find the appropriate key-frame or their size is too small to understand the content. We then propose to assist user’s understanding of where to find items of interest (and to reduce the time for browsing initialisation) by displaying a tree map of the content space together with content previews.
A. Navigation tool
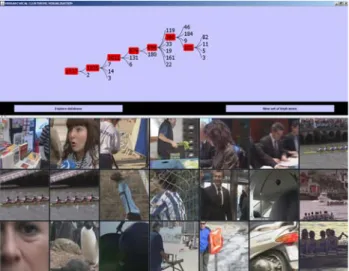
The interface provides a visual navigation tool, forming a thread between the concealed structure of the content and the user’s needs. A screenshot of the whole user interface is shown in Figure 3.
Figure 3. Screenshot of the interface. In the upper window the tree view of the database structure and the two buttons which allow the interactive exploration of the content. In the bottom window, the grid with node preview key-frames is displayed.
It consists of two windows which enable (i) the explo-ration of the content by interactive search and (ii) the vision of rushes previews.
In the upper window the hierarchical preview organi-sation is presented using a tree view, as better shown in Figure 4. The tree view is chosen since it is a common way of representing a hierarchical structure and its biggest advantage is that the majority of users are familiar with it.
The presented tree contains the hierarchical preview and in case of large amount of content it might consist of a huge number of nodes and branches, where nodes are clusters of visually similar key-frames. Due to the limited display dimensions, visualising the entire tree at any time is space-consuming and unnecessary. An adequate solution is to dynamically change the number
Figure 4. Tree view of the database structure (upper window).
of displayed levels: a node can be expanded to reveal its child-elements, if any exist, or collapsed to hide departing branches and child-elements.
In a similar way, the user does not see the entire tree while browsing, but only the set of nodes actually involved in his exploration. To highlight the user’s search path, all nodes starting from the root C1,1 to the currently explored node Ci,j are colour-encoded. Considering that
there is no meta-data on the observed rushes, and that the information we have is purely visual, the only property we visualise for each node is the number of key-frames contained in the node (see Figure 4). For giving an insight into the node content, instead of putting the representative key-frame, we display the preview of nodes in the bottom window, since the content in a node can often be too diverse to be represented by a single key-frame (this is specifically true for nodes in the higher levels of the hierarchy).
When clicking on a certain node, the selected item is coloured in red, the next level child-elements are shown, and the related preview is accessed and shown in the lower window, as shown in Figure 5. The preview key-frames belonging to the currently visited node are displayed on a grid, where temporally close key-frames are placed sequentially in order to assist content understanding by the user. Positioning the mouse over a key-frame gives the information about the name of the video it belongs to. In this way the user can distinguish if similar key-frames placed close together belong to the same data item. The criteria for accessing the preview and the selection of the key-frames to be displayed are described in Section IV.
In short the tree metaphor in the interface upper win-dow fulfils the following tasks:
• provides the visualisation overview at all times; • describes the parent-child relations between visual
content;
• provides the information on the number of
key-Figure 5. Preview key-frames of the currently selected node (lower window).
frames in each node;
• facilitates the comprehension of the current position
within the database by colour encoding;
• supports the user moving forward, backward and
making progressive search refinements.
General guidelines that led the development of our so-lution are based on one main principle of information visualisation, known as “focus & context”. Following this idea our navigation interface provides both global and local overview at all times, an important property considering the nature of rushes data and the retrieval task. The user preserves the global perspective by seeing the database structure and his current position at each step of the search, while getting more information by observing at the same time the visual summary of the selected node.
IV. RANDOMACCESS ANDEXPLORATION Since a rushes database is too large to be explored in a single step, we need to provide tools to model a sort of “virtual tour” through the repository. Browsing needs an entry point and it consequently develops according to the retrieved results. To perform an efficient exploration the user should be able at least (i) to find one item that interests him to start his navigation with (ii), to identify search directions in which to proceed and (iii) to easily access and grasp the repository content.
In order to meet these needs, three related novel so-lutions regarding (i) browsing initialisation, (ii) random exploration and (iii) random content access, are presented in the following.
A. Jump-to-leaf and sequential access
While most hierarchical visualisation solutions use sin-gle key-frames to represent the node content and start the browsing (e.g., [16]), in this work the initialisation is supported either by node or by key-frame selection.
By clicking on any node Ci,j of the hierarchy, the
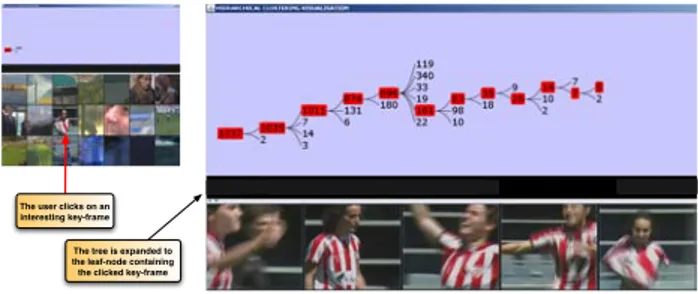
node content preview is visualised. Then the user can use sequential access to other nodes and move backward and/or forward through the tree to refine his search, while constantly being aware of the current position inside the database, thanks to the colour encoding of the search path. A novel functionality, called jump-to-leaf, is introduced in case the user clicks on one interesting key-frame f at any moment of his exploration. After the click on the key-frame of interest f, in the upper window the whole tree is exploded from the root C1,1 to the leaf node which contains f. Moreover, all nodes of the tree which contain the key-frame f are colour-encoded to highlight the search path. At once, in the lower window, the preview of the leaf node containing f is shown on the grid, as shown in Figure 6.
Starting from the leaf node containing f (at level Ln),
the user is then able to climb backward the hierarchy and sequentially access coloured nodes at levels Ln−1, Ln−2,
. . . , in order to refine his search and obtain the largest set of similar key-frames that interest him.
The tree is expanded to the leaf-node containing the clicked key-frame The user clicks on an interesting key-frame
Figure 6. By clicking on a key-frame of interest, the tree is expanded from the root to the leaf node containing the key-frame and the leaf preview is shown in the lower window.
This direct access to a node at the leaf level Ln,
espe-cially if combined with the backward sequential climbing allows to improve the effectiveness when the user’s aim is to retrieve all the segments showing similar content which are present in the database.
B. Random exploration
During browsing, even a professional user might be completely unaware of which direction to take to discover the desired content. When using traditional user inter-faces, in case an interesting key-frame is not presented at first, we observed that users often perform some “random” attempts of exploration with the options endowed by the application, in order to look for something that might better suit their queries.
We aim at showing that a possible way of identify-ing new search directions is to provide a novel system functionality, called random exploration, which imitates the user random behaviour in such situations. So, in case the displayed key-frames in the current node are of no interest for the user, the application allows to randomly select another node, visualise its summary thus opening a new search direction.
When the user decides to continue his random explo-ration and clicks on the related button, a two-steps process is invoked. The first step randomly selects one among the n available levels in the hierarchy; the second selection randomly picks one of the existing nodes belonging to the previously chosen level. This means that first the algo-rithm accesses one level Liof the hierarchy according to
a discrete probability density function which is uniformly distributed among all levels, so that:
p(Li) =
1
n, ∀i ∈ [1, . . . , n]. (1) Then one node belonging to level Liis chosen according
to a discrete probability density function which is uni-formly distributed among all nodes on the same level, i.e.
p(Ci,j) =
1 χi
, ∀j ∈ [1, . . . , χi]. (2)
where χi is the cardinality of level Li.
As we describe in the evaluation part described in Section V, this two-steps strategy enables to find in a reasonably short time new search directions, even in case of huge dimension databases. The intuitively more
straightforward strategy of a one-step random selection of a node Ci,j according to a probability density function
uniformly distributed among all nodes of the hierarchy (so that p (Ci,j) = 1/ !ni=1χi) has been discarded after a
few experiments. In this case in fact, since the cardinality of levels increases going from the root level towards the leaves, the probability to pick a leaf-node would be much higher than that to select a more populated node at a lower level.
If the visual preview is again of no interest for the user, another node can be randomly selected, and a different content set at a different level of the hierarchy is shown. This random walk can continue until the user is able to find an interesting key-frame and decides to follow the new information scent, for example using a sequential access to nodes in order to visualise content previews, or the jump-to-leaf functionality.
C. Random content access
Both random and sequential explorations are assisted by the display of the visual content previews in the bottom application window. Our solution displays a grid showing a configurable number of key-frames, where the image size is chosen so that the user can inspect the visual content summary without the need of any additional interaction (e.g., zooming, etc.).
The aim of the visual summary is to show a set of representative key-frames for each node in the hierarchy. However there are no semantic labels that could assist us in defining the most appropriate representative set for the selected cluster. Other already proposed solutions, such as showing the centroid image [17], or showing one key-frame for child node [18], can not either guarantee an optimal selection of representative key-frames. Therefore we adopt a similar approach to the one presented in [16], and we randomly extract from each node the set of key-frames to be displayed.
Although a restricted number of images can not com-pletely represent the content of a node, this approach avoids information overflow or inadequately re-sized key-frames and benefits from the advantage of low compu-tational complexity. In case the user wants to perform further exploration on the same node, he can request for additional content, and a new random set is then extracted from the node and displayed.
V. EVALUATION
The proposed application focuses on rushes, which is a specific type of professional raw audio-visual footage used by broadcasters to build documentaries or news, or by production companies to edit movies. For this reason large part of evaluation was based on professional use-cases and usability tests have been performed by 5 journalists from the main Basque broadcaster EiTB [19]. The efficiency tests instead, have been performed within the Queen Mary, University of London research lab. The video database used for tests has been provided by EiTB and contains 80 rushes with more than 3000
extracted key-frames, which are automatically organised in hierarchical previews based on visual similarity. A. Evaluation methodology
According to [20] there are at least four methods for evaluating information visualisation solutions: by com-paring design elements, by performing usability evalua-tion, by comparing different visualisation tools and/or by case studies of users performing “real” tasks using the application. On the other hand, human-computer interac-tion (HCI) is usually rated in terms of usability which comprises of effectiveness, efficiency and satisfaction, as defined in [21]. The evaluation focused on the inter-face performance: by combining appropriate evaluation metrics for visualisation and HCI, we measured user’s satisfaction and the system efficiency, without considering effectiveness, since it is more related to the performance of the clustering algorithm.
For evaluating user satisfaction, we tested our appli-cation in a real task scenario with an approach known as simulated work task situation [22]. Following this approach, the interface has been evaluated by the same professional users the application is built for, under real usage conditions. On the other hand, system efficiency was measured in terms of the time required by to accom-plish the given tasks.
B. Usability evaluation
For measuring the level of satisfaction with the appli-cation the evaluation was performed among journalists within the EiTB television centre, simulating as close as possible the real user scenario. Journalists were in-troduced to the application and the evaluation tasks, so after a short trial period in order to feel comfortable with the application, the evaluation process started. A grid showing 21 keyframes has been chosen for testing as a common search scenario for all users. Journalists were given two professional use-cases derived from the ones defined within the EU funded project RUSHES [23], i.e.:
• User-case 1: Find rushes key-frames containing
aeroplanes (see Figure 7);
• User-case 2: Find rushes key-frames showing a flood
scene (see Figure 8).
Figure 7. Examples of key-frames answering User-case 1. After performing the specified tasks, EiTB journalists were asked to fill a questionnaire (summarised in Table I) for rating their satisfaction with the most important as-pects of the proposed solution. The design of the
ques-Figure 8. Examples of key-frames answering User-case 2. TABLE I.
SELECTED QUESTIONS FROM USER QUESTIONNAIRE.
No. Statement
1. It is easy to use the interface
2. Interaction with the interface is comfortable
3. It is easy to understand the functionality of the interface 4. It is easy to understand the functionality of each button 5. The tree in the upper window is helpful for understanding
the database structure 6. The interface is well organised
7. The organisation of the visualisation display is clear 8. The tree in the upper window is helpful for browsing and
accessing content
9. The key-frames displayed in the bottom window provide a good overview of the node content
10. Random exploration is helpful for browsing when I don’t know where to find the desired content
11. The interaction method is intuitive
12. The colour of the tree nodes helps me to understand my position in the database
13. The interface is pleasant to use
tionnaire enables the user to mark their level of agreement with the provided statements. Marks were given using the typical format of five-level Likert scale as shown in Table II.
TABLE II.
MARKING SYSTEM INLIKERT SCALE.
Mark Answer
Strongly disagree 1
Disagree 2
Neither agree nor disagree 3
Agree 4
Strongly Agree 5
Obtained evaluation results are given in Figure 9 as a diagram of the average mark per each question.
After filling the questionnaire the journalists stated positive and negative aspects of the application, and gave personal comments on potential improvements. The most frequent positive and negative aspects are listed in Table III and Table IV, respectively.
As it is evident in Figure 9, the novel random access exploration has been highly appreciated by the journalists as an useful tool for browsing, especially when they did not know where to find the desired content. The same positive comment on random access was also one of the most cited among the reported beneficial aspects of the application (in Table III).
Regarding the potential improvements, EiTB journalists also suggested to display the basic information about
1 2 3 4 5 6 7 8 9 10 11 12 13 0 0.5 1 1.5 2 2.5 3 3.5 4 4.5 5 STATEMENT NUMBER AVERAGE MARK
Figure 9. Average marks per question for evaluating user satisfaction with the application.
the video segment represented by the selected key-frame, such as video title, date and duration. In addition to this, they stated the importance of adding the option of going a step backward in the navigation process, in case the chosen direction of exploration is not fulfilling their expectation. Finally they suggested to integrate a video-player directly in the application interface.
TABLE III.
MOST FREQUENTLY CITED POSITIVE REMARKS.
No. Positive remarks
1. Comfortable tool for browsing clip databases
2. Random exploration of nodes is helpful to find content without text-based search
3. Preview key-frames are good representation of the node content
TABLE IV.
MOST FREQUENTLY CITED NEGATIVE REMARKS.
No. Negative aspects
1. Add more information about the clips 2. Buttons should have icons and tool-tips
3. Displayed key-frames should be adaptive to node size
C. System efficiency
As previously stated, system efficiency was measured in terms of the time needed for accomplishing the given tasks. System testers were five non-professional users, chosen among the members of the Queen Mary, Mul-timedia and Vision Research lab (MMV), working in various areas of multimedia development. They were unfamiliar with the content repository and were not part of the developing team for this application. Each user was first introduced to the system by explaining the functionalities and properties of the application. After the users felt comfortable with sufficient understanding of the application, three sets of tests were performed. Test users were asked to find key-frames containing a plane, scenes with a flood and a sheep from the test database. These
TABLE V.
EFFICIENCY TEST:AVERAGE RESULTS PER USER.
User # Av. time [s] Tot. no. steps No. random st. No. sequential st. New key-fr. set Jump-to-leaf
1 8.67 2 0.67 0 0 1.33 2 14.40 3.33 0 0 3 1 3 48.30 15.33 9 5.33 0 1 4 12.75 3.33 0 0 2.33 1 5 22.39 10.67 5.33 1.33 3.33 1.33 Avg. 21.30 6.93 3.00 1.33 1.73 1.13
tasks were of medium/high difficulty, since for example in the rushes repository only 3.37 % of key-frames contain a plane, 1.64 % with flood and 2.12 % with a sheep. Although the main task of this experiment was measuring the time per task, we also made notes regarding user behaviour and types of interaction they performed, for future application improvements.
Table V shows the average time per user for success-fully completing the three tasks. The total number of steps are computed as: number of random access steps, number of sequential access steps, number of requests for a new set of key-frames from the same node and number of clicks on a single key-frame in the lower application window for a jump-to-leaf functionality. The results in Table V show that all three tasks were accomplished in a very short time and successfully.
During the evaluation process we noticed different behavioural patterns with different users. This is due to the fact that the application offers three methods of interaction: random access, sequential access and jump-to-leaf through the hierarchy. various methods of interaction were registered and are reported here:
• Some users employed the random access exploration,
but if the given key-frame was not found after few attempts, the sequential access was used instead;
• Other users preferred to stay in the root node and
continuously ask for new sets of key-frames of the root summary (lower window). After seeing something that might be visually similar to the requested frame, the users clicked on the key-frame, jumped to the leaf-node and started going backward through the hierarchy.
In the near future we envisage to observe and analyse more users while performing the retrieval tasks, in order to gather behavioural patterns and useful considerations for further development of the application.
VI. CONCLUSIONS AND FUTURE WORK In this paper we describe a visualisation application for browsing and searching through a rushes repository. The proposed solution combines information visualisa-tion techniques for structured navigavisualisa-tion of the database with hierarchical summarisation methods for fast content grasping. The novelty of the presented approach lies in modelling user navigational behaviour by a random exploration and access to content, which is useful for identifying new search directions in case of unknown
database. Navigation is supported by browsing initialisa-tion based either on key-frame selecinitialisa-tion or by sequential access to node previews. User tests and evaluation results showed that the proposed solution successfully assists a professional user in finding his way through the ini-tially unknown content repository, with an intuitive user interface. Regarding random navigation, further research is currently carried on to include into the navigational model the observations of broader behavioural patterns. Based on this, we are also exploring a novel cost function which, according to the retrieval time and number of steps performed by users, allows to select the preferable strategy to browse the visual content.
ACKNOWLEDGMENT
We would like to thank Leticia Fuentes Ardeo, Mikel Frutos Hernandez and journalists at EiTB for priceless help during the experimental evaluation. The application was developed using Prefuse [24] and Java Swing.
REFERENCES
[1] R. Villa, N. Gildea, and J. Jose, “Facetbrowser: a user interface for complex search tasks,” in Proc. of MM ’08. New York, NY, USA: ACM, 2008, pp. 489–498. [2] J. Adcock, J. Pickens, M. Cooper, L. Anthony, F. Chen,
and P. Qvarfordt, “Fxpal interactive search experiments for trecvid 2007,” 2007, proc. of the TREC Video Retrieval Evaluation.
[3] R. Benmokhtar, E. Dumont, B. M´erialdo, and B. Huet, “Eurecom in TrecVid 2006: high level features extrac-tions and bbc rushes exploitation,” in TrecVid 2006, 10th
International Workshop on Video Retrieval Evaluation, November 2006, Gaithersburg, USA, Nov 2006.
[4] S. Sav, G. J. F. Jones, H. Lee, N. E. O’Connor, and A. F. Smeaton, “Interactive experiments in object-based retrieval,” in Lecture Notes in Computer Science. Springer Berlin / Heidelberg, 2006, pp. 1–10.
[5] G. Marchionini and B. Shneiderman, “Finding facts vs. browsing knowledge in hypertext systems,” Computer, vol. 21, no. 1, pp. 70–80, 1988.
[6] W. Bailer and G. Thallinger, “A framework for multimedia content abstraction and its application to rushes
explo-ration,” in Proc. of CIVR ’07. New York, NY, USA:
ACM, 2007, pp. 146–153.
[7] M. Campanella, R. Leonardi, and P. Migliorati, “Interactive visualization of video content and associated description for semantic annotation,” Signal, Image and Video
Pro-cessing, August 2008, springer.
[8] C. G. M. Snoek, J. C. van Gemert, J.-M. Geusebroek, B. Huurnink, D. C. Koelma, G. P. Nguyen, O. de Rooij, F. J. Seinstra, A. W. M. Smeulders, C. J. Veenman, and M. Worring, “The MediaMill TRECVID 2005 semantic video search engine,” in Proc. of the 3rd TRECVID
[9] S. Benini and et al., “Report on the development and performance evaluation of clustering and summarisation modules,” in RUSHES Project, FP6-045189, Deliverable
D13, WP2, 2008.
[10] S. Benini, A. Bianchetti, R. Leonardi, and P. Migliorati, “Extraction of significant video summaries by dendrogram analysis,” in Proc. of ICIP’06. Atlanta, GA, USA, 8-11 October 2006.
[11] J. Lamping and R. Rao, “Laying out and visualizing large trees using a hyperbolic space,” in Proc. of UIST ’94. New York, NY, USA: ACM, 1994, pp. 13–14.
[12] B. Johnson and B. Shneiderman, “Tree-maps: a space-filling approach to the visualization of hierarchical infor-mation structures,” in Proc. of VIS ’91. Los Alamitos, CA, USA: IEEE Computer Society Press, 1991, pp. 284–291. [13] B. Bederson, “Photomesa: a zoomable image browser
using quantum treemaps and bubblemaps,” in Proc. of
UIST ’01. New York, NY, USA: ACM, 2001, pp. 71–80.
[14] G. G. Robertson, J. D. Mackinlay, and S. K. Card, “Cone trees: animated 3d visualizations of hierarchical informa-tion,” in Proc. of CHI ’91. New York, NY, USA: ACM, 1991, pp. 189–194.
[15] M. A. Hearst and C. Karadi, “Cat-a-cone: an interactive interface for specifying searches and viewing retrieval results using a large category hierarchy,” in Proc. of SIGIR
’97. New York, NY, USA: ACM, 1997, pp. 246–255.
[16] D. Borth, C. Schulze, A. Ulges, and T. Breuel, “Navidgator-Similarity Based Browsing for Image & Video Databases,” in Proc. of KI 2008, vol. II, Kaiser-slautern, Germany, September 2008, pp. 22–29.
[17] G. Schaefer and S. Ruszala, “Hierarchical image database navigation on a hue sphere,” in Proc. of ISVC06, 2006, pp. II: 814–823.
[18] S. Krishnamachari and M. Abdel-Mottaleb, “Image brows-ing usbrows-ing hierarchical clusterbrows-ing,” in Computers and
Com-munications, IEEE Symposium, vol. 0. Los Alamitos, CA,
USA: IEEE Computer Society, 1999, p. 301. [19] EiTB, “Euskal Irrati Telebista,” http://www.eitb.com/. [20] C. Plaisant, “The challenge of information visualization
evaluation,” in Proc. of AVI ’04. New York, NY, USA: ACM, 2004, pp. 109–116.
[21] E. Frokjaer, M. Hertzum, and K. Hornaek, “Measuring us-ability: are effectiveness, efficiency, and satisfaction really correlated?” in Proc. of CHI ’00. New York, NY, USA: ACM, 2000, pp. 345–352.
[22] P. Borlund, “The IIR evaluation model: a framework for evaluation of interactive information retrieval systems,”
Information Research, vol. 8, no. 3, 2003.
[23] L. A. Fuentes and et al., “Requirement analysis and use-cases definition for professional content creators or providers and home-users,” in RUSHES Project,
FP6-045189, Deliverable D5, WP1, 2008.
[24] “The prefuse information visualization toolkit,”
http://prefuse.org/.
Tijana Janjusevic received her MS degree in Department for Telecommunications, University of Belgrade, Serbia in 2005. She is currently a Ph.D. candidate at Multimedia and Vision Group (MMV), Queen Mary, University of London, UK. Her research interests include information visualisation and user interfaces for visual data mining.
Sergio Benini received his MS degree in Electronic Engineering (cum laude) at the University of Brescia in 2000 with a thesis which won a prize granted by Italian Academy of Science. Between 2001 and 2003 he’s been working in Siemens Mobile Communication R&D in Italy, on mobile network management projects. He received his PhD degree in Information Engineering from the University of Brescia in 2006, working on video con-tent analysis topics. During his PhD studies, between September 2003 and September 2004 he has conducted a placement in British Telecom Research (Ipswich, U.K.) working in the “Con-tent & Coding Lab”. He is an IEEE member since 2004, and he is currently an Assistant Professor in the Telecommunications group of DEA at the University of Brescia, Italy.
Ebroul Izquierdo is Chair of Multimedia and Computer Vi-sion and head of the Multimedia and ViVi-sion Group at Queen Mary, University of London . For his thesis on the numerical approximation of algebraic-differential equations, he received the Dr. Rerun Naturalium (PhD) from the Humboldt University, http://www.hu-berlin.de/, Berlin, Germany, in 1993. From 1990 to 1992 he was a teaching assistant at the department of applied mathematics, Technical University Berlin. From 1993 to 1997 he was with the Heinrich-Hertz Institute for Communication Technology (HHI), Berlin, Germany, as associated and senior researcher. From 1998 to 1999 Dr. Izquierdo was with the Department of Electronic Systems Engineering of the University of Essex, as a senior research officer. Since 2000 he has been with the Electronic Engineering department, Queen Mary, University of London. He is a Chartered Engineer, a Fellow member of the The Institution of Engineering and Technology (IET), a senior member of the IEEE, a member of the British Machine Vision Association and was acting chairman of the Visual Information Engineering professional network of the IET. He is member of the programme committee of several international conferences. He is an associate editor of the IEEE Transactions on Circuits and Systems for Video Technology (TCSVT). He has served as guest editor of three special issues of the IEEE TCSVT, three special issues of the journal Signal Processing: Image Communication and three special issue of the EURASIP Journal on Applied Signal Processing. He has published over 300 technical papers including book chapters. Riccardo Leonardi has obtained his Diploma (1984) and Ph.D. (1987) degrees in Electrical Engineering from the Swiss Federal Institute of Technology in Lausanne. He spent one year (1987-88) as a post-doctoral fellow with the Information Research Laboratory at the University of California, Santa Barbara (USA). From ’88 to ’91, he was a Member of Technical Staff at AT&T Bell Laboratories, performing research activities on image com-munication systems. In ’91, he returned briefly to the Swiss Federal Institute of Technology in Lausanne to coordinate the research activities of the Signal Processing Laboratory. Since February ’92, he has been appointed at the University of Brescia to lead research and teaching in the field of Telecommunication. His main research interests cover Digital Signal Processing applications, with a specific expertise on visual communications, and content-based analysis of audio-visual information. He has published more than 100 papers on these topics. Since ’97, he acts also as an evaluator and auditor for the European Union IST and COST programmes.