UNIVERSITÀ DEGLI STUDI DI SASSARI
SCUOLA DI DOTTORATO DI RICERCA
Scienze e Biotecnologie
dei Sistemi Agrari e Forestali
e delle Produzioni Alimentari
Indirizzo Scienze e Tecnologie Zootecniche
Ciclo
XXVIII
Use of genetic, genomic and phenomic approaches
to improve livestock performances
dr. Antonio Francesco Puledda
Direttore della Scuola prof. Antonello Cannas
Referente di Indirizzo prof. Gianni Battacone
Docente Guida prof. Nicolò P.P. Macciotta
Ringraziamenti
Desidero ringraziare tutti coloro che hanno reso possibile la realizzazione di questa tesi, professori, ricercatori e colleghi della scuola di dottorato di ricerca della Sezione di Scienze Zootecniche nonché il personale della stazione sperimentale Ifremer di Palavas les Flots.
Acknowledgements
I would like to acknowledge all people who contributed to this PhD thesis, professors, researches and colleagues of the Section of Animal Science as well as all people I met at the Ifremer experimental station of Palavas les Flots.
i Index
Abstract of the thesis...VI
CHAPTER 1
General Introduction
Animal breeding...2
The Best Linear Unbiased Prediction...3
The Variance Component Estimation...7
Genetic parameters: heritability and genetic correlations. ...8
The response to selection...10
From quantitative genetics to the genomic selection...14
High-throughput phenotyping technologies...17
Objective of the Thesis...25
ii CHAPTER 2
Estimates of heritability and genetic correlations for milk coagulation properties and individual laboratory cheese yield in Sarda ewes.
Abstract...36
Introduction...37
Materials and methods
Animals, milk sample collection and laboratory analysis...38 Statistical analysis. ... ...39
Results
Descriptive statistics...41 Heritability, phenotypic and genetic correlations of coagulation traits...45 Phenotypic and genetic correlations between milk coagulation
and milk quality traits...46
Discussions
Discussion...48 Heritability of milk coagulation, composition and cheese yield traits... ....49 Phenotypic and genetic correlations between milk coagulation traits
and cheese yield... ...49 Phenotypic and genetic correlation among milk coagulation,
milk yield and composition... ...51
Conclusions... ....52
iii CHAPTER 3
Effect of different Data Reduction on the Accuracy of Genomic Prediction on an Imputed High Density SNP panel in Italian Holstein cattle.
Abstract...58
Introduction...60
Materials and methods Data...62
Experimental design...64
Principal Component Analysis...65
Statistical Models PCA-BLUP method...67
SNP-BLUP method...68
DGV and accuracy estimation...68
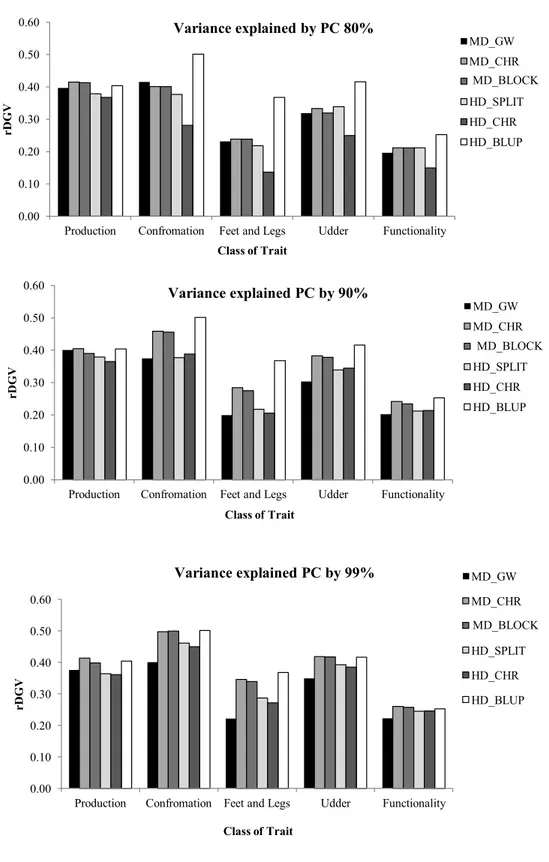
Results Principal Components...69
Degree of dimensionality reduction...70
Computation time...71
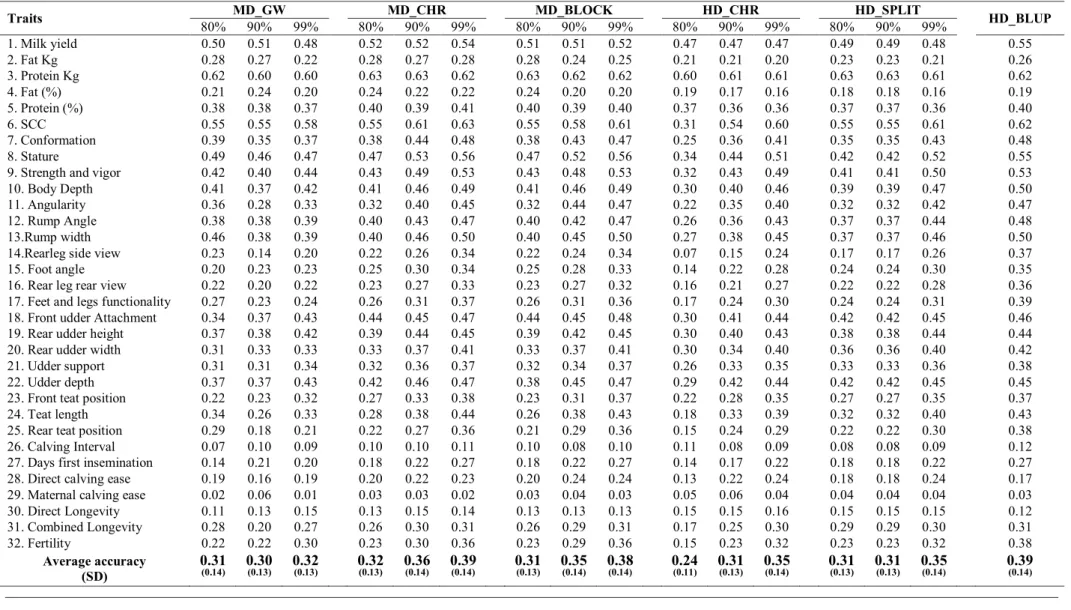
Accuracies (rDGVs) ...72
Discussions...75
Conclusions...77
iv CHAPTER 4
Echography and 2D morphological predictors for indirect selective breeding of fillet and carcass percentage in European sea bas (Dicentrarchus labrax).
Abstract...81
Introduction...82
Materials and methods Experimental design...84
Slaughter chain and processing data collection...84
Ultrasound tomography data collection...86
Image analysis...87
Phenotype data editing...88
Prediction models...88
DNA analysis and genotype data editing...89
Quantitative genetic analysis...89
Results Genotyping and parental assignment...91
Distribution of traits...92
Prediction equations...93
Heritabilities...93
Genetic correlations...96
Relative efficiency of indirect predictors...97
Expected Genetic Gain...101
Discussions Discussion...103
Fixed effects...104
Genetic parameters of carcass and processing traits...104
Predictors...106
Conclusions...108
References...109
v CHAPTER 5
Early landmark-based sexing of European Sea bass (Dicentrarchus labrax) using image analysis
Abstract...118
Introduction...119
Materials and Methods Fish production and rearing condition...122
Phenotypic data...122
DNA analysis and parentage assignment...123
Experimental population...123
Image Analysis and Landmark Capture...124
Inter Landmark Distances...124
Data Quality Control...125
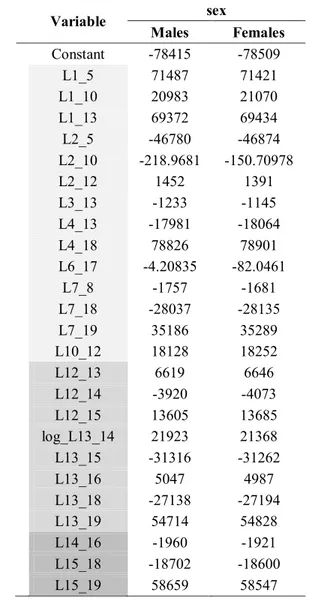
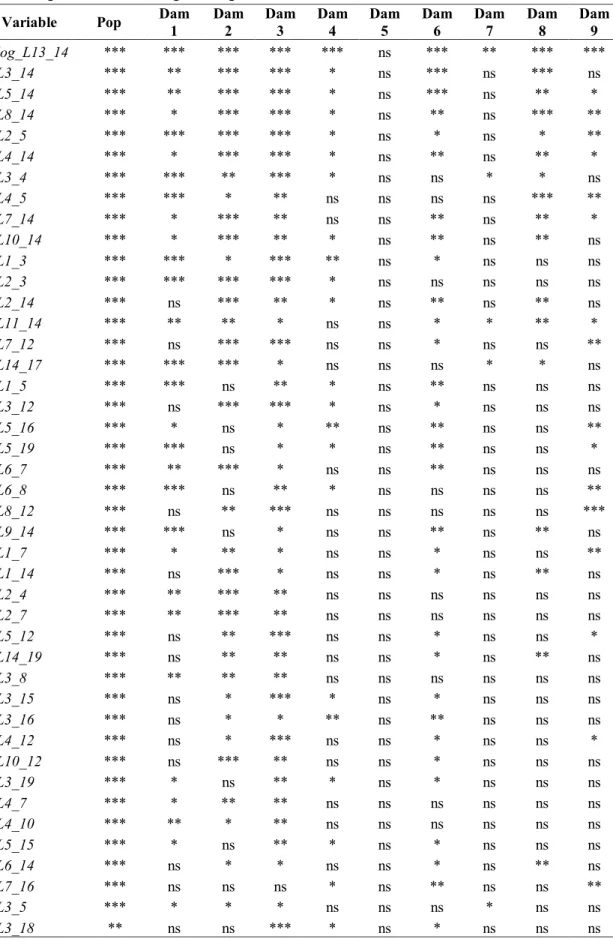
Statistical analysis...125
Multivariate analysis...126
Results and Discussions Biometric measurements...129
Inter Landmark Distances...129
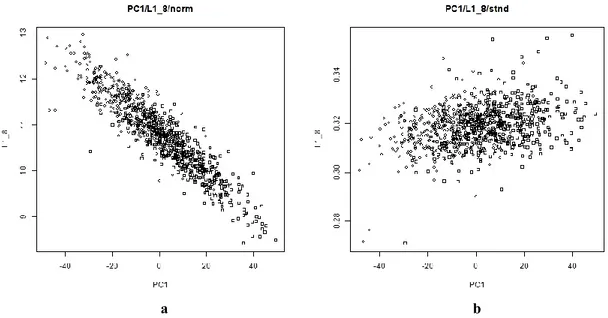
Standardization...131 Statistical analysis...132 Multivariate analysis...133 Conclusions...136 References...137 Supplemental materials ...141 GENERAL CONCLUSIONS...152
vi
Abstract of the thesis
Traditional methods to improve animal productions are derived from the quantitative genetics theory. The estimation of variance components, genetic parameters and genetic gains are essential steps of the selection process based on quantitative methods. The use of linear mixed models, algorithms for their solutions and computer to solve complex system of equations has made possible to estimate reliable genetic merits also from complex structures of relationships. More recently the high throughput technologies has provided a great increase of information both at genomic than phenomic level. This high informativeness has led two main consequences: improved accuracies and faster genetic gains from one hand, big data handling and unbalancing from the other hand. The present thesis will deal with these aspects. Two experimental contributions will focus on the estimation of genetic parameters for new criteria of selection on species of particular interest, with traditional and innovative phenotyping methods. A third contribution will deal with the research of new morphometric indicators that could have an economic impact if applied for the selection of the species of interest. Finally, a fourth contribution will address the issue of the data unbalancing derived from the current information gap generated by the speed of genotyping and the capacity of the phenotyping practices. All these contributions will have the same aim, the improvement of livestock performances.
1
CHAPTER 1
2 Chapter 1
______________________________________________________________________________________________________
Animal breeding
Animal breeding is aimed at improving the traits of economic interest in livestock. The genetic merit of animals is estimated on the basis of phenotypes and the relationships among individuals. Objective of the selection is to identify the candidates with the highest genetic merit and to transmit this improvement to their offspring through programmed matings. The genetic merit is called “Breeding
Value” (BV) and represents the most important information achievable for the
improvement of animal productions. By choosing the highest BVs, the possibility to fix the genetic improvement in the following generations is maximised. The measurement of the selection response is the way to estimate the genetic progress. A selection on specific alleles and an alteration in the gene frequencies of the population is obtained by mating animals on the basis of their BVs, resulting in a shift in the population mean. The speed in getting the genetic goals rely on the nature of the trait under selection and, in particular, from its heritability. The heritability is the genetic parameter that measure the proportion of the trait variance which is genetically determined and, hence the ability of the trait to be transmitted through the generations. The heritability, together with the knowledge of the relatedness among individuals is the basic component of any breeding programme. Indeed, the knowledge of the degree of resemblance between the individuals provides, through the decomposition of the phenotypic variances and covariances, the genetic merit of an individual, its Breeding Value (Falconer and Mackay, 1996).
The opportune combination of phenotypic and pedigree information into a selection index (Hazel and Lush 1942; Hazel, 1943) allows the evaluation of the individual genetic merit. In practice the index assumed the form of a simple or multiple regression of the breeding value on multiple sources of information. In the simplest case of a single trait, the index is obtained by multiplying the individual phenotypic deviation from the population mean by the heritability of the trait (h2) that represents the coefficient of regression of the breeding value on the phenotype.
3 Chapter 1
______________________________________________________________________________________________________
Antonio Francesco Puledda
“Use of genetic, genomic and phenomic approaches to improve livestock performances”
Tesi di dottorato in Scienze e Biotecnologie dei Sistemi Agrari e Forestali e delle Produzioni Alimentari Indirizzo Scienze e Tecnologie Zootecniche - Università degli Studi di Sassari
The BV estimation obtained by the simultaneous consideration of multiple sources of information is more accurate. In this case, the index is the result of a multiple regression and the best combination of partial regression coefficients is found by minimizing the sum of squares of the regression of the index on the breeding value, in other words, by maximizing their correlation. The form of the index in the case of multiple sources of information is:
Several environmental factors are able to affect the estimation of breeding values. The main problem is the absence of the a priori knowledge of the magnitude of these effects. Knowing these factors, observations can be adjusted and estimates properly corrected. In practice this knowledge was not available in advance and it was the reason that hampered genetic evaluation before the introduction of statistical procedures able to estimate fixed and random effects simultaneously. This was done thanks to the main contribution of Charles Roy Henderson that developed the methodology called Best Linear Unbiased Prediction (BLUP). BLUP assumes the knowledge of genetic and residual variances that are normally assessed by different kind of iterative methods.
The Best Linear Unbiased Prediction
The statistical procedure introduced by Henderson, known as Best Linear Unbiased Prediction (BLUP) is worldwide used to estimate breeding values through models including both fixed and random effects simultaneously. In matrix notation, the general form of a mixed model is as following:
where y is a vector of n by 1 observable variables used in the prediction, β is a fixed, unknown vector of length p, a is the random vector including breeding values with q
elements, null means and variance V(a) = = G. Moreover, X and Z are known
matrices composed by 0 and 1, relating records to the relative fixed and random effects, respectively. Finally e is the random vector of errors with n elements, null
4 Chapter 1
______________________________________________________________________________________________________
means and variance V(e) = = R. Assuming the absence of covariance between a and e, Cov(a, e) = Cov(e, a) = 0
and the variance of y
the estimation of β (BLUE) and the prediction of a (BLUP) can be obtained from:
where is the covariance between a and y (cova, y) divided by V (vary), that is
the regression coefficient of y on a, with y corrected for the fixed effects. The solution of and require the inversion of V, not always computationally feasible. To avoid this problem, Henderson proposed the following equation:
and factoring out the terms from both sides of the equation and transforming
G = , the equation becomes:
where A is the Numerator Relationship Matrix (NRM) reporting the additive genetic relationships among individuals and is the ratio . This is the canonical form of the Mixed Model Equation (MME). Properties of BLUP are:
the mean square error E(âj-aj)2 is minimized (the Best),
âis a linear function of y (Linear),
âj is an unbiased estimator of aj (Unbiased).
The main use of the mixed models is the estimation of genetic additive effects (a) by adjusting the data for the known fixed effects. The accuracy of these predictions is
5 Chapter 1
______________________________________________________________________________________________________
Antonio Francesco Puledda
“Use of genetic, genomic and phenomic approaches to improve livestock performances”
Tesi di dottorato in Scienze e Biotecnologie dei Sistemi Agrari e Forestali e delle Produzioni Alimentari Indirizzo Scienze e Tecnologie Zootecniche - Università degli Studi di Sassari
improved by considering relationship between all evaluated animals. However, when the number of animals is large, the computation of A and its inversions are not feasible through conventional routines. Henderson (1976) proposed a rapid method to compute the inverse of NRM bypassing the computation of A. Since its introduction, BLUP has been developed and extended to obtain a variety of genetic evaluation in animal breeding, especially for dairy animals (Quaas and Pollack, 1980).
BLUP was for the first time implemented in the genetic evaluation of bulls through the Sire Model. This kind of model made possible the estimation of genetic merit of candidates using the comparison of the performance of contemporary progeny groups. The evaluation of dams was considered secondary and obtained using the sire merit. With the expansion of the artificial insemination (AI), most of the hypothesis on which the earlier models were based on, became invalid. In particular, the consequence of the intense use of the best bulls for AI, was the creation of genetic subpopulations in the same breed, thus the assumption of sampling from a homogeneous population was not longer acceptable. The consideration of the existence of subpopulations in the estimation of the breeding value started in the 1972 by the introduction of the North East Artificial Insemination Sire Comparison model (NEAISC) with the aim to account for the genetic trends deriving from these subpopulations. Despite the advantage in terms of accuracy by using the relationship among sires, the use genealogical information was not possible for technical reason until the discovery of the Henderson’s rules (1976) for the direct inversion of the numerator relationship matrix (NRM).
With the use of genealogical information, the genetic merit started to be corrected by the genetic level of females. In 1979 the Sire-Maternal Grand Sire model was introduced to account for the genetic level of the daughters of the maternal grand sire. This model was used until 1989 when the progress in computer machinery made feasible the advent of the Animal model (AM). The concept of the individual AM was announced by Henderson in the 1949 but this name was firstly used in the paper of Quaas and Pollack (1980). Due to the excessive computational requirements needed to obtain routine evaluations, a number of computational simplifications have been proposed to reduce the number of equations derived from full AM. An example
6 Chapter 1
______________________________________________________________________________________________________
was the Reduced Animal Model (RAM) proposed by Quaas and Pollack (1980) and implemented by Henderson (1985), Westell (1984, 1988) and Van Vleck (1990). With these methods, the only breeding values included in the equations are of animals having one or more tested progeny. Through a back approach, appropriate linear functions, derived from the vector of solutions were used to evaluate related individuals with no progeny. When the RAM models were not solvable due to computational reason, other procedures such as the Gauss-Seidel iterative methods and the ordination of animals by traits were used to obtain single and multiple traits evaluations, respectively. The computational adequacy to solve the great number of equations generated by AM was reached only in 1989. Since that moment, the AM became the reference methods for animal selection. AM allows the contemporary evaluation of all individuals included in the relationship matrix by using the own and all available performances from known relatives (ascendants and descendants), enhancing the accuracy of predictions, overcoming the problem of the comparisons between animals coming from different environment and periods and having different sources of parental and phenotypic information.
Early dairy breed evaluation systems had been based on lactation model describing milk, fat and protein produced in standardized lactation in term of genetic and environmental variation without considering factors affecting productions in different lactation stages. In other words, the intra-lactation variance was assumed to be absorbed by the residual variance. This limitation was overcame when the computational power allowed to use daily individual performances recorded during the entire lactation and the implementation of the test day (TD) models (Stanton et al., 1992). The TD represents the amount of milk/fat/protein produced and measured on a specific day during the lactation. The number of tests depends on the length of lactation and the frequency of measurements. The frequency of testing varies according to different recording plans and it is mainly imposed by economic reasons. The advantage of using TD model is the possibility to correct observations for environmental effects specifically affecting the records during the lactation. Different mathematical functions have been proposed by many authors to draw the lactation curves. On the basis of these functions, different models have been applied to calculate genetic merit of the sires. Among these, Random Regression Models
7 Chapter 1
______________________________________________________________________________________________________
Antonio Francesco Puledda
“Use of genetic, genomic and phenomic approaches to improve livestock performances”
Tesi di dottorato in Scienze e Biotecnologie dei Sistemi Agrari e Forestali e delle Produzioni Alimentari Indirizzo Scienze e Tecnologie Zootecniche - Università degli Studi di Sassari
(RRM) assumes that the shape of a lactation curve is different for each cow according to individual values of coefficients and giving the possibility to change milk recording programs in accordance with the expected level of accuracy.
The Variance Component Estimation
The total variance of the phenotypic value can be subdivided in the following components:
where subscripts a, d and i refers to the additive (average effects of individual alleles), dominance (interaction between alleles at each locus) and epistatic (interaction between genotypes at different loci) effects in which the total genetic variance is decomposed (Walsh B., 2001). Subscript e refers to the environmental source of variance, an important source of variability able to reduce the precision of the genetic estimations (Falconer and Mackay, 1996). Variance components estimation for standard designs (balanced and with random sampling of parents) can be obtained by using least square analysis (analysis of variance and regression). In more realistic cases, when more complicated population structures, several generations or selected groups are considered, other statistical tools as the maximum likelihood (ML) procedures, are used. Based on iterative algorithms, these procedures allow to exploit all the available information deriving from any structure of genetic relationships. By assuming some starting values (the priors) the procedure search, through iterations, values of variance at which the likelihood is maximized. Common fixed effect such as season, year and herd need to be taken into account because they could determine an underestimation of the variance components. A modification of the ML, known as restricted maximum likelihood (REML), is able to adjust observations by weighting all possible fixed effects. Although these procedures require more computational power than simple ML, they become the methods of choice for the estimation of genetic parameters and are currently widespread in the most common software packages for animal breeding.
8 Chapter 1
______________________________________________________________________________________________________
Genetic parameters: heritability and genetic correlations.
Heritability is the population parameter that measure the genetic proportion of the variation existing among individuals. It is formally defined as the quota of the phenotypic variability genetically determined and potentially transmittable to the progeny. In a broad sense, heritability derives from the ratio between the genetic and the phenotypic varince. However, being dominance and epistatic effects (d and i, respectively) not responding to selection and assuming an absence of genotype by environment interaction (G x E = 0), heritability is more practically referred to the ratio between the heritable additive genetic variance and the phenotypic variance ( and given by:
In this form heritability assumes a narrow sense and accounts for the differences and resemblances among individuals due to their additive genetic effects. Heritability is one of the main important biological concepts in animal breeding having a central role in the prediction of the response to selection. In breeding programmes, the heritability suggests the efficiency of the prediction of the breeding value from phenotypic information allowing comparisons of the same trait on different populations or different traits on the same population. Heritability is a dimensionless value that ranges from 0 to 1, where 0 means the same average effect of allele on the character (variation is completely due to environmental reason) and 1, indicating that all variation is due to the average effect of alleles. The estimation of heritability relies on the use of phenotypes collected on a huge number of individuals. When phenotypes derive from population with a mixture of relationships, multiple generations or unbalanced designs, estimates of genetic parameters are obtained through the use of complex iterative methods based on linear mixed models (Visscher et al., 2008). The development of mixed models improved the reliability of estimates by keeping into account all existing relationship between relatives. Lynch and Walsh (1998) and Thompson, (2005) reviewed methods employed for the genetic parameter estimation occurred in the last half century.
9 Chapter 1
______________________________________________________________________________________________________
Antonio Francesco Puledda
“Use of genetic, genomic and phenomic approaches to improve livestock performances”
Tesi di dottorato in Scienze e Biotecnologie dei Sistemi Agrari e Forestali e delle Produzioni Alimentari Indirizzo Scienze e Tecnologie Zootecniche - Università degli Studi di Sassari
The knowledge of the relationships existing between traits is of great interest since the improvement of one character by selection could cause simultaneous changes in other correlated characters. The correlation between traits derives from genetic (pleiotropy and linkage) and environmental causes. Pleiotropy is the property of a gene to affect more characters simultaneously and its influence can affect correlated traits either positively or negatively. Moreover, genes closely located on the chromosomes are more likely to segregate together and cause interactions (correlations) on the expression of more than one characteristic. The environment operates the same influence on all characters simultaneously. The phenotypic correlations between traits can be dissected into the genetic and environmental causes (Falconer and Mackay, 1996):
where and are the genetic and environmental correlations, and are the square root of the heritability of both traits, and are the square root of the environmental portion of the phenotypic variance . The terms is also known as the coheritability (Falconer and Mackay, 1996) and it allows the estimation of the correlated response, a particular kind of selection based on the use of correlated traits. The estimation of the genetic correlation ( is based on the use of variance and covariance between traits:
or considering the offspring–parent relationship through the cross-variance estimation:
where is the covariance between traits X in the parent and Y in the offspring
(or vice versa), and are the between-relatives (parent-offspring) covariances of trait X and Y, respectively. If both cross-variances are available (trait X in parent and Y in offspring and X in offspring and Y in parent), the is the mean of the two estimations (Falconer and Mackay, 1996).
10 Chapter 1
______________________________________________________________________________________________________
More accurate estimates of variance and covariance between traits are obtained by using mixed linear model based on single and multi-traits evaluations rather than the parent-offspring models. In a series of studies (Kruuk, 2004; Åkesson et al. 2008), genetic parameters obtained from parent-offspring regression are compared with those obtained through animal models. In particular more accurate values (lower standard error) of genetic parameters were obtained when using animal models, suggesting a lesser sensitivity of these methods against possible sources of bias such as selection of non-additive covariances between relatives. On the basis of these results the authors suggested particular attentions when comparing genetic parameters arising from different methods of estimation.
The response to selection
The response to selection (R) is the change of the population mean of a phenotypic value from the population from which parents are chosen and the offspring of the selected parents. The difference between the mean of the phenotypic value of the selected parents and the whole population before their selection, is the selection
differential (S). Interest of the breeders is to know what improvement in a character
can be obtained in the offspring by selecting some parents instead of others. Knowing the selection differential, the prediction of the response can be calculated considering the heritability of the character by the following equation, also known as “Breeder’s equation” (Lush, 1937):
Assuming that the information about the mean value of the character in the offspring is already unknown, the response to selection depends on the heritability of the trait estimated on the parental generation. Due to the change in gene frequencies and the reduction of variability obtained through selection, heritability, selection differential and consequently response to selection have to be updated after few generations (Falconer and Mackay, 1996). Moreover, assuming that selection is performed by truncation (all individuals beyond the truncation point are selected as parents) and
11 Chapter 1
______________________________________________________________________________________________________
Antonio Francesco Puledda
“Use of genetic, genomic and phenomic approaches to improve livestock performances”
Tesi di dottorato in Scienze e Biotecnologie dei Sistemi Agrari e Forestali e delle Produzioni Alimentari Indirizzo Scienze e Tecnologie Zootecniche - Università degli Studi di Sassari
that character of interest follow a normal distribution, the selection differential should be expressed in terms of standard deviation and symbolised by:
where i is the intensity of selection that is the degree of the pressure of the selection applied depending on the proportion of the population selected as parents and is the standard deviation of the trait. The intensity of selection is given by:
and suggests how many times, in standard deviations unit, the mean of the selected group exceeds the mean of the whole population. If the trait under selection follows the normal distribution, the value of the intensity of selection can be easily determined. The standardized selection differential allows to compare the responses obtained for traits having different units of measures. By replacing the selection differential with the intensity of selection the equation of response become:
that is the classical form of the response to selection. Different strategy of selection can be adopted to get a response. Individual or Mass Selection (MS), Family (sib selection and progeny testing) and Within-Family (WF) selection, are different examples, each one adopted under specific circumstances.
For each type of selection, the individual phenotypic value can be thought as the sum of two different components: the deviation of the family from the population mean and the within-family deviation of the individual from its family mean. Depending on the kind of selection applied, different weights are given to these two forms of deviation. In particular, in the case of the individual selection, neither deviations are considered, being the selection based on the deviation of the individual value from the population mean. In the case of family or within-family selection, one of the two sources of deviation is set to 0. However, the maximum rate of response is obtained by applying the selection knows as combined selection. This kind of method uses the family and within-family heritabilities as regression coefficients and gives at the same time, the right weight to each component of the above mentioned forms of
12 Chapter 1
______________________________________________________________________________________________________
phenotypic deviation. For each type of selection the form of the expected response varies taking into account the provenience of the sources of variation as following:
where subscripts i, f and w refer to the individual, family and within-family selection. To allow comparison between expected responses obtained between individual and family, within-family and combined selection, different comparison factors are conveniently inserted in the expected response equations that according to Falconer and Mackay (1996), becomes:
where n is the number of individuals in the family (family size), r is the coefficient of relationship between relatives (that changes considering the method of selection) and
t is the phenotypic intraclass correlation.
Two different characters can show a correlation if traits are related for some reasons. The sum of genetic and environmental influences can produce a covariance between related traits that can be directly observable through the phenotypes of a number of individuals in the population. As the same for the variance of one trait, the covariance between two traits can be divided in these two components, genetic (additive genetic) and environmental (non additive genetic). The partitioning on these two components should be treated in terms of correlations, being the correlation a ratio of the covariance with the standard deviation of the two traits. The
13 Chapter 1
______________________________________________________________________________________________________
Antonio Francesco Puledda
“Use of genetic, genomic and phenomic approaches to improve livestock performances”
Tesi di dottorato in Scienze e Biotecnologie dei Sistemi Agrari e Forestali e delle Produzioni Alimentari Indirizzo Scienze e Tecnologie Zootecniche - Università degli Studi di Sassari
correlation. Once obtained the observational components for each trait by using dedicated software, selection of animals can be performed indirectly by using the correlation between characters. This kind of selection is named Indirect Selection (IS) and is based on the use of secondary characters, correlated with the trait that is desired to improve, obtainable by applying the Correlated Response:
where the coheritability ( is simply multiplied, in the same manner of the heritability under the individual selection, by the intensity of selection and by the phenotypic standard deviation of the trait of interest, that is directly observable from individuals in the population. Indirect selection is normally preferable when the heritability of the character of interest is lower of the secondary one and when the correlation between traits is relatively high. Indirect selection is preferable to direct selection when it is difficult or impossible to measure the direct character on individuals. For example, when the measurement of a character is affected by not negligible errors, heritability is reduced by the predominance of the non additive and environmental components and the direct response is also reduced. In this case, the use of a related trait easier to measure could result in the indirect improvement of the character of interest.
Indirect selection is also preferred instead of direct selection when the second method results costly or even lethal for individual under selection. In these cases, the choice of characters whose measurements are cheaper or that avoid the sacrifice of individuals could be more ethical, economic and time savings. The indirect selection applied directly on candidate by using indirect criteria, avoiding the use of sibs in replacement of candidates, being the response not affected by the relationship between individuals, could result in faster genetic gain.
So, the response to selection can be improved by increasing the heritability of a character through more accurate rearing or measuring techniques, by the increase of the intensity of selection or by the reduction of the generation interval. The response of selection that take into account of the generation interval become
14 Chapter 1
______________________________________________________________________________________________________
where T is the generation interval, or equivalently the time that elapses between the same event in two successive generations, as for example the interval occurring between the mating of parents and the mating of their offspring (Falconer and Mackay, 1996). By dividing the equation of the response to selection by the generation interval, the response is expressed in terms of speed of genetic gain or more specifically in gain per unit of time.
From quantitative genetics to genomic selection
Minimizing the denominator of the previous formula, the response to selection tends to be maximized for the considered unit of time. There is an inverse relationship between the generation interval and the speed of the genetic gain, since the shorter the time between two following generations, the greater the response to selection achievable within the interval. If considered in terms of accuracy, the above form of response can be rewritten as:
where is the accuracy of the breeding value expressed as correlation between the selection index and real genetic merit ( ). In this form, the genetic
gain is directly proportional to the intensity of selection, to the accuracy of the breeding value and to the genetic standard deviation of the character under selection, remaining inversely related to the generation interval. The accuracy of the breeding value depends on the number and kind of information available. From this point of view, a longer generation interval allows to obtain a greater number of information from which to estimate more accurate breeding values but at the same time, the increase of the generation interval tends to reduce the response. The optimal combination of these three entities ( is at the basis of a selection program.
15 Chapter 1
______________________________________________________________________________________________________
Antonio Francesco Puledda
“Use of genetic, genomic and phenomic approaches to improve livestock performances”
Tesi di dottorato in Scienze e Biotecnologie dei Sistemi Agrari e Forestali e delle Produzioni Alimentari Indirizzo Scienze e Tecnologie Zootecniche - Università degli Studi di Sassari
information at genotype level for different livestock species. More recently, with the substantial reduction of the costs of the genotyping, the availability of genomic information increased dramatically. The recent availability of High Throughput Technologies (HTT) and of dense molecular marker maps, composed by many thousands of Single Nucleotide Polymorphisms (SNPs), made feasible since 2001, the development of the genomic selection technology (Meuwissen et al., 2001). Since the initial simulation studies to the current real practice, this new approach to the animal selection, showed the ability to nearly double the genetic responses simultaneously reducing the generation interval and improving the breeding values accuracy, if compared with the classic selection tools.
Genomic Selection (GS) relies on the estimation of direct genomic breeding values
(DGV) of animals by assessing the effect of the total number of segment in which the genome is divided into. Molecular Markers are the boundaries of these segments and their number determines the density of the marker maps. Generally, genomic selection is a two-step procedure (Hayes et al., 2009a): at first, marker effect estimation is performed on a reference population with known genotypes and phenotypes and later, the effects previously estimated are used for the prediction of DGV of young animals without phenotypes. GS has made the selection process faster and cheaper than traditional selection schemes, particularly for low heritability (behaviour), sex-related (milk production), lethal (carcass quality and meat content) or costly to measure (feed efficiency) traits. Animals are chosen on the basis of their genomic merit and genomic profiles are rapidly available early in the life resulting in a substantial reduction of the generation interval and improvement of the genetic response.
The accuracy of the genomic predictions, measured by the correlation between the DGV and phenotypes available, is also increased and generally intermediate between that obtained with the pedigree index (evenly characterised by absence of phenotypes but using the average genetic merit of parents) and progeny testing, that is the most accurate but expensive system of assessment of genetic merit. The accuracy of GS is dependent from multiple causes such as size and structure of the reference population, number of markers, the statistical model and different genetic aspects related to the evaluated trait. Among the others, the aspect that mainly affects the
16 Chapter 1
______________________________________________________________________________________________________
DGV estimations is the great disproportion between the number of animals having phenotypic records (n) and the number of markers used as predictors (p), the so called n << p problem. Apart from automatic data recording systems, generally the phenotypes are commonly obtained from field recording. Thus, expensive to measure traits may limit the total number of animals that can be included in the reference population. Conversely, the unitary cost of the single markers is progressively decreasing. To address this issue different strategies have been undertaken. One possibility is the reduction of the number of genetic markers by keeping constant the quantity of individuals. Variable reduction was obtained through the pre-selection of molecular markers with different regression procedures (Solberg et al., 2009; Moser et al., 2010; Dimauro et al., 2013), by ranking and choosing markers on the basis of their effect (Weigel et al., 2009) or statistical association (Schulze et al., 2004, Pattaro et al., 2008) with the trait of interest or by substituting molecular markers with a reduced number of predictors obtained applying multivariate statistical techniques as the Principal Component Analysis (Solberg et al., 2009; Macciotta et al., 2010; Moser et al. 2010). Another way is to increase the number of observations by sharing phenotypes and genotypes of animals belonging to the same breed (Lund et al., 2011; Jorjani et al., 2012) or using mixed reference population by multi-breed
approach (Hayes et al., 2009b). Despite the benefits of the enlargement of the
reference population, this approach showed side effects derived from the genetic structures of the admixed population (Pryce et al., 2011). Alternatively, the increase of the number of animals can be achieved by reducing the costs associated with genotyping, via imputation (VanRaden et al. 2013). The imputation technique is a in
silico reconstruction of missing genotypes, allowing to obtain with reliable
accuracies, higher marker densities starting from cheapest low-density panels (3– 7K). In this manner a larger number of animals can be genotyped and dataset with different marker densities uniformed and compared. Nowadays, new technologies are revolutionizing the field of the data collection through the use of phenotyping procedure able to reduce the costs of data recording. The introduction of automated systems is allowing the real time phenotyping of a larger number of animals. The next two paragraphs will deal with some of the high throughput technologies that are revolutionizing the animal breeding.
17 Chapter 1
______________________________________________________________________________________________________
Antonio Francesco Puledda
“Use of genetic, genomic and phenomic approaches to improve livestock performances”
Tesi di dottorato in Scienze e Biotecnologie dei Sistemi Agrari e Forestali e delle Produzioni Alimentari Indirizzo Scienze e Tecnologie Zootecniche - Università degli Studi di Sassari
The large number of SNPs variants discovered by genome sequencing of different livestock species, offers today the opportunity to use these genetic differences for implementing studies at different genetic scales. Different technologies in the field of the SNP genotyping have been developed until now, ranging from single to multiplexed assays, and most of these are commercially available. Ragoussis (2006) reviewed the main technologies, describing pros and cons for each of them. Large scale genomic studies are based on the analysis of the whole genome of many individuals, then systems capable to detect simultaneously tens or hundreds of thousands of genotypes for each animal, on thousands of individuals, are needed. Nowadays the whole genome genotyping technology (WGG) proposed by Illumina, is one of the most common high-throughput technologies able to investigate DNA at the genomic level. WGG is well appreciated because it is able to reduce working time, operation errors and unitary cost per single SNP analyzed (Shen et al., 2005).
High-throughput phenotyping technologies
The success of the selection for quantitative traits is largely dependent on the availability of reliable phenotypes. However the phenotyping process has constituted for many years a bottleneck for genetic analysis and genomic predictions (Furbank et al., 2011; Cabrera-Bosquet et al., 2012; Rahaman et al., 2015) particularly in the last decades, with the advancements obtained in the molecular genomics framework. High dimensional phenotypic data are needed both to discover genomic variants affecting more than one phenotype at the same time and to explain their pleiotropic effects. Moreover, the large amount of phenotypic information nowadays achievable by the implementation of high-throughput phenotyping platforms (HTPP) associated with the improvement of the accuracies of the traits measured, results in better heritability estimates (Houle et al., 2010), and improved breeding outcomes. HTPPs are offering the opportunity to measure a great amount of detailed traits with real-time systems, then providing the solution to overcome the limitation imposed by the number of records in the genomic selection.
The first phenotyping systems have been developed in the field of plant breeding where many thousands of individuals are often involved in breeding programs
18 Chapter 1
______________________________________________________________________________________________________
(Cabrera-Bosquet et al., 2012). Phenotyping systems make the process of trait measurement faster and cost-effective, increasing the precision of the phenotypic measurements at all biological level and avoiding, when possible, the destructivity associated with traditional phenotyping procedures. The image analysis technologies are very popular in plant breeding. Rahaman et al. (2015) described the imaging devices for high throughput plant phenotyping based on the interaction between organisms and light. Visible light on 2D and 3D dimension, fluorescence and spectroscopy imaging can provide information regarding growth and biomass (morphological), nutrition (physiological) and health status for disease detection or stress diagnosing. More recently functional imaging based on PET (Positron emission tomography), MRI (magnetic resonance imaging) and FRET (Förster resonance energy transfer) were integrated to screen at molecular level, the functional and structural plant dynamics. After image acquisition, raw data are processed and once integrated with molecular and environmental metadata, statistical models are performed to describe factors affecting development and to predict performances. Despite the well consolidated availability of dedicated high-throughput phenotyping facilities, including image processing and analysis software in plant breeding (Lobet et al., 2013), phenomics represents a relatively new approach of trait measurement in farmed animals, especially if compared with huge progresses made in animal genomics.
Livestock phenomics represents the new trend of the individual animal measuring. It
relies on the real-time high-dimensional phenotypic data acquisition, aimed at obtaining an improvement of animal performances through the enhancement of accuracy and reproducibility of conventional traits or the introduction of novel traits of economic interest, otherwise unachievable. All phenotypes are measurable from the whole organism to the sub-cellular components by implementing adequate measuring systems (Greenwood et al., 2016). The importance of an universal recognition of economic relevant traits and of the methods for their measurements has led to the development of a worldwide uniformed reference ontology for phenotypic traits of farm animals, the “Animal Trait Ontology of Livestock” (ATOL) (Hocquette et al., 2012), and the “Environment Ontology for Livestock” (EOL) for
19 Chapter 1
______________________________________________________________________________________________________
Antonio Francesco Puledda
“Use of genetic, genomic and phenomic approaches to improve livestock performances”
Tesi di dottorato in Scienze e Biotecnologie dei Sistemi Agrari e Forestali e delle Produzioni Alimentari Indirizzo Scienze e Tecnologie Zootecniche - Università degli Studi di Sassari
the standardization of breeding conditions which may influence the expression of these phenotypes.
In contrast with the plant breeding, where organism are motionless, animal phenotyping often requires tracking or alternatively the introduction of technologies that do not prevent movements, particularly for animals fed at pasture. The real-time monitoring of the behaviour of ruminants for example, is important to make effective decisions about pasture management and feed supplementation, allowing the optimization of animal performances and enabling a more rational environmental management and improving economic outcomes. Until now, several techniques have been used to improve the management of pasture by discriminating grazing and ruminating behaviours in different species (Andriamasinoro et al., 2016). Sensors of movement such as accelerometers, magnetometers, gyroscopes coupled with audio-visual recording devices and satellite tracking systems are suitable to obtain real-time information about feeding behaviour, directly from field. Systems for recording the behaviour of grazing animals at pastures have been recently implemented on cattle (Bishop-Hurley et al. 2014; Williams et al., 2014; Dutta et al., 2015;) and on dairy sheep (Sneddon et al., 2014; Alvarenga et al., 2016; Decandia et al., 2016). The knowledge of the pasture location and timing of grazing can be fundamental to understand, and eventually to model, the changing on milk yield and composition since these changes are able to influence derived products. When animals are fed at pasture in fact, additional aspect such as phenological stage and the specific contribution (SC) of the main botanical families grazed, other than animal-related variables, are able to influence milk properties (Gorlier et al., 2012). Traditional methods of mapping vegetations directly on the field are generally time consuming, expensive and often not practical, especially when referring to large extensions. The introduction of hyperspectral sensors in agriculture is increasing the amount of information achievable by analysing the entire electromagnetic spectrum, beyond the visible light, both on large spatial and laboratory scale.
Estimates of pasture production (biomass and growth rate) based on Remote Sensing
Imagery is allowing for example to measure the foliage greenness from satellite
images. An example is the “Pastures from Space” program, developed in Australia by CSIRO Livestock Industries in collaboration with the Department of Agriculture
20 Chapter 1
______________________________________________________________________________________________________
of Western Australia and the Western Australian Land Information Authority (Landgate) that is allowing farmers to make decision regarding an efficient use of feed resources. This technology is based on the normalized difference vegetation index (NDVI), through which seasonal changes in leaf areas are quantified by analyzing the red and near-infrared (NIR) solar radiation reflectance through satellite image processing (see: http://www.pasturesfromspace.csiro.au/).
At laboratory level, vibrational spectroscopy represents a promising approach for the rapid prediction of a large variety of phenotypes, in replacement of more laborious “gold standard” tests (Egger-Danner et al., 2015). Rapid phenotype predictions are essential in both production and processing industry when payment are based on quality or when, frequent monitoring, accuracy and precision of measurements are fundamentals. The study of the absorbance of the matter in the region of the electromagnetic spectrum ranging between 4000 – 400 cm−1, called medium infrared (MIR) region, represents an appealing method to predict a large variety of traits (Boichard and Brochard, 2012). MIR-based predictors have been evaluated for the prediction of methane production (Dehareng et al., 2012), the estimation of energy intake and efficiency in lactating cows (McParland et al., 2014), the quantification of metabolites such as lactoferrin and major minerals (Soyeurt et al., 2009 and 2012) as possible indicator of udder status (for the mastitis prediction) in bovine milk. Moreover, the fatty acid composition of the milk was spectroscopically determined to find physiological indicator of fertility (Bastin et al., 2012) and adaptation to climate changes (De Rensis and Scaramuzzi, 2003). MIR spectroscopy has been also applied to predict the fine composition of milk, representing a valuable method to determine fatty acids (Soyeurt et al., 2006), also on a large scale (Soyeurt et al., 2011).
Among milk composition, novel traits generally defined as milk coagulation properties (MCPs) are currently investigated for their technological impact on cheese making process (Bittante et et al., 2012; Pazzola et al., 2014; Manca et al., 2016), but also regarding their correlations with milk quality and sanitary status of the mammary gland (Rovai et al., 2015). Rennet coagulation time (RCT), curd firmness at 30 min after rennet addition (a30), and curd-firming time (k20) are MCPs with undoubted importance in the cheese making process. These traits are commonly
21 Chapter 1
______________________________________________________________________________________________________
Antonio Francesco Puledda
“Use of genetic, genomic and phenomic approaches to improve livestock performances”
Tesi di dottorato in Scienze e Biotecnologie dei Sistemi Agrari e Forestali e delle Produzioni Alimentari Indirizzo Scienze e Tecnologie Zootecniche - Università degli Studi di Sassari
measured by using the Formagraph instrument (Foss Electric A/S, Hillerød, Denmark). The output of the analysis is an individual lactodinamographic path able to summarize simultaneously the three coagulation properties in one unique run per animal. Despite the informativeness of this analysis, the laboratory procedure still remains the limiting factor to the integration of these parameters in a large scale breeding programs. However, the collection of these phenotypes on a large sample of animals, jointly with the integration of their genomic information, could results in accurate prediction equations, that, once integrated in automated milking system (AMS), may lead to predict these new traits on large scale, drastically reducing the time and the costs of analysis (Cecchinato et al., 2009). After appropriate calibrations of instruments and standardization of the methods, these predicting equations may be finally extended across countries taking into account for genetic and environmental variability (De Marchi et al., 2014). With the project “Latte ovino della Sardegna” supported by the RAS, Regional Law n 7, August 2007 (Grant n. CRP 61608) and conducted in collaboration with different breeders farmer associations, MCPs from a representative sample of sheep of the Sarda breed has been genetically investigated to find correlation between milk and cheese yield, accounting for significant environmental factors (Puledda et al., 2016). The collection of reference measures on a large scale would be the first step in the process of the MCPs modelling for the Sarda breed. The next step will be the comparison of these measures with MIR spectra to obtain a powerful prediction equation suitable for integrating the in-line milk phenotyping system with no additional cost for milk laboratories, allowing the possibility to routinely introduce MCPs as selection criteria in the breeding program of the Sarda breed for the genetic improvement of the individual cheese making ability.
With the increase of the global demand for safe foods, quality-based payment systems have been developed to induce producers in enhancing the quality of their products. The evaluation of the quality, whose concept implies the satisfaction of standard criteria generally accepted by consumers, still represents a drawback, particularly when involving the destruction of the samples analyzed. Non-destructive methods for quality evaluation of products are for example the abovementioned infrared technologies adopted in the milk quality evaluation at laboratory level. The
22 Chapter 1
______________________________________________________________________________________________________
current trend is to move surveys directly in the production environment by integrating instruments directly into production lines. An example is the assessment of milk quality and udder health through automated milking system that shifted the level of the analysis from the bulk milk to the individual (daily) sampling.
Computer vision (CV) technologies jointly with pattern recognition techniques are
often used at industrial and farming level to find appearance features useful for the quality inspection of agricultural products in manner to allow consumer-oriented production choices. In this context size, shape, form and colour are important external factors contributing in describing the overall aspects of products and image analysis is a valuable, not-subjective and automatable instrument for their evaluation (Costa et al., 2011). An example is the use of the CSB-ImageMeater® (CSB-System International) for the on-line grading of pig carcasses on the basis of the visual determination of the lean meat percentage (LMP), in substitution of traditional invasive photodiode-equipped instruments based on light reflectance. The visual system has several advantages if compared with methods based on hand-held instruments. Being characterized by a contactless procedure and a higher degree of automation, it results more hygienic, allowing the (S)EUROP classification (European standard classification for meat percentage) of up to 1.500 carcass per hour. Due to the high speed of return of investments (ROI), great interest is addressed towards this new high throughput recording system. However, the initial cost of installation, around 200.000 Euros (Rossi, 2013; unpublished data), is the main factor that limits the diffusion of this system to slaughterhouses with the highest processing levels. Such an high throughput technology is able to increase the number of phenotypes sampled for pig analyzed, allowing the transition of the characterization of LMP, EUROP class and predicted weight from the level of the whole carcass to that of each single cut. The use of indexes accounting for the overall quality will provide a standardization of the given products. The increase of animal automatically processed per unit of time will results in faster and objective evaluation of the quality resulting in fairer payment for breeders. Current methods of payments (and those in development) are based on the use of grids in which the indicators of quality are economically quantified on the basis of criteria defined by local markets and in respect to local and global legislation. In Italy the system of
23 Chapter 1
______________________________________________________________________________________________________
Antonio Francesco Puledda
“Use of genetic, genomic and phenomic approaches to improve livestock performances”
Tesi di dottorato in Scienze e Biotecnologie dei Sistemi Agrari e Forestali e delle Produzioni Alimentari Indirizzo Scienze e Tecnologie Zootecniche - Università degli Studi di Sassari
quality evaluation is already based on the use the Fat-O-Meater (Carometec A/S, Herlev, Denmark) and the Hennessy Grading Probe (Hennessy Grading System Ltd., Auckland, New Zealand) but the interest is moving towards the automation of the quality assessment and the creation of a payment system able to account for the economical differences that each cut has in each own local market (Project “Pagamento dei suini a peso morto”, Centro Ricerche Produzioni Animali CRPA, Reggio Emilia - Italy, 2013).
A classical computer vision apparatus is generally composed by two parts, the first one including the hardware components, the second one regarding the software implementation, with the first evolving technologically faster than the second (Du and Sun, 2006). Hardware components are lighting, optical (high resolution digital cameras) and other mechanical devices that once integrated into the production chain are able to reproduce the human evaluation process in a coordinated manner through an artificial brain (the computer). The complex of rules needed to coordinate these devices and classify samples through the image analysis, represents the software part of the system. Image analysis is the process of producing quantitative information starting from the analysis of representation of whole objects or their regions of particular interest. It is divided in a low (acquisition and pre-processing), intermediate (segmentation and description) and high (recognition and interpretation using classifiers) levels of processing complexity. The result of these steps is the construction of a base knowledge among the object, the use of this knowledge to create rules and to use these rules to set an artificial decision making (Brosnan et al., 2004). Various algorithms have been proposed to emulate the human-thinking and the decision-making process and to obtain qualitative characterizations of products through computer vision. That is the field of the machine learning technology. The processes of machine learning is based on specific algorithm creating decisional rules from training samples and the application of these rules to make decision on unknown samples. Among these algorithms, artificial neural network (ANN), statistical learning (SL), fuzzy logic, decision tree and genetic algorithms are playing an important role on quality evaluation, sort and grading of food products such as meat, fish, pizza, cheese, and bread. Extensive reviews were done on many food products by Brosnan and Sun (2002), Brosnan et al. (2004), Du and Sun (2006) and,
24 Chapter 1
______________________________________________________________________________________________________
particularly for a shape-discrimination of fruits and vegetables by Costa et al. (2011). In animal production visual inspection has been successfully employed for the evaluation of tenderness, colour, marbling and textural features of the meat (Tan, 2004) for lean meat evaluation using tissue thickness on pig carcass sections (Engel et al., 2012) for the meat quality assessment in chickens (Barbin et al., 2016) for quality grading in fish processing (Misimi, 2007) but also to monitor the behaviour and welfare of animals (Banhazi et al., 2016) to detect phenotypic appearance of species and morphological trait from shape (Kühl et al., 2013). Recently, the study of biological shape variations has taken advantage from the development of geometric morphometrics methods (Monteiro et al., 2002). Traditionally based on the analysis of morphometric distances, angles and ratios (Marcus, 1990), geometric morphometric has progressively moved toward more modern methods (Rohlf and Marcus, 1993) based on the study of spatial coordinates of morphological points having biological meaning, called “landmarks”. These techniques are more often integrated in breeding programs for assessing the phenotypic variability of farmed animals through image analysis. An example will be given in the present thesis.
25 Chapter 1
______________________________________________________________________________________________________
Antonio Francesco Puledda
“Use of genetic, genomic and phenomic approaches to improve livestock performances”
Tesi di dottorato in Scienze e Biotecnologie dei Sistemi Agrari e Forestali e delle Produzioni Alimentari Indirizzo Scienze e Tecnologie Zootecniche - Università degli Studi di Sassari
Objectives of the Thesis
The thesis is structured in five main chapters and includes the outlines of four experimental contributions, two of those conducted at the Section of Animal Science of the Department of Agriculture of the University of Sassari and two at Ifremer, the French Research Institute for the Exploitation of the Sea.
The Chapter 2 contains results of the first large scale investigation on milk
coagulation properties (MCPs) measured on Sarda breed ewes whose results have
been recently published by an international peer reviewed journal. Covariance components were estimated for Rennet Coagulation Time (RCT), curd firming time (k20), curd firmness (a30) and individual laboratory cheese yield (ILCY) by fitting
both single and multiple-trait animal models. Objective of this work was to provide genetic parameters for coagulation traits as well as their relationship with milk production and composition traits as first step in their integration as potential selection criteria.
The Chapter 3 reports the second experimental contribution that deals with issues of reduction of high dimensional genotypic data aimed at estimating genomic prediction equation in cattle. With the advent of the microarray technology, the amount of molecular information obtainable per unit of time has increased dramatically in contrast to the decrease of the associated costs. With the increase of information available, a huge unbalancing between the number of records and the number of variables has been created. Tools able to reduce this unbalancing avoiding the loose of information are preferred. The objective of this work was to evaluate the effect of the genomic data reduction through the application of the Principal Component Analysis (PCA) on the accuracies of Direct Genomic Values (DGV) obtained under different conditions of marker density and repartition.
The Chapter 4 reports the third experimental contribution. This work was aimed at estimating the genetic parameters and genetic gains obtainable by using both traditional and innovative traits for the improvement of the fillet yield in European sea bass, one of the most important species for the Mediterranean aquaculture. Data derived from the Project BAR3D, whose activities were financed by France Agrimer (convention SIVAL NL: 2012-0302). Measurements were obtained from digital
26 Chapter 1
______________________________________________________________________________________________________
images and ultrasound echographies and were used to derive morphological predictors (indirect criteria) of processing yields, directly on live candidates. The objective of this work was to integrate these traits in a hypothetical selection scheme that, avoiding the sacrifice of candidates and the use of relatives under family selection, may be able to speed up their genetic gains. This work provides genetic parameters and the potential genetic gain for these traits under different breeding strategies.
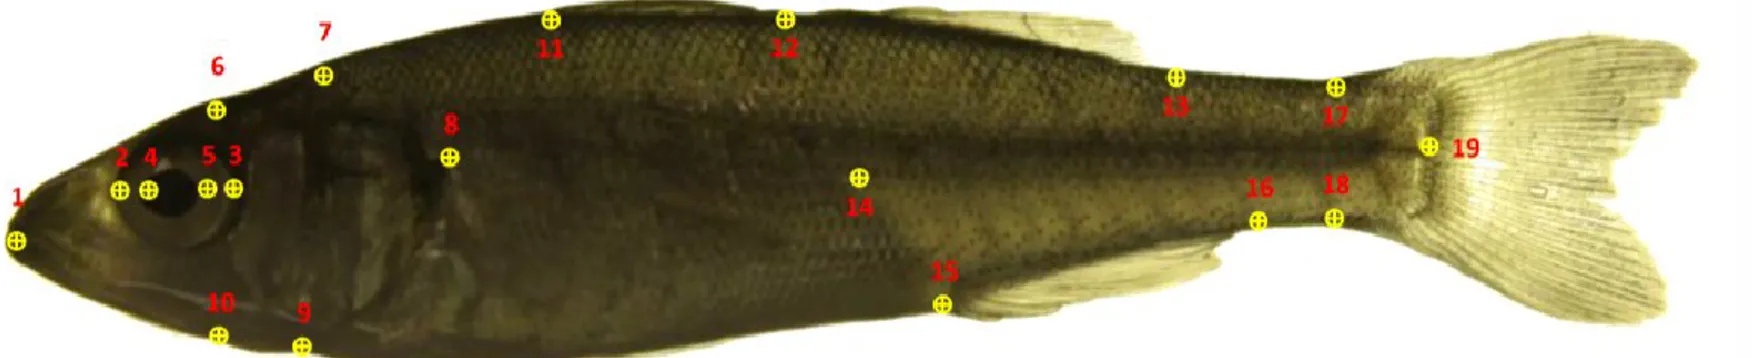
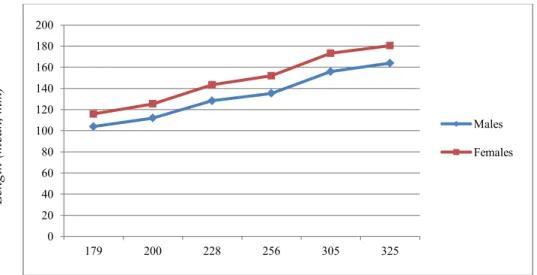
The Chapter 5 reports preliminary results obtained through image analysis of juveniles of European sea bass. The aim of this study was to evaluate the possibility to obtain an early sorting of fingerlings based on their sex. Gender determination is an open issue for this species, with great economic implications due to the differences in growth existing among sexes at the commercial size, with females on average 30% heavier than males. The method of evaluation tested was based on the use of several morphometric distances, called inter-landmark distances, obtained by connecting all landmarks manually positioned on fish pictures using Fiji software. The objective of this work was to obtain an early sexual sorting of juveniles in manner to obtain commercial populations with sex-ratios skewed toward the breeder’s interests.