RSCAS 2016/22
Robert Schuman Centre for Advanced Studies
Global Governance Programme-215
Ability Drain: Size, Impact, and Comparison with Brain
Drain under Alternative Immigration Policies
European University Institute
Robert Schuman Centre for Advanced Studies
Global Governance Programme
Ability Drain: Size, Impact, and Comparison with Brain Drain
under Alternative Immigration Policies
Maurice Schiff
This text may be downloaded only for personal research purposes. Additional reproduction for other purposes, whether in hard copies or electronically, requires the consent of the author(s), editor(s). If cited or quoted, reference should be made to the full name of the author(s), editor(s), the title, the working paper, or other series, the year and the publisher.
ISSN 1028-3625
© Maurice Schiff, 2016 Printed in Italy, April 2016 European University Institute Badia Fiesolana
I – 50014 San Domenico di Fiesole (FI) Italy
www.eui.eu/RSCAS/Publications/ www.eui.eu
Robert Schuman Centre for Advanced Studies
The Robert Schuman Centre for Advanced Studies (RSCAS), created in 1992 and directed by Professor Brigid Laffan, aims to develop inter-disciplinary and comparative research on the major issues facing the process of European integration, European societies and Europe’s place in 21st century global politics.
The Centre is home to a large post-doctoral programme and hosts major research programmes, projects and data sets, in addition to a range of working groups and ad hoc initiatives. The research agenda is organised around a set of core themes and is continuously evolving, reflecting the changing agenda of European integration, the expanding membership of the European Union, developments in Europe’s neighbourhood and the wider world.
Details of the research of the Centre can be found on: http://www.eui.eu/RSCAS/Research/
Research publications take the form of Working Papers, Policy Papers, and e-books. Most of these are also available on the RSCAS website:
http://www.eui.eu/RSCAS/Publications/
The EUI and the RSCAS are not responsible for the opinions expressed by the author(s).
The Global Governance Programme at the EUI
The Global Governance Programme is one of the flagship programmes of the Robert Schuman Centre for Advanced Studies at the European University Institute (EUI). It aims to: build a community of outstanding professors and scholars, produce high quality research and, engage with the world of practice through policy dialogue. At the Global Governance Programme, established and early career scholars research, write on and discuss, within and beyond academia, issues of global governance, focussing on four broad and interdisciplinary areas: European, Transnational and Global Governance; Global Economics; Europe in the World; and Cultural Pluralism.
The Programme also aims to contribute to the fostering of present and future generations of policy and decision makers through its unique executive training programme, the Academy of Global Governance, where theory and “real world” experience meet. At the Academy, executives, policy makers, diplomats, officials, private sector professionals and academics, have the opportunity to meet, share views and debate with leading academics, top-level officials, heads of international organisations and senior executives, on topical issues relating to governance.
Abstract
Immigrants or their children founded over 40% of the Fortune 500 US companies. This suggests that ‘ability drain’ is economically significant. While brain drain associated with migration also induces a brain gain, this cannot occur with ability drain. This paper examines migration’s impact on ability, education, and productive human capital or ‘skill’ (which includes both ability and education) for source country residents and migrants, under three different regimes: (i) a points system that accounts for educational attainment; (ii) a ‘vetting’ system that accounts for both ability and education or skill (e.g., the US H1-B visa program); and (iii) a points system that combines the points and vetting systems (as in Canada since 2015). It finds that migration reduces (raises) source country residents’ (migrants’) average ability and has an ambiguous (positive) impact on their average education and skill, with a net skill drain more likely than a net brain drain. These effects increase the more unequal is ability, i.e., the higher the variance in ability. The average ability drain for highly educated US immigrants from 42 developing source countries is 84 percent of the brain drain, a ratio that increases with source countries’ income and is greater than one for most Latin American and Caribbean countries. Heterogeneity in ability is the ultimate cause of both ability and brain drain (as they are equal to zero under homogeneous ability). Policy implications are provided.
Keywords
Migration, points system, vetting system, ability drain, brain drain. JEL Code: F22, J24, J61, O15
1
1. Introduction
*A large number of theoretical and empirical studies have examined the international migration of educated labor or brain drain, its determinants, its impact on human capital in migrants’ source and host countries, growth (Mountford 1997; Beine et al. 2001, 2008) and institutions (Docquier et al., 2011), as well as brain gain (e.g., Mountford 1997; Vidal 1998; Beine et al. 2004, 2008; Schiff 2006; Docquier et al. 2011) and brain waste (e.g., Ozden 2006, Mattoo et al. 2008). Surveys of brain drain issues include Commander et al. (2004) and Docquier and Rapoport (2012).
Migrants possess additional characteristics that may affect their migration and education decisions, an important one of which is their innate ability. The latter includes the ability to learn, communicate, cooperate, take risks, adapt, motivate people, work in groups, as well as attributes such as ambition, creative\\oty, intelligence, responsibility, leadership, work ethic, consideration of others’ viewpoints, and more. With developed countries’ higher return to ability, migrants tend to be positively selected for ability (Schiff 2006).
Given the difficulty in measuring ability, its economic significance has not been ascertained to date, though the fact that over 40 percent of the US Fortune 500 companies were founded either by immigrants or their children (Partnership for a New American Economy, 2011) suggests the “ability drain” may be important. One factor that may raise its impact relative to that of the brain drain is that the latter generates a brain gain while an ability drain does not. In fact, one of the model’s results is that the ability drain is larger than or equal to the brain drain, while a comparison based on existing analysis for 42 developing source countries suggests that it is equal to 84 percent of the brain drain, with greater brain and ability drains under the vetting than under the points system. 12
Despite the fact that the ability drain and its impact may be important, I have only found three studies that use a direct measure of ability to examine its relationship with migration. Miguel and Hamory (2009) find a higher rural-urban migration rate in Kenya for individuals with higher cognitive skills, i.e., those scoring higher on a primary school test.3 Kleven et al. (2010) show that the migration response to changes in host countries’ tax rates is greater for more successful football players in Europe. And Akgüҫ et al. (2015) find that risk taking and (positive) attitude towards it is substantially greater for Chinese rural-urban migrants than for non-migrants. The fact that more able individuals are more likely to migrate is incorporated in the model in Section 2.
Another study by Clemens, Montenegro and Pritchett (CMP, 2009) provides estimates of the impact of ability on migrants’ income (more on that in Section 6). Additional studies that do not use a direct measure of ability but infer some aspect of its relationship with migration are Özden (2006), Mattoo et al. (2008), and Piracha et al. (2015). The first two studies examine the success of highly educated migrants in the US in terms of the degree to which there is an education-occupation match or mismatch (with migrants overeducated for the job they hold). They find, among others, that migration distance has a positive impact on their degree of success. Given that the cost of the migration project
*
Thanks are due to François Bourguignon and Hillel Rapport for comments on early versions of the paper. 1
The points system – e.g., Canada’s pre-2015 immigration policy – accounts for prospective migrants’ education (and other attributes, such as age, fluency in English or French, etc.), while the vetting system – e.g., the US H1-B visa program (when properly run; see Section 7) – also accounts for their ability. New points systems – e.g., in Australia, New Zealand and Canada – consist of a combination of the two systems.
2
This paper deals with permanent economic migration, i.e., it does not examine return migration or issues related to refugees and asylum seekers.
3
Hanushek and Woessmann (2008, 2009) find that cognitive skills strongly impact individual income, its distribution and economic growth, while Heckman and Rubinstein (2001) and Heckman and Kautz (2012) provide analyses of cognitive and non-cognitive skills. None of these studies deal with migration.
Maurice Schiff
2
rises with the distance between the US and migrants’ home country, the expected return on that project must increase with distance to make migration worthwhile, i.e., migrants’ ability must increase with distance.
Piracha et al. (2012) similarly look at migrants’ education-occupation mismatch but they also include the mismatch that prevailed in the migrant’s country of origin. They find a strong relationship between worker-job mismatch in migrants’ country of origin and in Australia, concluding that the information associated with the mismatch in the country of origin constitutes an “ability signal” for potential employers in Australia.
Given the potential importance of the relationship between migration and ability, the paucity of studies on this issue is unfortunate. Moreover, except for CMP, which focuses on migrants with nine years of education, none of the studies examined the ability drain or its impact. This study contributes to this fledgling literature by providing a migration model that enables the analysis of its impact on individual ability and education in the source country, on the country’s ability drain, brain drain and brain gain and on migrants’ (or the host country’s) ability and brain gain, as well as by obtaining estimates of the relative size of 𝐴𝐷 and 𝐵𝐷 for migrants with college education or higher.
The paper is organized as follows. Section 2 presents the model and the closed economy case. Sections 3 and 4 examine the points and vetting systems, respectively, and compare them to each other and to the closed economy. Section 5 briefly looks at the new points system, while Section 6 provides a comparison of the size of the ability and brain drains. Section 7 presents policy implications and Section 9 concludes.
2. Model
Assume a source and a destination or host country, where productivity of source country individual 𝑖 depends on productive human capital or ‘skill’ 𝑠𝑖 ,4 which is assumed to be a function of innate ability, 𝑎𝑖, and education, ℎ𝑖, with average values 𝑆, 𝐴 and 𝐻, respectively, and variance 𝑉(𝑠𝑖), 𝑉(𝑎𝑖) and 𝑉(ℎ𝑖). Units of education are chosen such that ℎ𝑖 𝜖 [0, 1], where ℎ𝑖 = 1 represents 20 years of education.
Assume that individuals’ productive human capital or skill can be observed and valued properly by employers in both countries. This makes sense as employers obtain the benefit of good hiring decisions and bear the burden of bad ones, and are therefore likely to thoroughly vet prospective employees in order to assess their skill level.
Denote the country of origin (destination) by “0” (“d”), source country residents’ (migrants’) income by 𝑦0𝑖 (𝑦d𝑖), and the migration probability by 𝑝𝑖 𝜖 [0, 1]. Skill, income in both countries, and expected income 𝑦𝑖, are:
𝑠
𝑖= 𝑎
𝑖+ ℎ
𝑖, 𝑦
0𝑖= 𝛼
0𝑠
𝑖, 𝑦
d𝑖= 𝛼
d𝑠
𝑖, 𝛼
0𝜖 (0, 𝛼
d),
𝑦
𝑖= (1 − 𝑝
𝑖)𝑦
0𝑖+ 𝑝
𝑖𝑦
d𝑖= 𝑦
0𝑖+ (𝑦
d𝑖− 𝑦
0𝑖)𝑝
𝑖= [𝛼
0+ (𝛼
𝑑−𝛼
0)𝑝
𝑖]𝑠
𝑖.
(1)
Individuals are risk-neutral, i.e., utility, 𝑢𝑖, is a linear function of (expected) consumption, 𝑐𝑖. Assume for simplicity that 𝑢𝑖 = 𝑐𝑖. Note, however, that the analysis applies to any utility function 𝑣𝑖 that increases monotonically with 𝑐𝑖, as the same value of ℎ𝑖 maximizes both 𝑐𝑖 and 𝑣𝑖. In other words, the
4
Note that the terms “skill” and “skilled” in the labor economics and migration literature typically refers to education and excludes ability, while the definition used in this paper includes both.
Ability Drain: Size, Impact, and Comparison with Brain Drain under Alternative Immigration Policies
3 results hold for any 𝑣𝑖 = 𝑣(𝑐𝑖),𝜕𝑣𝜕𝑐𝑖
𝑖> 0, 𝜕2𝑣 𝑖 𝜕𝑐𝑖2 < 0, ∀ 𝑐𝑖 ≥ 0, e.g., 𝑣𝑖= 𝛽1+ 𝛾𝑐𝑖 𝜓 ; 𝛾, 𝜓 > 0, 𝜓 ≤ 1, 𝛽1≥ 0 and 𝑣𝑖 = 𝛽2+ log(𝑐𝑖) , 𝛽2≥ 0.
The cost of education ℎ𝑖 is ℎ𝑖2/2. Thus, (expected) consumption 𝑐𝑖 ≥ 0 is given by:
𝑢
𝑖= 𝑐
𝑖= 𝑦
𝑖−
ℎ𝑖22
= [𝛼
0+ (𝛼
𝑑−𝛼
0)𝑝
𝑖]𝑠
𝑖−
ℎ𝑖22
≥ 0.
5(2)
Individuals maximize expected utility, subject to their innate ability and the host country’s immigration policy, by selecting ℎ𝑖 at the start of the period under uncertainty about the subsequent realization of 𝑝𝑖. For comparison purposes, the migration rate 𝑃 (or number of migrants) is identical under the three policies examined, i.e., 𝑃𝑝= 𝑃𝑣= 𝑃𝑐 = 𝑃, where 𝑃 = ∫ 𝑝01 𝑖𝑓(𝑎𝑖)𝑑𝑎𝑖, with 𝑝(𝑣)(𝑐) denoting the points (vetting) (new vetting) system, and 𝑓(𝑎𝑖) denoting 𝑎𝑖’s probability density function. Pre-migration or gross average ability 𝐴𝐺= ∫ 𝑎01 𝑖𝑓(𝑎𝑖)𝑑𝑎𝑖 is the source country’s average ability before migration takes place. The migration probability rises with an individual’s education under the points system, and with both education and ability – or skill – under the vetting system.6 Interior solutions are assumed.
Importantly, note that the analysis provided in this paper is also relevant for any function 𝑣𝑖 that is monotonically increasing in 𝑐𝑖, as the same value of ℎ𝑖 maximizes both 𝑐𝑖 and 𝑣𝑖. In other words, the results hold for any vi= v(ci),∂v∂ci
i > 0, ∀ ci≥ 0. For instance, vi = γci
ψ
; γ, ψ > 0, ψ ≷ 1. A utility function could be represented by any function 𝑣𝑖 where 𝜕
2𝑣 𝑖 𝜕𝑐𝑖2 < 0, e.g., 𝑣𝑖 = log (𝑐𝑖) or 𝑣𝑖 = 𝛾𝑐𝑖 𝜓 , 𝜓 < 1. 2.1. Closed Economy
Before turning to the points and vetting systems, results are provided for the ‘closed economy’ immigration policy. In that case, the migration probability 𝑝𝑖 = 0. Denoting the variables in this case with subscript “0”, equation (2) becomes:
𝑐𝑖0= 𝑦𝑖0−ℎ𝑖0 2 2 = 𝛼0𝑠𝑖0− ℎ𝑖02 2 = 𝛼0(𝑎𝑖+ ℎ𝑖0) − ℎ𝑖02 2 ≥ 0. (3)
Maximizing 𝑐𝑖0 with respect to ℎ𝑖0, the values for ℎ𝑖0, its average 𝐻0, average ability 𝐴0, skill 𝑠𝑖0, average skill 𝑆0 and its variance 𝑉(𝑠𝑖0), consumption 𝑐𝑖0 and its average 𝐶0, are:
ℎ𝑖0= 𝐻0= 𝛼0, 𝐴0 = 𝐴𝐺, 𝑠 𝑖0= 𝑎𝑖+ 𝛼0, 𝑉(𝑠𝑖0) = 𝑉(𝑎𝑖), 𝑆0= 𝐴𝐺+ 𝛼0, 𝑐𝑖0= 𝛼0(𝛼0 2 + 𝑎𝑖), 𝐶0= 𝛼0( 𝛼0 2 + 𝐴 𝐺). (4) 5
Income is linear in ℎ𝑖, while education cost is quadratic in ℎ𝑖. Thus, investment in education exhibits diminishing returns, which is consistent with empirical findings.
6
Thus, average education and skill levels are higher for migrants than for residents, i.e., migrants are positively selected for both ability 𝑎𝑖 and education ℎ𝑖. As Docquier and Marfouk (2006) show for education, the share of the highly educated in South-North migrants is three times that among the South’s residents, and larger for poor, landlocked and island countries (e.g., the ratio is fifteen for Sub-Saharan Africa and larger for the Caribbean).
Maurice Schiff
4
3. Points System
Under the points system (e.g., Canada’s pre-2015 policy), applicants receive points for education but not for ability. The immigration probability 𝑝𝑖𝑝 is 𝜋ℎ𝑖𝑝, to which a constant, 𝜋𝐴𝐺, is added to ensure the average immigration probability or average migration rate is identical under the points and vetting systems, i.e., 𝑃𝑝= 𝑃𝑣= 𝑃, which is assumed for comparison purposes (as shown later).
The immigration probability and consumption in this case are: 𝑝𝑖𝑝= 𝜋(𝐴𝐺+ ℎ 𝑖𝑝), 𝑐𝑖𝑝= [𝛼0+ 𝜋(𝛼𝑑−𝛼0)(𝐴𝐺+ ℎ𝑖𝑝)](𝑎𝑖+ ℎ𝑖𝑝) − ℎ𝑖𝑝2 2 ≥ 0, 𝜋 > 0. (5) Defining 𝜙 ≡ 1 − 2𝜋(𝛼𝑑−𝛼0) and 𝜆 ≡ 𝜋(𝛼𝑑−𝛼0) 𝜙 , solutions for ℎ𝑖𝑝, 𝐻 𝐺, 𝑠
𝑖𝑝, 𝑆𝑝𝐺, 𝑝𝑖𝑝 and 𝑃𝑝 are given by: ℎ𝑖𝑝=𝛼0 𝜙 + 𝜆(𝑎𝑖+ 𝐴 𝐺), 𝐻𝐺 =𝛼0 𝜙 + 2𝜆𝐴 𝐺, 𝑠 𝑖𝑝=𝛼0 + 𝑎𝜙 𝑖 − 𝜆(𝑎𝑖− 𝐴𝐺)
,
𝑆𝑝𝐺 = 𝑆 𝑣𝐺 = 𝑆𝐺 = 𝐴𝐺+ 𝐻𝐺 =𝜙1(𝛼0+ 𝐴𝐺), 𝑝𝑖𝑝=𝜋
[𝛼0 + 𝐴𝐺 𝜙 + 𝜆(𝑎𝑖− 𝐴𝐺)],
𝑃𝑝= 𝜋 𝜙(𝛼0+ 𝐴𝐺) = 𝑃, (6)where 𝜙 > 0 is the second-order condition and 𝐻𝐺 denotes the average ‘gross’ education level, i.e., the education level that includes the brain gain generated by the points system but before migration takes place, i.e., excluding the brain drain.7
Note also that 𝑃𝑣= 𝑃𝑝= 𝑃 implies 𝐻𝑣𝐺 = 𝐻𝑝𝐺 = 𝐻𝐺 (as can be seen by comparing equation (6) with equation (11) in Section 4) and 𝑆𝑣𝐺= 𝑆𝑝𝐺 = 𝑆𝐺 = 𝐴𝐺+ 𝐻𝐺. And the brain gain (i.e., excluding the brain drain) is: 𝐻𝑝𝐺− 𝐻
0 = 2𝜆(𝐴𝐺+ 𝛼0). Since 1 𝜙 = 𝜙 + 2𝜋(𝛼𝑑−𝛼0) 𝜙
=
1 + 2𝜆,
we have 𝑉(𝑠𝑖𝑝) = 𝑉 [ 𝛼0 + 𝑎𝑖 𝜙 + 𝜆(𝐴𝐺− 𝑎𝑖)] = 𝑉 [( 1 𝜙− 𝜆) 𝑎𝑖] = 𝑉[(1 + 𝜆)𝑎𝑖] = (1 + 𝜆)2𝑉(𝑎𝑖) = (1 + 𝜆)2𝑉(𝑠𝑖0) > 𝑉(𝑠𝑖0). Thus, the points system raises the variance of individual skills or skill inequality, relative to the closed economy case. The greater skill inequality can also be seen from the derivatives 𝜕𝑠𝜕𝑎𝑖0
𝑖 = 1 and
𝜕𝑠𝑖𝑝
𝜕𝑎𝑖 = 1 + 𝜆.
The host country’s policy change from a closed economy to a points system raises the expected return on education, with an impact on residents’ education and skill ℎ𝑖𝑝− ℎ𝑖0 = 𝑠𝑖𝑝− 𝑠𝑖0= 𝜆(𝑎𝑖+ 𝐴𝐺+ 2𝛼
0) > 0. However, residents’ average skill need not increase because education increases with ability, which raises the migration probability. Thus, the migration rate is higher (lower) at higher (lower) ability and education levels, which reduces both average ability and average education.
Denote a variable 𝑥𝑖𝑝’s average value by 𝑋𝑝≡1−𝑃1 ∫ 𝑥01 𝑖𝑝(1 − 𝑝𝑖𝑝)𝑓(𝑎𝑖)𝑑𝑎𝑖 for source-country residents, by 𝑋𝑝𝑀 ≡ 1𝑃∫ 𝑥01 𝑖𝑝𝑝𝑖𝑝𝑓(𝑎𝑖)𝑑𝑎𝑖 for migrants, by 𝑋𝑝𝑁≡ (1 − 𝑃)𝑋𝑝+ 𝑃𝑋𝑝𝑀 for all natives, and by
𝑆
𝑝𝐺(𝑆
𝑝𝐺= 𝐴
𝐺+ 𝐻
𝑝𝐺) for the
gross (pre-migration) average skill.
Solutions for𝑋
𝑝,
𝑋
𝑝𝑀and
𝑋
𝑝𝑁(
𝑋 = 𝐴, 𝐻, 𝑆)
are:
7
A brain drain affects the average level of education under a heterogeneous migration probability but not under a homogeneous one.
Ability Drain: Size, Impact, and Comparison with Brain Drain under Alternative Immigration Policies 5
𝐴
𝑝= 𝐴
𝐺−
1−𝑃𝜋𝜆𝑉(𝑎
𝑖), 𝐴
𝑝𝑀 =𝐴
𝐺+
𝜋𝑃𝜆𝑉(𝑎
𝑖),
𝐴𝑝𝑁= 𝐴𝐺,𝐻
𝑝 =𝐻
𝐺−
𝜋𝜆 2 1−𝑃𝑉(𝑎
𝑖), 𝐻
𝑝 𝑀= 𝐻
𝐺+
𝜋𝜆2 𝑃𝑉(𝑎
𝑖),
𝐻𝑝𝑁=𝐻
𝐺,
𝑆
𝑝= 𝑆
𝐺−
𝜋(𝜆+𝜆 2) 1−𝑃𝑉(𝑎
𝑖), 𝑆
𝑝 𝑀=
𝑆
𝐺+
𝜋(𝜆+𝜆2) 𝑃𝑉(𝑎
𝑖),
𝑆𝑝𝑁 =𝑆
𝐺.
(7)As can be seen from (7), the brain drain is 𝜆 times the ability drain, the reason being that 𝑎𝑖 enters into ℎ𝑖 with coefficient 𝜆 (see equation 6). Since 𝜆 𝜖 (0, .5],8
it follows that the ability drain is larger than the brain drain. And from (6), 𝑉(ℎ𝑖𝑝) = 𝜆2𝑉(𝑎𝑖), i.e., the variance of 𝑎𝑖 is greater than that of ℎ𝑖𝑝 (see also Table 1 below).
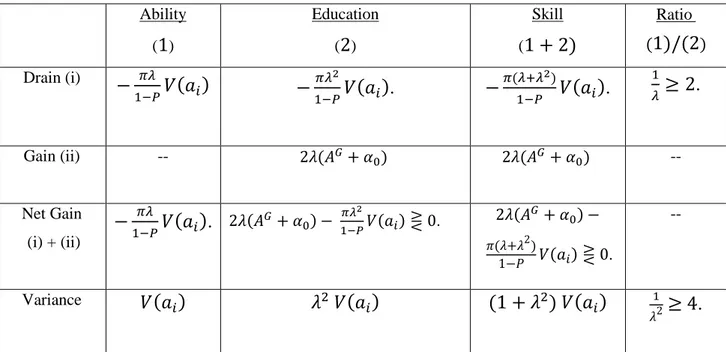
Another result from (7) is that residents’ (migrants’) average ability, education and skill levels fall (rise) with inequality in the source country’s ability distribution, as measured by the variance of 𝑎𝑖. Thus, the host country benefits from greater inequality in ability as it raises the average skill level of its immigrants. And, as shown above, the policy itself also raises inequality in migrants’ source country. Finally, the variance of 𝑎𝑖 does not affect natives’ average ability, education or skill as its impact on residents’ and migrants’ values cancel each other out. Table 1 presents the impact of the points system on the ability drain and on the brain and skill drain and gain, relative to the closed economy case.
What is the policy’s impact on ability, education and skill, relative to a closed economy policy (𝜋 = 0), i.e., ∆𝑋𝑝≡ 𝑋𝑝− 𝑋0 (𝑋 = 𝐴, 𝐻, 𝑆)? Since there is no ability gain, average ability declines, with: ∆𝐴𝑝≡ 𝐴𝑝− 𝐴𝐺 =
−
𝜋𝜆 1−𝑃𝑉(𝑎
𝑖) < 0
, ∆𝐻𝑝≡𝐻
𝑝−
𝐻0= 2𝜆(𝛼0+ 𝐴𝐺) − 𝜋𝜆2 1−𝑃𝑉(𝑎𝑖) ⋛ 0, ∆𝑆𝑝≡ 𝑆𝑝− 𝑆0= 2𝜆(𝛼0+ 𝐴𝐺) −𝜋(𝜆+𝜆2) 1−𝑃 𝑉(𝑎𝑖) ⋛0, ∆𝑆𝑝< ∆𝐻𝑝. 9 (8)Thus, the policy’s impact on ability (education and skill) is negative (ambiguous). Since ∆𝑆𝑝= ∆𝐻𝑝 + ∆𝐴𝑝= ∆𝐻𝑝−1−𝑃𝜋𝜆
𝑉
(𝑎
𝑖)<
∆𝐻𝑝, the policy’s impact on skill is more likely to be negative than that on education. Some studies (e.g., Beine et al. 2012) find that a net brain gain is more likely in larger source countries (∆𝐻𝑝> 0), in which case ∆𝑆𝑝< 0 < ∆𝐻𝑝 is a distinct possibility. They also find that most countries exhibit a net brain drain (∆𝐻𝑝< 0), implying a larger net skill drain, i.e., ∆𝑆𝑝< ∆𝐻𝑝< 0. On the other hand, the points system raises migrants’ ability, education and skill, with:∆𝐴
𝑝𝑀≡ 𝐴
𝑝 𝑀− 𝐴𝐺 = 𝜋𝜆 𝑃𝑉(𝑎
𝑖) > 0, ∆𝐻
𝑝 𝑀≡ 𝐻
𝑝𝑀 − 𝐻0 = 2𝜆(
𝛼0+ 𝐴𝐺)
+ 𝜋𝜆2 𝑃 𝑉(
𝑎𝑖)
> 0,
∆𝑆
𝑝𝑀≡ 𝑆
𝑝𝑀− 𝑆0= 2𝜆(𝛼0+ 𝐴𝐺) +𝜋(𝜆+𝜆 2) 𝑃 𝑉(𝑎𝑖) > 0. (9) 8i) Under migration, 𝜆 > 0. Proof: 𝜆 = 0 implies 𝜋 = 0 and thus 𝑝𝑖= 0; and ii) 𝜆 ≤12: Proof: Residents’ actual (as opposed to expected) consumption under the vetting system (which is obtained from solutions in Section 4 below) is 𝛼0(𝑎𝑖+𝛼20) − 2𝜆2(𝛼0+ 𝑎𝑖)2≥ 0, and thus 𝜆2≤ 𝜓 =𝛼0(2𝑎𝑖+𝛼0 ) 4(𝑎𝑖+𝛼0)2. Since 𝜕𝜓 𝜕𝑎𝑖= − 𝛼0𝑎𝑖 2(𝑎𝑖+𝛼0)3≤ 0 and 𝑎𝑖≥ 0, it follows
that 𝜓 reaches a maximum at 𝑎𝑖= 0 where 𝜕𝑎𝜕𝜓
𝑖= 0 and 𝜓 = 1 4. Thus, 𝜓 ≤ 1 4 and 𝜆2≤ 𝜓 ≤ 1 4 or 𝜆 ≤ 1 2 , QED. 9
Equation (8) results from the fact that 𝐻0= 𝛼0, 𝑆0= 𝐴𝐺+ 𝛼0 and 𝑆𝑝 = 𝐴𝐺+ 𝐻𝑝𝐺−𝜋(𝜆+𝜆
2)
Maurice Schiff
6
Results for source country’s natives as a whole (denoted by 𝑁) is: 𝐻𝑝𝑁− 𝐻0=
𝑆
𝑝𝑁−
𝑆0= 2𝜆(𝛼0+ 𝐴𝐺) > 0, 𝐴𝑝𝑁− 𝐴0 = 0. (10)
Table 1: Points System– Source Country’s Ability, Education and Skill: Gain or Drain? a Ability (
1
) Education (2
) Skill (1 + 2)
Ratio (1)/(2
) Drain (i)−
𝜋𝜆 1−𝑃𝑉(𝑎
𝑖)
−
𝜋𝜆2 1−𝑃𝑉(𝑎
𝑖).
−
𝜋(𝜆+𝜆2) 1−𝑃𝑉(𝑎
𝑖).
1 𝜆≥ 2.
Gain (ii) -- 2𝜆(𝐴𝐺+ 𝛼0) 2𝜆(𝐴𝐺+ 𝛼0) -- Net Gain (i) + (ii)−
1−𝑃𝜋𝜆𝑉(𝑎
𝑖).
2𝜆(𝐴𝐺+ 𝛼 0) − 𝜋𝜆 2 1−𝑃𝑉(𝑎𝑖) ⋛ 0. 2𝜆(𝐴 𝐺+ 𝛼 0) − 𝜋(𝜆+𝜆2) 1−𝑃 𝑉(𝑎𝑖) ⋛ 0. -- Variance𝑉(𝑎
𝑖)
𝜆
2𝑉(𝑎
𝑖)
(1 + 𝜆
2) 𝑉(𝑎
𝑖)
1 𝜆2≥ 4.
a: Results are relative to the closed economy case.
In other words, natives’ average education and skill levels are higher under the points system than under a closed economy, while their average ability is unchanged.10
4. Vetting System
I refer to an immigration policy that takes both ability and education into account as a “vetting system,” with variables designated by subscript ‘v’. One such system is the US H1-B visa program, where employers’ hiring decisions determine whether or not immigration takes place.11 Probability 𝑝
𝑖𝑣 and consumption under this policy 𝑐𝑖𝑣 are:
𝑝
𝑖𝑣= 𝜋(𝑎
𝑖+ ℎ
𝑖𝑣) = 𝜋𝑠
𝑖𝑣, 𝑐
𝑖𝑣= 𝑦
𝑖𝑣−
ℎ𝑖𝑣 2 2= 𝛼
0𝑠
𝑖𝑣+ 𝜋(𝛼
𝑑−𝛼
0)𝑠
𝑖𝑣 2−
ℎ𝑖𝑣2 2≥ 0 , 𝜋 > 0.
(11)
Maximizing 𝑐𝑖𝑣 with respect to ℎ𝑖𝑣, the solutions for ℎ𝑖𝑣, 𝑠𝑖𝑣, 𝑝𝑖𝑣, and ℎ𝑖𝑣− ℎ𝑖𝑝 are:
ℎ
𝑖𝑣=
𝛼𝜙0+ 2𝜆𝑎
𝑖, 𝑠
𝑖𝑣=
𝜙1(𝑎
𝑖+ 𝛼
0) =
𝑠𝜙𝑖0,
𝑝
𝑖𝑣=
𝜋𝜙(
𝑎
𝑖+ 𝛼
0)
=
𝜋𝑠𝑖0 𝜙,
ℎ
𝑖𝑣− ℎ
𝑖𝑝= 𝑠
𝑖𝑣− 𝑠
𝑖𝑝= 𝜆(𝑎
𝑖− 𝐴
𝐺) ⋛ 0 ⇔ 𝑎
𝑖⋛ 𝐴
𝐺.
(12)
10In a non-selective policy, migration probability for all is 𝑝𝑖= 𝑃. Then, average education (skill) for both residents and migrants is 𝐻𝐺 (𝑆𝐺) and there is no ability or brain drain.
11
Ability Drain: Size, Impact, and Comparison with Brain Drain under Alternative Immigration Policies
7
Thus, high- (low-) ability individuals attain a higher (lower) education level under the vetting than under the points system, resulting in greater education and skill inequality under the former. Also, since 𝜕ℎ𝜕𝑎𝑖𝑣
𝑖 = 2𝜆, it follows that
𝜕𝑦𝑖𝑣0
𝜕𝑎𝑖 = (1 + 2𝜆)𝛼0.
Since 1
𝜙= 1 + 2𝜆, we have 𝑠𝑖𝑣= (1 + 2𝜆)
𝑠
𝑖𝑜>𝑠
𝑖𝑜,
and𝑠
𝑖𝑣− 𝑠
𝑖𝑜= 2𝜆𝑠
𝑖𝑜> 0,
i.e., the vetting system results in an increase in residents’ individual skill relative to the no-migration case. From (10), we have: 𝑉(𝑠𝑖𝑣) =𝑉(𝑠𝑖𝑜)𝜙2 = (1 + 2𝜆)2𝑉(𝑠𝑖𝑜) > 𝑉(𝑠𝑖𝑜) = 𝑉(𝑎𝑖). Since 𝑉(𝑠𝑖𝑝) =
(1 + 𝜆)2𝑉(𝑠
𝑖𝑜), it follows that 𝑉(𝑠𝑖𝑣) =(1+2𝜆)
2
(1+𝜆)2 𝑉(𝑠𝑖𝑝) > 𝑉(𝑠𝑖𝑝). The fact that 𝜆 𝜖 [0,
1
2] implies that 𝑉(𝑠𝑖𝑣)
𝑉(𝑠𝑖𝑝) 𝜖 [1,
16
9]. Moreover, 𝑉(ℎ𝑖𝑣) = 4𝜆2= 4𝑉(ℎ𝑖𝑝). Thus, inequality of residents’ skill is greater under the vetting system than under the points system or the closed economy policy. Solutions for 𝐻𝑣𝐺 and 𝑃𝑣 are: 𝐻𝑣𝐺 = 𝛼0 𝜙 + 2𝜆𝐴 𝐺 = 𝛼 0+ 2𝜆(𝛼0+ 𝐴𝐺) = 𝐻𝑝𝐺 = 𝐻𝐺, 𝑃𝑣 =𝜋𝜙(𝛼0+ 𝐴𝐺) =𝜋𝑆𝜙0
=
𝑃𝑝= 𝑃.
(13)S
olutions for residents, migrants and natives’ average ability, education and skill, are:𝐴
𝑣= 𝐴
𝐺−
𝜋 𝜙(1−𝑃)𝑉(𝑎
𝑖), 𝐴
𝑣 𝑀= 𝐴
𝐺+
𝜋 𝜙𝑃𝑉(𝑎
𝑖),
𝐴𝑣𝑁 =𝐴
𝐺;
𝐻
𝑣 =𝐻
𝐺−
𝜙(1−𝑃)2𝜋𝜆𝑉(𝑎
𝑖), 𝐻
𝑣𝑀 =𝐻
𝐺 +2𝜋𝜆𝜙𝑃𝑉(𝑎
𝑖), 𝐻
𝑣𝑁= 𝐻
𝐺;
𝑆
𝑣= 𝑆
𝐺−
𝜙2(1−𝑃)𝜋 𝑉(
𝑎𝑖)
,𝑆
𝑣𝑀=
𝑆
𝐺+
𝜙𝜋2𝑃𝑉(
𝑎𝑖)
, 𝑆𝑣𝑁=𝑆
𝐺,
𝐴
𝑀𝑣− 𝐴
𝑣=
𝜙𝑃(1−𝑃)𝜋, 𝐻
𝑣𝑀− 𝐻
𝑣=
𝜙𝑃(1−𝑃)2𝜋𝜆, 𝑆
𝑣𝑀− 𝑆
𝑣=
𝜙2𝑃(1−𝑃)𝜋,
(14) where𝑆
𝐺= 𝐴
𝐺+
𝐻𝐺, and 𝜋 𝜙(1−𝑃)+
2𝜋𝜆 𝜙(1−𝑃)=
𝜋(1+2𝜆) 𝜙(1−𝑃)=
𝜋(1+2𝜆)2 1−𝑃 .The fact that 𝜆 ≤1
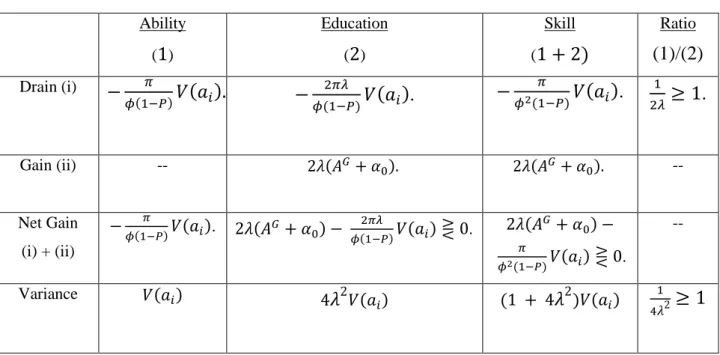
2 together with the results in (14) imply that the ability drain is larger than or equal to the brain drain, i.e., 𝜙(1−𝑃)𝜋 𝑉(𝑎𝑖) ≥ 𝜙(1−𝑃)2𝜋𝜆 𝑉(𝑎𝑖). The results are summarized in Table 2.
Though the points and vetting systems have the same qualitative impact relative to a closed economy policy, with residents (migrants’) average education, ability and skill levels falling (rising) with inequality in the ability distribution, migration’s impact under the vetting system is greater (in absolute value) than under the points system.
The ability drain (in absolute value) under the vetting system, 𝜙(1−𝑃)𝜋 𝑉(𝑎𝑖) =𝜋(1+2𝜆)1−𝑃 𝑉(𝑎𝑖),is greater than the ability drain, 1−𝑃𝜋𝜆 𝑉(𝑎𝑖), under the points system. Similarly, the brain drain under the vetting system, 𝜙(1−𝑃)2𝜋𝜆 𝑉(𝑎𝑖), is greater than the brain drain under the points system, 𝜋𝜆
2
1−𝑃. Hence, the skill drain under the vetting system, 𝜋(1+2𝜆)𝜙(1−𝑃)𝑉(𝑎𝑖) =𝜋(1+2𝜆)
2
Maurice Schiff
8 points system, 𝜋(𝜆+𝜆
2)
1−𝑃 𝑉
(
𝑎𝑖)
. And migrants’ education, ability and skill gains are greater under thevetting than under the points system.
Table 2: Vetting System – Non-migrants’ Ability, Brain and Skill: Net Gain or Drain? a Ability (
1
) Education (2
) Skill (1 + 2)
Ratio(1)/(2)
Drain (i)−
𝜋 𝜙(1−𝑃)𝑉(𝑎
𝑖).
−
2𝜋𝜆 𝜙(1−𝑃)𝑉(𝑎
𝑖).
−
𝜋 𝜙2(1−𝑃)𝑉(𝑎
𝑖).
1 2𝜆≥ 1.
Gain (ii) -- 2𝜆(𝐴𝐺+ 𝛼0). 2𝜆(𝐴𝐺+ 𝛼0). -- Net Gain (i) + (ii) −𝜙(1−𝑃)𝜋 𝑉(𝑎𝑖). 2𝜆(𝐴𝐺+ 𝛼0) − 2𝜋𝜆 𝜙(1−𝑃)𝑉(𝑎𝑖) ⋛ 0. 2𝜆(𝐴 𝐺+ 𝛼 0) − 𝜋 𝜙2(1−𝑃)𝑉(𝑎𝑖) ⋛ 0. -- Variance 𝑉(𝑎𝑖) 4𝜆
2𝑉(𝑎 𝑖) (1 + 4𝜆
2)𝑉(𝑎𝑖) 1 4𝜆2≥ 1
a: Results are relative to the closed economy case.
Comparing average levels of education, ability, and skill, for residents, migrants and all natives, under the vetting and point systems:
𝐻
𝑣= 𝐻
𝑝−
𝜋(2𝜆 + 3𝜆2) 1−𝑃𝑉(𝑎
𝑖), 𝐻
𝑣 𝑀= 𝐻
𝑝𝑀+
𝜋(2𝜆 + 3𝜆 2) 𝑃𝑉(𝑎
𝑖), 𝐻
𝑣𝑁= 𝐻
𝑝𝑁𝐴
𝑣= 𝐴
𝑝−
𝜋(1 + 𝜆)1−𝑃𝑉(𝑎
𝑖), 𝐴
𝑣𝑀= 𝐴
𝑝𝑀+
𝜋(1 + 𝜆)𝑃𝑉(𝑎
𝑖), 𝐴
𝑣𝑁= 𝐴
𝑝𝑁,
𝑆
𝑣= 𝑆
𝑝−
𝜋(1 + 3𝜆 + 3𝜆1−𝑃 2)𝑉(𝑎
𝑖), 𝑆
𝑣𝑀= 𝑆
𝑝𝑀+
𝜋(1 + 3𝜆 + 3𝜆 2) 𝑃𝑉(𝑎
𝑖), 𝑆
𝑣𝑁= 𝑆
𝑝𝑁.
(15)From (14), and from 𝐻0= 𝛼0 and 𝑆0 = 𝛼0+ 𝐴𝐺 (as shown in (4)), it follows that whether the vetting system results in a net brain and skill gain or drain is ambiguous, though net brain and skill drains are more likely under the vetting than under the points system, and the ability drain is greater under the former. Since 𝑃𝑝= 𝑃𝑣= 𝑃 by construction, it follows that natives as a whole have the same average ability, education and skill levels under the points and vetting systems.
The host country benefits from greater inequality in the source country’s ability under both the points and the vetting systems as it raises migrants’ average skill level, with a greater benefit under the vetting than under the points system. Moreover, the two policies themselves raise inequality, with a greater increase under the vetting system.
5. New Points System
In order to attract immigrants with skills that better reflect labor market needs, various host countries, including Australia, New Zealand and Canada, moved to a new points system consisting of a
Ability Drain: Size, Impact, and Comparison with Brain Drain under Alternative Immigration Policies
9
combination of the (old) points system and the vetting system. Assume the weights of the points and vetting systems in the new points system are 𝜔 and 1 − 𝜔, respectively, i.e., 𝑐𝑖𝑛= 𝜔𝑐𝑖𝑝+ (1 − 𝜔)𝑐𝑖𝑣. Solutions can be shown to be equal to the weighted average (with weights 𝜔 and 1 − 𝜔) of the results under the points and vetting systems.
6. Comparing Ability Drain and Brain Drain
This section examines the relationship between the ability drain, 𝐴𝐷, and the brain drain, 𝐵𝐷. Educated immigrants typically enter the US under the H1-B visa program, i.e., they must obtain a position in a US firm or other organization, and must have a Bachelor’s Degree or more in order to qualify. These immigrants are likely to be thoroughly vetted, in terms of both their education and their ability, as employers obtain the benefits of judicious hiring decisions and bear the cost of hiring mistakes. Thus, a vetting system policy is assumed in the analysis. The main results for the 42 source countries as a whole are presented in Section 6.1 and for country groupings in Section 6.2. Derivation of the results is provided in the Appendix.
6.1. Average for the 42 sample countries
Clemens, Montenegro and Pritchett (CMP, 2009) use data on 42 developing source countries to estimate the impact of migration on an individual’s income. They use several approaches to estimate a parameter, 𝜇, and capture the impact of selection on ability, 1 + 𝜇, on the ratio of an individual’s income in the US to that earned back home. They find that 𝜇 𝜖 (0, .5], which holds for 𝜆 as well (see footnote 8). Recall that ℎ𝑖𝑣 = 1 for 20 years of education. Given that 𝜇’s value obtained by CMP is for individuals with nine years of education (ℎ𝑖𝑣 = .45) and that the H1-B visa program requires at least a Bachelor’s degree or sixteen years of education (ℎ𝑖𝑣 = .8), the parameter 𝜇 is adjusted accordingly, and the ability drain and brain drain are obtained for the entire range of 𝜇 and 𝜆 values. An explanation of the derivation of the results is provided in the Appendix.
The main findings are: i) the average value of 𝐴𝐷/𝐵𝐷 is 0.841 on average (see below for results on country groupings); ii) 𝐴𝐷/𝐵𝐷 > 1 in close to 60 percent of the cases; iii)) 𝐴𝐷/𝐵𝐷 increases with both 𝜆 and 𝜇. Note that these figures are likely to constitute a lower bound of the actual 𝐴𝐷/𝐵𝐷 ratios as many who enter the US under the H1-B program have more than a college degree.
For instance, take the values for 𝜇 and 𝜆 of 0.1, 0.25 and 0.4, and 𝛼0= 0.15. The corresponding values for 𝐴𝐷/𝐵𝐷 are presented in Table 3. First, changes in 𝜆 have a limited impact on 𝐴𝐷/𝐵𝐷. As 𝜆 increased from . 1 to . 4, 𝐴𝐷/𝐵𝐷 increases by .110 or close to 12 percent (bottom row). On the other hand, changes in 𝜇 have a large impact, with 𝐴𝐷/𝐵𝐷 increasing by .565 or close to 88 percent (last column) as 𝜇 increases from . 1 to . 4. The largest (smallest) increase occurs when 𝜇 (𝜆) rises from .1 to .25. This is not surprising as the ratio 𝜕(𝐴𝐷/𝐵𝐷)𝜕𝜇 /𝜕(𝐴𝐷/𝐵𝐷)𝜕𝜆 (on average over
𝛼
0 values) is 17.1 for = 𝜇 = .1, or double the 8.6 level for 𝜆 = 𝜇 = .25 (and 45 percent higher than the level for 𝜆 = 𝜇 = .4).12Second, 𝐴𝐷 > 𝐵𝐷 for six of the nine values shown, namely those for which 𝜇 equals . 25 or . 4. Third, on average for the nine values shown, the ability drain is 97.9 percent of the brain drain.
12
The derivation of these results is available from the author upon request. The ratio of derivatives increases as 𝜆 = 𝜇 decline. For instance, the ratio is 37 for 𝜆 = 𝜇 = 0.01.
Maurice Schiff
10
Table 3: Ratio of Ability Drain to Brain Drain (𝑨𝑫/𝑩𝑫)
0.1 0.25 0.4
Average
0.1 .610 .622.696
.643
0.25 1.053 1.062 1.146 1.087 0.41.152
1.170 1.301 1.208Average
.938
.951 1.048 .9796.2. Comparing country groupings
The results above are average values for the 42 source countries examined, and country results differ dramatically.13 For instance, migrants’ income (corrected for selection on observables) relative to that of source country residents varies from about 2 in the Dominican Republic and Morocco to around 15 in Nigeria and Yemen. Each country can be classified into one of three categories, namely 𝐴𝐷/𝐵𝐷 > (=)(<) 1. I find that 𝐴𝐷 > 𝐵𝐷 for 17 countries, 𝐴𝐷 < 𝐵𝐷 for 17 countries, and 𝐴𝐷 = 𝐵𝐷 for 7 countries (where the latter comprises countries where . 95 ≤ 𝐴𝐷/𝐵𝐷 ≤ 1.05). Interestingly, the 𝐴𝐷 < 𝐵𝐷 (𝐴𝐷 = 𝐵𝐷) (𝐴𝐷 > 𝐵𝐷) category is comprised of 11 (30) (47) percent of high-income developing countries, 65 (56) (42) percent of upper middle-income countries and 24 (14) (11) percent of lower middle-income countries. Thus, the 𝐴𝐷 > 𝐵𝐷 category has four times (two thirds) (half) the number of high (upper-middle) (lower-middle) income developing countries relative to the 𝐴𝐷 < 𝐵𝐷 category (and it also includes 90 percent of the Latin American countries). These results suggest a positive relationship between source countries’ per capita income and the ratio 𝐴𝐷/𝐵𝐷. This result also obtains from the model, as the ratio 𝐴𝐷/𝐵𝐷 = 1/2𝜆 (see Table 2) and 𝜆 falls with 𝛼0.
Finally, irrespective of the level of the 𝐴𝐷/𝐵𝐷 ratio, it is important to keep in mind that:
1. As is shown in equations (6) and (12), education is endogenous and determined by ability, and 2. Ability’s heterogeneity is the ultimate cause of both the ability drain and the brain drain (since
they are equal to zero under homogeneous ability).
7. Policy implications
Studies of the brain drain have found that a number of countries, particularly the larger ones, experience a net brain gain (e.g., Beine et al. 2008). As migrants are also positively selected for ability, migration results in an ability drain. So, countries might exhibit a net brain gain together with a
13
The number of sample countries by region is: Sub-Sahara: 7, North Africa and the Middle East: 5, South Asia: 6, South-East Asia: 5, South America: 10, Mexico: 1, and Other Latin America: 8.
𝜆
𝜇
Ability Drain: Size, Impact, and Comparison with Brain Drain under Alternative Immigration Policies
11
net skill drain. The situation is obviously worse for countries experiencing a net brain drain – including most small poor island countries – as their average skill level falls due to both ability and brain drain.
As shown in equation (15) in Section 4, the vetting system, such as the US H1-B visa program, generates a larger ability drain and a larger net brain drain (or a smaller net brain gain) than the points system, thereby raising the likelihood of a net skill drain. As mentioned in Section 5, several immigration countries, including Australia, New Zealand and Canada, have reformed their immigration policy from the old to a new points system that includes elements of the vetting system, thus raising the urgency for source countries of devising (market-friendly) ways to minimize the skill drain as well as collaborate with host countries in order to raise both countries’ migration benefits, as suggested below.
Host countries concerned with source countries’ development could provide H1-B visas or other skilled immigrant visas whose extension or conversion to permanent status would require applicants to make some contribution to their home country, such as imparting their acquired knowledge to home country individuals – whether by working there for some period of time, regular visits, teaching via the internet, through some business relationship, or other. In addition to generating a direct benefit for migrants’ home country, such interaction would also raise bilateral trade (see Parsons and Winters’ (2014) excellent survey) and bilateral investment (Javorcik et al., 2009; Kugler and Rapoport, 2007) by reducing information and transactions costs, thereby benefiting both countries.
Similarly, foreign students from developing countries often receive financial support from some public or private agency back home (e.g., government agency, private employer, university) or in the host country (e.g., university, foundation). Source and host countries should cooperate to ensure that foreign students who obtain their degree and apply for an immigrant visa spend some time in the source country (which is the case for foreign students who enter the US with a J-visa) or engage in some other form of interaction. Interaction with home country institutions – e.g., cooperation with research institutions and scientists – is likely to be beneficial for both countries. Moreover, as Spilimbergo (2009) has shown, foreign students who return from studies in democratic countries have a positive impact on democratic institutions in their home country, an outcome that might also arise in the case of increased interaction between foreign graduates and their home country.
Agreements on expanding market access commitments for services provided by source countries to host countries, such as those delivered through the temporary cross-border movement of natural persons (also known as Mode IV, one of the four modes by which services are traded internationally), would benefit both sets of countries and would avoid some of the concerns related to the brain and ability drain associated with permanent migration. However, the North has so far restricted access to this mode of trading services.
As for the host country, it might benefit from enforcing existing regulations associated with immigration. For instance, under the US H1-B visa program, skilled immigrants can be hired for positions for which no Americans are available. However, as has been widely reported, a few large outsourcing firms have ‘captured’ a large share of the available visas, enabling some large corporations to replace US professionals with younger and cheaper immigrants.14 These tend to be less experienced than those who would have been hired by smaller enterprises that are truly looking for someone with unique skills and are unable to do so. In other words, the quality of H1-B immigrants is likely to be lower and their skills are likely to be closer substitutes to (less complementary with) those
14
A notable example is Southern California Edison, which replaced its IT employees with younger ones brought in through the H-1B program, with the original employees forced to train their replacements and sign nondisclosure agreements and gag orders. Salaries fell from $110,000 to $70,000 a year on average or by 36% (based on depositions in a Senate Judiciary Committee hearing spurred by complaints of the practice).
Maurice Schiff
12
of natives than if the visa program worked properly. Avoiding such an impact requires stricter enforcement of the rules of the H1-B visa program.
8. Conclusion
A large number of studies have examined the impact of migration on education in source and host countries (including selectivity, brain drain and brain gain, and other related issues) but have not done so in the case of ability. This paper is an attempt to start filling this gap. The analysis shows that: i) The points and vetting systems generate an ability drain in source countries that is greater than the
brain drain, with a smaller net change in average skill level than in average education level. Thus, countries that exhibit a net brain gain experience a net skill change that may be negative or, if positive, is smaller than the net brain gain. On the other hand, migrants experience an ability, brain and skill gain.
ii) The impact of these policies (in absolute value) on migrants’ and non-migrants’ average ability, education and skill, increases with inequality (as measured by the variance in ability), and the policies themselves also raise the variance of ability, education and skill. These effects are larger under the vetting than under the points system, with the effects of the new points system being equal to a weighted average of the other two.
iii) Data suggest that the ability drain is greater than the brain drain, with the difference between them increasing with source countries’ per capita income.
The paper’s findings suggest that the ability drain is likely to be important and thus that policy research and policymaking should focus not only on education but on ability as well, recognizing that migration is likely to result in an ability drain and in a productivity loss that must be weighted against the productivity change associated with the net brain gain or net brain drain.
Ability Drain: Size, Impact, and Comparison with Brain Drain under Alternative Immigration Policies
13
References
Akgüҫ, Mehtap, Xingfei Liu, Massimiliano Tani and Klaus F. Zimmermann. 2015. “Risk Attitudes and Migration.” IZA Discussion Paper No. 9347 (September)
Beine, Michel, Frédéric Docquier and Hillel Rapoport. 2001. “Brain drain and economic growth: theory and evidence.” Journal of Development Economics 64: 275-89
____, ____ and ____ . 2008. “Brain drain and human capital formation in developing countries: winners and losers,” Economic Journal 118: 631-652.
Borjas, George J. 1989. “Economic Theory and International Migration.” International Migration
Review 23 (3), Special Anniversary Issue. International Migration: An Assessment for the ’90s:
457-85 (Autumn).
Commander, Simon, M. Kangasniemi and L. Alan Winters. 2004. “The Brain Drain: Curse or Boon? A Survey of the Literature,” in R.E. Baldwin and L.A. Winters (eds.). Challenges to Globalization:
Analyzing the Economics, Chicago and London: University of Chicago Press.
Docquier, Frédéric, and Abdeslam Marfouk. 2006. “International Migration by Education Attainment, 1990–2000.” In Çaglar Özden and Maurice Schiff (eds.). International Migration, Remittances &
the Brain Drain, pp. 151–200. New York: Palgrave Macmillan; and Washington, D.C.: World
Bank.
Docquier, Frédéric, Elisabetta Lodigiani, Hillel Rapoport and Maurice Schiff. 2011. “Emigration and Democracy.” World Bank Policy Research Working Paper No. 5557, Washington, DC
Docquier, Frédéric and Hillel Rapoport. 2012. “Globalization, Brain Drain and Development,”
Journal of Economic Literature 50 (3): 681-730.
Hanushek, Eric A. and Ludger Woessmann. 2008. “The Role of Cognitive Skills in Economic Development.” Journal of Economic Literature 46 (3): 607– 668
_______ and ______. 2012. “Schooling, cognitive skills, and the Latin American growth puzzle.”
Journal of Development Economics 99 (2): 497–512 (November)
Heckman, James J. and T. Kautz. 2012. “Hard Evidence on Soft Skills.” Labour Economics 19 (4): 451-64.
______ and Yona Rubinstein. 2001. “The Importance of Noncognitive Skills: Lessons from the GED Testing Program.” American Economic Review 91 (2): 145-49.
Javorcik, B.S., Çaglar Özden, Mariana Spatareanu and Cristina Neagu. 2011. “Migrant networks and foreign direct investment.” Journal of Development Economics 94 (2): 231-241.
Kleven, Henrik, Camille Landais and Emmanuel Saez. 2010. “Taxation and International Migration of Superstars: Evidence from the European Football Market.” NBER Working Paper No. 16545 (November)
Kugler, Maurice and Hillel Rapoport. 2007. “International labor and capital flows: Complements or substitutes?” Economics Letters 94 (2), 155-162
Mattoo, Aaditya, Çaglar Özden and Cristina Neagu. 2008. “Brain waste? Educated immigrants in the US labor market.” Journal of Development Economics 87 (2): 255-69.
Mountford, 1997, “Can a brain drain be good for growth in the source economy?” Journal of
Development Economics, 53(2), 287-303
Özden, Çaglar. 2006. “Educated Migrants: Is There Brain Waste?” In C. Özden and M. Schiff (eds.), op. cit., pp. 227-44
Maurice Schiff
14
Parsons, Christopher and L. Alan Winters. 2014. “Migration, Trade and Aid: A Survey,” in Robert Lucas (ed.). International Handbook on Migration and Economic Development, Edward Elgar: Cheltenham.
Partnership for a New American Economy, 2011, “The “New American” Fortune 500” (June)
Piracha, Matloob, Massimiliano Tani and Florin Vadean. 2012. “Immigrant over- and under-education: the role of home country labor market experience.” IZA Journal of Migration 1: 3. Schiff, Maurice. 2006. “Brain Gain: Claims About its Size and Impact on Welfare and Growth Are
Greatly Exaggerated.” In C. Özden and M. Schiff (eds.), op. cit., pp. 201-25
Spilimbergo, Antonio. 2009. "Democracy and Foreign Education." American Economic Review 99(1): 528-43.
Vidal, J.-P. 1998. “The Effect of Emigration on Human Capital Formation.” Journal of Population
Ability Drain: Size, Impact, and Comparison with Brain Drain under Alternative Immigration Policies
15
Appendix
Clemens, Montenegro and Pritchett (CMP; 2009) use data on 42 developing source countries 𝑗 and examine various income ratios (denoted here by lower-case letters), where the denominator is the average income of source country 𝑗’s residents, 𝑌0 = 𝛼0𝑆 = 𝛼0(𝐴 + 𝐻), where 𝐴 is unobservable ability and 𝐻 is observable education.15 CMP’ objective is to obtain the average income ratio,
𝑦𝑑′′= 𝑌𝑑′′/𝑌0, of migrants living in the US who acquired their education in their home country 𝑗, relative to the income of home country 𝑗’s residents with the same level of 𝐴 and 𝐻. Thus, 𝑌𝑑′′/𝑌0= 𝛼𝑑(𝐴 + 𝐻)/𝛼0(𝐴 + 𝐻) = 𝛼𝑑/𝛼0. The problem with such comparisons is of course that migrants’ self-select on both ability and education, whose levels are denoted by 𝐴𝑀 and 𝐻𝑀, respectively.
CMP find that on average for the 42 source countries, migrants’ actual income ratio 𝑦𝑑 = 𝛼𝑑𝑆𝑀/𝛼
0𝑆 = 𝛼𝑑(𝐴𝑀+ 𝐻𝑀)/𝛼0(𝐴 + 𝐻) = 5.89, i.e., migrants’ income is 5.89 times source country residents’ income. They first correct 𝑦𝑑 for migrants’ self-selection with respect to observables 𝐻 in order to obtain 𝑦𝑑′ = 𝛼𝑑𝑆𝑀′/𝛼0𝑆 = 𝛼𝑑(𝐴𝑀+ 𝐻)/𝛼0(𝐴 + 𝐻) where, from equation (14), ∆𝐻 ≡ 𝐻𝑀− 𝐻 = 2𝜋𝜆
𝜙𝑃(1−𝑃)𝑉(𝑎𝑖) and, from equation (1), 𝑦𝑑− 𝑦𝑑 ′ = 𝛼
𝑑∆𝐻/𝑌0. They find that 𝑦𝑑′ = 4.11 = .7𝑦𝑑. In other words, 𝛼𝑑∆𝐻/𝑌0= .3𝑦𝑑. Thus, correcting for the impact of selection on observables reduces migrants’ income by 30 percent.
Next, CMP correct for differences in migrants and non-migrants’ ability, replacing 𝑦𝑑′ = 𝛼𝑑(AM+ H)/𝑌0 by 𝑦𝑑′′= 𝛼𝑑(𝐴 + 𝐻)/𝑌0= 𝛼𝑑/𝑆, where ∆𝐴 ≡ 𝐴𝑀− 𝐴 = 𝜙𝑃(1−𝑃)𝜋 𝑉(𝑎𝑖), and 𝑦𝑑′ − 𝑦𝑑′′= 𝛼𝑑∆𝐴/𝑌0.
Two conditions make it possible to assess the relative size of the ability drain, 𝐴𝐷, and the brain drain, 𝐵𝐷, from the relationship between 𝑌𝑑− 𝑌𝑑′ and 𝑌𝑑′− 𝑌𝑑′′: i) the relationship between 𝐴𝐷 and 𝐵𝐷 is identical to that between ∆𝐴 and ∆𝐻. From (14), ∆𝐴 ≡ 𝐴𝑀− 𝐴 = 𝜋
𝜙𝑃(1−𝑃)𝑉(𝑎𝑖) [= 2𝜋𝜆 𝜙(1−𝑃)𝑉(𝑎𝑖) + 2𝜋𝜆 𝜙𝑃 𝑉(𝑎𝑖)], where 𝐴𝐷 = 2𝜋𝜆 𝜙(1−𝑃)𝑉(𝑎𝑖) = 𝑃 ∗ ∆𝐴. 16 Similarly, 𝐵𝐷 = 𝑃 ∗ ∆𝐻. Thus, /𝐵𝐷 = ∆𝐴/∆𝐻; and ii) ∆𝐴 and ∆𝐻 are multiplied by the same parameter, 𝛼𝑑, so that 𝐴𝐷/𝐵𝐷 can be obtained from the relative income differences.
Parameter values are also subject to the restriction 𝑎𝑖 > 0, and 𝑦𝑑′′> 1 (as there is no incentive to migrate if 𝑦𝑑′′≤ 1). Since 𝑦
𝑑 = 5.89, correcting for selection on both observable education (as well as age and gender) and unobservable ability must be less than 4.89 of 5.89 or 83 percent of 5.89. Correction for difference in observables is 30 percent of 5.89, so that correction for difference in ability must be less than 53 percent or 1.767 times the correction for observables, i.e., 𝐴𝐷/𝐵𝐷 < 1.767.
CMP estimate the ability drain’s impact on (1 + 𝜇) in 𝑦𝑑′′= 𝑦
𝑑′/(1 + 𝜇) and find that 1 + 𝜇 𝜖 (1.0, 1.5]. Recall that 0 < 𝜆 ≤ .5. Thus, both 𝜇 𝜖 (0,5] and 𝜆 𝜖 (0,5].
Assume, for instance, that 𝜆 = .4 and 𝜇 = .3.From equation (12), we have ℎ𝑖 = 𝛼0
𝜙 + 2𝜆𝑎𝑖. Recall that 1
𝜙= 1 + 2 𝜆. With 𝜆 = .4, 1
𝜙= 1.8 and 2𝜆 = .8. Thus, (12) becomes ℎ𝑖 = 1.8𝛼0+. 8𝑎𝑖, or 𝑎𝑖 = 1.25ℎ𝑖− 2.25𝛼0. CMP compare migrants and non-migrants with nine years of education. Recalling that ℎ𝑖 = 1 represents 20 years of education, ℎ𝑖 for 9 years of education is equal to . 45, and thus 𝑎𝑖 = . 5625ℎ𝑖− 2.25𝛼0. Migrants who enter the US via the H1-B visa program must have a Bachelor’s
15
In fact, CMP account for education as well as age, gender and rural/urban location. 16
Note that migrants’ average ability ‘gain’ is 2𝜋𝜆𝜙𝑃𝑉(𝑎𝑖) = [(1 − 𝑃)/𝑃]*𝐴𝐷 and their average education ‘gain’ ∆𝐻𝑀 is (𝐻𝐺− 𝐻
Maurice Schiff
16
degree or a minimum of 16 years of education, i.e., ℎ𝑖 = .8 and 𝑎𝑖 = 1 − 2.25𝛼0. Thus, 1 + 𝜇 = 1.3 becomes 1 + 𝜇′ = 1 + 0.3 ( 1− 2.25𝛼0
.5625− 2.25𝛼0 ), i.e., 1 + 𝜇
′=.8625−2.925𝛼0
.5625− 2.25𝛼0. The restriction 𝑎𝑖 =
0.5625 − 2.25𝛼0> 0 implies 𝛼0< 0.25.
The value of 𝐴𝐷/𝐵𝐷 is provided for several values of 𝛼0. Its derivation is explained for 𝛼0 = .01. In that case, 1 + 𝜇′ =.83325
.54 and 𝑦𝑑 ′′= 1
1.54𝑦𝑑
′ = .648𝑦
𝑑′. The impact of ∆𝐻 is equal to . 3𝑦𝑑, i.e., 𝑦𝑑′ = 0.7𝑦𝑑, or 𝑦𝑑′′= .648 ∗ .7𝑦𝑑 = .454𝑦𝑑. Thus, the impact of selection on ability, ∆𝐴, is to reduce 𝑦𝑑′ by (1 − .648)𝑦
𝑑′ = .352𝑦𝑑′ = .352 ∗ .7𝑦𝑑= . 2462𝑦𝑑. Since the impact of ∆𝐻 is to reduce migrants’ income by . 3𝑦𝑑, we have ∆𝐴/∆𝐻 = .2462/.3 = .821 and, equivalently, 𝐴𝐷/𝐵𝐷 = .821. At 𝛼0= .05, 𝐴𝐷/𝐵𝐷 = .862. For 𝛼0= .1, 𝐴𝐷/𝐵𝐷 =.946. At 𝛼0= .15, 𝐴𝐷/𝐵𝐷 = 1.14, at 𝛼0= .2, 𝐴𝐷/𝐵𝐷 = 1.32, at 𝛼0= .22, 𝐴𝐷/𝐵𝐷 = 1.62, and at 𝛼0 = .23, 𝐴𝐷/𝐵𝐷 = 1.76. The ability drain is on average (over all 𝛼0-values) about 20 percent greater than the brain drain when 𝜆 = .4 and 𝜇 = .3. The overall average value of 𝐴𝐷/𝐵𝐷 = 0.841.
Ability Drain: Size, Impact, and Comparison with Brain Drain under Alternative Immigration Policies
17
Author contacts:
Maurice Schiff
Fellow, Institute for the Study of Labor (IZA), Bonn 3299 K St, NW, Apt 501
Washington, DC 2007 USA