A
Al
l
ma
m
a
M
Ma
at
t
er
e
r
S
St
tu
ud
di
i
or
o
r
um
u
m
–
–
U
Un
ni
iv
ve
er
rs
s
it
i
tà
à
di
d
i
Bo
B
ol
lo
og
gn
na
a
DOTTORATO DI RICERCA
Georisorse e Geotecnologie
Ciclo XX
Settore/i scientifico disciplinari di afferenza: ING-IND/30
IDROCARBURI E FLUIDI DEL SOTTOSUOLO
TITOLO TESI
EVALUATION OF ALKALI FLOODING COMBINED WITH
INTERMITTENT FLOW IN CARBONATE RESERVOIR
Presentata da:
Falan SRISURIYACHAI
Coordinatore Dottorato
Relatore
Prof. Paolo BERRY
Prof. Guido GOTTARDI
EVALUATION OF ALKALI FLOODING COMBINED WITH
INTERMITTENT FLOW IN CARBONATE RERSERVOIR
Mr. Falan Srisuriyachai
A Thesis Submitted is Partial Fulfillment of Requirements
for the Doctor of Philosophy in Georesources and Geotechnology
Department of Chemical, Mining and Environmental Engineering
(DICMA) Faculty of Engineering, University of Bologna
Academic Year 2007/2008
Thesis Title EVALUATION OF ALKALI FLOODING COMBINED WITH INTERMITTENT FLOW IN CARBONATE RESERVOIR
By Mr.Falan Srisuriyachai
Field of Study Petroleum Engineering
Thesis Adviser Professor Guido Gottardi
Thesis Co-adviser Villiam Bortolotti
Accepted by Department of Chemical, Mining, and Environmental Engineering (DICMA), University of Bologna in Partial Fulfillment of Requirements for the Doctor of Philosophy
……… Coordinator (Professor Paolo Berry)
……… Thesis Adviser (Professor Guido Gottardi)
……… Thesis Co-adviser (Villiam Bortolotti)
ABSTRACT
The majority of carbonate reservoir is oil-wet, which is an unfavorable condition for oil production. Generally, the total oil recovery after both primary and secondary recovery in an oil-wet reservoir is low. The amount of producible oil by enhanced oil recovery techniques is still large. Alkali substances are proven to be able to reverse rock wettability from oil-wet to water-wet, which is a favorable condition for oil production. However, the wettability reversal mechanism would require a non-economical aging period to reach the maximum reversal condition. An intermittent flow with the optimum pausing period is then combined with alkali flooding (combination technique) to increase the wettability reversal mechanism and as a consequence, oil recovery is improved.
The aims of this study are to evaluate the efficiency of the combination technique and to study the parameters that affect this method. In order to implement alkali flooding, reservoir rock and fluid properties were gathered, e.g. interfacial tension of fluids, rock wettability, etc. The flooding efficiency curves are obtained from core flooding and used as a major criterion for evaluation the performance of technique.
The combination technique improves oil recovery when the alkali concentration is lower than 1% wt. (where the wettability reversal mechanism is dominant). The soap plug (that appears when high alkali concentration is used) is absent in this combination as seen from no drop of production rate. Moreover, the use of low alkali concentration limits alkali loss. This combination probably improves oil recovery also in the fractured carbonate reservoirs in which oil is uneconomically produced.
The results from the current study indicate that the combination technique is an option that can improve the production of carbonate reservoirs. And a less quantity of alkali is consumed in the process.
iv
ACKNOWLEDGEMENTS
My first acknowledgements go to Professor Guido Gottardi and Villiam Bortolotti (my adviser and co-adviser) for the opportunity given to me to complete this doctorate program.
I would like to thank Celso Vescogni, Fausto Peddis, Barbara Ravaglia, and Mirko Gombia for all their technical advice and assistance. My thanks also go out to Miklós Kázmér from Eotvos University, Budapest, Hungary for his advice in rock analysis. My heartfelt appreciation goes to Chevron Phillips Chemical CO. LP., for the artificial oil sample sponsorship, without which my thesis could not have been completed.
Besides the technical support, my very special thanks go to Lorenzo Alessandrini and the Paoletti family for your moral support, the warmness given to me, and for being my second family.
I would like to give a million thanks to Pundaree Bunkerd (Fern), Tomislav Jonjic (Tommy), Sukanya Kerngfak (Yaya-Yui), Rassamin Pomsantia (Rassy), Stefano Biella (Stefino), and Massimo Grassilli (Massi) for sharing all the good moments and the sincere friendship given me during my stay in Bologna. My thanks also go out to Christopher Smith for his friendship and especially for his help with my English grammar.
Last but not least, to my dearest family: Boonsom (dad), Yuwadee (mom), Feaunglap (sister), and Lekkla (brother) Srisuriyachai for all the best things that you have all given and fulfilled for me, thank you so very much.
This thesis is dedicated to you all.
v
CONTENTS
Page ABSTRACT……….... AKNOWLEDGMENTS………..……. TABLE OF CONTENTS………. LIST OF TABLES………. LIST OF FIGURES………... NOMENCLATURE……….. CHAPTER 1. INTRODUCTION………. 2. WETTABILITY………2.1 Wettability of Reservoir Rock……….. 2.1.1 Sandstone Reservoir Rock……… 2.1.2 Carbonate Reservoir Rock……… 2.2 Wettability Reversal Mechanism in the Reservoir……… 2.2.1 Polar Interaction……… 2.2.2 Surface Precipitation………. 2.2.3 Acid/Base Interaction……….. 2.2.4 Ion Bonding………. 2.3 Parameter Affecting the Wettability Reversal in Carbonate
Reservoir……….. 2.3.1 Chemical Substances………... 2.3.2 Temperature……….. 2.3.3 Aging Time……….. 2.4 Effect of Core Handling in Wettability………. 2.4.1 Native-State Core………. 2.4.2 Cleaned Core……… 2.4.3 Restored-State Core……….. 2.5 Artificial Variation of Wettabiliy……….. 2.6 Mixed Wet and Fractional Wet Rock……… 2.6.1 Mixed Wettability………. 2.6.2 Fractional Wettabilit……… ……iii ……iv …….v …..xi …..xiii …..xvii …….1 …….4 ……4 …….4 …….5 …….7 …….7 ……7 …….8 …….9 ….10 …..10 …..11 …..12 …..12 …..12 …..13 …..14 …..15 …..17 …..18 …..18
vi
CONTENTS (continued)
CHAPTER
2.7 Wettability Measurement……….. 2.7.1 Quantitative or Direct Method………. 2.7.1.1 Contact Angle……….. 2.7.1.2 Amott Method………. 2.7.1.3 USBM Method………. 2.7.2 Qualitative of Indirect Method……… 2.7.2.1 Relative Permeability Curve……….. 2.7.2.2 Capillary Pressure Curve……….. 2.7.2.3 Flooding Performance Curve……… 2.8 The Effect of Wettability on Water Injection Process………
2.8.1 Uniformly Wetted System……… 2.8.1.1 Water-Wet System……… 2.8.1.2 Oil-Wet System……… 2.8.2 Non-Uniformly Wetted System….………. 2.8.2.1 Mixed-Wet System……….. 2.8.2.2 Fractional-Wet System……….
3. ENHANCED OIL RECOVERY, ALKALI FLOODING AND RELAVANT RESEARCH...
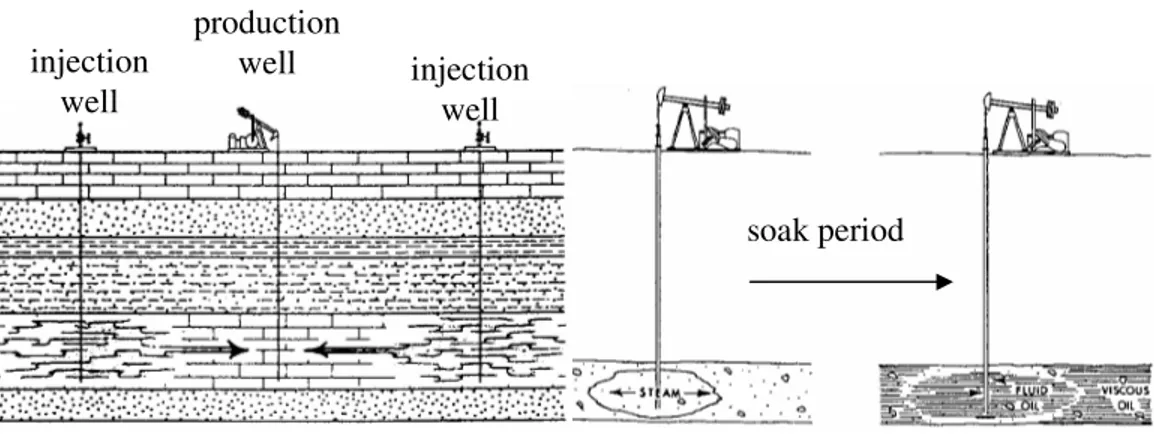
3.1 Introduction to EOR……… 3.1.1 Miscible Flooding……….. 3.1.1.1 Carbon Dioxide Flooding……… 3.1.2 Immiscible Flooding……….. 3.1.2.1 Surfactant Flooding……… 3.1.2.2 Polymer Flooding……… 3.1.2.3 Foam Flooding……… 3.1.3 Thermal Flooding……… 3.1.3.1 Steam Flooding……….. 3.1.3.2 Fire Flooding or In-Situ Combustion Technology…………. 3.1.4 Microbial Flooding………. 3.2 Alkali Flooding……….. Page …..19 ……20 ….20 …..21 …..22 …..24 …..24 ….26 …..28 …..30 …..31 …..31 …..31 …..32 …..32 …..32 ….34 …..34 …..34 …..36 …..37 …..37 …..40 …..44 …..46 …..46 …..48 …..50 …..51
vii
CONTENTS (continued)
CHAPTER 3.2.1 Introduction……….... 3.2.2 Theory………. 3.2.3 General Considerations……….. 3.2.3.1 Crude Oil Properties……… 3.2.3.2 Alkali Consumption……… 3.2.3.3 pH of Alkali Solution………. 3.2.3.4 Sodium Ion and Sodium Chloride……….. 3.2.3.5 Divalent Ions……….. 3.2.4 Reservoir Selection……… 3.2.4.1 Reservoir Oil……….. 3.2.4.2 Formation Water………. 3.2.4.3 Rock Mineralogy……… 3.2.4.4 Reservoir Character……… 3.2.5 Laboratory Test for Alkali Flooding……….. 3.3 Relevant Research………4. EXPERIMENTS……….
4.1 Rock and Fluid Properties……….. 4.1.1 Rock Properties……….. 4.1.1.1 Porosity and Density……….. 4.1.1.2 Absolute Permeability………. 4.1.2 Fluid Properties……….. 4.1.2.1 Oil Properties………. 4.1.2.1.1 Density and Viscosity………. 4.1.2.1.2 Acid Contents and Acid Number Modification………. 4.1.2.2 Brine Properties……….. 4.2 Interfacial Tension Measurement……… 4.2.1 Apparatus……… 4.2.2 Methodology……….. 4.2.2.1 The Effect of Alkali Concentration……… 4.2.2.2 The Effect of Surfactant Concentration………..
Page …..51 ……52 ….54 …..54 …..54 …..55 …..56 ….56 …..57 …..57 …..57 …..57 …..57 …..58 ……60 …..69 …..69 ….69 …..71 …..72 …..74 …..74 …..75 …..75 …..76 …..78 …..78 …..79 …..80 …..80
viii
CONTENTS (continued)
CHAPTER
4.2.2.3 The Effect of Surfactant and Alkali Concentration………… 4.2.2.4 The Effect of Salinity………. 4.3 Wettability Measurement……… 4.3.1 Apparatus……… 4.3.2 Methodology……… 4.4 Wettability Alteration Measurement……….. 4.5 Core Flooding………. 4.5.1 Apparatus……… 4.5.2 Methodology……….. 4.5.2.1 Continuous Waterflood and Brine Flood……… 4.5.2.2 The Effect of Alkali Concentration……… 4.5.2.3 The Effect of Alkalinity………. 4.5.2.4 The Effect of Acid Concentration……….. 4.5.2.5 The Effect of Presence of Initial Water Saturation…………. 4.5.2.6 Advanced Combination with Surfactant and Polymer……… 4.6 Alkali Consumption……… 4.6.1 Apparatus……… 4.6.2 Methodology……… 5. RESULTS AND DISCUSSION………..
5.1 Interfacial Tension Measurement………..
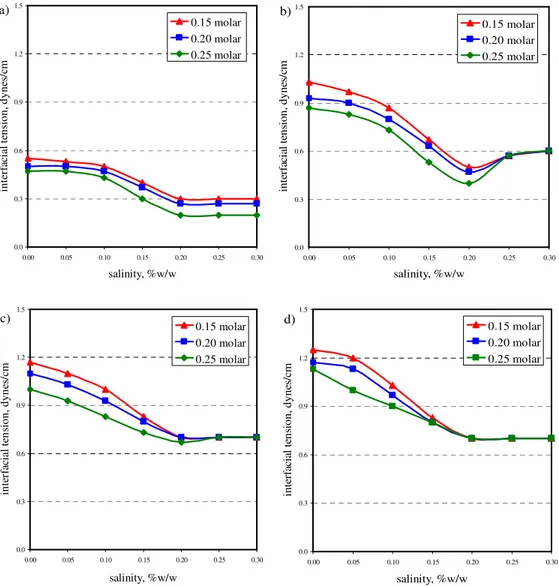
5.1.1 The Effect of Alkali Concentration on IFT………. 5.1.2 The Effect of Surfactant Concentration on IFT……….. 5.1.3 The Effect of Alkali-Surfactant Concentration on IFT………….. 5.1.4 The Effect of Salinity on IFT………. 5.1.5. Summary……… 5.2 Wettability Measurement……… 5.2.1 Control of Homogeneity of Wettability……….. 5.2.2 Amott-Harvey Wettability Index……… 5.2.3 Summary………. 5.3 Wettability Reversal Measurement……….
Page …..81 ……81 ….81 …..81 …..82 …..85 …..87 ….87 …..89 …..89 …..89 …..90 …..90 …..91 …..91 ….92 ….92 …..93 …..95 …..95 …..95 …..97 …..99 …102 …105 …105 …105 …108 …111 …111
ix
CONTENTS (continued)
CHAPTER
5.3.1 Continuous Flow………. 5.3.2 Intermittent Flow……… 5.3.3 Comparison between Continuous and Intermittent Flows………. 5.3.4 Summary………. 5.4 Core Flooding………. 5.4.1 Continuous Waterflood and Brine Flood………. 5.4.1.1 Summary………. 5.4.2 The Effect of Alkali Concentration………. 5.4.2.1 Comparison between Continuous and Intermittent Flows….. 5.4.2.2 Summary………. 5.4.3 The Effect of Alkalinity……….. 5.4.3.1 Comparison between Continuous and Intermittent Flows…. 5.4.3.2 Comparison between High and Low Alkalinity………. 5.4.3.3 Summary………. 5.4.4 The Effect of Acid Number……… 5.4.4.1 Comparison between Continuous and Intermittent Flows…. 5.4.4.2 Comparison between High and Low Acid Concentration….. 5.4.4.3 Summary………. 5.4.5 The Effect of the Presence of Initial Water Saturation………….. 5.4.5.1 Comparison between Continuous and Intermittent Flows…. 5.4.5.2 Summary………. 5.4.6 Advanced Combination with Surfactant and Polymer……… 5.4.6.1 Summary………. 5.5 Alkali Consumption……… 5.5.1 The Effect of Alkali Concentration……… 5.5.2 The Effect of Alkalinity……….. 5.5.3 The Effect of Acid Number………. 5.5.4 The Effect of the Presence of Initial Water Saturation………….. 5.5.5 Advanced Combination with Surfactant and Polymer……… 5.5.6 Summary………. Page …..112 …113 ….114 …..116 …..116 …..116 …..119 ….119 …..121 …..123 …..123 …..125 …..128 …..129 …..129 ….130 ….132 …..133 133 …..136 …..137 …..137 …..141 …142 …142 …134 …145 …146 …147 …148
x
CONTENTS (continued)
CHAPTER 6. CONCLUSION……… REFERENCE……… APPENDIXA Brief Microfacies Study of Lecce Limestone (Pietra Leccese)…………....
B Acid Number Determination by Color Titration……… C Calculation of Acid Number Modification………
VITAE……… Page …..149 …155 ….163 …..166 …..170 …..171
xi
LIST OF TABLES
TABLE
2.1 Craig’s rule of thumb for determining wettability...
4.1 Physical properties of Lecce stone... 4.2 Properties of Soltrol170 isoparaffin... 4.3 Composition of average sea brine……….. 4.4 Mass ratio of chemicals used for the brine preparation……… 4.5 Mass of chemicals for one liter of brine with the salinity of 35 ppt………. 4.6 Essential measurement for the wettability index for samples
starting with IWS and ROS conditions……….… 4.7 Summarize of wettability alteration experiment performed by centrifuge....
5.1 Wettability index of natural sample initially saturated with distilled
Water……….. 5.2 Wettability index of natural samples initially saturated with pure
soltrol170……… 5.3 Wettability index of samples initially saturated with oleic-soltrol170….. 5.4 Wettability index and ultimate relative oil recovery from every flooding.. 5.5 The properties of effluent collected after the breakthrough of sodium hydroxide slug………. 5.6 Oil recovery from sodium hydroxide flooding at different water-oil ratio. 5.7 The properties of effluent collected after the breakthrough of sodium hydrogen carbonate slug……… 5.8 Oil recovery from sodium hydrogen carbonate flooding at different water-oil ratio………. 5.9 The properties of effluent after the breakthrough of sodium hydroxide slug from flooding in samples saturated with 5.0 AN of oleic acid in soltrol170.. 5.10 Oil recovery from sodium hydroxide flooding in samples saturated with 5.0 acid number of oleic acid in soltrol170 at different water-oil ratio…….. 5.11 The properties of effluent collected after the breakthrough of
sodium hydroxide slug from flooding in samples with the presence of
initial water saturation of 0.5………..
Page …..26 ……71 ….74 …..76 …..77 …..77 ….83 …..86 …109 …110 …111 …115 …121 …123 …125 …127 …130 …132 …135
xii
LIST OF TABLES (continued)
TABLE
5.12 Oil recovery from sodium hydroxide flooding at different water-oil
ratio, flooded with samples with the presence initial water saturation of 0.5…… 5.13 The properties of effluent collected after the breakthrough of
injected chemical from advanced flooding………. 5.14 Oil recovery from advanced flooding at different water-oil ratio………. 5.15 Alkali consumption from sodium hydroxide flooding……….. 5.16 Alkali consumption from sodium hydrogen carbonate flooding………… 5.17 Comparison of alkali consumption between the use of sodium
hydroxide and sodium hydrogen carbonate……… 5.18 Alkali consumption from sodium hydroxide flooding in
samples saturated with 5.0 AN oil………... 5.19 Comparison of alkali consumption from sodium hydroxide flooding in samples saturated with 2.0 and 5.0 AN oil……….. 5.20 Alkali consumption from sodium hydroxide flooding in samples with the presence of initial water saturation of 0.5……… 5.21 Comparison of alkali consumption from sodium hydroxide flooding in samples with and without initial water saturation……….. 5.22 Comparison of alkali consumption from advanced flooding cases with solely alkali flooding………...
Page …137 …140 …141 …142 …142 …144 …145 …145 …146 …146 …147
xiii
LIST OF FIGURES
FIGURE
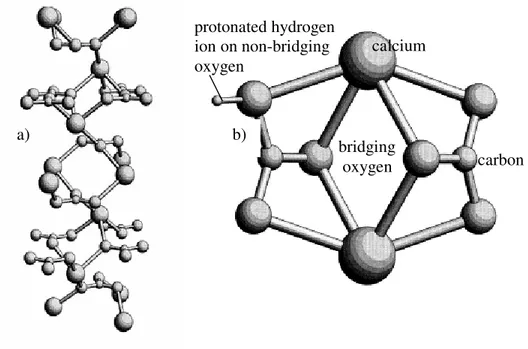
2.1 Three dimension structure of Silicon dioxide………. 2.2 a) lattice molecular of calcium carbonate and b) surface structure of calcium carbon………... 2.3 Four mechanisms of wettability alteration by crude oil: a) polar
components in crude oil, b) surface precipitation, c) acid/base interaction, and d) ion binding………... 2.4 Some frequent used organochlorosilane substances for artificial variation of sandstone surface: a) dichlorodimethylsilane, b) hexamethyldisilane, and c) triethylchlorosilane………. 2.5 The wettability alteration by organochlorosilane on sandstone surface: a) before reaction and b) after reaction……….. 2.6 The examples of naphthenic acid used in wettability reversal of
carbonate rock: a) cyclohexanecarboxylic, b) cyclohexanepropionic,
and c) cyclohexanebutyric……….. 2.7 The most commonly used amines in wettability alteration:
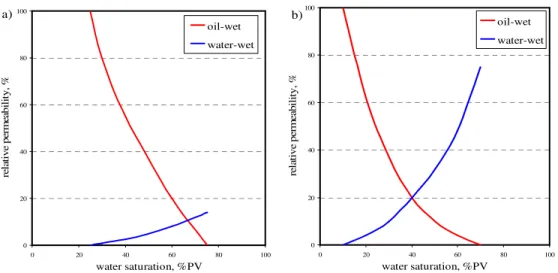
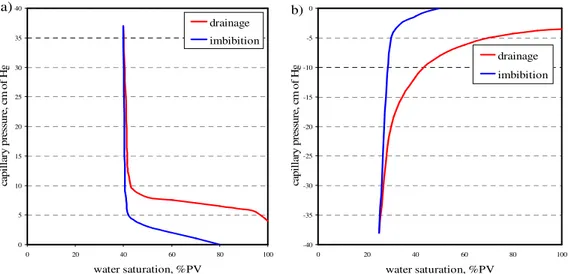
a) hexylamine and b)octylamine……… 2.8 Wettability of oil-water-solid system………..…… 2.9 Contact angle measurement by sessile method……… 2.10 Centrifugal capillary pressure curves for USBM wettability: a) water-wet, b) oil-water-wet, and c) neutral-wet………... 2.11 Typical relative permeability curves for: a) water- rock and
b) oil-wet rock………. 2.12 Capillary pressure curves for; a) water- wet rock and b) oil-wet rock….. 2.13 Capillary pressure curves of intermediate-wet rock………. 2.14 Water displacing oil from a water-wet pore during waterflood process… 2.15 Water displacing oil from an oil-wet pore during waterflood process….. 2.16 Waterflood performance curve of water- and oil-wet rocks………. 2.17 Typical water flood performance in water- and oil-wet rock……… 3.1 Pseudo-ternary phase diagram of hydrocarbon………
Page …….5 …….6 …..10 ….15 …..16 …..17 …..17 …..20 ….21 …..23 …..25 …..27 …..28 …..29 …..29 …..30 …..32 …..35
xiv
LIST OF FIGURES (continue)
FIGURE
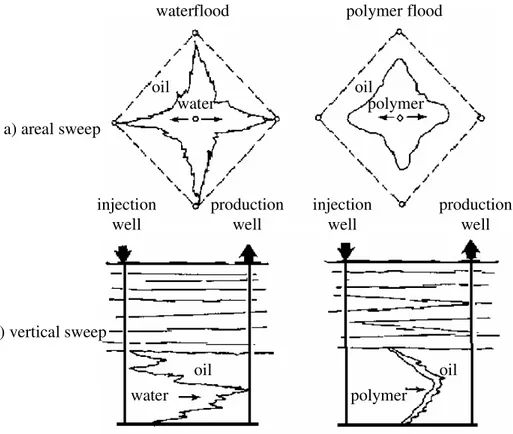
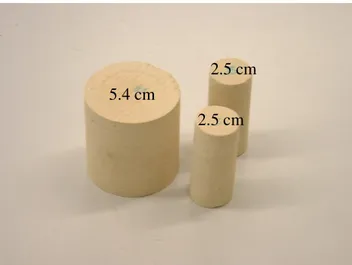
3.2 Swept zone at solvent breakthrough for a five-spot, showing a viscous fingering effect……… 3.3 Classification of surfactants……….... 3.4 Molecular structure of commonly used polymers: a) polyacrylamide and b) xanthan gum………... 3.5 The sweep efficiency by polymer flooding: a) areal and b) vertical……... 3.6 Comparison of flow effects between gas and foam flooding……….. 3.7 Steam flooding: a) continuous steam injection and b) cyclic steam injection or huff and puff………. 3.8 Flow regimes in forward combustion case……….. 3.9 Molecular structure of complex-wettability-induced material: a) carboxyphenol, b) porphyrin, and c) asphaltene………..…….. 4.1 Thin section of Lecce stone………. 4.2 Lecce stone in two different cut 5.4cm and 2.5cm diameter………... 4.3 Soxhlet reflux extraction set……… 4.4 Molecular structure of p-naphtholbenzein……… 4.5 Tensiometer and platinum-iridium ring……….. 4.6 Structural formula of represented chemicals: a) oleic acid and
b) dodecylbenzenesulfonic acid (sodium salt)………..………. 4.7: a) a centrifuge machine, b) sample bottles. and c) inside the centrifuge chamber……….. 4.8 MRI tomography………. 4.9 Compositions of Hoek triaxial core flood cell……….. 4.10 Schematic diagram of core flooding system……….……. 4.11 Color indicator titration set……… 4.12 Formulation of phenolphthalein and methyl orange……….
5.1 The effect of alkali concentration on IFT……… 5.2 Molecular structure of sodium oleate……….…….. 5.3 The effect of surfactant concentration on IFT……….
Page …..37 ……39 …..41 …..43 …..45 ….47 …..49 …..54 …..70 …..71 …..73 …..76 …..79 …..79 …..82 ….85 …..88 …..88 …..92 …..93 ….96 ….96 …..98
xv
LIST OF FIGURES (continue)
FIGURE
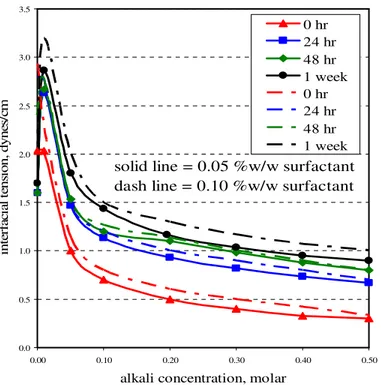
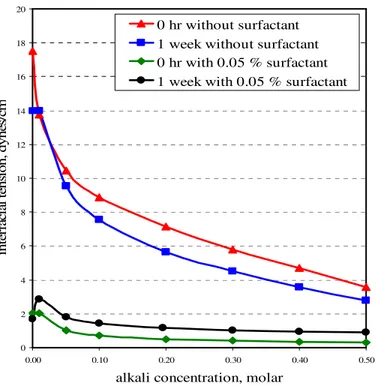
5.4 Microemulsion between oil and aqueous phases………. 5.5 The effect of alkali concentration on IFT in the presence of surfactant….. 5.6 Comparison between IFT obtained from alkali and surfactant-
alkali solutions………... 5.7 The effect of salinity to IFT at different time step: a) 0 hour,
b) 24 hours, c) 48 hours, and d) 1 week………. 5.8 The effect of salinity to IFT at different alkali concentration: a) 0.15
molar, b) 0.20 molar, and c) 0.25 molar……….. 5.9 T1-weighted images obtained from sample saturated with acid-
soltrol170 at: a) 1day, b) 2days, c) 3days, d) 4days, e) 5days, and f) 6days……. 5.10 T1 Maps for sample saturated with: a) pure soltrol170 and b) oleic acid
soltrol170 (with 5.0 AN)………. 5.11 Oil saturation of samples at different flooding time flooded
continuously: a) relative oil recovery and b) residual oil recovery……….. 5.12 Oil saturation of samples at different flooding time flooded
intermittently: a) relative oil recovery and b) residual oil recovery……… 5.13 Comparison of oil saturation of samples obtained from continuous and intermittent flows: a) relative oil recovery and b) residual oil recovery………….. 5.14 Relationship between ultimate relative oil recovery and wettability index……… 5.15 Waterflood performance curve from samples saturated with 2.0 AN of oleic acid in soltrol170………. 5.16 Flood results by the use of: a) distilled water, b) brine, and
c) soften brine……….. 5.17 Flooding performance by the use of sodium hydroxide in two different flows: a) continuous and b) intermittent……….. 5.18 Oil recovery at different water-oil ratio obtained from continuous- and intermittent-sodium hydroxide floods………. 5.19 Flooding performance by the use of sodium hydrogen carbonate in two different flows: a) continuous b) intermittent………
Page ….99 …..100 …101 …103 …104 …106 …107 …112 …113 …114 …116 …117 …118 …120 …121 …124 a) b)
xvi
LIST OF FIGURES (continue)
FIGURE
5.20 Oil recovery at different water-oil ratio obtained from continuous- and intermittent-sodium hydrogen carbonate floods………. 5.21 Comparison of oil recovery at different water-oil between sodium hydrogen carbonate and sodium hydroxide floods in two different flows: a) continuous and b) intermittent………... 5.22 Flooding performance by the use of sodium hydroxide in samples saturated with 5.0 acid number oleic acid in soltrol170 in two different flows: a) continuous and b) intermittent……….. 5.23 Oil recovery at different water-oil ratio obtained from continuous- and intermittent-sodium hydroxide flooding in samples saturated with 5.0 AN of oleic acid in soltrol170……….. 5.24 Comparison of oil recovery at different water-oil ratio between
flooding in samples saturated with 5.0 and 2.0 AN oil in two different flows: a) continuous and b) intermittent………..……….. 5.25 Flooding performance by the use of sodium hydroxide in samples with the presence of 0.5 initial water satiation in two different flows: a) continuous and b) intermittent……….. 5.26 Oil recovery at different water-oil ratio obtained from continuous- and intermittent-sodium hydroxide flooding in samples with the presence of 0.5 initial water saturation……… 5.27 Flooding performance in several advanced flooding: combination of alkali-surfactant-polymer………. 5.28 Oil recovery at different water-oil ratio obtained from several advanced flooding (the combination with of alkali-surfactant-polymer)………
Page ….126 …128 …130 …131 …132 …134 …136 …138 …140
xvii
NOMENCLATURE
A Crossectional area of core sample
A1 Area under oil-drive curve
A2 Area under water-drive curve
AN Acid Number
ASP Alkali-Surfactant-Polymer flooding
Bo Formation volume factor of oil
Ceff Alkali concentration if the effluent
Cint Initial alkali concentration
CMC Critical Micelle Concentration
Co,eq Concentration of fatty acid in the oil phase at equilibrium
Co,i Initial concentration of acid in oil phase
Cw,eq Concentration of fatty acid in the water phase at equilibrium
EH Redox Potential
EOR Enhanced Oil Recovery
I Amott wettability index
IFT Interfacial Tension
IWS Irreducible Water Saturation
k Absolute permeability
K Partition coefficient
Kb Base ionization time
kr Relative permeability
kro Relative permeability to oil
LPG Liquid Petroleum Gas
M Mobility of fluid
MEOR Microbial Enhanced Oil Recovery
ml Liquid mass
Mo Mobility of oil
Mr Relative mobility
MRI Magnetic Resonance Imaging
mt Total liquid mass
xviii
NMR Nuclear Magnetic Resonance
OOIP Original Oil in Place
p.z.c. Point of zero charge
PAC Polyacrylate Copolymer
PAM Polyacryleamide
pc Capillary pressure
pNW Pressure of non-wetting fluid
po Pressure of oil
ppm Part per million
ppt Part per thousand
psi Pound per square inch
PV Pore Volume
pw Pressure of water
pWET Pressure of wetting fluid
q Liquid flow rate
ROS Residual Oil Saturation
RPM Round per minute
SE Spin Echo
SR Saturation Recovery
T1 Longitudinal relaxation time
T2 Transverse relaxation time
Vl Liquid volume
Vo Volume of oil
Vosp Volume of oil displaced by spontaneous imbibition
Vot Total volume of oil displaced
Vt Total liquid volume
Vw Volume of water
Vwsp Volume of water displaced by spontaneous imbibition
Vwt Total volume of water displaced
W The USBM wettability index
w/w Weight by weight
WAG Water Alternated with Gas
xix
WOR Water-Oil Ration
ws Dry core weight
wsat Water-saturated core weight
XG Xanthan Gum
Greek
∆L Length of core sample
δo Displacement-by-oil ratio
∆p Pressure difference between inlet and outlet
δw Displacement-by-water ratio
θadv Water advancing contact angle
θc Contact angle at the oil-water-solid interface
θrec Water receding contact angle
µ Fluid viscosity
µl Dynamic viscosity of liquid
ρave Average liquid density
ρl Liquid density
ρo Oil density
ρs Relative core density
ρw Water density
σos Interfacial energy between oil and solid
σow Interfacial energy between oil and water
σws Interfacial energy between water and solid
υl Kinematic viscosity of liquid
CHAPTER 1
INTRODUCTION
In the oil filed production, oil is first produced by primary recovery by means of natural drive mechanisms. After a certain period of oil production, the natural drive decreases and large amount of oil is left inside the reservoir formation. Prolonging the production will not yield further economical results. Secondary recovery and Enhanced Oil Recovery (EOR) are then utilized to extend the production life of reservoir.
Secondary recovery or waterflood is simply performed by injecting water (mostly refers to sea brine) into an injection well. Oil is released from reservoir formation from waterflood pressure that overcomes the oil-entrapped capillary force. Mobilized oil then moves toward a production well. Some reservoirs may not respond to waterflood because of the unfavorable reservoir characteristics and conditions. The ultimate oil recovery after primary and secondary recovery can be less than 40% of the original oil in place (OOIP) in some reservoirs (Donaldson et al., 1985). EOR may then be chosen to improve oil recovery.
EOR, also called tertiary recovery, is the oil recovery by injecting the materials that are absent in the reservoir (Lake, 1989). It is not necessarily to perform an EOR after water flooding. An EOR method can be chosen after primary recovery in cases that waterflood is expected to give uneconomical results. Several conventional EOR methods are steam flooding, miscible flooding (e.g. carbon dioxide injection), and immiscible flooding (injection of polymer, surfactant, alkali, gel, and foam). Nowadays, each method has been modified to suit the requirements of specific reservoir conditions.
The wettability, one of the petrophisical properties, is defined as the tendency of one fluid to adhere onto solid surfaces in the presence of other immiscible fluids. Wettability directly affects the oil recovery by controlling the location, flow and distribution of fluids in the reservoir. In the oil-wet reservoirs, oil tends to spread onto the reservoir rock instead of being produced, causing generally low oil recovery. Anderson (1986) stated that 80% of carbonate reservoirs are naturally oil-wet and less
2
than half of oil in place can be produced by primary and secondary recovery. These reservoirs need an EOR method to improve oil recovery by reversing the rock wettability. Alkali substances have been proven to be an appropriate means to improve the oil recovery from oil-wet reservoirs by reversing the rock wettability to a more favorable condition and by reducing the Interfacial Tension (IFT) between fluid phases to an ultra-low level. The combination of alkali with surfactant and polymer gives the mixture of chemical that can increase and optimize oil production.
Generally, carbonate surface is positively charged at moderate pH condition. This facilitates the adsorption of negatively-charged carboxylic acids which are dissolved in oil phase, rendering the rock surface an oil-wet condition. Wettability reversal by adsorption–desorption mechanisms of adsorbed materials occurs slowly, requiring a long period to reach the wettability equilibrium (Craig, 1993). Likewise, Hirasaki et al. (2004) concluded that wettability reversal in the positively-charged calcite to negative is dependant from the aging time, temperature and chemical substances. Aging time allows the wettability reversal mechanism to reach a more favorable condition (less strongly oil-wet) in the presence of alkali substances.
Intermittent flow (Hyne, 1991), which is a non-continuous process consisting of an alternation between production and non-production periods, is combined with alkali flooding in this study, allowing the hydroxide ions to reverse the wettability of rock surface and to allow the interface to reach the wettability equilibrium. However, aging alkali in the reservoir formation unavoidably creates a drawback. It is well known that alkali substances react with divalent ions (calcium ion (Ca2+) and magnesium ion (Mg2+)) in the brine phase to form the water soluble compounds that do not affect oil recovery improvement. Moreover, the alkali consumption increases proportionally with time and temperature (Donaldson et al., 1985). This results in a loss of alkali without recovery improvement. Surprisingly, the wettability alteration function is predominant at alkali concentration lower than 1% w/w, whereas IFT reduction is oppositely predominant at higher concentration than 1 %w/w (Arihara et
al., 1999). Therefore, the alkali consumption can be limited by the use of low alkali concentration during the aging alkali injection.
3
The aims of this study are to evaluate the efficiency of the combination between alkali flooding and intermittent flow and to study the parameters that affect this combination exploited in carbonate reservoir. Limestone is chosen in this study because it does not cause non-deleterious problems from reaction between rock and alkali substance. The results are compared with continuous alkali flooding which is a conventional method. The subjects studied in this research are alkali concentration, type of alkali substance, acid number of oil, type of acid, and interstitial water saturation. Part of experiments is dedicated for Alkali-Surfactant-Polymer (ASP) flooding combined with intermittent flow, in order to improve the efficiency of the previous alkali flooding. The flooding performance curve is chosen as a major criterion for efficiency judgment. The wettability index related to ultimate oil recovery is taken in consideration. Dynamic alkali consumption is unavoidable and could reach a maximum loss for aging cases. However, dynamic alkali consumption is studied and included in this research.
CHAPTER 2
WETTABILITY
Wettability is defined as the tendency of a fluid to spread or adhere onto the solid surface in the presence of other immiscible fluids (Anderson, 1986). Wettability is considered as an important factor that controls the location, flow, and distribution of fluids in the reservoir. Therefore, wettability affects most of the petrophysical properties including capillary pressure, relative permeability, waterflood behavior, electrical properties, and simulated tertiary recovery.
Basically, wettability of solid surface can be classified in three types: water-wet, oil-water-wet, and neutral-wet. Water-wet describes a surface that prefers to adhere by water when there is a presence of oil phase, while oil-wet surface is opposite, tending to attach with oil in a presence of water. Neutral–wet (so called intermediate-wet) terms for a surface having either water-wet and oil-wet characters or a surface without wettability preference. Theoretically, some parameters are directly used to indicate the type of surface wettability such as contact angle and wettability index. Some petrophysical-related data can also indirectly indicate the wettability preference, for example, the relative permeability curve, capillary pressure curve, and flooding performance curve (Craig, 1993). Basic knowledge of wettability and wettability measurement are reviewed in this chapter.
2.1 Wettability of Reservoir Rock
In wettability literatures, sandstone and carbonate rocks are mostly studied. The wettability of both rocks is affected from the surface molecular property which is different in chemical, structural, and molecule orientation aspects.
2.1.1 Sandstone Reservoir Rock
Sandstone is a classic, sedimentary rock composed primarily of sand-sized particles. Chemically, the composition of sandstone is silicon dioxide (SiO2 or silica)
oriented in the crystalline form. One silica molecule is represented by a tetrahedral structure formed by one silicon atom at the center and surrounded by four atoms of
5 oxygen. These oxygen atoms are linked with other silicon atoms from adjacent molecules, resulting in a continuous network of structure. However, this continuous structure represents only for the bulk molecules. At the surface, the discontinuity is present; two oxygen atoms from each silica molecule are not bonded, yielding negative charges on the surface. Figure 2.1 depicts the structure of silica crystalline.
Initially, sandstone is a strongly water-wet since the rock is deposited in the aqueous environment. After that, oil migrated through the formation and is consecutively trapped. The connate water prevents the attachment of oil which causes the wettability reversal in sandstone. However, some authors have shown that sandstone rocks can be neutral or oil-wet.
The point of zero charge (p.z.c), the point at which the surface charge density changes from positive to negative or vice versa, corresponds to the pH of 2.5 for silica surface. At the pH above this value, silica surface is negatively charged. Decreasing pH (increasing of hydrogen ion (H+)) will reverse the surface charge by protonation of hydrogen ion on the surface-oxygen atoms.
Fig. 2.1: Three dimension structure of Silicon dioxide.
2.1.2 Carbonate Reservoir Rock
Carbonate rock is a potential reservoir rock composed primarily of calcium carbonate. Figure 2.2a shows the three dimensional structure of calcium carbonate which explains only bulk structure. Likely to sandstone, surface structure of carbonate rock is different from bulk structure. Oxygen atoms are the key to determine the
silicon
surface-oxygen
6 surface charge of carbonate rock. Mao and Siders (1997) used the Hartree-Fock model to describe surface structure and charge of calcium carbonate dimers. In the Hartree-Fock model, oxygen atoms can be categorized in two types: non-bridging oxygen atoms (bonding with one calcium atom) and bridging oxygen atoms (bonding with two calcium atoms). According to the stabilized structure, the non-bridging oxygen atoms represent the edge of the surface (or surface structure). The protonation of hydrogen ion occurs at the non-bridging oxygen atoms resulting in the positive charge at surface. The stabilized rotation of calcium carbonate dimers is shown in figure 2.2b.
In the environment with pH value lower than 9 which is the p.z.c for carbonate surface (Anderson, 1986), the protonation of hydrogen ion is predominant and carbonate surface charge remains positive. As the pH value increases (increasing of OH-), negative charges exceed in the solution and the protonated-hydrogen bonds are broken. This results in negatively-charged surface from the un-bonded oxygen atoms on carbonate surface.
Fig. 2.2: a) lattice molecular of calcium carbonate and b) surface structure of calcium carbon.
a) b) bridging oxygen carbon calcium protonated hydrogen ion on non-bridging oxygen
7 When carbonate surface is positively charged, carboxylic acids, the wettability reversal materials which are normally found in crude oil can be adsorbed onto carbonate surface by their negative site (hydroxide part). This results in the orientation of carboxylic molecule, exposing the non-polar part outward from rock skin and yielding a more oil-wet surface (Hamauda and Gomari., 2006). Evidentially, 80% of carbonate reservoirs are naturally oil-wet (Anderson, 1986).
2.2 Wettability Reversal Mechanism in the Reservoir
Initially, all petroleum reservoir rocks were believed to have a strongly water-wet condition. Sandstone reservoirs were deposited in an aqueous environment. Connate water would prevent sandstone surface from attaching with oil and other wettability material. The reversal of wettability from water-wet to oil-wet occurs during oil migration, oil trapping, and during production phases since the rock surface exposes to the reversal potential compounds and reaches the wettability equilibrium over a long aging period. Buckley et al. (1997) summarized the four wettability alteration mechanisms induced by crude oil: polar interaction, surface precipitation, acid/base interaction, and ion binding.
2.2.1 Polar Interaction
Polar interaction is a direct interaction between the charges from rock surface and the opposite charges of chemicals in crude oil. The interaction occurs when water film (brine film) between rock surface and oil phase is absent. In the moderate pH (pH around 7) environment, sandstone surface, which is negatively charged, interacts with the positively-charged compounds, while carbonate surface interacts with the negative ones. However, the polar compounds found in crude oil generally have a non-polar part which is normally a long chain of hydrocarbon. This un-interacted long chain of hydrocarbon exposes outward from rock surface, causing monolayer of the non-polar compounds and yielding the surface an oil-wet condition.
2.2.2 Surface Precipitation
Surface precipitation depends primarily from the solvent property of crude oil itself to asphaltene compounds which are considered as solutes. Asphaltenes are high
8 molecular weight compounds (around 500-1500) and composed mainly of carbon and hydrogen with lesser amounts of nitrogen, sulfur, and oxygen. The wettability alteration mechanism occurs when crude oil is a poor solvent for its asphaltenes. Consequently, asphaltenes cannot be properly dissolved and they then precipitate onto the reservoir rock. Asphaltene compounds reverses rock surface to oil-wet condition by exposing its non-polar part to stick with oil phase. Yan et al., (1997) induced an oil-wet condition with sandstone rock by the asphaltene precipitation and concluded that the reversal of wettability occurs significantly at low temperature. Moreover, the cation in brine phase promotes the asphaltene precipitation while anion has a relatively minor effect.
2.2.3 Acid/Base Interaction
In the presence of water phase (brine), acid or base compounds can be fully or partially ionized through water phase as same as atoms on the surface of sandstone and carbonate rocks. In sandstone case, the negative surface charges tend to interact with the positive charges from ionized base. In the opposite, the positive surface charges of carbonate rock interact with ionized acid. However, bonding between surface charges and ionized acid/base occurs through water film. In the stabilized water film case, a water-wet condition will be maintained. On the other hand, this water film collapses in the un-stabilized water film case, allowing acid or base to interact directly with the surface charges and hence, causing the wettability reversal to an oil-wet condition.
Madsen and Lind (1997) concluded that the chain length of acid molecules strongly affects the wettability reversal in both sandstone and carbonate rocks. The size of acid chain determines the solubility of the acid in water and oil phases. The value of solubility of acid is represented by the partition coefficient (Hamauda et al., 2006)
K = Co,eq / Cw,eq (2.1)
where Co,eq and Cw,eq are the concentration of fatty acids in the oil and water phases at
equilibrium. In the close system, if acid firstly dissolves in oil phase the concentration of acid in water at equilibrium can be determined from
9
Cw,eq = Co,i - Co,eq (2.2)
where Co,i is the initial concentration of acid in the oil phase.
The short-chain fatty acids are preferentially dissolved in water phase (high partition coefficient), while the long-chain acids with a non-polar part mostly remain in oil phase (low partition coefficient). Therefore, the short-chain fatty acids control the wettability reversal in sandstone since surface primarily contacts with water phase. Oppositely, the long-chain fatty acids control the wettability reversal of carbonate rock in cases that rock surface directly contacts with oil phase or the water film layer is unstable and collapsed.
2.2.4 Ion Binding
Ion binding plays a major roll in the wettability reversal of sandstone. The ions in this mechanism primarily refer to the most-found divalent ions in brine phase which are calcium and magnesium ions (Ca2+ and Mg2+). Divalent ions act as the linking bridge between the negative charges of sandstone surface and the negative charges of ionized acid from oil phase. The bridging occurs in water phase as same as the acid/base interaction. The presence of divalent ions does not potentially affect the wettability reversal in carbonate surface because of the repulsion between rock surface and divalent ions. Figure 2.3 summarizes the four mechanisms of wettability alteration by crude oil.
10
Fig. 2.3: Four mechanisms of wettability alteration by crude oil: a) polar components in crude oil, b) surface precipitation,
c) acid/base interaction, and d) ion binding.
2.3 Parameters Affecting the Wettability Reversal in Carbonate
Reservoir
2.3.1 Chemical Substances
The presence of proper chemical substances is very important for the wettability reversal condition. Naturally, carboxylic acid compounds reverse wettability from a water-wet to an oil-wet condition. This section describes the some chemicals that can reverse the induced oil-wet surface back to a water-wet condition. The induced oil-wet surface is caused by interaction between different surface charges of rock surface and adsorbed material. The chemicals having an ability to reverse the induced oil-wet back to a water-wet condition principally must have the ability to reverse the former surface charge to the opposite charge. Alkali substances, which provide strong negative charges, are well known as an injected material for the EOR process in order to reverse the positively-charged surface to a negative one. This
sandstone oil brine A _ _ + Ca + d) Sandstone Carbonate Oil BH brine A _ + + _ poor solvent good solvent a) b) c) acid base
11 results in the releasing of adsorbed molecules by repulsing the same negative charge of the inducing molecules and as a consequence, the rock returns to have a less oil-wet condition.
In brine phase, sulfate ion (SO42-) and magnesium ion (Mg2+) are found to
have an ability to reverse rock wettability from oil- to water-wet. Gomari et al. (2006) discovered that sulfate and magnesium ions displace the pre-adsorbed molecules from calcite surface, resulting in the change of zeta potential value from -0.67 mV to -2.06 and +3.62 for sulfate and magnesium ions respectively.
Surfactant can also reverse rock wettability. Cationic surfactants reverse the oil-wet calcite surface to a water-wet condition by removing the adsorbed molecules. Differently, nonionic and anionic surfactants do not remove the adsorbed molecules but instead, these surfactants co-adsorb onto carbonate surface. This co-adsorption is also known as “bilayer adsorption”: the hydrophobic part of a surfactant interacts with the hydrophobic part of an adsorbed molecule, leaving the hydrophilic part of a surfactant to stick into bulk solution and yielding a water-wet condition (Wu et al., 2006).
2.3.2 Temperature
Reservoir temperature indirectly affects the wettability of carbonate surface. Naturally, carboxylic acids which are the most commonly adsorbed materials can be degraded to alkenes in the presence of calcium carbonate that functions as a catalyst (Zhang and Austad., 2005). This decarboxylation mechanism increases with temperature. However, the rate of decarboxylation is extremely low and it normally occurs during geological period.
Hamouda and Gomari (2006) concluded that at an elevated temperature, the modified calcite surface by carboxylic acids is less oil-wet because the calcium ion (Ca2+) sites are reduced and hence, surfaces are less occupied by the adsorbed materials. Eventually, the surface becomes more water-wet.
12
2.3.3 Aging Time
Rock wettability requires a hundred or even thousands of hours of aging time to achieve the adsorption equilibrium. Similarly, the desorption of the adsorbed materials in the flow system could require a corresponding period of time (Craig, 1993). Carbonate reservoirs where 80 percents of them are neutral- to oil-wet (Seethepalli et al., 2004) yield an uneconomical oil recovery. Moreover, it is often reported that the fractured formations are usually observed in carbonate reservoirs, making the result from waterflood insignificant and ineffective. By the use of several chemicals that have an ability to reverse rock wettability from oil- to water-wet condition, the spontaneous imbibition can occur slowly (Hirasaki and Zhang,, 2004).
Therefore, carbonate surface which is normally positively charged, oil-wet surface, and uneconomical oil source can be reversed to negatively-charged water-wet surface by the use of proper chemical substances combined with an adequate aging period.
2.4 Effect of Core Handling on Wettability
Wettability of fresh cores can be unintentionally varied during the handling steps. Basically, core samples can be categorized in three groups according to surrounding conditions and petrophysical properties.
2.4.1 Native-State Core
Native-state core terms for the core with petrophysical properties as measured downhole at the reservoir conditions. Practically, it is difficult to preserve the properties of core from the disturbances after the cores are brought up to surface. It is noticed that during drilling phase, the use of oil-based-emulsion mud and other mud containing surfactants, caustics, mud thinners, organic corrosion inhibitors, and lignosulfonates can disturb the original reservoir wettability. In order to preserve the native-state wettability of core, these chemicals should be avoided during the drilling and coring phases. Some recommended fluids can be used during coring: 1) synthetic formation brine, 2) unoxidized lease crude oil, or 3) a water-based mud with a minimum of additives. Several researchers have attempted unsuccessfully to find a
13 suitable available based mud in order to obtain the native-state core. All of the oil-based drilling mud made water-wet cores more oil-wet.
Core packing and preservation are also considered as very important steps. Since core is brought up to surface, it must be protected from the wettability alteration caused by the loss of light ends and the oxidation of heavy ends. Some substances in crude oil can be rapidly oxidized with air to form the surfactants that can alter wettability. To prevent the wettability alteration, two core packaging procedures are recommended (Bobek et al., 1958). The first method is to wrap core at the well-site in polyethylene or polyvinylidene film and then wrapped again in aluminum foil. The wrapped core is then sealed with paraffin or a special sealer designed to exclude oxygen and to prevent the evaporation of light ends. The second method is to immerse core in the deoxygenated formation or the synthetic brine in glass-lined steel or a plastic tube, which is then sealed to prevent the entrance of oxygen. For the second method, core can also be stored in their wetting fluid, either formation brine or crude oil.
2.4.2 Cleaned Core
Core is usually cleaned in order to use in multiphase flow investigations. The first reason to clean core is to remove all liquids from core. So, true porosity, permeability, and fluid saturation can be measured. The second reason is to obtain a water-wet condition which is generally the first step to restore the wettability of contaminated core. One commonly used method to clean core is the reflux extraction (Dean-Stark or Soxhlet) with a solvent such as toluene. However, many researchers have found that the use of toluene alone in the reflux extraction is ineffective. Toluene is effective in removing hydrocarbons, asphaltenes, and some weakly polar compounds. In order to remove the strongly polar compounds, which are often responsible for the wettability alteration, the combination of toluene with methanol or ethanol yields the more effective result. In addition of toluene/methanol or toluene/ethanol, chloroform/acetone, and chloroform/methanol are also reported in many successful core cleaning cases. However, the best choice of refluxing solvents depends on crude components, mineral surface, and a presence of some contaminated surfactants from drilling mud.
14
2.4.3 Restored-State Core
According to the reversal of original wettability during the core handling steps, restoring core is an alternative choice to reproduce the wettability of the native state. Three simple steps to restore core are: 1) clean core by removing all compounds from rock surface (by reflux extraction), 2) flow the reservoir fluid into core, and 3) age core at the reservoir temperature for a sufficient time to establish the adsorption equilibrium. Core cleaning is considered as one of the most difficult step. In order to remove all compounds from the rock surface, it is important to use the proper solvents as described in the previous section. The second step is performed by flowing the deoxygenated synthetic or the formation brine through core and then core is flooded again with crude oil. The final step is to age core at the reservoir temperature. Generally, core should be aged at the reservoir temperature for more than 1,000 hours (40 days). Many researchers have demonstrated that rock surfaces require up to 1,000 hours to reach their adsorption equilibriums (Wendel et al., 1985).
Lorenz et al. (1974) and Cuiec (1977) found the method to speed up core to reach the adsorption equilibrium by saturating core solely in oil phase. By this way, polar compounds can have an interaction directly with the rock surface molecules without diffusing across the brine film and the wettability equilibrium can be reached in a few days. Likewise, Clementz (1982) showed that dry core saturation in oil phase created the formation of a very stable oil-wet condition.
Normally, core is more water-wet at the reservoir conditions than it is at room temperature and pressure. Changing temperature causes two effects to the core restoration. First, as temperature increases the adsorbed materials tend to have more solubility. This results in the desorption of the adsorbed materials, and as a consequence the surface is more water-wet compared with the lower temperature case. Second, the interfacial tension (IFT) decreases as temperature increases. Therefore, the wetting phase can be released from surface in a form of a small droplet or emulsion, rendering surface more water-wet. Pressure has less effect to wettability than temperature. However, some researchers noticed that at lower pressure or room pressure, the light ends in crude can evaporate. This changes the property of crude oil by increasing the concentration of heavy ends and hence, there is more chance to alter
15 the wettability of rock surface to an oil-wet condition by the precipitation of heavy ends.
2.5 Artificial Variation of Wettability
Experimentally, an oil-wet condition is required for several wettability reversal tests. After the core sample from the investigated reservoir is cleaned (after the cleaning step, wettability is theoretically a strongly water-wet), some chemicals can be used to prepare the artificial oil-wet condition. The artificial variation of wettability is normally performed with sandstone rocks which are originally water-wet. Organochlorosilanes are substances that are widely used to vary water- to an oil-wet condition. Some examples of organochlorosilanes are shown in figure 2.4.
Fig. 2.4: Some frequent used organochlorosilane substances for artificial variation of sandstone surface: a) dichlorodimethylsilane,
b) hexamethyldisilane, and c) triethylchlorosilane.
The sample preparation with organochlorosilane is simple. Organochlorosilane is dissolved in tetrahydrofuran and flowed through core sample. After that, sample is aged with a sufficient period to complete the reaction between organochlorosilane and surface molecules. Finally, sample is flushed by the un-reacted compounds to remove solvent (Anderson, 1986).
The reversal of wettability by organochlorosilane in sandstone samples is caused by the reaction of organochlorosilane molecule with hydroxide group attaching with silicon atoms at surface. Chlorine ion from organochlorosilane bides with hydrogen ion to form hydrochloric acid (HCl) which is suddenly dissolved in aqueous phase. Silicon atoms of rock surface are then bided with silicon atoms of organosilane via oxygen atoms. Consequently, the hydrophobic parts of organosilane molecules expose outward from the reacted surface, resulting in an oil-wet condition.
16 However, the wettability obtained from the use of organochlorosilane can be maximally reversed to a neutral-wet or a mildly oil-wet condition, instead of a strongly oil-wet. Figure 2.5 depicts the reaction between dichlorodimethylsilane and sandstone surface.
Fig. 2.5: The wettability alteration by organochlorosilane on sandstone surface: a) before reaction and b) after reaction.
For carbonate rocks, a direct adsorption by carboxylic acid onto rock surfaces is commonly used and noticed. Basically, carboxylic acid contains polar and polar part inside the same molecule. The size of the hydrocarbon part, which is non-polar, determines the solubility of that acid in any solvent. Short–chain hydrocarbon induces molecule itself to have a slight polarity and so, this acid can primarily dissolve in water which is a polar solvent. Oppositely, the structure of long-chain hydrocarbon obstructs the polarization of molecule. Therefore, the long-chain acids dissolve only in oil phase. Wu et al. (2006) modified calcite surfaces with several naphthenic acids dissolved in decane. Some examples of naphthenic acid used in the calcite modification are demonstrated in figure 2.6. Wu noticed that the reversal of calcite surface to an oil-wet condition does not depend on the quantity of the adsorbed acid molecules but strongly depends on the structure of acid; branched-molecule acids are more potential in the wettability reversal of calcite to an oil-wet condition more than straight-molecule acids.
Si Si Si Si Si Si Si Si Si Si OH OH OH OH OH O O O O O Si Si Si CH3 CH3 CH3 CH3 CH3 HCl HCl (CH3)2-SiCl2 (CH3)2-SiCl2 (CH3)2-SiCl2 a) b)
17
Fig. 2.6: The examples of naphthenic acid used in wettability reversal of carbonate rock: a) cyclohexanecarboxylic, b) cyclohexanepropionic, and c) cyclohexanebutyric.
Amine compounds (R-NH2) are also used in the wettability alteration of
sandstone rock samples. The pH-sensitive characteristic of amines leads to the switching of wettability by changing pH value of solvent. In the alkali pH (pH from 7 to 14), amine groups are adsorbed onto rock surfaces, exposing hydrocarbon chain to make surfaces oil-wet. On the other hand, amines rapidly desorb from surfaces and form the water-soluble salt in the acidic environment (pH below 7), leaving rock surfaces more water-wet. The most commonly used amines in the wettability alteration are hexylamine and octylamine which are shown in figure 2.7.
Fig. 2.7: The most commonly used amines in wettability alteration: a) hexylamine and b) octylamine.
2.6 Mixed Wet and Fractional Wet Rock
The terms water-wet, oil-wet and neutral-wet (intermediate-wet or no preference of wettability) generally refer to the rock with the same wettability for all massive portion (homogeneous rock). On the other hand, heterogeneous rock can have both water- and oil-wet together. This leads to the other two additional terms for wettability condition: mixed and fractional wettability.
a) b) c)
18
2.6.1 Mixed Wettability
Salathiel (1973) termed “a mixed-wet rock” as the rock contains oil-wet surfaces which form the continuously paths through larger pores, while smaller pores remain water-wet and contain no oil. A mixed-wet condition can be naturally generated during oil migration to an original water-wet reservoir. Oil displaces water in larger pores according to the adequate capillary pressure. Small pores remain water-wet because oil does not have enough pressure to displace water. A mixed-wet rock requires the extra condition; the formation oil has to contain the organic material that can reverse rock wettability. However, the thin layer of water or brine phase prevents the attachment of oil and organic materials onto rock surfaces. Therefore, a mixed wettability needs also a sufficient aging period to allow the wettability reversal material to diffuse through the brine layer, to rupture the brine layer, and to reach the wettability equilibrium after adhering onto rock surfaces.
Experimentally, a mixed-wet rock can be prepared. After the cleaned rock sample is saturated with formation brine, it is then flooded with the oil containing the wettability reversal materials such as carboxylic acids. The flooded oil enters core and flows through the high permeability channels; therefore, the use of heterogeneous rock samples foresees high possibility to obtain a mixed-wet condition. Finally, rock sample is aged at the reservoir temperature for a sufficient period to allow the completion of the wettability alteration to an oil-wet condition.
2.6.2 Fractional Wettability
Generally, rock is composed of many minerals with different surface chemistry and adsorption properties. This leads to the variation of wettability. Fractional wettability can be also called heterogeneous, spotted or dalmation wettability (Brown and Fatt., 1956). In a fractional-wet rock, the wettability reversal materials are adsorbed in a certain area of rock. So, a certain area of rock is strongly oil-wet, while the rest remains water-wet.
Fractional-wet sample can be artificially prepared in laboratory. Sand grains, which are naturally water-wet, are treated with several wettability reversal chemicals
19 such as organochlorosilane or Drifilm to render them oil-wet. A certain ratio of untreated and treated sand grains are then mixed together and finally packed.
2.7 Wettability Measurement
In the presence of oil, water, and solid phases, the ideal definition of wettability is derived from Young’s equation (Adamson, 1982)
σos – σws = σow cosθc (2.3)
In this equation, σos is interfacial energy between oil and solid (dynes/cm), σws
is interfacial energy between water and solid (dynes/cm), σow is interfacial tension
between oil and water (dynes/cm), and θc is angle at the oil-water-solid interface
measured through the water (degree).
The contact angle (θc), obtained from the equation above, represents the
wettability of an oil-water-solid system. The value of contact angle varies from zero to 180 degrees. The contact angles measured through water (water-advancing contact angle) less than 90 degrees indicates a preferentially water-wet condition, whereas the contact angle greater than 90 degrees indicates a preferentially oil-wet condition. The contact angle close to zero and 180 degrees are considered as a “strongly water-wet” and a “strongly oil-wet” respectively. The contact angle close to 90 grades covers the range termed an “intermediate wettability” (Craig, 1993). Figure 2.8 illustrated contact angle in an oil-water-solid system.
Several wettability measurements have been reviewed in the wettability literatures. Three quantitative methods are widely used in the petrophisical field: contact angle, Amott method, and U.S. Bureau of mines (USBM) method. The qualitative methods can also be used to distinguish the wettability preferential such as relative permeability curves, capillary curves, and water flooding performance curves.
20
Fig. 2.8: Wettability of oil-water-solid system.
2.7.1 Quantitative or Direct Methods
2.7.1.1 Contact angle
Contact angle measurement is a direct method to measure the specific pure solid surface (uncontaminated sample) in a pure liquid. The measurement called
“sessile drop method” (Anderson, 1986) is performed in the contact angle cell containing two flats polished crystal of the mineral that is predominant in rock surfaces (quartz and calcite are used to represent sandstone and carbonate rock respectively). The mineral plates are immersed in the formation water. A drop of formation oil is then placed between two crystal plates which are then moved in the opposite direction, allowing water to form an advance contact angle onto the crystal plates. Before measuring contact angle, the oil drop on crystal surface is aged for a few days, allowing the system to reach equilibrium. In several literatures, contact angles refer to “water advancing” (θadv) which are measured by pulling the periphery
of a drop over a surface, while the term “water receding” (θrec) is the measurement
by pulling it back. Figure 2.9 shows the contact angle measurement. water rock surface θc σws σos σow oil water-wet oil-wet θc θc
21
Fig. 2.9: Contact angle measurement by sessile method.
It is confirmed by a number of investigators that contact angles increase with time. An adequate aging period allows the wettability alteration to reach the equilibrium, allowing the adsorbed materials to interact with rock surfaces. The wettability equilibrium generally requires hundreds or even thousands of hours of aging time (Brown and Fatt, 1956).
2.7.1.2 Amott Method
This method is principally based on the fact that the wetting fluid imbibes spontaneously into core, displacing the non-wetting phase. The value is represented by wettability index (I) which is the ratio of spontaneous imbibition to the forced imbibition. The Amott method is started by saturating core sample with the formation oil and centrifuging in the formation brine until the Residual Oil Saturation (ROS) is reached. The measurement can be performed by these following four steps.
• Immerse core sample in the formation oil and measure the volume of brine displaced by spontaneous imbibition of the formation oil after 20 hours.
• Centrifuge core sample in the formation oil until it reaches the Irreducible Water Saturation (IWS) and measure the total amount of water displaced, including the brine displaced by spontaneous imbibition in the previous step.
• Immerse core sample in the formation brine and measure the volume of oil displaced by spontaneous imbibitions of the formation brine after 20 hours.
oil crystal crystal water water advancing contact angle water receding contact angle oil crystal crystal water