Alma Mater Studiorum – Università di Bologna
DOTTORATO DI RICERCA IN
Scienze Mediche Specialistiche
Ciclo XXVIII
Settore Concorsuale di afferenza: 06/E1- Chirurgia cardio-toraco-vascolare Settore Scientifico disciplinare: MED/21- chirurgia toracica
TITOLO TESI
CIRCULATING TUMOR CELLS INVESTIGATION
IN ESOPHAGEAL CANCER
Presentata da: Dott.ssa Gallerani Giulia
Coordinatore Dottorato
Relatore
Prof. Di Bartolomeo Roberto
Prof. Mattioli Sandro
Summary
Introduction ... 1
Origin of CTCs ... 2
Tumor progression models: Linear VS Parallel ... 3
Epithelial to Mesenchymal Transition ... 6
Circulating cancer stem cells... 10
Esophageal cancer ... 16
Pathology and anatomy ... 17
Prognosis ... 18
Staging system ... 18
CTC & esophageal cancer ... 20
Focus on markers ... 23
Epithelial CTCs (epithelial-tag) ... 23
EpCAM (epithelial tag) ... 23
E-cadherin (epithelial tag) ... 23
Cytokeratins (Cks) ... 24
Mesenchymal/Stem CTCs (mesenchymal/stem-tag) ... 24
N-cadherin ... 25
CD44v6 ... 25
ABCG2 ... 26
Aims and Study design ... 27
Primary aims ... 27
Secondary aim ... 27
Design ... 27
Expected Outcomes ... 27
Materials and Methods ... 28
Cell culture ... 28
Peripheral Blood Monuclear cells (PBMC) isolation ... 28
Immunofluorescence... 29
DEPArray calibration settings ... 29
Grab all assay on EMT inducted cell lines ... 30
Grab all-assay on esophageal cancer patients and healthy donors ... 31
Whole Genome Amplification ... 32
Results ... 33
DEPArray calibration setup ... 33
The GRAB all-assay ... 35
EMT on MCF10A ... 35
Grab all assay on EMT-induced MCF10A ... 36
EMT on HME cell line and modified HME-TWIST1, HME-ZEB1, HME-ZEB2 ... 38
Grab all assay specificity on blood of healthy donors. ... 40
Grab all assay on blood of esophageal cancer patients. ... 40
Patients clinical characteristcs ... 43
Features of patients that underwent surgery and clinical F.Up ... 44
Whole Genome Amplification on single CTCs ... 45
Discussion ... 46
Appendix 1- Techniques for CTC identification... 49
Appendix 2-DEPArray System ... 55
Appendix 3- Detailed clinical histories of esophageal cancer patients with CTCs analysis ... 59
Appendix-4 Minimal-sample-handling protocol for CTC culture- visiting at Prof. Vescovi Lab. ... 66
Bibliography ... 71
1
Introduction
Since the Greek physician Galen had associated of an imbalance in "black bile" with cancer, to the post-mortem observation of tumor-like cells in the blood by Thomas Ashworth in 1869, and to the validation of circulating tumor cells (CTCs) as a prognostic tool in the early 2000's, the scientific community has always demonstrated an ever-deepening interest in these rare cells and their role in the metastatic process 1,2. CTCs are exceedingly rare cells found into
whole blood of cancer patients. They have the potential to serve as a 'blood biopsy', enabling population-wide screening for early diagnosis, highly sensitive prognostic monitoring for cancer patients, and serial non-invasive molecular profiling to bring the science of personalized medicine to practical fruition in the clinic. Furthermore, while much has been hypothesized about their potential role in the hematogenous dissemination of cancer, the biological characterization of these cells could lead to an entirely new class of therapies targeting metastasis. Metastasis is the spread and growth of tumor cells from the primary site to distant organs, is conceivably the most devastating and deadly attribute of cancer, and is ultimately responsible for more than 90% of cancer-related deaths, resulting in over 500,000 deaths each year in the United States alone. Circulating tumor cells have the potential to be highly informative concerning our understanding of metastasis. Present technologies, however, enable only a subset of potential analyses to be conducted, principally due to sub-optimal cell isolation sensitivity, purity, throughput, or handling method [details in Appendix 1].
2
Origin of CTCs
Ten years ago, I.J. Fidler postulated that a primary tumor composed by 109 tumor cells can
sheds millions of tumor cells into circulation every days, but the development of lung metastases was very rare in an experiment where 2x10⁶ cancer cells were injected into
rabbits4.
These findings lead to consider the cancer cells spreading as an inefficient process where only a little percentage of circulating tumor cells could generate metastases. What happens to the vast majority of the tumor cells that fail to form metastases is still matter of debate since the metastatic process consists of a long series of sequential, interrelated steps. . Each of these can be relate limiting, as a failure or an insufficiency at any of the steps can stop the entire process. The outcome of the process is dependent on both the intrinsic properties of the tumour cells and the responses of the host.
The very first step of metastatic dissemination is thought to include the detachment of epithelial cells from the extracellular matrix (ECM) and the disruption of the actin skeleton, leading to cells rounding. Both of these events normally trigger apoptotic process, which termed anoikis and amorphosis respectively.
The ability to survive in the absence of normal matrix components represents a crucial property of metastatic cells, as tumor cells that intravasate into the circulation and extravasate into secondary tissue sites are either deprived of matrix or exposed to foreign matrix components 5,6.
To enter the bloodstream a tumor cell has to negotiate and survive the process of intravasation. A fluorescence-based in vivo study using orthotopically injected metastatic versus non-metastatic tumor cells showed that a large number of the non-metastatic cells fragment when interacting with blood vessels, whereas the metastatic cells display increased survival during this process 7, indicating that the entry of cancer cells into the vasculature
constitutes an important barrier to metastasis.
The efficiency of metastasis inhibition by apoptosis induction in the early phases of entrance into the circulation and extravasation is probably another important regulatory mechanism that counteracts metastasis development. Cell death might occur as a result of two main effects: cell destruction by mechanical stress and cell death mediated by the immune system. Furthermore, to form metastases circulating cancer cells have to pass through several stressful and highly selective steps, including arrest in the capillary bed and resumption of proliferation in distant organs.
3
T
UMOR PROGRESSION MODELS:
L
INEARVS
P
ARALLELThe debate about metastases development and consequently the role of CTCs is still open: on one hand there is the linear progression model and on the other the parallel progression model.
The linear progression model is based on Leslie Fould’s description of a stepwise progression of morphological abnormalities 8 accompanying cancer [Figure 2].
Accumulation of genetic and epigenetic alterations was subsequently associated with this process 9. At its simplest, the model states that cancer cells pass through multiple successive
rounds of mutation and selection for competitive fitness 10 in the context of the primary
tumor. After a significant number of such rounds the cells may be able to proliferate relatively autonomously at a competitive rate. These tumor cell clones expand and individual cancer cells leave the primary site to seed secondary growths.
The final clonal expansion of fully malignant clones is linked to tumor size. For example, mutations of the tumor suppressor gene TP53 are rare in T1 stage (<2 cm; sizes refer to diameter throughout) breast cancers, and significantly more frequent in T3 stage (>5 cm) tumors 11
FIGURE 2TUMOR LINEAR PROGRESSION 12
Such observations and the well-known association of tumor size with higher frequency of metastasis, which is the basis of the routinely used TNM classification system, have promoted the concept that only tumor cells that are shed late in primary tumor progression have the possibility of eventually spawning macroscopic metastases 13.
However, the possibility that dissemination of tumor cells occurs early (when tumors are small), after acquisition of fully malignant traits, cannot be excluded. Such cells, having departed early, are also thought to share most of their characteristics with the primary tumor. The parallel progression model dates back at least to the 1950s 14, when considerable effort
was made to quantify human cancer growth rates. These studies concluded that metastasis must be initiated long before the first symptoms appeared or the primary tumor was diagnosed 14,15; given their growth rates, metastases were simply too large to be accounted
4
FIGURE 3TUMOR PARALLEL PROGRESSION 12
Parallel progression does not necessarily place metastatic founder cell dissemination near the end of primary tumor development. On the contrary, dissemination of tumor cells that are still evolving may lead to allopatric selection and expansion of variant cells adapted to specific microenvironments 14 .
Owing to selection pressure and the inherent genetic instability of tumor cells, parallel progression predicts greater disparity between metastatic founder and primary tumor cells than does linear progression and emphasizes the mechanistic importance of site-specific selection of genetic and epigenetic alterations. Finally, the parallel progression model makes three testable predictions. The first is parallel and independent accumulation of genetic and epigenetic alterations in the primary tumor compared with the metastasis. The second is seeding of tumor cells to different distant sites in parallel, independent, niche-related adaptation during outgrowth towards metastasis. The third is parallel ontogenesis of metastatic cells that disseminated from the primary site at different times. Because, in parallel progression, metastatic founder cells in most cases disseminate long before clinically detectable disease, there is ample time for multiple waves of dissemination or continuous spread.
Both models of tumor progression consider the emergence of multiple metastases. In parallel progression, metastatic founder cells are selected in parallel at various sites and grow independently. Linear progression predicts metastasis from metastasis, in part predicated on the assumption that a metastasis is at least as able to spawn metastases as is the primary tumor, as it has been selected to do so. This view emerged from autopsy studies and selection of highly metastatic cell lines in vivo 16. The autopsy studies were taken to support linear
5 trials argue against a linear progression from first to secondary metastasis. For example, the median time taken for 50% of breast cancer patients to develop a single metastasis after diagnosis of M0 disease and surgery is shortest for the liver, taking 29 months. However, the median time taken for M0 stage patients to be diagnosed with multiple metastases, including liver (such as liver and lung or liver and brain), after surgery is 28 months 17.
Parallel progression diminishes the emphasis on metastatic cascades in favor of direct (and early) seeding from the primary lesion. Favored metastatic sites may thus reflect the probability and rate of specific tumor cells growing in a given niche. In counter- point to this, the prognostic value of circulating tumor cells (CTCs) in the blood of patients with metastasis may be considered as support for metastatic cascades.
6
Epithelial to Mesenchymal Transition
Changes in cell phenotype between epithelial and mesenchymal states, defined as epithelial– mesenchymal (EMT) [Figure 4] and mesenchymal–epithelial (MET) transitions, have key roles in embryonic development an wound healing processes, and their importance in the pathogenesis of cancer and other human diseases is increasingly recognized 18–21.
FIGURE 4EMT HALLMARKS IN DEDIFFERENTIATED TUMOR THE PRIMARY 22. TUMOUR AND METASTASES SHOW THE SAME HETEROGENEITY, WITH A TUBULAR DIFFERENTIATED PHENOTYPE IN THE CENTER AND AN UNDIFFERENTIATED PHENO TYPE AT THE PERIPHERY.THIS IS ALSO INDICATE D SCHEMATICALLY (A DIFFERENTIATED PHE NOTYPE IS INDICATED WITH BLUE AND AN UNDIFFERENTIATED PHE NOTYPE IS INDICATED WITH PURPLE).A SMALL DIFFERENTIATED METASTASIS WITH ADJACENT SINGLE,
UNDIFFERENTIATED TUM OUR CELLS IS SHOWN (BOTTOM PANEL).
However, even though developmental and pathological EMT forms have many common features, they also have obvious differences, leading to the classification of three different EMT types 23 [Figure 5]. Type 1 refers to developmental EMTs; type 2 denotes those related
to wound healing, tissue regeneration, and organ fibrosis; and type 3 indicates the EMT associated with cancer. Developmental EMTs imply the conversion of epithelial into mesenchymal cells, but embryos lack inflammatory responses, typical of type 2 and 3 EMTs that occur in the adult 23,24. Type 2 EMTs are also characterized by the appearance of
myofibroblasts with the ability to secrete an excess of extracellular matrix molecules in response to inflammation 23. In contrast to the situation in embryos, in cancer cells and during
regeneration, the acquisition of a mesenchymal state in fibrosis can be considered an end stage, which leads to organ degeneration and failure. During cancer progression, tumor cells undergo type 3 EMT, which, in addition to invasion and motility, involves intravasation of delaminated cells into lymphatic and blood vessels and their subsequent extravasation.
7
FIGURE 5DIFFERENT EMTTYPES23TYPE 1EMT IS ASSOCIATED WITH IMPLANTATION AND EMBRYONIC GASTRULATION AND GIVES RISE TO THE MESODERM AND ENDODERM AND TO MOB ILE NEURAL CREST CELLS. THE PRIMITIVE EPITHEL IUM, SPECIFICALLY THE EPIBLAST, GIVES RISE TO PRIMAR Y MESENCHYME VIA AN EMT.EMTS ARE RE-ENGAGED IN THE CONTE XT OF INFLAMMATION AND FIBROSIS AND REPRESE NT THE TYPE 2EMTS.UNLIKE THE TYPE 1EMT, THE TYPE 2EMT IS EXPRESSED OVER EXTENDED PERIODS OF TIME AND CAN EVENTUALLY DESTROY AN AFFEC TED ORGAN IF THE PRIMARY INFLAMMATORY INSULT IS NOT REMOVED OR ATTENUATED. FINALLY, THE SECONDARY EPITHELIA ASSOCIATED WITH MANY ORGANS CAN TRANSFORM INTO CANCER CE LLS THAT LATER UNDERGO THE EMTS THAT ENABLE INVASION AND METASTASIS, THEREBY REPRESENTING TYPE 3EMTS
Another essential difference between the embryonic and tumorigenic processes is that the tumorigenic processes involve genetically abnormal cells that progressively lose their responsiveness to normal growth-regulatory signals and possess the ability to evolve. Such evolution derives from the genetic and epigenetic instability that is inherent in most neoplastic cell types.
The hallmarks of the EMT can be summarized as follows: loss of cell-cell junctions, loss of apico-basal polarity, and acquisition of migratory and invasive properties 25.
Epithelial cells form layers kept together by specialized membrane structures (tight junctions, adherens junctions, desmosomes and gap junctions). The organization of these junctions as a lateral belt, the localized distribution of adhesion molecules such as cadherins and some integrins, the polarized organization of the actin cytoskeleton, and the presence of a basal lamina used as substratum define the characteristic ‘‘top–bottom’’ apico-basal polarity of epithelial cells.
In contrast, mesenchymal cells interact with their neighbours only at focal contacts without forming organized cell layers, and do not have an apico-basal polarized actin cytoskeleton. Instead, mesenchymal cells are elongated and motile in a three-dimensional space defining a front–back polarity with a leading edge enriched in integrins and matrix metalloproteinases (MMP). EMT describes the process in which epithelial cells lose their epithelial characteristics, gain mesenchymal features, and become motile
8 Recently it has become clear that EMT is driven by at least four fundamental regulatory networks, which are closely interrelated, and modulation of any of these networks affects the others. The most extensively studied network is undoubtedly the network of the nuclear factors (described below). There is growing evidence that three additional layers of regulation support the EMT programme: the expression of small non- coding RNAs 26, differential splicing 27,28, and translational and post-translational control (which affect protein stabilization and
localization).
EMT is controlled by at least five major signalling pathways [Figure 6] that are used in early embryonic development (the WNT, TGFb, Hedgehog, Notch and receptor tyrosine kinase pathways) 29,30. These pathways are often disregulated in cancer 31–35 , and they often
cooperate to drive EMT 36,37.
FIGURE 6 THE MOLECULAR NETWORK OF KNOWN SIGNALING PATHWAYS AND TRANSCRIPTION FACTORS THAT REGULATE THE
EPITHELIAL-MESENCHYMAL TRANSITION PROGRAM IN CARCINOMA CELLS 21
There are many examples where induction of EMT in cultured tumor cells results in increased metastatic potential in animal models 29. The transcriptional programs activated by TGF-38,39,
PDGF 40 and NFKB, in vitro 36 have also been detected in vivo in animal models and in human
tumor samples 40–43.
TGF-, for example, induces EMT in H-Ras-transformed mammary epithelial cells, a process that has recently shown to be dependent on NF-kB 44. Importantly, inhibition of NF-kB activity
caused a reversal of EMT and also abrogated the metastatic potential of the tumour cells in vivo, providing further evidence for a link between EMT and metastasis. Snail family genes have also been implicated in tumour-associated EMT and metastasis, and constitute tumour progression markers that can be expressed at the invasive front of tumours 45
Alongside to pathways implicated in EMT, specific markers have been identified, trying to distinguish between epithelial and mesenchymal cells, which often play key functional roles 29
An example is E-cadherin, a transmembrane protein localized to the adherens junctions and basolateral membrane that plays a central role in organizing the cell–cell adhesion complexes typical of epithelial cells 46. It is expressed in epithelial cells but not in mesenchymal cells, and
9 Due to the pivotal role of E-cadherin loss, EMT-TFs are sometimes referred to as E-cadherin repressors; also, a decrease in functional E-cadherin is often associated with the activation of EMT. However, it is important to bear in mind that the EMT program and EMT-TFs are much more than E-cadherin transcriptional repressors, that E-cadherin down-regulation (or endocytosis) is not necessarily associated with the EMT program, and that E-cadherin re-expression is not sufficient to revert the fibroblastic phenotype 47
On the other hand, mesenchymal cells express intermediate filaments, such as vimentin, specific cadherins such as N-cadherin and OB-cadherin, cytosketletal proteins, including smooth muscle actin, c-actin, - filamin and talin, and extracellular matrix components, such as fibronectin and collagen precursors, as well as specific integrins and MMPs
The ability of the transcription factor SNAI1 to directly repress E-cadherin has been considered dogma since its initial observation 48,49, and this conviction has been reinforced over the years.
The list of potent EMT-inducing transcription factors (EMT-TFs) has been growing ever since
50, revealing regulatory networks that are often described as signalling pathways converting
stimuli to transcriptional reprogramming 20,51.
EMT-TFs have been involved not only in migration and invasion but also in the suppression of senescence and apoptosis, attenuation of cell-cycle progression and resistance to radiotherapy and chemotherapy 25,52,53.
For an epithelial cell to undergo a full EMT, the cell should be permissive: the mesenchymal end-stage can be considered the ultimate goal and will only be achieved when necessary component pathways of the network are activated. There is good evidence to support the idea that dedifferentiation is triggered if the balance between different regulatory networks is fundamentally disturbed; this probably requires the disruption of more than one layer. A recent study by Rhim and colleagues further supports the concept of permissiveness, using a model of pancreatic cancer in which yellow fluorescent protein (YFP)-labelled pancreatic epithelial cells have a mutant K-RAS combined with loss of Trp53 54 [Figure 7].
FIGURA 7LINEAGE-LABELED MOUSE MODELS OF PANCREATIC CANCER AND DETECTION OF EMT54TIME COURSE OF MALIGN ANT
PROGRESSION IN PKCY MICE.(D–F)REPRESENTATIVE IMAGES OF MALIGNANT PROGRESSION.PRIOR TO WEANING,PKCY MICE HAVE HISTOLOGICALLY NORMA L PANCREATA (D) BUT DEVELOP PANIN LESIONS (E) AND EVENTUALLY PDAC (F). (G–I) IMAGES OF PANCREATA FROM (D)–(F) STAINED WITH AN ANTIBODY AGAINST YFP(GREEN) AND N-CADHERIN (N-CAD, RED); PRIOR TO WEANING,
SCANT N-CAD STAINING IS SEEN (G).(J AND K)FLUORESCENT IMAGES OF LINEAGE-LABELED CELLS DERIVE D FROM THE PANCREATIC EPITHELIUM.
10 On the one hand, induction of EMT at an early stage is sufficient for the cells (that is, permissive cells) to escape the primary lesions, supporting the possibility of parallel tumour progression. On the other hand, 42% of the YFP-positive cells in these tumours had undergone EMT, supporting the existence and potency of EMT during primary tumour progression. In fact, all of these in vivo studies provided a better understanding of why EMT downstream of an EMT-TF is much easier to detect in vitro: cell lines are genetically aberrant, resulting in different degrees of plasticity and allowing a range from partial to full EMT to occur.
While it is clear that EMT-like processes are not an obligate for invasion and metastasis, there is nevertheless compelling evidence that these processes can play an important role in determining the dissemination of tumours.
This is consistent with the concept of “migratory cancer stem cells” 55 also and provides a link
between the EMT program and the characteristics associated with cancer stem cells (CSCs), that is self-renewal, proliferation rate decrease, drug resistance and the capacity to seed secondary tumors and produce differentiated non-stem cells 56. Recent evidence suggests that
cells that undergo EMT acquire stem cell-like properties (Figure 6A). These undifferentiated mesenchymal cells are characterized by a shift from E- to N-cadherin expression, the expression of Snail factors, vimentin, and metalloproteases.
However, the link between EMT and stemness is another controversial issue in tumorigenesis, as it was later shown that fibroblasts must undergo a MET to complete the initial reprogramming of fibroblasts to iPSCs 57,58. Again, help may come from studies on
development biology 59–61, although CSCs differ from canonical embryonic stem cells (ESCs) in
that they revert to the phenotypes of only the primary tumor and, therefore, have a more restricted potency than ESCs and iPSCs 62.
Circulating cancer stem cells
The concept that tumor cells within a primary tumor are heterogeneous in terms of their metastatic and renewal potential is not a recent one. Studies done more than 50 years ago demonstrated that only some tumors could be grown from a single tumor cell, and that the daughter cells could be morphologically different from the parent 63. This work laid the
foundation for the modern cancer stem cell hypothesis, which posits that within tumors there exists a subset of cells that are capable of continuous self-renewal and that can give rise to differentiated progeny 62.
The discovery of cancer stem cells (CSCs) has stimulated great excitement, as well as heated debates, for both stem cell and cancer biologists. How the CSC theory fits into the general scheme of cancer progression, particularly with respect to metastasis, has not been completely defined. In order to sustain a lifelong supply of blood cells, hematopoietic stem cells (HSCs) must have the ability to self-renew and generate differentiated blood cells. With the landmark work accomplished by John Dick and his co-workers in human leukemia studies, the existence of CSCs has now been established in many solid tumors including those arising in the brain 64,65, colon 66–70, breast 71–73, skin 74,75, prostate 76, and pancreas 77,78.
Similar to normal stem cells, CSCs can reproduce themselves through the process of self-renewal, which can be studied in serial transplantation assays. Additionally, cancers derived from purified CSCs recapitulate the heterogeneous phenotypes of the parental cancer from which they were derived, reflecting the differentiation capacity of CSCs 79,80 .
11 The origin of these cells remains unclear; are they derived from normal stem cells with a cancerous phenotype? Or do previously differentiated progenitor cells with oncogenic mutations regain the ability to self-renew? A third theory hypothesizes that CSCs may come from a rare fusion event between stem cells and other cells. Normal stem cells may be ideal target cells for accumulating mutations that are necessary for stepwise malignant transformation due to their inherent self-renewal capacity. Since multiple pathways are involved in self-renewal of stem cells, it seems conceptually more difficult for a differentiated cell to regain this ability through mutations. But the rareness of stem cells in tissues may counter this theory because of the low probability that they could be targeted by mutations. The relative abundance of transient amplifying immediate progenitor cells, derived from stem cells retaining partial self-renewal capacity, makes them likely candidates for initial transforming events.
Kang et al proposed a CSC-based model for both tumorigenesis and metastasis, in which either adult stem cells, their more differentiated progenies or fused cells, could be subject to initial transforming events. Gain of self-renewal capacity at early phases of cancer is essential for further accumulation of oncogenic transformations and eventual development of cancer. The genetic and/or epigenetic changes could determine the cancer malignancy, metastatic potential and the tissue tropism upon the CSC pool establishment. The initial origin of CSCs may influence the phenotypes of developing cancer, including the metastatic property. Molecular crosstalk between the primary tumor and the pre-metastasis niche through secreted stimulatory signals helps govern the homing of metastatic CSCs.
Like in embryogenesis, metastatic stem cells tropism towards preferred tissues and organs is guided by cues such as oxygen gradients or other chemo-attractants derived from niche sites
81–84.
It is increasingly clear that the cell heterogeneity characteristic of many cancer types results from a hierarchical organization that resembles that of the tissue of origin (Figure 8). CSCs comprise the apex of this hierarchy and appear to be the phenotypic and functional equivalents of normal stem cells harboring oncogenic mutations. CSCs in primary tumors self-renew their own population and can generate short-lived progeny.
12
FIGURE 8 SOURCES, DISSEMINATION, DORMANCY, AND OUTGROWTH OF METASTATIC STEM CELLS 85 SEVERAL TYPES OF CANCER DISPLAY A HIERARCHICAL ORGANIZATION WITH CSCS BEING THE ONLY CELL TYPE WITH LONG-TERM SELF-RENEWAL POTENTIAL..CSCS INTERACT WITH MICRO- ENVIRONMENTAL NICHES THAT SUSTAIN THE TUMOR- PERPETUATING POTENTI AL OF THE CELLS.BOTH CSCS AND NON-CSCS CAN DISPLAY MIGRAT ORY BEHAVIOR AT THE INVASIVE FRONT OF PR IMARY TUMORS, FREQUENTLY ASSOCIATE D WITH AN EMTDISSEMINATED NON-CSCS MAY CONVERT INTO METASTATIC STEM CELLS THROUGH STILL POORLY UNDERSTOOD PROCESSES OF PHENOTYPIC PLASTICITY.METASTATIC STEM CELLS MAY GENERATE PROGENY AND GIVE RISE TO OVE RT METASTASIS RIGHT AFTER INFILTRATING THE HOS T TISSUE.MORE FREQUENTLY, HOWEVER, DISSEMINATED CANCER CELLS ENTER A DORMANT STATE THAT CAN LAST FOR DECADES AND IS LARGELY RESISTANT TO CURRENT THERAPIES.UPON EXIT FROM QUIESCENCE, METASTATIC STEM CELLS MAY REGENERATE THEIR LIN EAGE IN THE HOST ORG AN AND RELEASE METAS TATIC PROGENY INTO T HE CIRCULATION TO START SECONDARY LESIONS IN THE SAME OR OTHER ORGANS.
Recent lineage tracing experiments in mouse models provide genetic evidence that primary tumors of the brain, colon, and skin comply with this organization 64,70,74,86. It remains to be
determined whether metastases arising from these tumors retain a similar hierarchy. Nevertheless, because the long-term growth capabilities of these and other cancers relies on CSCs, the idea that a so-called metastatic stem cells in these cases may be primary CSCs that resume their regenerative potential at metastatic sites is of interest .
An alternative route to metastatic stem cells status is based on regaining tumor-initiating capacity through phenotypic plasticity. This possibility is suggested by several observations. In cell line xenograft models, breast cancer stem-like cells can arise from non-stem populations as a result of stochastic transitions between both states 87.
EMT has been shown to result in cancer cells with stem cell-like characteristics that have a propensity to invade surrounding tissue and display resistance to certain therapeutic interventions.
Recent studies have demonstrated that the EMT can induce non-CSCs to enter into a CSC-like state 72,88. As such, the EMT confers on epithelial cells precisely the set of traits that would
empower them to disseminate from primary tumors and seed metastases 20. Hence, it is an
13 heightened resistance to apoptosis that is integral to cells generated by an EMT is surely critical to the ability of carcinoma cells to survive the rigors of the voyage from primary tumors to sites of dissemination 89. In addition, the CSC-like state approached by carcinoma cells that
have passed through an EMT may be critical in their sites of dissemination for launching new colonies of cancer cells. Merely because the EMT is an attractive solution does not make it unique, however, and it remains possible that other still-undiscovered biological programs operate in carcinoma cells as drivers of malignancy.
Recent data, for example, also implicate a role for TGFβ in regulating breast cancer stem cell phenotypes 72,88 and have demonstrated its essential role in maintaining the pluripotency of
human embryonic stem cells 90; the latter may indicate a role of this pathway in inducing stem
cell states during all phases of ontogeny.
As mentioned, Notch signaling also has a role in the regulation of EMTs occurring during both embryogenesis and tumorigenesis 91 . The complexity of Notch signalling derives from the
involvement of multiple receptors, ligands and downstream mediators. Moreover, the outcome of Notch activation is cell type-specific and can be either oncogenic or tumor suppressive 91 . Notch can also induce an EMT by activating the nuclear factor-κB (NF-κB)
pathway 92 or by modulating the activity of TGFβ signaling. Hedgehog signaling has also been
implicated in EMT and cancer metastasis 91.
Thus, it appears that signaling pathways involved in the regulation of stem cell function and niche–stem cell interactions can play some part in triggering EMT programs, potentially connected with the role of these programs in establishing and maintaining stem cell-like characteristics.
This is consistent with the concept of “migratory cancer stem cells” 55 and provides a link
14
FIGURA 9EXPRESSION OF STEM CELL- AND EMT-MARKERS IN COLORECTAL CANCER PROGRESSION 55.THE IMAGES SHOW SERIA L HISTOLOGICAL SECTIONS FOR EACH PROGRESSION STEP WITH SPECIFIC PROTEIN STAINING SHOWN IN B ROWN.STEM-CELL-ASSOCIATED
WNT TARGET GENES, SUCH AS SURVIVIN, ARE EXPRESSED ONLY IN THE BASIC REGION OF NORMAL COLONIC CRYPTS (THIN ARROW IN LEFT PANEL OF IMAGES), BUT ARE DISTRIBUTED THROUGHOUT ALL AREAS OF BENIGN ADENOMAS, CARCINOMAS AND METAS TASIS,
INC LUDING DIFFERENTIATE D (THICK ARROWS) AND DEDIFFERENTIATED (THIN ARROWS) TUMOUR CELLS.IN CONTRAST, EPITHELIAL TO MESENCHYMAL TRANSITION (EMT)-ASSOCIATED WNT TARGETS (SUCH AS L1CAM AND LAMC2) ARE NOT EXPRESSED IN NORMAL MUCOSA, ADENOMAS AND DIFFERE NTIATED TUMOUR AREAS (THICK ARROWS). EXPRESSION IS MAINLY SEEN IN DISSEMINATED TUMOUR CELLS THAT HAVE HIGHEST NUCLEAR Β-CATENIN AT THE TUMOUR HOST INTERFACE (THIN ARROWS), MOST OF WHICH RETAIN EXPRESSION OF STEM C ELL MARKERS.L1CAM,L1 CELL ADHESION MOLECULE;LAMC2, Γ2 CHAIN OF LAMININ.
However, the relationship between EMT and stemness is another controversial issue in tumorigenesis, as it was later shown that fibroblasts must undergo a MET to complete the initial reprogramming of fibroblasts to iPSCs 57,58.
Several characteristics of CTCs make them likely candidates to occupy and thrive in these foreign sites. It is theoretically possible that only CSCs within tumors have the ability to initiate and sustain cancer growth. It has been known for years that just one cell can initiate a metastatic lesion 93.
The inherent plasticity of stem cells makes them more adept to survive in a foreign environment (albeit primed by the pre-metastasis niche) where growth factors and other signaling molecules are different than in the primary tumor site. Increased genetic instability in CSCs is also likely to provide a selective advantage in adapting to foreign sites. However, it remains to be seen how CTCs are capable of forming metastasis at different sites.
15 Cell populations capable of generating metastasis when transplanted into mice can be isolated from primary tumor samples via stem cell marker genes 75,77. Circulating tumor cells
expressing both mesenchymal and stem cell markers have been detected in the blood of breast cancer patients , and when inoculated into immunodeficient mice these cells generated bone, liver, and lung metastases 94,95.
16
Esophageal cancer
The worldwide overall incidence of esophageal carcinoma (EC) is on the rise. Esophageal cancer is a global problem for which no formalized screening programs currently exist. This cancer is the eighth most common cancer worldwide, with an estimated 456,000 new cases in 2012 (3.2% of the total), and the sixth most common cause of death from cancer with an estimated 400,000 deaths (4.9% of the total) [source http://globocan.iarc.fr/].
Esophageal cancer is extremely aggressive nature and poor survival rate 96,97, it exhibits
epidemiologic pattern distinct from all other cancers 98,99. Worldwide simple maps of
Age-standardized incidence rates per 100,000 of 2008 VS 2012 is showed in Figure 10; Worldwide simple maps of esophageal cancer mortality of 2008 VS 2012 is showed in Figure 11.
FIGURE 10ESOPHAGEAL CANCER-AGE-STANDARDIZED INCIDENCE RATES PER 100,000 WORLDWIDE—2008100VS2012 ESTIMATES [FROM GLOBOCAN .AVAILABLE FROM: HTTP://GLOBOCAN.IARC.FR ACCESSED GEN.2016]
17
FIGURE 11ESOPHAGEAL CANCER MOR TALITY WORLDWIDE—2008100VS2012 ESTIMATES [FROM GLOBOCAN .AVAILABLE FROM:
HTTP://GLOBOCAN.IARC.FR ACCESSED GEN.2016]
The pathogenesis of esophageal cancer remains unclear. Data from studies in animals suggest that oxidative damage from factors such as smoking or gastro-esophageal reflux, which cause inflammation, esophagitis, and increased cell turnover, may initiate the carcinogenic process
101.
Pathology and anatomy
Cancer of the esophagus typically occur in one of two forms, squamous cell carcinomas (ESCC), arising from the stratified squamous epithelial lining of the organ, and adenocarcinomas (EAC), affecting columnar glandular cells that replace the squamous epithelium 102. Despite
the epidemiological differences, both types of esophageal cancer have a dismal prognosis. The natural histories of squamous cell carcinomas and adenocarcinomas of esophagus appear to differ substantially. For squamous cell cancers, transition models have described squamous epithelium undergoing inflammatory changes that progress to dysplasia and in situ malignant change 103.
Most adenocarcinomas, however, tend to arise in the distal esophagus from columnar-lined metaplastic epithelium, commonly known as Barrett’s esophagus 104, which replaces the
squamous epithelium during the healing reflux esophagitis and may progress to dysplasia. For both esophageal cancer subtypes there is a well-described pre-invasive stage illustrated in Figure 12.
18
FIGURE 12|PATHOLOGICAL SEQUENCE OF OESOPHAGEAL CANCER PROGRESSION 100.PROGRESSION OF “A” NORMAL SQUAMOUS EPITHELIA TO “B” SQUAMOUS HIGH-GRADE DYSPLASIA AND “C” SQUAMOUS-CELL CARCINOMA.PROGRESSION OF “D”BARRETT’S OESOPHAGUS TO “E” GLANDULAR HIGH-GRADE DYSPLASIA AND “F”ADENOCARCINOMA. THE SECTIONS WERE STAINED WITH HAEMATOXYLIN AND EOS IN AND ARE DISPLAYED AT ×100 MAGNIFICATION
Cancers that start at the area where the esophagus joins the stomach (the GE junction), which includes the cardia, tend to behave like esophagus cancers (and are treated like them, as well), so they are grouped with esophagus cancers. Approximately three quarters of all adenocarcinomas are found in the distal esophagus, whereas squamous-cell carcinomas are more evenly distributed between the middle and lower third.
Prognosis
Esophageal cancer is the sixth most common cause of cancer deaths and its five- year survival is about 16% and 10% in USA and in Europe, respectively 105.
After esophageal resection the five-year survival rates were 20.6% in a Western meta-analysis for unselected patients 106 and 50% for EAC patients operated with two-field
lymphadenectomy 107. At the time of diagnosis, more than half of the patients were suffering
from inoperable disease 108. In a large analysis of 1059 operated EC patients from a single
German centre, Siewert et al. found better long-term prognosis for EAC than for ESCC. During the years 1982 to 2000, the overall resection rate was 68.2% and 75.5% for patient with EAC and 64% for patients with ESCC.
More than two thirds of all patients with EC develop local recurrence or distant metastases and die despite complete resection of the primary tumor and multimodal treatments. Recurrence or metastasis results from clinically occult minimal residual disease caused by circulating tumor cells (CTCs) or disseminated tumor cells 109,110.
Staging system
Esophageal cancer staging is defined by the American Joint Committee on Cancer (AJCC) Staging System that establishes tumor-node-metastasis (TNM).
Sub-classifications based on the depth of invasion of the primary tumor (T), lymph node involvement (N), and extent of metastatic disease (M). The most recent, 7th edition of the AJCC Cancer Staging Manual for esophagus and esophagogastric junction cancers was
19 developed based on a database of 4,627 esophagectomy patients who were not treated with induction or adjuvant therapy 111 see Figure 13. This data from 13 institutions in five countries
and three continents was collected by the Worldwide Esophageal Cancer Collaboration (WECC) 112.
FIGURE 13AJCC7TH EDITION-ESOPHAGEAL CANCER STAGING GROUPING [MODIFIED FROM 113]
The Society of Thoracic Surgeons has published guidelines on the diagnosis and staging of patients with esophageal cancer 114. The work-up for esophageal cancer often starts when
patients present with symptoms such as dysphagia and weight loss in the setting of an unremarkable physical exam 115. Therefore, the most common tests used to initially identify
and diagnosis esophageal cancer are upper gastrointestinal (GI) tract contrast studies and upper endoscopy with biopsy. After a histologic cancer diagnosis has been obtained, subsequent studies are performed to determine clinical stage as accurately as possible before treatment is initiated. Obtaining a computed tomographic (CT) scan of the chest and abdomen with both oral and intravenous contrast should be the first staging study when esophageal cancer is diagnosed histologically. The CT scan is somewhat limited in defining the local extent and nodal involvement of esophageal cancer but is most useful in identifying the presence of distant disease such as liver or lung metastases.
Positron-emission tomography (PET) scans improve staging by detecting previously unsuspected metastatic disease in up to 15-20% of patients and should be considered in place of CT scans or as an additional study when the CT scan does not show metastatic disease 116,117.
Performance of the above staging modalities establishes the pre-treatment clinical stage which can be used to guide subsequent treatment. Distant metastases are unfortunately missed even with completion of the staging evaluation described above. Small liver or lung metastases can be missed by both PET and CT scans, and patients can also have undetected pleural or peritoneal disease 118. Staging via minimally invasive surgical techniques of
thoracoscopy and laparoscopy improves the accuracy of the above non-invasive testing 118– 120. Use of these invasive techniques is relatively uncommon but should be considered in select
patients, such as those who may be considered to have a high risk of treatment-related complications.
An appropriate staging system is essential for determining treatment strategies, especially those involving neo-adjuvant treatments, in patients with EC. Despite the availability of
20 several preoperative diagnostic techniques, accurate pretreatment staging remains inconsistent. Therefore, a novel tool for early tumor detection, adequate prognostic staging, and accurate therapy monitoring in EC is urgently needed.
CTC & esophageal cancer
Despite the aggressiveness of esophageal cancer, a little number of research was conducted to understand the role of CTCs on this disease.
Pioneering studies from 2004 using reverse transcriptase-polymerase chain reaction provided a CTC detection rates ranging from 2% to 32.9% in esophageal cancer patients 121,122
Lack of methodological uniformity, nucleic acid-extraction protocols and molecular marker selection as well as the inconsistent definition of CTC positivity in polymerase chain reaction-based methods may account for this large variation. Despite methodological shortcomings, early study in patients before and after surgery, brought attention about CTCs presence as an independent predictor of disease recurrence in esophageal squamous cancer 121.
With the introduction of CellSearch system, designed to detect CTC in peripheral blood samples by using immunomagnetic enrichment, there was an outbreak of studies enumerating circulating tumor cells in different cancers starting from those metastatic. It took about ten years from the establishment of CTCs (EpCAM+/CKs+/CD45-) as an independent predictor of progression-free survival (PFS) and overall survival (OS) in patients with metastatic breast cancer (MBC) 1 to investigate these cells in esophageal cancer.
In 2013 a small pilot study in a cohort of 18 patients with advance esophagogastric cancer illustrated a 44% proportion of patients with more than 2 CTC/7.5ml of blood before first line chemotherapy 123. Only 11 patients of the 18 displayed exhibited cancers ascribable to
esophagus: 9 esophagogastric junction, 2 esophagus. Only 4 patients had more than 2 CTCs of the 9 with esophagogastric cancers whereas none of the patients with esophageal cancer showed more than 2 CTCs. Unfortunately this study didn’t explain anything about the relationship between CTCs and esophageal cancer. Moreover the established cutoff of 2 CTCs per 7.5ml of blood is supported only by a large study including a wide variety of cancers at different stages 124 bringing the cutoff-choice perhaps too rough.
A larger and well-defined study to assess CTCs as a staging tool for non-metastatic esophageal cancer into defined prognostic subgroups was carried out by the group of Reeh 125.
Using a strict cutoff of 1 CTC or more they found that CTC-positive patients with non-metastatic disease had a significantly shorter overall and relapse-free survival than patients without CTCs (Figure 14-15).
21
FIGURE 14OUTCOMES OF PATIENTS WITH EC WITH CTCS COMPARED WITH PATIENTS WITHOUT CTCS.CORRELATION OF OVERALL
(A) AND RELAPSE-FREE SURVIVAL (B) WITH CTCS IN PATIENTS WITH EC(N=91)
FIGURE 15OUTCOMES OF PATIENTS WITH EC WITH CTCS COMPARED WITH PATIENTS WITHOUT CTCS.CORRELATION OF OVERALL SURVIVAL WITH CTCS IN PATIENTS WITHOUT DISTANT METASTASES (M0)(N=86).
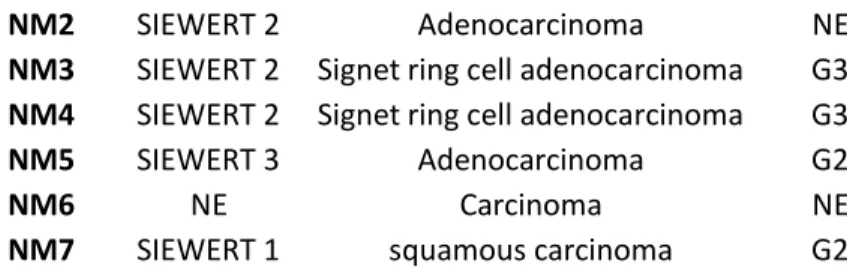
In particular, 3 of the 29 patients (10.3%) with SSC showed 1 CTCs or more, 14 of the 68 patients (20.6%) with adenocarcinoma showed 1 CTCs or more this could be due to different characteristics between esophageal cancer subtypes (SSC vs EAC) 125.
Consistent with this hypothesis, the elegant study of Stoecklein et al reported that EpCAM expression in early esophageal cancer may vary 126. Analysis of EpCAM status on disseminated
tumor cells (DTC) derived from lymph nodes and bone marrow showed that CK18 positive DTCs often lack of EpCAM expression [Figure 16].
22
FIGURE 16VARIABLE EXPRESSION OF EPCAM IN DISSEMINATED TUMOR CELLS 126.BONE MARROW ASPIRATES WERE STAINED WITH ANTIBODIES SPECIFIC FOR EPCAM AND CK18 WITH FLUORESCENCE-LABELED SECONDARY ANTIBODIES. REPRESENTATIVE FLUORESCENCE MICROSCOPY PICTURES OF EPCAMHIGH/CK18NE GA TI VE,EPCAMHI GH/CD18POSI TI VE AND EPCAMNE GA TI VE/CK18POS IT IV E
SAMPLES ARE DISPLAYE D.
CK18 DTCs were detected in 38.9% of esophageal cancer patients but co-expression of EpCAM was seen in 37.1% of cases, 62.9% revealed a DTC CK18+/EpCAMlow/negative; comparison of
EpCAM expression on 14 antilogous pairs of primary tumors and their associated DTCs revealed an absence of EpCAM on DTCs in 64% of patients with EpCAM high expression primary
tumors.
This discrepancy was not due to an intrinsic characteristic of primary tumor but EpCAM knockdown and EMT induction experiments using esophageal squamous cancer cell lines indicate that the reduction of EpCAM expression is associated with cell migration.
Both EpCAM positive and EpCAM negative/low cancer cells sustain metastatic progression during esophageal cancer in a context-dependent manner.
Taking together these findings lead to the hypothesis that CTC studies supported by CellSearch may be most likely partial due to the EpCAM down-regulation observed in DTCs. EpCAM must not to be used as the only CTCs identification marker as it could underestimate the amount of circulating and/or disseminated tumor cells.
23
Focus on markers
Epithelial CTCs (epithelial-tag)
At single cell level, besides lack of expression of CD45 (leucocytes marker), we can define a CTC on at least two criteria of expression of specific proteins, e.g., epithelial cellular adhesion molecule EpCAM and Cytokeratin 8,18,19 127. These identification criteria provide the FDA
approved definition of CTC 128. Such a definite statement during the last five-years
encountered many revisions, most notably because of major advances in the field of EMT
129,130. Indeed, in the last three years some pioneering laboratories identified non-canonical
CTCs able to grow in vitro 94,131 bringing solid confirmations of CTC heterogeneity.
The three most well-known families of antigen characteristics that may be present alone or in different combination on CTCs are the epithelial, the mesenchymal and the stemness markers. Six markers (plus CD45 as a negative marker) were choosen to identify circulating esophageal cancer cells and to comprehend a “wide” range of CTC characteristics.
E
PCAM
(
EPITHELIAL TAG)
EpCAM is a cell surface glycoprotein highly expressed in epithelial cancer cells and at lower level in normal epithelial cells 132. EpCAM was the starting point of detection and enumeration
of CTCs and is particularly exploited by CellSearch system (Veridex, Warren, New Jersey, USA)
133. Yet, expression of this protein is dependent on the stage of EMT.During EMT, it can be
down-regulated in parallel to the increase of expression of N-cadherin and vimentin, and could finally disappears, as E-cadherin does. Numerous antibodies against EpCAM were used to target epithelial cancer cells. It is well known from the paper of Rao et al. that EpCAM expression is down-regulated in many CTCs 134 [Figure 17]. If patients with undetectable CTCs
by EpCAM-based technology have a more favorable prognosis compared to those with detectable CTCs, there may be other CTC-negative patients with a bad prognosis. The latter could have undetectable CTCs due to EMT which down regulates epithelial marker expression. This is particularly true for EpCAM and cytokeratins (Cks).
FIGURE 17CTCS POSITIVE FOR EPCAM135.DIFFERENT LEVELS OF E XPRESSION OF EPCAM FROM NEGATIVE A, WEEKLY B AND
POSITIVE C
E-
CADHERIN(
EPITHELIAL TAG)
E-cadherin is a component of adherens junctions and one of the hallmarks of epithelial cells. This molecule functions in close cooperation with the actin cytoskeleton and enables resistance to forces causing cell detachment. It is implicated to support epithelial tissue architecture. Expression regulation of E-cadherin has a major role in the EMT progression.
24 When a cell is going towards the mesenchymal state, expression of this protein is decreased
136. Once cancer cells escape from primary tumor, E-cadherin can be inactivated or
down-regulated by different mechanisms. Its down-regulation can be done through promoter hypermethylation, histone deacetylation, and more importantly, transcriptional repression
137. Major cadherin repressors are Snail and Slug. Snail appears to be the most important
E-cadherin repressor related to tumor progression. TGFβ represses both Id proteins (Inhibitor of DNA-binding proteins) and activates Snail family members, explain the links between TGFβ signaling, E-cadherin repression and EMT initiation 138. Examples of CTCs positive for
E-cadherin in Figure 19
C
YTOKERATINS(C
KS)
Cks are the largest and most diverse class of intermediate filaments which constitutes cytoskeleton components. At least twenty different Cks can be expressed. They are markers of normal epithelial differentiation, but they can be used as diagnostic tool to detect different circulating cells of carcinoma [Figure 18]. To this aim, antibodies must be able to recognize most of the more conserved epitopes. Epithelial cancer cells often express Cks 8, 18 and 19, and are used by Cell SearchTM in addition to EpCAM to count epithelial CTCs. They have also
been used to identify disseminated tumor cells (DTCs). However, when EMT is ongoing their expression is often down-regulated 29. Cells leaving the primary tumor intravasate into the
blood and often lose their Ck expression, escaping “standard” CK-based detection. Joosse et al. demonstrated that the use of an anti-Ck antibody cocktail is able to track cells loosing partial epithelial phenotype. These results suggest that CTCs showing mesenchymal state could have, among numerous Cks, a residual expression of some of them 139.
FIGURE 18EXAMPLES OF CTCS CYTOKERATINS POSITIVE.A CTC COUNTERSTAINED WITH DAPI (BLUE) PANCK(GREEN) BY ICHIP TECHNOLOGY 140;B EXAMPLES OF CTCS IDENTIFIED WITH CELLSEARCH DAPI(PURPLE) PANCK(GREEN)141
Mesenchymal/Stem CTCs (mesenchymal/stem-tag)
Differentiated epithelial carcinoma cells can be transformed into a mesenchymal state and during this process, different degrees of EMT occur. Then it can be difficult to define a pure mesenchymal CTC subpopulation. However the mesenchymal character of CTCs can be assessed by the expression of protein/s reflecting EMT process.
In addition, during EMT, cancer cells are endowed with stemness characteristics acquiring migratory properties. This is one of the hypothetical origin of circulating-cancer stem cells (CSC) 130.
25 Thus the diversity of CTCs having EMT features, which can be relevant in either CSCs or differentiated cancer cells, underlines the difficulty to choose significant identification markers.
N-
CADHERINAdherens junctions have a major role in the shape organization of epithelial tissue. Phenotypic changes leading to epithelial sheet movements are based on their modifications. Among proteins of adherens junctions, classic cadherins are the E-cadherin and N-cadherin subfamilies. N-cadherin is expressed in many cells and particularly in mesenchymal cells. Therefore it is normally used as a marker of EMT. During this process E-cadherin is switched off while N-cadherin is switched on. Abnormal expression of N-cadherin associated to a dramatic decrease of E-cadherin is a hallmark of mesenchymal character of CTCs resulting from E- to N-cadherin switch 142 [Figure 19]. Loss of E-cadherin in tumor cells is due to
methylation of its promoter or to overexpression of transcriptional repressors which target its promoter 143,144.
FIGURE 19EXAMPLES OF CTCS DIFFERENTLY POSITIVE FOR N-CADHERIN,E-CADHERIN OR CKS.145
CD44
V6
CD44 is a widely expressed polymorphic integral membrane adhesion molecule that binds hyaluronic acid and contributes to cell-cell and cell-matrix adhesion, cell growth and trafficking, EMT, and tumor progression 146. CD44 transcripts undergo complex alternative
splicing, resulting in functionally different isoforms expressed primarily on epithelial cells 147.
Among CD44 isoforms (CD44vn), CD44v6 seems to play a major role in cancer progression for its ability to bind hepatocyte growth factor (HGF), osteopontin (OPN), and other major cytokines produced by tumor micro- environment 146. The major role of CD44v6 involves cell
migration and invasion. CD44v6 interacts with hepatocyte growth factor receptor (MET) in the presence of HGF and potentiates its signaling 148. Studies indicated that increased CD44v6
expression would induce a high metastatic potential in some tumors, such as non-small cell lung cancer149, gastric cancer 150, and pharyngolaryngeal cancer 151. In a recent meta-analysis
where single studies concerning esophageal cancer and presence of CD44v6 were pooled together, the results suggested that the expression of CD44v6 was higher in esophageal cancer tissue than in normal tissue 152. Results also found that the high expression of CD44v6 was
associated with poor survival in esophageal cancer patients with lymphoid nodal metastasis, which suggests that the abnormal expression of CD44v6 in tumor cells may enhance their potential form metastasis in the regional lymph nodes [Figure 20]. However, no association was observed between the expression of CD44v6 and the tumor stage and histological types, indicating that CD44v6 may not be involved in the biological function of tumor cells but may promote the metastasis of tumor cells.
26
FIGURA 20CD44V6EXPRESSION DURING TUMOR PROGRESSION 94.IMMUNIHISTOCHEMISTRY OF TWO SECTIONS OF PRIMARY TUMOR IN PATIENTS M0 AND AFTER PROGRESSIO N TO BONE METASTASES, BOTH EXPRESSED CD44V6 BUT AT DIFFERENT LEVELS
ABCG2
ATP binding cassette (ABC) transporters form one of the largest trans-membrane protein families. These proteins use cellular ATP to drive the transport of various substrates across cell membranes including drugs, metabolites and other compounds. Human ABCG2 is the second member of the G-subfamily of ABC transporters. ABCG2 was first cloned from doxorubicin-resistant human MCF-7 breast cancer cells and named as breast cancer resistance protein (BCRP) 153 ABCG2 is widely distributed in normal tissues and is highly expressed in a
subpopulation of stem cells. Its conserved expression in stem cell populations suggests an important role in stem cell biology. In addition, ABCG2 is one of the most important multidrug-resistance transporters and its substrates include many commonly used drugs in cancer chemotherapy 154. There is increasing evidence that ABCG2 correlates with unfavorable
prognosis in a variety of tumors 155. In a study conducted in a large cohort of esophageal cancer
patients (100), ABCG2 expression was found in 61% of tumor tissues [Figure 21]. The expression of ABCG2 was correlated with poor survival being an independent prognostic factor 156.
FIGURE 21 IMMUNOHISTOCHEMICAL OF ABCG2 IN TUMOR TISSUES OF ESCC. A SLIDE REPRESENTATIVE OF POSITIVE ABCG2
EXPRESSION, IN POORLY DIFFERENTIATED ESCC. B SLIDE REPRESENTATIVE OF NEGATIVE ABCG2 EXPRESSION, SHOWN IN MODERATELY DIFFERENT IATED ESCC.
27
Aims and Study design
Primary aims
To assess the feasibility of circulating esophageal cancer cells enrichment and their characterization
To evaluate the prognostic value of Circulating Esophageal Cancer Cells in esophageal cancer
Secondary aim
to characterize the identified cells, by molecular assays through cancer-related genetic alterations that will be identified by next generation sequencing (NGS) approaches.
Design
Blood samples (15-20 ml) from untreated/naive patients affected by metastatic and non-metastatic esophageal cancer will be assessed, including cervical esophagus, upper-middle-lower esophagus, esophagogastric junction.
Samples will be collected before primary therapy of choice (therapy, radio-chemiotherapy, radio-chemiotherapy), one month after therapy and, when possible, after surgery. For experimental Workflow see Figure 1.
Expected Outcomes
To confirm the feasibility of the detection of CTCs in a pathology where they are still poorly studied
To characterize CTCs in this disease
To investigate the correlation of CTCs and survival, progression-free survival and anatomical district
To investigate a potential biological explanation for esophageal cancer aggressiveness
28
Materials and Methods
Cell culture
Breast cancer cell lines MDA-MB 436, MDA-MB 231, MCF7 were originally purchased from American Type Tissue Culture. The non-tumorigenic breast epithelial cell line MCF10A, immortalized human mammary epithelial cells hTERT-HMECs (named HME), and the modified HME-TWIST1, HME-ZEB1, HME-ZEB2 over-expressing the EMT master transcription factors TWIST, ZEB1, ZEB2 respectively, were gifted by Professor Alain Puisieux laboratory.
MDA-MB 436, MDA-MB 231 cell lines were cultured in Leibovitz's L-15 medium (GIBCO) with 10 mcg/ml insulin(Sigma Aldrich), 100U/ml penicillin-streptomycin (GIBO), 2mM glutamine (GIBCO) complemented with 10% FBS (GIBCO), in a non free-gas exchange condition.
MCF7 cell line were cultured in Dulbecco’s Modified Eagle’s Medium (DMEM) medium (GIBCO) 100U/ml penicillin-streptomycin (GIBCO), 2nM glutamine (GIBCO) complemented with 10% FBS (GIBCO). HMEC-derivatives were cultured in 1:1 DMEM/HAMF12 medium (GIBCO) complemented with 10% FBS (GIBCO), 100 U/ml penicillin-streptomycin (GIBCO), 2 mM L glutamine (GIBCO), 10 ng/ml human epidermal growth factor (EGF) (Millipore), 0.5 mg/ml hydrocortisone (Sigma Aldrich) and 10 mg/ml insulin (Sigma Aldrich) as previously reported 88
MCF10A cell line were cultured in DMEM/F-12, GlutaMAX™ medium (GIBCO) complemented with 5% Horse Serum (New Zealand origin) (GIBCO), 100 U/ml penicillin-streptomycin (GIBCO), 2 mM L glutamine (Invitrogen), 100 mg/ml human epidermal growth factor (EGF) (Millipore), 1 mg/ml hydrocortisone (Sigma), 1mg/ml cholera toxin (Sigma Aldrich) and 10 mg/ml insulin (Sigma Aldrich), 100U/ml penicillin-streptomycin (GIBCO) as mentioned 157 .
All cell lines were maintained as a monolayer in a 37°C incubator with 5% CO2 and sub-cultured at 70-80% confluence (approximately twice weekly).
EMT induction
MCF10 cell line were cultured on 19,5cm2 petri dish (BD Falcon), using previously described
culture medium. Epithelial to mesenchymal transition were induced by treating cells with 10ng/ml TGF beta1 (Peprotech) every 48 hours or during sub-culturing.
Peripheral Blood Monuclear cells (PBMC) isolation
PBMC were isolated from healthy donor peripheral blood (PB). About 3ml of PB were drawn in EDTA tubes (BD Vacutainer, Becton Dickinson).A density gradient separation by Lymphocyte Separation Media (BioWest) was subsequently performed (400g centrifugation for 30 minutes). From the resulting blood stratification, the mononuclear cells (PBMC) interphase was carefully collected, washed and re-suspended in PBS1X. If samples had an erythrocyte contamination, a red blood lysis was performed by ACK lysis buffer (Lonza).
29
Immunofluorescence
Since original HME and their modified descendant cells are putative models of different levels of EMT, they were tested with a immunofluorescence assay based on a two antibodies combination to verify their levels of Epithelial-to-mesenchymal transition.
All the four types of HME cells were cultured on cover-glass and stained with anti-Vimentin FITC (BD Biosciences) and anti-E-cadherin (Miltenyi) both with a diluition of 1:100. Differences between the positivity of these two markers reflect different levels of EMT: E-cadherin + / Vimentin – identifies epithelial cells, E-cadherin – / Vimentin + identifies mesenchymal cells, whereas E-cad+/Vim+ reveals intermediate levels of EMT.
DEPArray calibration settings
Since DEPArray system is a fluorescence microscope-based lab-on-a-chip (see Appendix 2 for details), a preliminary setup was needed in order to detect only specific signals.
The brightest fluorochromes respectively PE and APC were selected for Epithelial and Stem/Mesenchymal tags, respectively. FITC channel was designed to identify lymphocytes marker CD45. DAPI was used to counterstain cell nuclei.
A three steps setup was carried out with MDA MB436 cell line and PBMC stained with different clusters of antibodies (one tag per step). The first the two cell types mix was stained for the Epithelial tag and CD45, the second for the Stem/Mesenchymal tag and CD45 and the third with all tags and CD45.
Briefly, cells were firstly stained with primary antibodies for membrane targets. After membrane labeling, samples were rinsed and fixed by Inside Fix Buffer (Miltenyi), permeabilized using Inside Perm buffer (Miltenyi) and labeled for intracytoplasmic targets. All the antibodies used were monoclonal and conjugated with a specific fluorochrome.
For a detailed specification of antibodies refers to Table1
Antibody Fluorochrome Clone Manufacturing Dilution
EpCAM PE HEA-125 Miltenyi 1:10
Pan CK PE C11 Aczon 1:10
E-cadherin PE 67A4 Miltenyi 1:10
N-cadherin AlexaFluor 647 8C11 BD Pharmingen™ 1:20
CD44v6 APC 2F10 R&D Systems 1:20
ABCG2 APC 5D3 R&D Systems 1:10
CD45 AlexaFluor 488 GA90 Aczon 1:14
TABLE1ANTIBODIES SPECIFICATIONS
30
Cell types Experiment 3 Antibody Fluorochrome
Lymphocytes EPITHELIAL TAG STEM/MESENCYMAL TAG LYMPHOCYTE EpCAM PE Pan CK PE E-cadherin PE N-cadherin AlexaFluor 647 CD44v6 APC ABCG2 APC CD45 AlexaFluor 488
TABLE 2EXPERIMENT 1 SPECIFICATIONS
Cell types Experiment 3 Antibody Fluorochrome
MDA MB-436 Lymphocytes EPITHELIAL TAG LYMPHOCYTE EpCAM PE Pan CK PE E-cadherin PE CD45 AlexaFluor 488
TABLE 3EXPERIMENTS 2 SPECIFICATIONS
Cell types Experiment 3 Antibody Fluorochrome
MDA MB-436 Lymphocytes STEM/MESENCHYMAL TAG LYMPHOCYTE N-cadherin AlexaFluor 647 CD44v6 APC ABCG2 APC CD45 AlexaFluor 488
TABLE 4EXPERIMENT 3 SPECIFICATIONS
During DEPArray “Scan” step every channel exposure times was adjusted to minimize unspecific signals (e.g. autofluorescence traceable by FITC channel) and to display only distinct signals.
31 The muti-phenotypic tag Grab all-assay was tested on the two different EMT models: MCF10A treated with TGF beta and HME transfected with EMT master regulators TFs.
In order to arrange a wide EMT spectrum modification, samples of MCF10A treated cells were collected at specific time points reflecting morphological modifications. Four different stages of EMT on MCF10A cells were selected: at baseline, after four days, after six days and after ten days of treatment.
HME, HME-TWIST1, HME-ZEB1, HME-ZEB2 cell lines were cultured at selective conditions i.e. for transfected cells, culture media were addicted with selective antibiotics.
All collected samples were stained as previously described for DEAParray calibration experiments.
All the analysis were performed by DEPArray system using settings previously determined.
Grab all-assay on esophageal cancer patients and
healthy donors
Patients aged ≥18 years with a diagnosis of M0 and M1 esophageal cancer were enrolled. M1 patients were selected as potential CTC-positive controls. Patients were treated at Irccs Istituto Scientifico Romagnolo per lo Studio e la Cura dei Tumori (I.R.S.T.) (Italy) between January 2013 and December 2015. All M0 patients received adjuvant therapy, referred as primary therapy (chemotherapy and radiotherapy), before surgery (referred as secondary therapy according to the local institutional practice).
The blood draw from M0 patients was performed before primary treatment (1° CTC analysis), after primary treatment/before-secondary treatment (2°CTC analysis) and after secondary treatment/follow-up (3°CTC analysis). Blood draw from M1 patients was performed at baseline before I line chemotherapy (1° CTC analysis) after I line chemotherapy (2°CTC analysis) and eventually after II line chemotherapy (3° CTC analysis).
Patients and healthy donors signed a written informed consent. This study was approved by the Ethics Committee of the IRST IRCCS AVR (CEIIAV) (reference L3P957) and an amendment dated March 2015 was approved by the CEIIAV.
Blood sampling was carried out in EDTA Vacutainer tubes (BD).
Three tubes were collected: a first 3ml, which was discarded due to possible skin epithelial cell contamination, and two 9 ml tubes, that were utilized for the CTC test.
For CTCs enrichment, Oncoquick™ system was used according to manufacturer’s protocol and previous studies 158.Enriched samples was stained with Grab all-assay as DEPArray calibration