UNIVERSITA’ DEGLI STUDI DI MESSINA
Ph.D. IN ECONOMICS, MANAGEMENT AND STATISTICS
XXXIII Cycle
Coordinator:Prof. Edoardo OTRANTO
Essays on Inequality, Automation
and Globalisation
Ph.D. Candidate:
Dr. Antonio Francesco GRAVINA
Supervisor: Prof. Emanuele MILLEMACI
Co-Supervisors: Prof. Michele BATTISTI Prof. Neil FOSTER-McGREGOR Prof. Matteo LANZAFAME
A thesis submitted in partial fulfilment of the requirements
for the degree of Doctor of Philosophy
in the
A
UTHOR
’
S DECLARATION
I
, Antonio Francesco Gravina declare that this thesis, titled “Essays on Inequality, Automation and Globalisation”, submitted in partial fulfilment of the requirements for the award of Doctor of Philoso-phy, in the Department of Economics at the University of Messina, Italy, is wholly my own work unless otherwise referenced or acknowledged. I certify that:• This work was done wholly or mainly while in candidature for a research degree at this University.
• Where any part of this thesis has previously been submitted for a degree of any other qualification at this University or any other institution, this has been clearly stated.
• Where I have consulted the published work of others, this is always clearly attributed.
• Where I have quoted from the work of others, the sources is always given. With the exception of such quotations, this thesis in entirely my own work.
• Where the thesis is based on work done by myself jointly with others, this is always clearly attributed.
SIGNATURE:
[Antonio Francesco Gravina]
DATE: December 1, 2020 PLACE: Messina, Italy
A
BSTRACT
T
he surge of automation technologies and globalisation is fuelling concerns about their potential to cause the disappearance of many traditional jobs and exacerbate disparities. Relatedly, the joint contribution of trade wars, higher robotisation and the ongoing COVID-19 pandemic is exerting additional pressure upon a complete rearrangement of productive activities and spurring an increasingly intense debate. Despite the growing interest, however, the empirical evidence on these topics is far from conclusive. The present Ph.D. dissertation is aimed at contributing to the current debate with three empirical works, tackling the inequality issue. Specifically, Chapter1deals with the determinants of income inequality, relying on a panel of 90 advanced and emerging economies, with data spanning the years 1970-2015. Results show that technology and globalisation are nonlinearly correlated with inequality, depicting shaped and inverted U-shaped relationships, respectively. The evidence suggests that these inequality determinants produce opposite effects, depending on threshold values and levels of economic development. Chapter2assesses the impact of advances in robotics, intangible technologies and globalisation on relative wages, following the skill-biased technical change and polarisation of the labour force frameworks. The analysis is performed on data for a panel of 18 mostly European economies and 6 industries over 2008-2017. Main results indicate that intangible technologies and globalisation measures either benefit high-skilled workers or give rise to polarising effects. Finally, Chapter3investigates the existence of robotic capital-skill complementarity, according, among others, to the race between education and technology. Relying on a constructed measure of robotic capital stock, we test the hypothesis of a lower elasticity of substitution between robotic capital and skilled labour. The study is carried out using two OECD country-sector samples and different frameworks, with results pointing to a higher complementarity between robotic capital and skilled labour. Furthermore, we find evidence that robotic and ICT capital equipment produce polarising effects.In essence, the present work sheds further light on the relevance of automation technologies and globalisation as powerful forces in shaping inequalities. As such, policymakers are called to set suitable measures to address the struggles that workers will face.
D
EDICATION
T
ABLE OF
C
ONTENTS
List of Figures xi
List of Tables xiii
1 Finance, Globalisation, Technology and Inequality: Do
Nonlin-earities Matter? 1
1.1 Introduction . . . 2
1.2 Overview of related literature . . . 4
1.3 Data and empirical framework . . . 9
1.3.1 Panel estimations and econometric issues . . . 11
1.4 System-GMM estimation results . . . 13
1.4.1 Robustness analysis . . . 17
1.5 Testing for monotonicity in nonlinear relationships . . . 20
1.6 Conclusions . . . 26
2 Automation, Globalisation and Relative Wages: An Empirical Anal-ysis of Winners and Losers 29 2.1 Introduction . . . 30
2.2 Related literature . . . 32
2.3 Data and descriptive statistics . . . 36
2.4 Empirical models and estimation strategy . . . 44
2.5 Basic results and discussion . . . 46
2.6 Robustness and extensions. . . 49
2.6.1 Globalisation . . . 49
2.6.2 Labour Market Regulations. . . 52
TABLE OF CONTENTS
3 Robotic capital-skill complementarity 59
3.1 Introduction . . . 60
3.2 Robotisation and labour market related literature . . . 62
3.3 Data . . . 66
3.3.1 The datasets . . . 66
3.3.2 Robotic capital penetration in advanced economies. . . 67
3.4 Robotisation and skill composition change . . . 72
3.4.1 Production function with different types of capital . . . 72
3.5 Econometric Analysis . . . 76
3.5.1 Parametric nonlinear models and estimation strategy . . . . 76
3.5.2 Benchmark estimation results . . . 79
3.6 Robustness checks . . . 81
3.7 Does robotic capital produce polarising effects? . . . 82
3.8 Concluding remarks . . . 85
Appendix Chapter 1 87 A Additional Tables . . . 87
Appendix Chapter 2 91 B Additional Figures and Tables. . . 91
Appendix Chapter 3 99 C1 The measurement of the robotic capital stock . . . 99
C2 Countries and industries . . . 101
C2.1 List of countries . . . 101
C2.2 List of industries . . . 103
C3 Descriptive statistics and figures . . . 104
C4 Derivation of the Eden and Gaggl (2018) specification . . . 110
C5 Derivation of the Taniguchi and Yamada (2019) specification . . . . 111
C5.1 Four-factors production function . . . 111
C5.2 Six-factors production function . . . 112
C5.3 The rental price of capital . . . 115
C6 Parametric estimation results . . . 117
TABLE OF CONTENTS
L
IST OF
F
IGURES
FIGURE Page
1.1 Location of advanced and emerging economies with respect to the esti-mated threshold value for Economic Globalisation Index. . . 23
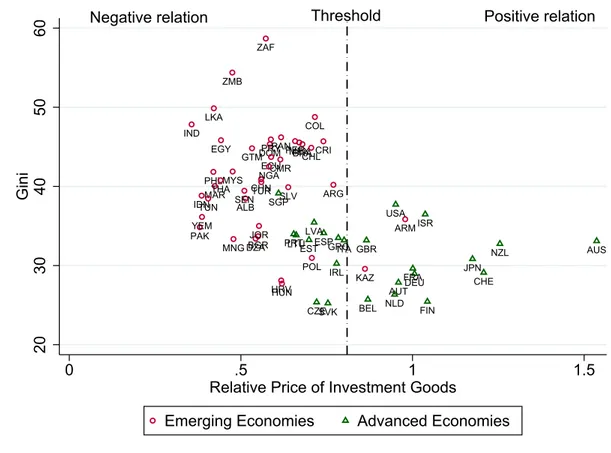
1.2 Location of advanced and emerging economies with respect to the esti-mated threshold value for Relative Price of Investment Goods. . . 24
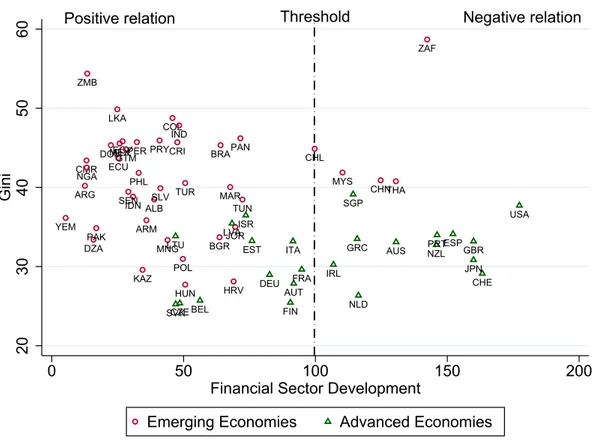
1.3 Location of advanced and emerging economies with respect to the esti-mated threshold value for Financial Sector Development. . . 25
1.4 Location of advanced and emerging economies with respect to the
esti-mated threshold value for Rate of Change of Urban Agglomerations.. . 26
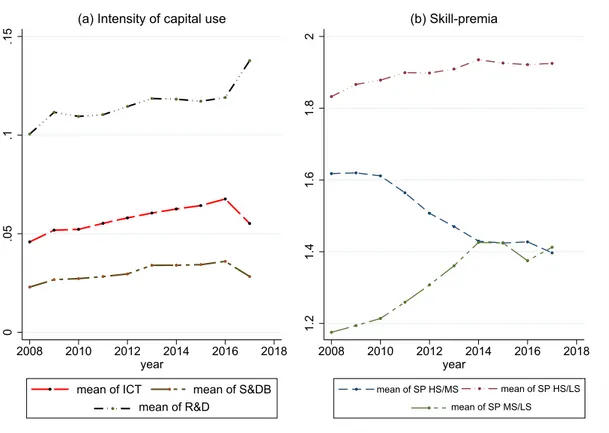
2.1 Developments in the Intensity of Technology Use and the Skill Premia 43
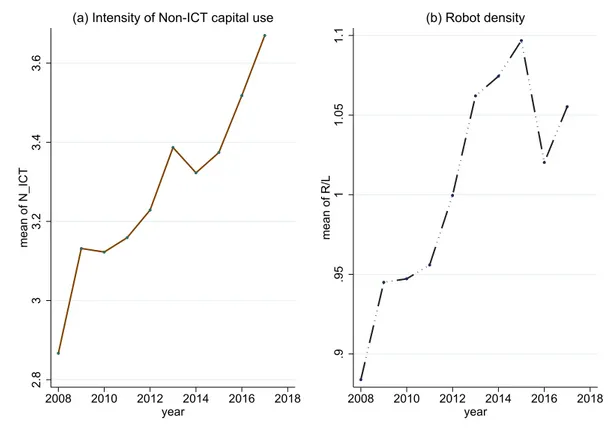
2.2 Developments in the Intensity of Non-ICT capital Use and Robot Density 44
3.1 Capital stock evolution, 1997-2005 . . . 68
3.2 Share of robotic capital in EU KLEMS countries and industries, 1997-2005 69
3.3 Robot density, 1995-2017 . . . 70
3.4 Relative cost of robots, 1998-2008 . . . 71
B.1 Developments in the skill-premium of high to medium skilled workers, 2008-2017 . . . 91
B.2 Developments in the skill-premium of high to low skilled workers, 2008-2017 . . . 92
B.3 Developments in the skill-premium of medium to low skilled workers, 2008-2017 . . . 93
C3.1 Share of robotic capital in WIOD countries and industries, 1997-2009 . 107
C3.2 Robotic capital evolution in selected WIOD countries, 1997-2009 . . . . 108
L
IST OF
T
ABLES
TABLE Page
1.1 Descriptive statistics. . . 12
1.2 S-GMM regression results: Dependent variable is Gini Coefficient . . 16
1.3 S-GMM robustness checks results: Dependent variable is Gini Coefficient 19 1.4 Tests for U-shape and Inverse U-shape: Model v5 . . . 22
2.1 List of Sectors . . . 37
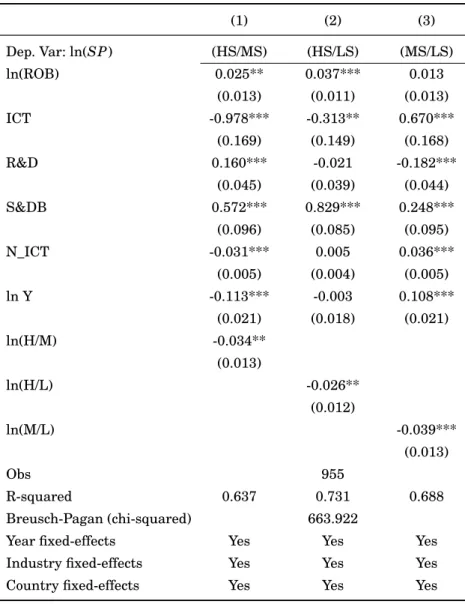
2.2 Regression Results of Relationship between Tangible and Intangible Investments and Relative Wages . . . 48
2.3 Regression Results with Globalisation Variables . . . 51
2.4 Regression Results with Labour Market Regulations . . . 54
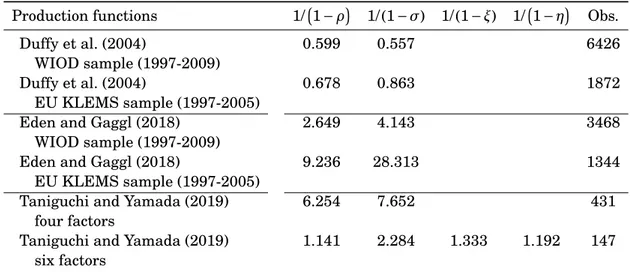
3.1 Estimated elasticities of substitution . . . 80
3.2 Estimated elasticities of substitution (robotic capitalδ = 5%) . . . 82
3.3 Estimated elasticities of substitution (robotic capitalδ = 15%). . . 82
3.4 Estimated elasticities of substitution (high- and medium-skilled vis-à-vis low-skilled labour) . . . 83
3.5 Estimated elasticities of substitution (high- vis-à-vis medium-skilled labour) . . . 84
3.6 Estimated elasticities of substitution (medium- vis-à-vis low-skilled labour) . . . 84
A.1 List of countries included in the analysis . . . 87
A.2 Data sources and coverage . . . 88
A.3 Fixed-effects regression results: Dependent variable is Gini Coefficient 89 B.1a Summary Statistics: Levels Averaged by Country . . . 94
LIST OF TABLES
B.2a Summary Statistics: Levels Averaged by Country . . . 96
B.2b Summary Statistics: Levels Averaged by Industry . . . 97
C2.1a List of EU KLEMS countries . . . 101
C2.1b List of WIOD countries . . . 102
C2.2 List of WIOD and EU KLEMS industries . . . 103
C3.1a Main variables’ average by Country. . . 104
C3.1b Main variables’ average by Industry . . . 105
C3.2a Main variables’ average by Country. . . 106
C3.2b Main variables’ average by Industry . . . 106
C6.1 Benchmark NLLS and GMM parameter estimates. . . 117
C6.2 Robustness checks: GMM parameter estimates (robotic capitalδ = 5%) 118 C6.3 Robustness checks: GMM parameter estimates (robotic capitalδ = 15%)119 C6.4 Robustness checks: NLLS and GMM parameter estimates (high- and medium-skilled vis-à-vis low-skilled labour) . . . 120
C6.5 Robustness checks: GMM parameter estimates (high- vis-à-vis medium-skilled labour) . . . 121
C6.6 Robustness checks: GMM parameter estimates (medium- vis-à-vis low-skilled labour) . . . 122
C6.7 Estimated elasticities of substitution (high- vis-à-vis low-skilled labour)122 C6.8 Robustness checks: GMM parameter estimates (high- vis-à-vis low-skilled labour) . . . 123
C
H A P T E R1
F
INANCE
, G
LOBALISATION
, T
ECHNOLOGY AND
I
NEQUALITY
: D
O
N
ONLINEARITIES
M
ATTER
?
†Abstract
R
elying on data for a panel of 90 economies over 1970-2015 and System-GMM estimations, we extend the standard Kuznets-curve empirical framework to investigate how financial development, globalisation and technology affect income inequality. Our findings reveal the presence of significant nonlinearities, consistent with either U-shaped or inverted U-shaped relationships. As such, depending on whether a certain threshold value is achieved, the same determinants of income distribution can exert opposite effects in different countries. Globalisation is associated with increasing inequality in most advanced economies, but to falling disparities for the large majority of emerging economies. Further, while the effects for advanced economies are mixed, technology and financial development lead to increasing inequality for most emerging economies. Hence, particularly in countries in earlier stages of development, policymakers aiming at fostering growth via technological progress or financial development should also consider the nature of the trade-offs with inequality and how policy can improve them.Keywords: Inequality, Globalisation, Technology, Finance, Nonlinearity JEL classification: C01, C33, F63, O11, O15, O33
†A preliminary version of this paper, titled “Technology, Nonlinearities and the Determinants of Inequality; New Panel Evidence” and co-authored with Matteo Lanzafame, was presented to the EDEEM Doctoral Summer Workshop in Economics (2019), the 7thSIdE-IEA Workshop for PhD students in Econometrics and Empirical Economics (WEEE) and the 60thAnnual Conference (RSA) of the Italian Economic Association (SIE).
CHAPTER 1. FINANCE, GLOBALISATION, TECHNOLOGY AND INEQUALITY: DO NONLINEARITIES MATTER?
1.1
Introduction
The economic determinants of inequality are the subject of a substantial and growing literature, reignited in the last decade by the questions on the causes and consequences of the Great Recession. Though the debate is still open, in re-cent years economists have reached a significant consensus on the role played by some factors as key drivers of income distribution dynamics: namely, globali-sation, financial sector development and technological progress (e.g.,Milanovi´c,
2016;Bourguignon,2017;Nolan et al.,2019). Nonetheless, many questions remain regarding the relative importance of these forces and, therefore, the appropriate policies to achieve a more egalitarian distribution of income without harming economic growth.
The large number of empirical studies in the field rely on different methodolo-gies, estimation techniques and data. Crucially, they also often provide conflicting results – an outcome which may be due to several possible gaps in the existing empirical literature. For instance, most of the available research focuses on the abovementioned three key factors separately, thus providing only a partial view of the sources of inequality. Another estimation issue often not properly considered is variable endogeneity, due to feedback effects from income inequality to its determi-nants which can be associated with the various channels.1 Most importantly, lack of a consistent treatment of nonlinearities is an additional critical issue, typically addressed only partially and with respect to individual channels (e.g.,Figini and Görg,2011;Jauch and Watzka,2016). Nonlinear effects may, among other things, be critical to explain different findings with respect to the same inequality deter-minants in advanced and emerging economies – as these two groups of countries are typically characterised by a sizeable divide in terms of openness, technology and financial development. For instance, if a minimum degree of financial
devel-1Several contributions in the literature have explored the mechanisms via which inequality can influence social and economic outcomes, such as economic growth (Galor and Zeira,1993;Persson
and Tabellini,1994;Alesina and Rodrik,1994;Aghion et al.,1999;Barro,2000;Forbes,2000;Chen,
2003;Banerjee and Duflo,2003); the relation between socio-political instability and investments
(Alesina and Perotti,1996); the escape from extreme poverty (Ravallion,1997); happiness, health
and well-being (Easterlin,1974;Subramanian and Kawachi,2006;Clark et al.,2008).
1.1. INTRODUCTION
opment is required for this driver to reduce (rather than increase) inequality, we may expect financial development to initially lead to greater income disparities in most emerging economies. This also highlights that the presence of significant nonlinearities in the relationship between inequality and its determinants bears relevant policy implications.
Against this backdrop, this paper provides several contributions to the liter-ature on the cross-country determinants of inequality.2Relying on a panel of 90 advanced and emerging economies and annual data over 1970-2015, we extend the standard ‘Kuznets-curve’ (Kuznets,1955) empirical framework and investi-gate the role played by technological progress, globalisation and financial sector development, assuming potentially nonlinear effects for all these factors. In so doing, we combine insights from two recent strands of the literature: the first com-prises studies considering more than one of the main inequality determinants, but treats their effects as linear (e.g.,Jaumotte et al.,2013;Dabla-Norris et al.,2015); the second includes research allowing for nonlinearities, but typically focusing on the various inequality determinants individually (e.g.,Figini and Görg,2011;
Nikoloski,2013). To deal with variable endogeneity and persistence in inequality, estimations are based on dynamic panel data specifications and System-GMM techniques (Arellano and Bover,1995;Blundell and Bond,1998). Furthermore, taking account of the issues relating to the ambiguous influence of technological progress, we rely on proxies for two technological categories: Investment-Specific Technology (IST), which influences directly firms’ production processes but only in-directly other economic agents; General-Purpose Technology (GPT), which includes technological innovations that, contrary to IST, gradually assume widespread and direct effects on consumers’ and other economic agents’ incomes.
The key results of the paper support the hypothesis of significant nonlinearities for the main determinants of income inequality, with relations characterised by well-identified extreme points. This outcome has important implications for
cross-2Studies focusing on cross-country investigations of inequality drivers includeLi et al.(1998),
Gustafsson and Johansson (1999),Barro(2000),Vanhoudt(2000),Frazer(2006),Roine et al.
(2009) andCastells-Quintana(2018) for advanced and emerging economies. Further relevant contributions are byFields(1979),Milanovi´c(2000),Odedokun and Round(2004), and
CHAPTER 1. FINANCE, GLOBALISATION, TECHNOLOGY AND INEQUALITY: DO NONLINEARITIES MATTER?
country differences in inequality dynamics. Specifically, globalisation, technology and financial development are found to affect income inequality differently depend-ing on whether countries have reached a certain threshold value – as a result, in many cases these same drivers are associated with opposite effects in advanced and emerging economies.
The remaining part of the paper is organised as follows: Section1.2presents an overview of the literature; Section1.3illustrates the data and the empirical framework used; Section1.4presents the estimation results; Section 1.5 inves-tigates further the nature of nonlinearities in the relation between inequality and its determinants, and discusses the implications for advanced and emerging economies. Finally, Section1.6concludes.
1.2
Overview of related literature
Much of the empirical literature investigating the role of globalisation, technolog-ical progress and financial sector development as drivers of inequality leads to mixed results. For instance, focusing on the interplay between globalisation and income inequality,Chen(2007),Gourdon et al.(2008) andHelpman et al.(2017) observe that greater openness to trade is associated with an increase in wage disparities, whereasReuveny and Li(2003) andJaumotte et al.(2013) come to the opposite conclusion. Moreover, in the context of financial globalisation,Furceri and Loungani(2018) find evidence of growing income disparities associated with capital account liberalisation reforms, whereasYu et al.(2011) observe a modest impact of foreign direct investment (FDI) on China’s regional income inequality. Similarly, conflicting results have emerged for the finance-inequality nexus. Among others,
Beck et al.(2007),Agnello et al.(2012),Hamori and Hashiguchi(2012) andKappel
(2012) provide evidence pointing to a decrease in wage disparities associated with greater financial sector development, while the findings inJaumotte et al.(2013) andJauch and Watzka(2016) support the opposite hypothesis. Additionally, with specific reference to India, Ang(2010) observes that a well-developed financial system helps to mitigate inequalities, while financial liberalisation exacerbates them.
1.2. OVERVIEW OF RELATED LITERATURE
The available evidence is even less clear-cut when it comes to the role played by technological progress, since different forms of technological innovations are typically difficult to define and measure. Considering the evidence,Iacopetta(2008) points out that price-cutting technological progress is associated with a reduction in inequality, whereas product innovations increase it. Meanwhile, studies on the so-called skill-biased effects of technology provide strong evidence that technological progress raises income inequalities between skilled and unskilled workers (Katz and Murphy,1992;Goldin and Katz,2009;Chowdhury,2010;Acemoglu and Autor,
2011). With specific reference to GPTs,Aghion(2002) find that technology raises long-run within-group inequality boosting demand for adaptable workers and their market premium, whereasJacobs and Nahuis(2002) observe a fall in real wages for unskilled workers. Meanwhile,He and Liu(2008) argue that IST innovations can explain the rise in wage inequality experienced since the early 1980s in the United States. Further,Krusell et al.(2000) find that improvements in ISTs, as proxied by the decline in the relative price of investment goods, increase the wage gap between skilled and unskilled workers. The decrease in the relative price of investment goods is also shown to explain around half of the decline in the labour share of income byKarabarbounis and Neiman(2014).
One possible explanation for the aforementioned inconclusive empirical ev-idence is linked to nonlinearities, which a number of theoretical contributions have proposed as a key feature of the relationship between inequality an its main drivers.
With respect to globalisation, classic trade theory suggests a clear link between trade and inequality. TheStolper and Samuelson(1941) theorem posits that greater trade openness increases the return of the relatively abundant factor – as such, by spurring specialisation according to comparative advantage, trade leads to falling inequality in emerging economies where low-skilled labour is relatively abundant. For the same reason, trade raises skilled-labour wages and income disparities in advanced economies. Relying on a two-country (North vis-à-vis South), two-factor continuum-good model,Xu(2003) shows that these mechanisms may be nonlinear and dependent on the degree of trade openness. Since trade protection makes some potentially-tradable skill-intensive goods nontraded, in his model a tariff reduction has two effects in the South: it expands the import set, implying an
inequality-CHAPTER 1. FINANCE, GLOBALISATION, TECHNOLOGY AND INEQUALITY: DO NONLINEARITIES MATTER?
reducing effect by decreasing high-skilled wages; it worsens the South’s terms of trade, thus expanding its export set by improving its price competitiveness – this provides an inequality-boosting effect. The export-expansion effect can dominate import expansion, so that a tariff reduction in the South beyond a certain threshold increases both the South’s and the North’s skilled-labour wages. As a result, there is a U-shaped relationship between wage inequality and the tariff rate – when the tariff rate is below (above) the threshold, further trade liberalisation increases (lowers) wage inequality. Other theoretical approaches, however, postulate the ex-istence of an inverted U-shaped interplay between globalisation and inequality in emerging economies. In this regard,Helpman et al.(2010) develop a framework to investigate the determinants of wage distributions focusing on within-industry re-allocation, labour market frictions and differences in workforce composition across firms. In their model, changes in trade openness have a nonmonotonic, inverted U-shaped effect on wage inequality – specifically, while disparities are higher in the open-economy equilibrium than in autarky, gradual trade liberalisation first raises and then lowers inequality. This hump-shaped pattern is confirmed byHelpman et al. (2017), who extend the model in Helpman et al. (2010) to allow for firm heterogeneity in productivity, fixed exporting costs and worker screening. Similarly,
Bellon(2018) provides a micro-founded model where, following trade liberalisation, the reallocation dynamics between heterogeneous firms and workers lead to an inverted U-shaped rise in inequality.3Meanwhile, focusing on a non-trade aspect of globalisation,Figini and Görg(2011) present a model in which FDI acts as a channel for technological transfers from advanced to emerging economies. The early waves of FDI by multinational enterprises introduce new technologies in the host country, thus widening the wage gap between skilled and unskilled workers. But further waves of FDI allow domestic firms to imitate the multinationals’ pro-duction technologies, and this is reflected in a repro-duction of wage disparities. This FDI-driven diffusion mechanism exemplifies one possible nonlinear link be-tween technology and inequality – but others have also been proposed in the
3On the various channels leading to complex skill-biased effects of trade, in particular via outsourc-ing and offshoroutsourc-ing activities, see alsoFeenstra and Hanson(1996),Glass and Saggi(2001) and
Grossman and Rossi-Hansberg(2008) among others.
1.2. OVERVIEW OF RELATED LITERATURE
literature. Theoretical approaches focusing on skill-biased technical change in-dicate that technological innovations are typically associated with increases in inequality (Katz and Murphy,1992;Goldin and Katz,2009;Acemoglu and Autor,
2011). New technologies are assumed to be complementary to high-skilled labour, resulting in higher relative demand for these workers and a growing wage gap between high- and low-skilled labour. Conversely, however, contributions tracing back to Kuznets (1955) suggest that, by disrupting existing sources of wealth, technological progress may also promote a more equal income distribution. Several studies in the literature illustrate how these opposing mechanisms can give rise to a nonlinear relationship between technology and inequality. In particular, theoretical approaches developed byGalor and Tsiddon(1997),Aghion et al.(1998),Helpman
(1998) andConceição and Galbraith(2012) result in an inverted U-shaped pattern. The intuition is that, when technology adoption differs between sectors and inter-sectoral labour mobility is slow and/or imperfect, technological innovations tend to initially raise inequality. This is because only a small number of workers, employed in the technologically-advanced sectors, benefit from innovations. As wages rise and more people move into the advanced sectors, inequality and per-capita GDP both tend to rise. Subsequently, when the gains from technological progress start to be shared more evenly, wage and income disparities gradually shrink too.
Theoretical frameworks developed to investigate the relationship between fi-nancial depth and inequality provide a similarly varied picture – with some studies indicating financial development reduces inequality, others pointing to inequality-widening effects and others still supporting an inverted U-shaped relationship. Contributions in the inequality-narrowing camp includeGalor and Zeira(1993), who develop a model where economic growth depends on human capital investment and is influenced by the features of capital markets. One of the main results of the study is that, in the presence of financial-market imperfections and tight borrowing constraints for poor households, a country characterised by high income disparities will perpetuate cross-generational differences in human capital investments and inequality, and will grow slower than more egalitarian counterparts. Analogously,
Banerjee and Newman(1993) propose a three-sector model with credit constraints in which two of the technologies require indivisible investments. In such a context, higher initial wealth inequality forces poor agents to work for entrepreneurs –
CHAPTER 1. FINANCE, GLOBALISATION, TECHNOLOGY AND INEQUALITY: DO NONLINEARITIES MATTER?
the only agents who can borrow enough to invest and profit from risky but high-return projects. Consequently, both forGalor and Zeira(1993) andBanerjee and
Newman (1993), a more developed and inclusive financial sector weakens the
link between an individual’s initial wealth and entrepreneurship, thus boosting investment and economic growth as well as narrowing income gaps. Contrary to this, several arguments have been proposed to support the inequality-widening hypothesis for financial development. Among others,Lamoreaux(1996),Rajan and Zingales(2003) andHaber(2004) argue that, even in the case of well-functioning financial institutions, only wealthier and politically connected agents will benefit from getting access to credit – so that financial-sector development may exacer-bate the rich-poor income divide.4 Similarly opposing arguments are reconciled by
Greenwood and Jovanovic(1990), who show that the relationship between finan-cial development and inequality can follow an inverted U-shaped pattern. These authors propose a model where financial sector development and economic growth are endogenously determined. In the early stages of development, only wealthier agents can afford the high fixed costs of credit to finance their investment projects. This fosters savings and economic growth, but the aggregate income gains come at the expense of a more unequal distribution. In the model, this outcome holds until credit becomes more accessible for a larger part of economic agents. Once a certain threshold financial-development is eventually surpassed, a mature financial sector promotes a more egalitarian income distribution by providing gradually wider access to financial services – so that an increasing share of less-affluent agents can share in the proceeds of growth.
Overall, therefore, while there are several reasons to expect the effects of globalisation, technological change and financial development on inequality to be nonlinear, theory-based predictions regarding the pattern of these nonlinear-ities are not unambiguous. As a result, this is ultimately an empirical question and in this case too, the available findings are mixed. For instance, in relation to globalisation,Dobson and Ramlogan(2009) andJalil(2012) highlight the likely
4Clarke et al.(2006) suggest a further rationale for the positive relation between financial
de-velopment and inequality. Specifically, being instrumental in fostering the dede-velopment of more technologically-advanced and unequal sectors, financial development may increase overall income inequality in economies transitioning from traditional to modern production structures.
1.3. DATA AND EMPIRICAL FRAMEWORK
existence of a curvilinear relationship between international trade and inequality – the ‘Openness Kuznets-curve’ – for some Latin American countries and China.
Moreover,Figini and Görg(2011) find that foreign direct investment has positive effects on wage disparities in advanced economies but a negative impact in emerg-ing economies, notemerg-ing the presence of an inverted U-shaped curve for this channel. With respect to financial development, empirical evidence supporting the inverted U-shaped hypothesis – the ‘Financial Kuznets-curve’ – advanced byGreenwood and Jovanovic(1990) has been provided byClarke et al.(2006),Nikoloski(2013) andJauch and Watzka(2016) both for advanced and emerging economies, as well as byBaiardi and Morana(2018,2016) for the Euro area. In contrast, findings by
Tan and Law(2012) andBrei et al.(2018) indicate a U-shaped pattern.
To sum up, while the theoretical literature reveals that each one of these three drivers is likely to have an impact on income inequality via nonlinear mechanisms, most empirical studies are still based on linear specifications and/or examine their effects on inequality separately – thus providing mixed empirical evidence. In what follows, we aim at filling these gaps.
1.3
Data and empirical framework
The empirical analysis carried out in this paper is based on a panel of annual data for 90 countries (33 advanced and 57 emerging economies) over the 1970-2015 period.5 The countries included in the panel and the data sources are reported, respectively, in TablesA.1 andA.2in the Appendix. We estimate dynamic panel data models relying on a sample of 9 (non-overlapping) five-year periods.6The use of five-year averages is common in the panel literature on inequality (e.g.,Ostry et al.,2014;Sturm and De Haan,2015), particularly because it reduces the impact of business cycle effects and data gaps on the estimates. Moreover, averaging is especially useful in studies based on GMM estimation of macro-panels such as ours, since it decreases the likelihood of overfitting by holding down the number of
5The time-period of analysis and the countries considered are determined by data availability. 6Given that the overall time-series length is 46 years, the last sub-period considers a 6-year average
CHAPTER 1. FINANCE, GLOBALISATION, TECHNOLOGY AND INEQUALITY: DO NONLINEARITIES MATTER?
instruments.
Following much of the recent literature (e.g.,Jauch and Watzka,2016; Castells-Quintana,2018;Baiardi and Morana,2018), income inequality is measured by the Gini index (Gini) based on data from the Standardized World Inequality Database (SWIID). Our baseline models include the following regressors:
• GDPPC: Real GDP per-capita (in thousands of 2011 US dollars at chained
purchasing power parity). GDPPC is included in the analysis to take account
of the Kuznets (1955) hypothesis of an inverted-U relationship between income inequality and economic development;
• EGI: Economic Globalisation Index. Ranging from 0 to 100, with higher values indicating a more globalised economy, EGI summarises the degree of economic and financial globalisation considering the intensity of foreign trade and financial flows, as well as restrictions such as hidden import barriers, customs tariffs and investment limitations. As such, it allows revisiting the issue of nonlinearities in the relationship between inequality and ‘openness’ (e.g.,Dobson and Ramlogan,2009;Figini and Görg,2011) taking account of various aspects of globalisation;
• GPT: Drawing on the relevant literature, we rely on the following GPT proxies:
¦ Energy Use (tons of oil equivalent per-capita). Energy allows the trans-formation of raw materials into intermediate or final goods, and the direct provision of services for domestic and other uses. Along with these features, its pervasiveness, versatility and widespread availability make of energy use a reliable GPT proxy (e.g.,Dalgaard and Strulik,2011). Moreover, the role played by energy as an engine of industrialisation and economic development (e.g., Mokyr,1992; Fouquet and Pearson,
1998) suggests a Kuznets-curve type of relation between Energy Use and Gini (e.g.,Muller,1988);
¦ Air Transport, Passengers Carried (per 100 people). Air transport has over time evolved into a pervasive technology (Jovanovic and Rousseau,
2005;Lipsey et al.,2005;Ruttan,2006), underpinning an industry which
1.3. DATA AND EMPIRICAL FRAMEWORK
is now a key driver of economic development, boosting employment, tourism, local businesses and international trade (e.g.,OECD,1997). The available empirical evidence is supportive of a negative correlation between Air Transport and income inequality (e.g.,Wu and Hsu,2012;
Li and DaCosta,2013);
¦ Mobile Cellular Subscriptions (per 100 people). Several studies suggest that, especially in emerging economies, mobile phone penetration can be considered an appropriate proxy for technological progress (e.g.,Aker and Mbiti, 2010; Naughton, 2016). In line with the evidence in the literature (e.g.,Asongu,2015), the expected sign on the coefficient for Mobile Cellular Subscriptions is negative;
• IST: Relative Price of Investment Goods. Since IST innovations are expected to reduce the relative price of capital goods, this indicator is commonly used as an IST proxy in the literature (e.g., Krusell et al., 2000). The index is constructed as the ratio of the price level of capital formation to the price level of household consumption, so that a fall in Relative Price of Investment Goods indicates IST progress. IST affects directly only the production side of the economy (e.g.,Greenwood et al.,1997;Karabarbounis and Neiman,
2014), so whether it plays a similar role with respect to GPT is an empirical question;
• FIN: Financial Sector Development Index. FIN is defined as private credit (by deposit money banks and other financial institutions) over GDP. The large literature using FIN as a proxy for financial sector development provides consistent evidence of an inverted-U relationship with income inequality (e.g.,Clarke et al.,2006;Nikoloski,2013;Jauch and Watzka,2016).
Descriptive statistics for all variables included in the empirical analysis in the paper are reported in Table1.1.
1.3.1
Panel estimations and econometric issues
Building on the theoretical contributions presented in Section1.2and empirical studies by, among others,Jalil(2012),Jaumotte et al.(2013) andNikoloski(2013),
CHAPTER 1. FINANCE, GLOBALISATION, TECHNOLOGY AND INEQUALITY: DO NONLINEARITIES MATTER?
Table 1.1: Descriptive statistics
Variable No. of Mean Standard Minimum Maximum
observations deviation
Gini 623 37.262 9.459 18.25 60.2
Economic Globalisation Index 758 54.276 16.2 12.82 93.069 Energy Use (per-capita) 715 2.3 2.254 0.012 17.781 Air Transport (per 100 people) 720 64.193 131.33 0 2072.789 Mobile Cellular Subscriptions (per 100 people) 773 27.865 44.284 0 168.663 Relative Price of Investment Goods 758 0.517 0.268 0.063 1.629 Financial Sector Development 723 48.496 39.448 0.146 246.187 Real GDP per-capita 758 14.507 12.922 0.436 90.497 Rate of Change of Urban Agglomerations 666 1.963 1.695 -3.209 8.034
Bureaucracy Quality 531 2.61 1.072 0 4
Human Capital Index 722 2.406 0.669 1.021 3.719
Inflation (annual %) 724 33.307 187.313 -0.516 3373.474
the benchmark ‘Nonlinear’ model of our empirical analysis relies on the following dynamic panel specification:
(G I N I)i,t= αi+ νt+ βj 3
X
j=1
(G I N I)i,t− j+ γ1EG Ii,t+ γ2EG I2i,t
+ γ3GP Ti,t+ γ4GP T2i,t+ γ5I STi,t+ γ6I ST2i,t
+ γ7F I Ni,t+ γ8F I Ni,t2 + δ1(GDPPC)i,t+ δ2(GDPPC)2i,t+ εi,t
(1.1)
where i = 1,..., N and t = 1,..., T indicate, respectively, country and time; (GI N I)i,t
is our inequality measure; GP T and IST are the two technological progress proxies, i.e. Energy Use, Air Transport and Mobile Cellular Subscriptions as alternative GPT proxies and Relative Price of Investment Goods for IST;αi indicates fixed
effects,νt time dummies,εi,tis the error term and all other variables are as defined
above.
For comparability purposes, we also consider a simple ‘Linear’ model where the main drivers of income inequality enter the dynamic panel specification only
1.4. SYSTEM-GMM ESTIMATION RESULTS
linearly, except for the terms referring to the Kuznets-curve hypothesis:
(G I N I)i,t= αi+ νt+ βj 3
X
j=1
(G I N I)i,t− j+ γ1EG Ii,t+ γ2GP Ti,t
+ γ3I STi,t+ γ4F I Ni,t+ δ1(GDPPC)i,t+ δ2(GDPPC)2i,t+ εi,t
(1.2)
As is well known, pooled OLS and fixed effects (FE) estimates of dynamic panel data models are inconsistent due to the dynamic panel bias (Nickell,1981). This issue is particularly relevant in our case, since Monte Carlo evidence indicates that the Nickell bias may be substantial when the time-series dimension is short (e.g.,Judson and Owen,1999). Additionally, the potential endogeneity of at least some of the regressors raises further concerns regarding the reliability of pooled OLS and FE estimates. To deal with these issues, estimations are carried out using the System-GMM (S-GMM) estimator developed by Arellano and Bover
(1995) andBlundell and Bond(1998). Just like the Difference-GMM (Arellano and Bond,1991) estimator, S-GMM deals with variable endogeneity relying on internal instruments – but it uses both lagged levels and differences of the endogenous variables. Though neither technique has been proven to fully solve endogeneity issues (e.g., Bun and Windmeijer, 2010), these estimators represent a reliable alternative for macro-panel studies such as ours – in the context of which, obtaining valid (and robust) external instruments is very difficult. In our case, S-GMM is preferred over Difference-GMM (Arellano and Bond,1991) because of its better performance when dealing with highly persistent variables, such as our measure of income inequality (Blundell and Bond,2000). S-GMM estimations are carried out treating EG I, GP T and IST as exogenous variables, while the lags of the dependent variable, F I N and GDPPC are considered as endogenous.
1.4
System-GMM estimation results
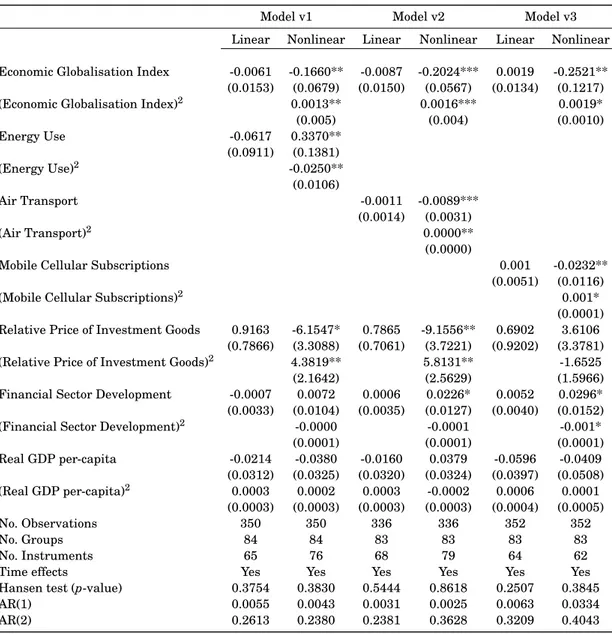
S-GMM estimates of the dynamic panel data models specified in1.1and1.2are reported in Table1.2. For comparability purposes, for each model estimation the results from our baseline ‘Nonlinear’ specification and from its ‘Linear’ version are reported in two adjacent columns. This set-up is replicated for the three versions
CHAPTER 1. FINANCE, GLOBALISATION, TECHNOLOGY AND INEQUALITY: DO NONLINEARITIES MATTER?
of the baseline model, each one including a different GPT proxy: Energy Use for Model v1, Air Transport for Model v2 and Mobile Cellular Subscriptions for Model v3. For all of the models estimated, the outcome of the Hansen test is in line with the overall validity of the instruments. Furthermore, all tests for first- and second-order autocorrelation of the residuals provide evidence in favour of, respectively, rejection of the AR(1) and no rejection of the AR(2) hypotheses.7
Turning to the estimation results, we start by noting that none of the ‘Linear’ specifications provide evidence of significant effects for the main drivers of inequal-ity. In line with the view that neglecting nonlinearities may produce misleading results, this surprising outcome is completely reversed when the analysis is carried out relying on the ‘Nonlinear’ specifications – for which the results turn out to be quite different.8In particular, the investigation of the role played by technological progress in shaping the dynamics of income inequality provides several relevant insights. Firstly, for the relationship between Gini and our IST proxy – Relative Price of Investment Goods – we obtain fairly similar results in two out of three estimations (Model v1 and v2), providing evidence of a U-shaped pattern. Note that, since a fall in Relative Price of Investment Goods indicates technological progress, this outcome is consistent with theoretical predictions of an inverted U-shaped rela-tion between technology and income inequality (e.g.,Aghion et al.,1998;Helpman,
1998). Specifically, the negative and positive signs on, respectively, the linear and quadratic terms of Relative Price of Investment Goods indicate that the effects of IST innovations on inequality will depend on whether the relative price of capital is above or below a certain threshold. For countries characterised by a high relative price of capital, the relation between Gini and Relative Price of Investment Goods is positive – i.e. these countries are located on the right-hand side of the U-shaped
7Lag selection was performed with a general-to-specific procedure which, in all cases, indicated the optimal lag length as 3. Lags of the dependent variable Gini turned out to be always strongly significant and the associated coefficients are in line with the expected high degree of persistence in inequality – thus supporting both the adoption of a dynamic panel specification and the S-GMM estimation technique. To save space, the estimated coefficients on the lags of Gini are not reported in the tables of model estimates included in the paper.
8This is not the case when the models are estimated relying on the pooled OLS or fixed-effects (FE) estimators, which in most cases return statistically insignificant results for both the Linear and Nonlinear specifications. To save space, the FE estimation results are reported in TableA.3in the Appendix, while the pooled OLS estimates are available upon request.
1.4. SYSTEM-GMM ESTIMATION RESULTS
curve. In such a case, IST innovations leading to falls in the relative price of capital will be associated with (progressively smaller) declines in income inequality. This is consistent with a scenario in which the positive effects of IST in terms of higher labour productivity and wages outweigh its labour-substituting and skill-biased impact (e.g., Aghion, 2002; Acemoglu and Autor, 2011); when Relative Price of Investment Goods is low, the opposite occurs and IST innovations lead to gradually greater rises in inequality. We provide further insights on this point in Section1.5.
With respect to our GPT proxies, we identify two different outcomes. The relation between Gini and Energy Use (Model v1), is characterised by an inverted U-shaped pattern in line with model predictions inGalor and Tsiddon(1997) and
Aghion et al.(1998), among others; by contrast, Air Transport (Model v2) and Mobile Cellular Subscriptions (Model v3) are characterised by U-shaped relationships with Gini. These results confirm that empirical findings on the effects of GPT on inequality should be treated with caution, particularly when based on the use of a single proxy and/or assumed as linear.
For the relationship between Gini and the Economic Globalisation Index our findings are clear-cut: all the estimated models provide evidence of significant nonlinearities consistent with a U-shaped pattern. This is a somewhat surprising result in contrast with arguments in, for instance,Helpman et al.(2017) and the evidence supporting the existence of an ‘Openness Kuznets-curve’ (e.g.,Dobson and Ramlogan,2009;Jalil,2012). It is, on the contrary, consistent with standard classical trade theory and model predictions inXu(2003): globalisation initially reduces inequality by boosting returns to the relatively abundant factor; beyond a certain threshold, however, further liberalisation increases wage inequality as high-skilled workers start to benefit comparatively more from the export-expansion effect. Meanwhile, only one specification (Model v3) provides evidence of a ‘Fi-nancial Kuznets-curve’, i.e. a nonlinear, inverted U-shaped relationship between inequality and Financial Sector Development – an outcome in line with, among others, theoretical predictions inGreenwood and Jovanovic(1990) and empirical findings inNikoloski (2013) and Baiardi and Morana(2018,2016). Finally, it is worth noting that GDPPC and its square turn out to be not significant in all
mod-els – suggesting that the inequality determinants and specifications in Table1.2
CHAPTER 1. FINANCE, GLOBALISATION, TECHNOLOGY AND INEQUALITY: DO NONLINEARITIES MATTER?
standard Kuznets-curve framework.
Table 1.2: S-GMM regression results: Dependent variable is Gini Coefficient
Model v1 Model v2 Model v3 Linear Nonlinear Linear Nonlinear Linear Nonlinear Economic Globalisation Index -0.0061 -0.1660** -0.0087 -0.2024*** 0.0019 -0.2521** (0.0153) (0.0679) (0.0150) (0.0567) (0.0134) (0.1217) (Economic Globalisation Index)2 0.0013** 0.0016*** 0.0019*
(0.005) (0.004) (0.0010) Energy Use -0.0617 0.3370** (0.0911) (0.1381) (Energy Use)2 -0.0250** (0.0106) Air Transport -0.0011 -0.0089*** (0.0014) (0.0031) (Air Transport)2 0.0000** (0.0000)
Mobile Cellular Subscriptions 0.001 -0.0232**
(0.0051) (0.0116)
(Mobile Cellular Subscriptions)2 0.001*
(0.0001) Relative Price of Investment Goods 0.9163 -6.1547* 0.7865 -9.1556** 0.6902 3.6106
(0.7866) (3.3088) (0.7061) (3.7221) (0.9202) (3.3781) (Relative Price of Investment Goods)2 4.3819** 5.8131** -1.6525
(2.1642) (2.5629) (1.5966) Financial Sector Development -0.0007 0.0072 0.0006 0.0226* 0.0052 0.0296* (0.0033) (0.0104) (0.0035) (0.0127) (0.0040) (0.0152) (Financial Sector Development)2 -0.0000 -0.0001 -0.001*
(0.0001) (0.0001) (0.0001) Real GDP per-capita -0.0214 -0.0380 -0.0160 0.0379 -0.0596 -0.0409 (0.0312) (0.0325) (0.0320) (0.0324) (0.0397) (0.0508) (Real GDP per-capita)2 0.0003 0.0002 0.0003 -0.0002 0.0006 0.0001 (0.0003) (0.0003) (0.0003) (0.0003) (0.0004) (0.0005) No. Observations 350 350 336 336 352 352 No. Groups 84 84 83 83 83 83 No. Instruments 65 76 68 79 64 62
Time effects Yes Yes Yes Yes Yes Yes
Hansen test (p-value) 0.3754 0.3830 0.5444 0.8618 0.2507 0.3845
AR(1) 0.0055 0.0043 0.0031 0.0025 0.0063 0.0334
AR(2) 0.2613 0.2380 0.2381 0.3628 0.3209 0.4043
Notes: * p < 0.10, ** p < 0.05, *** p < 0.01. Standard errors in parentheses. Estimates are based on dynamic panel data estimation, using data averaged over five-years periods and two-step System-GMM. All models instrument as endogenous the dependent variable, financial sector development and real GDP per-capita. Time dummies are included as strictly exogenous instruments in the level equations for all specifications. Fixed-effects are removed via the forward orthogonal deviation (FOD) transformation and all models are estimated withWindmeijer(2005) finite sample correction; p-values are reported for Hansen, AR(1) and AR(2) tests.
1.4. SYSTEM-GMM ESTIMATION RESULTS
1.4.1
Robustness analysis
To assess the robustness of the results in Table 1.2, we now extend the model specifications using a number of control variables usually considered as possible additional determinants of inequality in the literature. Specifically, we include the following variables:
• Rate of Change of Urban Agglomerations. Urbanisation can play a relevant role in determining inequality dynamics at the country level.9Due to agglom-eration economies and other externalities, cities are typically characterised by economic and job opportunities unevenly distributed in space. As a re-sult, larger cities are generally richer but also more unequal than smaller cities and rural areas. All else constant, therefore, growing urban areas are likely to be associated with increasing inequality (United Nations, 2020). FollowingCastells-Quintana(2018), we control for potentially nonlinear ef-fects of urbanisation relying on the annual average growth rate of urban agglomerations above 300,000 inhabitants within the same country;10
• Human Capital. Retrieved from the Penn World Tables, this index is con-structed using average years of schooling fromBarro and Lee(2013) and an assumed rate of return to education, based on Mincer-equation estimates around the world (Psacharopoulos,1994). Evidence on the effects of human capital accumulation is ambiguous, as some studies link it to decreasing income disparities (e.g.,Dabla-Norris et al.,2015) while others find it widens the wage gap via skill-premium effects (e.g.,Park,1996;Goldin and Katz,
2009);
• Bureaucracy Quality. Constructed by the International Country Risk Guide, the index ranges between 0 and 4. Higher values correspond to lower-risk countries, where bureaucracy is more transparent and independent from
9Recent urban economics literature pointed out that further drivers of income inequality can be traced to the city level (e.g.,Behrens and Robert-Nicoud,2014;Sarkar et al.,2018) as well as to the regional level (e.g.,Perugini and Martino,2008;Castells-Quintana and Larrú,2015). 10Rather than in growth-rate form, Castells-Quintana (2018) uses the same proxy for urban
CHAPTER 1. FINANCE, GLOBALISATION, TECHNOLOGY AND INEQUALITY: DO NONLINEARITIES MATTER?
political pressures. This indicator is often used as a proxy for institutional quality, which can be expected to mitigate income disparities (e.g.,Chong and Gradstein,2007);
• Inflation (annual %). Higher inflation is expected to increase income inequal-ity, as its harmful consequences typically affect to a larger extent the poor-and the middle-class (e.g.,Erosa and Ventura,2002;Albanesi,2007).
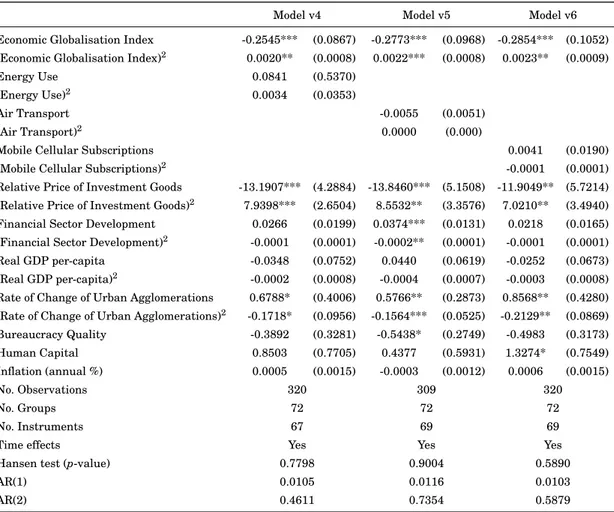
Table 1.3 presents the S-GMM estimation results for the extended model specifications. Two important conclusions reached in the previous section prove to be robust to all three versions of the extended ‘Nonlinear’ models. The first, which is common to all estimations in Table1.2, is the statistically significant U-shaped relationship between Gini and the Economic Globalisation Index. The second is that Investment-Specific Technology plays a prominent role as a determinant of inequality dynamics: Relative Price of Investment Goods turns out to be always significant and its U-shaped nonlinear effects are confirmed. Meanwhile, the significant but mixed evidence reported in Table1.2for the effects of GPT turns out not to be robust to the inclusion of additional controls – an outcome that reinforces the notion that IST plays a more important role than GPT as a driver of inequality trends. Moreover, just as in Table1.2, there is only partial evidence (Model v5) supporting the hypothesis that Financial Sector Development affects inequality.
Turning to the additional control variables included in the robustness analysis, there is a persistent outcome to highlight. The relationship between Gini and the Rate Change of Urban Agglomerations is characterised by an inverted U-shaped pattern for all the estimated models. This is consistent with the hypothesis that faster-growing cities lead to increasing inequality (United Nations, 2020) but, beyond a certain threshold, the benefits from growing urbanisation outweigh its inequality-boosting effects. Finally, while Inflation turns out to be not significant, we find only limited evidence that Human Capital (Model v6) and Bureaucracy Quality (Model v5) play a role in, respectively, increasing and reducing income inequality.
Overall, therefore, the empirical findings in this section give a clear-cut answer to the questions on the relative importance of the main determinants of inequal-ity. Specifically, the data support the hypothesis of empirically robust effects on
1.4. SYSTEM-GMM ESTIMATION RESULTS
Table 1.3: S-GMM robustness checks results: Dependent variable is Gini Coefficient
Model v4 Model v5 Model v6
Economic Globalisation Index -0.2545*** (0.0867) -0.2773*** (0.0968) -0.2854*** (0.1052) (Economic Globalisation Index)2 0.0020** (0.0008) 0.0022*** (0.0008) 0.0023** (0.0009)
Energy Use 0.0841 (0.5370)
(Energy Use)2 0.0034 (0.0353)
Air Transport -0.0055 (0.0051)
(Air Transport)2 0.0000 (0.000)
Mobile Cellular Subscriptions 0.0041 (0.0190)
(Mobile Cellular Subscriptions)2 -0.0001 (0.0001)
Relative Price of Investment Goods -13.1907*** (4.2884) -13.8460*** (5.1508) -11.9049** (5.7214) (Relative Price of Investment Goods)2 7.9398*** (2.6504) 8.5532** (3.3576) 7.0210** (3.4940) Financial Sector Development 0.0266 (0.0199) 0.0374*** (0.0131) 0.0218 (0.0165) (Financial Sector Development)2 -0.0001 (0.0001) -0.0002** (0.0001) -0.0001 (0.0001) Real GDP per-capita -0.0348 (0.0752) 0.0440 (0.0619) -0.0252 (0.0673) (Real GDP per-capita)2 -0.0002 (0.0008) -0.0004 (0.0007) -0.0003 (0.0008)
Rate of Change of Urban Agglomerations 0.6788* (0.4006) 0.5766** (0.2873) 0.8568** (0.4280) (Rate of Change of Urban Agglomerations)2 -0.1718* (0.0956) -0.1564*** (0.0525) -0.2129** (0.0869)
Bureaucracy Quality -0.3892 (0.3281) -0.5438* (0.2749) -0.4983 (0.3173) Human Capital 0.8503 (0.7705) 0.4377 (0.5931) 1.3274* (0.7549) Inflation (annual %) 0.0005 (0.0015) -0.0003 (0.0012) 0.0006 (0.0015) No. Observations 320 309 320 No. Groups 72 72 72 No. Instruments 67 69 69
Time effects Yes Yes Yes
Hansen test (p-value) 0.7798 0.9004 0.5890
AR(1) 0.0105 0.0116 0.0103
AR(2) 0.4611 0.7354 0.5879
Notes: * p < 0.10, ** p < 0.05, *** p < 0.01. Standard errors in parentheses. Estimates are based on dynamic panel data estimation, using data averaged over five-years periods and two-step System-GMM. All models instrument as endogenous the dependent variable, financial sector development, real GDP per-capita and the rate of change of urban agglomerations. Time dummies are included as strictly exogenous instruments in the level equations for all specifications. Fixed-effects are removed via the forward orthogonal deviation (FOD) transformation and all models are estimated with
Windmeijer(2005) finite sample correction; p-values are reported for Hansen, AR(1) and AR(2) tests.
inequality for globalisation and investment-specific technological progress. On the contrary, there is only non-robust and/or limited evidence indicating significant effects for GPT and financial development. Moreover, our investigation brings qualified support to the view that empirical analyses of inequality determinants should be cast within a comprehensive framework – taking account of all the main drivers of inequality and, in particular, their potentially nonlinear effects. The presence of different types of nonlinearities in the relationships between inequality and its main drivers is a relevant matter from a policy perspective, as it adds a
CHAPTER 1. FINANCE, GLOBALISATION, TECHNOLOGY AND INEQUALITY: DO NONLINEARITIES MATTER?
new dimension of complexity to the traditional trade-off between efficiency and equity. In this respect, therefore, our findings deserve further scrutiny.
1.5
Testing for monotonicity in nonlinear
relationships
When both economic growth and a more equal distribution of income are policy objectives, trade-offs can arise because growth-boosting policies – such as incentives for R&D expenditure or trade liberalisation measures – may result in rising income inequality via several channels, including skill-premium effects and the adoption of labour-substituting technology. For instance, such a trade-off exists when the nonlinear relationship between income inequality and globalisation is characterised by a well-identified minimum – as suggested by the estimates in Tables1.2and1.3. In such a case, while globalisation initially fosters a more equal income distribution, the inequality-reducing effects of additional liberalisation measures become gradually smaller and, beyond a certain threshold value, the relationship changes sign and further integration in the global economy starts exacerbating inequality. On the contrary, when the relationship is nonlinear but also monotonic there exists no clear threshold beyond which further globalisation raises inequality: thus, there is no clear policy trade-off either. For these reasons, a formal assessment of whether the nonlinear relationships uncovered in the previous section are characterised by well-defined extreme points, i.e. a minimum or maximum within the data range, is critical for policy purposes.
To further investigate this issue, we rely on the test for U-shaped relationships proposed byLind and Mehlum(2010) (hereafter ‘LM test’).11These authors point out that estimation of quadratic specifications may inaccurately yield an extreme point and, therefore, indicate U-shaped patterns when the true relationships are in fact characterised by convexity as well as monotonicity. In order to obtain reli-able extreme points, and thus correct (inverted) U-shaped structures, the LM test
11Among others, the LM test is employed byArcand et al.(2015) andLeonida et al.(2015) to assess the nonmonotonic impact of, respectively, financial depth and political competition on economic growth.
1.5. TESTING FOR MONOTONICITY IN NONLINEAR RELATIONSHIPS
checks whether the nonlinear relationship is (increasing) decreasing at low values and (decreasing) increasing at high values within the data range. In such a case, rejection of the null hypothesis of monotonicity would provide evidence in favour of (inverted) U-shaped relationships.
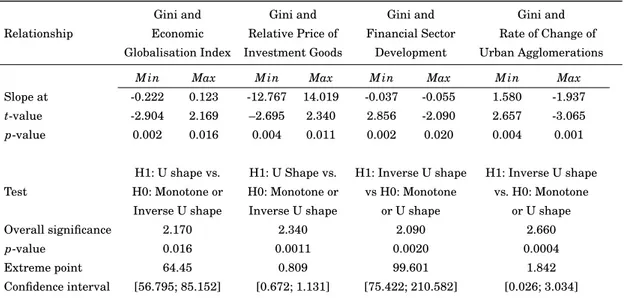
In this section, we carry out LM tests for U-shaped structures in Model v5 – the only specification in Table1.3providing consistent evidence of significant nonlinearities not only for Economic Globalisation Index, Relative Price of Invest-ment Goods and Rate of Change of Urban Agglomerations, but also for Financial Sector Development.12The results in Table1.4are clear-cut and indicate that, in all cases, the nonlinear relationships between Gini and its relevant determinants are characterised by the presence of well-identified extreme points. The null hypo-thesis of monotonicity is systematically rejected at the 5 percent significance level in favour of U-shaped patterns for EG I and Relative Price of Investment Goods, and inverted-U shapes for Financial Sector Development and the Rate of Change of Urban Agglomeration. As such, the LM test results are consistent with the existence of well-defined threshold values beyond (or below) which the impact of the drivers of inequality changes sign.
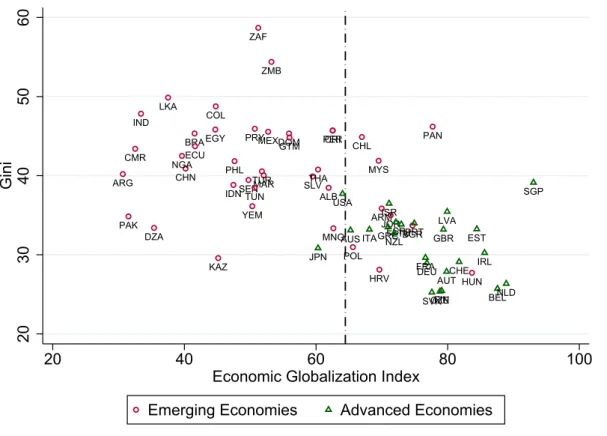
These findings can be used to provide useful insights in terms of cross-country differences for the effects of inequality determinants, as we can establish where countries are located with respect to the thresholds – an exercise we carry out comparing the (most recent) 2010-2015 averages of the relevant variables to the estimated turning points.13For instance, with respect to globalisation we find that for 31 out of 65 countries the 2010-2015 average of the Economic Globalisation Index is higher than the estimated threshold value of 64.4, which indicates the turning point in the U-shaped relationship with Gini (Table1.4). These countries are, thus, characterised by a positive relationship between globalisation and in-equality (Figure1.1). Interestingly, among these are 22 advanced economies out of a total of 24. On the contrary, 78 percent of emerging economies (32 out of 41) are
12The LM test results for the other specifications in Table1.3reflect closely the findings obtained for Model v5. These additional results are not reported here for reasons of space, but are available upon request.
13Due to gaps in the data, relying on the 2010-2015 averages as reference values for the comparisons with the estimated thresholds reduces the sample from 72 to 65 countries.
CHAPTER 1. FINANCE, GLOBALISATION, TECHNOLOGY AND INEQUALITY: DO NONLINEARITIES MATTER?
Table 1.4: Tests for U-shape and Inverse U-shape: Model v5
Relationship
Gini and Gini and Gini and Gini and
Economic Relative Price of Financial Sector Rate of Change of Globalisation Index Investment Goods Development Urban Agglomerations
M in Max M in Max M in Max M in Max
Slope at -0.222 0.123 -12.767 14.019 -0.037 -0.055 1.580 -1.937 t-value -2.904 2.169 –2.695 2.340 2.856 -2.090 2.657 -3.065 p-value 0.002 0.016 0.004 0.011 0.002 0.020 0.004 0.001
Test
H1: U shape vs. H1: U Shape vs. H1: Inverse U shape H1: Inverse U shape H0: Monotone or H0: Monotone or vs H0: Monotone vs. H0: Monotone Inverse U shape Inverse U shape or U shape or U shape
Overall significance 2.170 2.340 2.090 2.660
p-value 0.016 0.0011 0.0020 0.0004
Extreme point 64.45 0.809 99.601 1.842
Confidence interval [56.795; 85.152] [0.672; 1.131] [75.422; 210.582] [0.026; 3.034] Notes: The confidence intervals are calculated by the Fieller method.
positioned to the left of the EG I threshold in Figure1.1. Thus, for these economies a growing degree of globalisation will be associated with falling income disparities. This outcome is consistent with a significant part of the literature which, in line with the predictions of classic trade theory, indicates that globalisation has affected negatively the incomes of low-skilled workers in advanced economies while benefit-ing the poor in emergbenefit-ing economies (e.g.,Wood,1995).
Similarly, given the U-shaped structure underpinning the relationship between Gini and Relative Price of Investment Goods, we find that 13 advanced economies are located to the right of the estimated threshold value (0.81) in Figure1.2. For these economies, technological progress (as reflected by a fall in the relative price of capital) will lead to gradually smaller declines in inequality. In this respect, a striking outcome is that this is also true for only 2 emerging economies (Arme-nia and Kazakhstan) in our panel. For the other 39 emerging and 11 advanced economies located to the left of the threshold value for Relative Price of Investment Goods, the implication is that IST innovations will lead to rising income disparities. As technological progress is the main driver of long-run growth, this finding for emerging economies is consistent with the classic Kuznets-curve hypothesis that economic development will be associated with growing income disparities in its
1.5. TESTING FOR MONOTONICITY IN NONLINEAR RELATIONSHIPS ALB ARG ARM BGR BRA CHL CHN CMR COL CRI DOM DZA ECU EGY GTM HRV HUN IDN IND JOR KAZ LKA MAR MEX MNG MYS NGA PAK PAN PER PHL POL PRY SEN SLVTHA TUN TUR YEM ZAF ZMB AUS AUT BEL CHE CZE DEU ESP EST FIN FRA GBR GRC IRL ISR ITA JPN LTU LVA NLD NZLPRT SGP SVK USA 20 30 40 50 60 Gini 20 40 60 80 100
Economic Globalization Index
Emerging Economies Advanced Economies
Figure 1.1: Location of advanced and emerging economies with respect to the estimated threshold value for Economic Globalisation Index.
earlier stages.
For the inverted U-shaped relationship between Gini and Financial Sector Development, the turning point is estimated at a level of private credit over GDP of 99.6 percent. With respect to the latter, the advanced economies are equally split: 12 are located to the right of the threshold and are characterised by a negative relation between inequality and financial development, while the opposite is true for the remaining 12. Once again, however, the results are significantly different for emerging economies as only 5 are located to the right of the threshold in Figure
1.3. That is, for the vast majority (88 percent) of the emerging economies in our panel, Financial Sector Development is associated with an increase in Gini. This outcome is in line with other evidence in the literature (e.g.,Nikoloski,2013;Jauch and Watzka,2016) and supports the hypothesis that a minimum level of financial
CHAPTER 1. FINANCE, GLOBALISATION, TECHNOLOGY AND INEQUALITY: DO NONLINEARITIES MATTER?
ALB ARG ARM BGR BRACHL CHN CMR COL CRI DOM DZA ECU EGY GTM HRVHUN IDN IND JOR KAZ LKA MAR MEX MNG MYS NGA PAK PANPER PHL POL PRY SEN SLV THA TUN TUR YEM ZAF ZMB AUS AUT BEL CHE CZE DEU ESP EST FIN FRA GBR GRC IRL ISR ITA JPN LTU LVA NLD NZL PRT SGP SVK USA
Negative relation Positive relation
20 30 40 50 60 Gini 0 .5 1 1.5
Relative Price of Investment Goods
Emerging Economies Advanced Economies Threshold
Figure 1.2: Location of advanced and emerging economies with respect to the estimated threshold value for Relative Price of Investment Goods.
development is required for this driver to reduce inequality.
Finally, for the inverted U-shaped interplay between inequality and urbanisa-tion, the estimated threshold value for Rate of Change of Urban Agglomerations is 1.85 percent. With respect to this, the majority of emerging economies (26) are located in the right-hand side of Figure1.4, where faster urbanisation is associated with falling inequality. This is consistent with the view that the large expected returns triggering rural-urban migration and growing urbanisation in emerging economies do translate in many cases in better incomes for low-skilled workers, thus acting as an inequality-reducing mechanism (e.g.,Todaro,1969;Nord,1980). On the contrary, with the marginal exception of Australia and Israel, for 22 out of 24 advanced economies faster city growth is associated with growing inequal-ity. Among others, this is in line with arguments inBehrens and Robert-Nicoud
1.5. TESTING FOR MONOTONICITY IN NONLINEAR RELATIONSHIPS ALB ARG ARM BGR BRA CHL CHN CMR COL CRI DOM DZA ECU EGY GTM HRV HUN IDN IND JOR KAZ LKA MAR MEX MNG MYS NGA PAK PAN PER PHL POL PRY SEN SLV THA TUN TUR YEM ZAF ZMB AUS AUT BEL CHE CZE DEU ESP EST FIN FRA GBR GRC IRL ISR ITA JPN LTU LVA NLD NZL PRT SGP SVK USA 20 30 40 50 60 Gini 0 50 100 150 200
Financial Sector Development
Emerging Economies Advanced Economies
Positive relation Threshold Negative relation
Figure 1.3: Location of advanced and emerging economies with respect to the estimated threshold value for Financial Sector Development.
(2014) andCastells-Quintana and Royuela(2014) indicating that, due to stronger agglomeration effects leading to a relatively more developed business environment and larger shares of high-skilled labour, in advanced economies inequality can be expected to increase with urbanisation.
To sum up, the results in this section provide a clear indication that the pres-ence of significant nonlinearities has important implications for the relationship between income inequality and its main determinants. In particular, because of the nonlinear nature of the relation, policy trade-offs may turn out to be substantially different in advanced vis-à-vis emerging economies.
CHAPTER 1. FINANCE, GLOBALISATION, TECHNOLOGY AND INEQUALITY: DO NONLINEARITIES MATTER?
ALB ARG ARM BGR BRA CHL CHN CMR COL CRI DOM DZA ECU EGY GTM HRVHUN IDN IND JOR KAZ LKA MAR MEX MNG MYS NGA PAK PAN PER PHL POL PRY SEN SLV THA TUN TUR YEM ZAF ZMB AUS AUT BEL CHE CZE DEU ESP EST FIN FRA GBR GRC IRL ISR ITA JPN LTU LVA NLD NZL PRT SGP SVK USA Positive relation 20 30 40 50 60 Gini -2 0 2 4 6
Rate of Change of Urban Agglomerations Emerging Economies Advanced Economies
Negative relation Threshold
Figure 1.4: Location of advanced and emerging economies with respect to the estimated threshold value for Rate of Change of Urban Agglomerations.
1.6
Conclusions
Relying on a panel dataset of annual data over the 1970-2015 period for 90 ad-vanced and emerging economies, this paper carries out an empirical investigation of the determinants of inequality dynamics. We pay special attention to the role played by financial sector development, globalisation and technology, modelling their impact as potentially nonlinear. To take account of persistence in inequality and variable endogeneity, the empirical analysis is based on System-GMM estima-tions.
Our findings point to the presence of significant nonlinearities and, relying on a formal testing approach developed byLind and Mehlum(2010), we find that the nonlinear relationships between inequality and its determinants are characterised