© 2015 Maurizio Lanfranchi, Carlo Giannetto, Angela Alibrandi and Agata Zirilli. This open access article is distributed Original Research Paper
Analysis of the Propensity to Fruit Consumption among
Young People through the Cumulative Proportional Odds
Model
Maurizio Lanfranchi, Carlo Giannetto, Angela Alibrandi and Agata Zirilli
Department of Economics, Business, Environment and Quantitative Methods (SEAM), University of Messina, Messina, Italy
Article history Received: 16-07-2015 Revised: 28-07-2015 Accepted: 29-08-2015 Corresponding Author: Maurizio Lanfranchi Department of Economics, Business, Environment and Quantitative Methods (SEAM), University of Messina, Messina, Italy
Email:[email protected]
Abstract: After in-depth studies, the World Health Organization (WHO), asserts and suggests that in order to improve human health and well-being it is necessary to eat 400 grams of fruit and vegetables on a daily basis, as well as to consume potatoes and other starchy tubers such as manioc. In Europe, recommendations vary from country to country. Generally, these suggestions are in line with those of the WHO. However, some countries recommend a greater amount: For example, Denmark suggests more than 600 grams each day. The main goal of the present work is to analyse the fruit-consumption behaviour among young people, particularly university students and to identify the target of young people who frequently consume fruit. The present survey, therefore, has the aim of establishing a scientific reference framework regarding the propensity to “fruit” consumption in the diet of the students attending the University of Messina. In order to identify the existence of possible variables that may influence the frequency of fruit consumption, it was deemed appropriate to estimate an adequate regression model. Since the response variable was one of ordinal type on 4 levels (0 = never; 1 = once or twice a week; 2 = 3-5 times a week; 3 = each day) the Cumulative Proportional Odds Model, an extension of the general linear model to ordinal categorical data, was used.
Keywords: Consumption, Cumulative Proportional Odds Model, Fruit, Analysis, Life-Style Students
Introduction
Fruit and vegetables consumption must be the basis of the healthy food model (Lanfranchi and Giannetto
,
2014
). Fruit is a source of vitamins, minerals and fibres, as well as of an important amount of energy (Crescimanno et al., 2014; 2002). The most recent epidemiological studies have highlighted how diets based on high levels of fruit and vegetables are associated with a low risk of cardiovascular diseases, of type 2 diabetes and of certain kinds of cancer. Actually, in many countries the fruit per capita consumption among young people in Europe is still below the intake recommended by the WHO (Asciuto et al., 2014). The main goal of the present work is to analyse the fruit-consumption behaviour among young people, particularly university students and to identify the target of young people who frequently consume fruit (Lanfranchi et al., 2014a; 2014b). The work starts fromthe observation that the definition of fruit itself varies according to the country, since some take on board the WHO recommendations and exclude the starch category, while others such as Norway include even potatoes in the fruit category. Thus, the analysis of consumption at European level does not appear to be aligned and the food model itself proves to be distorted by these extensive interpretations of the term “fruit”, which in most cases includes also the fruit juice. Among the various methodologies that we may find in the scientific literature regarding the analysis of the measurement of food consumption, the direct survey through interview and administration of the questionnaire, despite being more expensive, seems to be the one which best expresses the consumer’s behaviour (D’Amico et al., 2014a; 2014b). In this study we decided to restrict the definition of fruit consumption exclusively to the product coming from the agricultural sector to be supplied fresh without
having undergone any alterations and/or transformations. Moreover, we took as a reference the daily consumption of fruit and vegetables recommended by the WHO, equal to at least 400 grams. In Europe the average consumption of vegetables is 200 grams per day and only 166 grams of fruit (Tudisca et al., 2015). In Italy the recommendation of consuming 400 gr of fruit per capita per day is exceeded. Indeed, if we consider also fruit juices, the ratio rises to 452 gr (Di Vita et al., 2014; 2013).
Research Objective
The present survey, therefore, has the aim of establishing a scientific reference framework regarding the propensity to “fruit” consumption in the diet of the students attending the University of Messina. In particular, we analysed the answers given by the surveyed students in relation to certain personal characteristics, such as: Age, sex, number of family components, municipality of residence, year of the course (distinguishing between three-years degree courses and specialistic degree courses), parents’ study title and a series “control” variables concerning their life-style: Smoking, alcohol, sporting activity and eating habit.
Materials and Methods
The data collection technique which was employed was the administration of an anonymous distributed questionnaire by interviewing a sample of university students in a direct way, with the face to face method and by using a questionnaire form that was prepared ad hoc. The data collection was conducted in order to respect as far as possible the dislocation of university departments within the scientific community (Lanfranchi et al., 2014c; 2014d; Schimmenti et al., 2013; Sgroi et al., 2015). The surveys were carried out within the departments of the University of Messina in the months of April and May 2015. The sample chosen as the object of the investigation is composed of 305 students. Although it does not constitute a purely statistical sample, owing to the unavailability of the information basis for the random sampling of the respondents’ names, the obtained results can be regarded as relevant, considering the sample size and the data quality (Caracciolo et al., 2014; Verneau et al., 2014; De Magistris et al., 2015). In order to identify the existence of possible variables which may influence the frequency of fruit consumption, the Cumulative Proportional Odds Model, an extension of the general linear model to ordinal categorical data, was used. It can be implemented through the Polytomous Universal Model (PLUM) procedure of the statistical software SPSS.
Analysis of the Preference of Fruit
Consumption among the Students of the
University
of
Messina:
Sample
Characteristics
The subdivision of the effective sample (305 respondents) was performed according to certain socio-demographic characteristics: Age, gender, area of residence, parents’ study title, department affiliation and year of the course. The average age of the surveyed university students is approximately 23. It should be noted that the range is between 19 and 47 years old (the latter is attributable to university student who have not passed all their exams within the prescribed period of time or to those who are registered in a second degree course). Going into detail of socio-demographic characteristics, it emerges that the sample composition consists of 35,4% males (108 units) and of 64,6% females (197 units). The surveyed students are residents of: Messina (28,1%), Province of Messina (25,3%), another Sicilian town (18,8%) and Calabria/other (27,7%). On average, the number of the household members is of 4 components. As regards the parents’ study title, 52% of the fathers and 54,6% of the mothers have a secondary school certification, while 21,3% of the fathers and 19,3% of the mothers have achieved a university degree (Lanfranchi et al., 2014e; Sgroi et al., 2014).
Analysis of the Measurement of Fruit
Consumption among University Students:
The Food Model
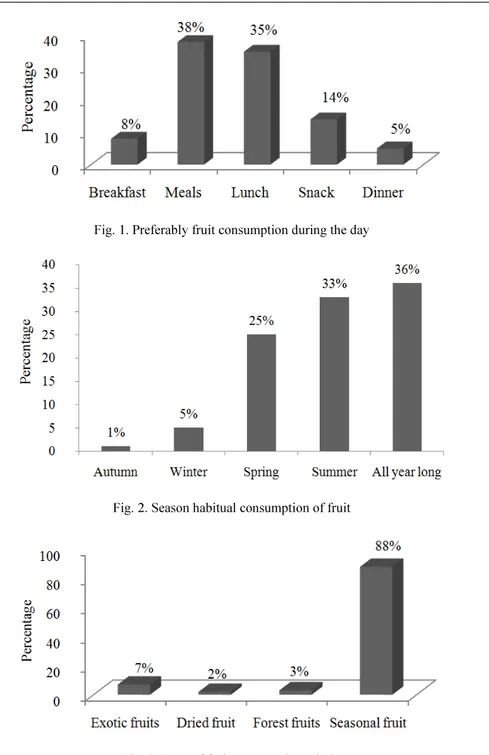
The surveyed students declare that in the last few years their fruit consumption has remained constant (46,6%), only 9,5% states that it has decreased (Table 1). Consumption habitually takes place between meals (38%) and at lunch (35%) and only 5% of the surveyed students consumes fruit at dinner (Fig. 1). The main place of purchase is the greengrocer (55,1%), followed by the supermarket (33,4%) (Table 2). The channel of direct sales in the company (Km0) is still seldom used. If we analize the period of the year when there is a higher frequency of fruit purchase, it is possible to see that summer is the season in which an increased consumption is reported, while autumn is the season that registers a decreased interest in this agricultural product (Fig. 2). The fruit which the university students of Messina prefer is the seasonal one, while there is a very low consumption of wild berries or of dried fruit (Fig. 3). As concerns the weekly expenditure on fruit shows that around 37% of the respondents spend between 10 and 20 euros (Table 3). Only 14,4% are willing to spend more than 20 euros. Finally, in relation to their purchasing attitudes, we asked them if they paid attention to labeling.
Fig. 1. Preferably fruit consumption during the day
Fig. 2. Season habitual consumption of fruit
Fig. 3. Type of fruit consumed regularly Table 1. How many times a week fruit consumption? Age group
<=21 age 22-24 age >=25 age Total
Everyday 44 46 40 130 44,90% 40,40% 47,10% 43,80% 3-5 times 28 33 25 86 28,6% 28,9% 29,4% 29% 1-2 times 23 32 20 75 23,5% 28,1% 23,5% 25,3% Never 3 3 0 6 3,10% 2,60% 0,00% 2,00% Total 98 114 85 297 100% 100% 100% 100%
Table 2. Favorite place for the purchase of fruit
Students (%) Supermarket 102 33,4 Greengrocer 168 55,1 Peddler 10 3,3 Retail sales (Km0) 4 1,3 Farmer's market 8 2,6 Total 292 95,7 Do notrespond 13 4,3 Total 305 100
Table 3. Weekly shopping buying fruit Students (%) Lessthan 10 € 94 30,8 Between 10 € and 20 € 112 36,7 More than 20 € 44 14,4 Total 250 82 Do notrespond 55 18 Total 305 100
Table 4. Check the label or the origin of the fruit purchased
Students (%) Yes 97 31,8 No 68 22,3 Sometimes 127 41,6 Total 292 95,7 Do notrespond 13 4,3 Total 305 100
Many of the respondents seldom check the purchased product’s label, the provenance of the product or they even disregard this kind of information. Only 31,8% of them claim that they actually read the label and that they pay attention to the fruit’s area of origin (Table 4).
Analysis of the University Student’s Fruit
Consumption in Relation to his Life-Style
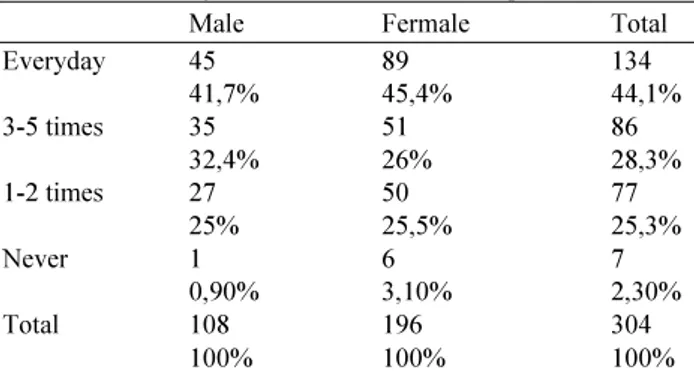
If we specifically analyze the life-style of the university students attending the University of Messina, we can underline that more than 63% do not smoke, 45,7% do not consume alcoholic drinks, 39,7% practice sport activities once or twice a week and 95,4% proclaim themselves to be omnivorous. According to the data derived from the sample, 71,5% of the respondents declare to be attending a three-year degree course, while 26,6% claims to be attending a master’s degree course. Turning to the analysis of the percentage profiles in relation to sex, we can notice that women consume more fruit than men (Table 5), a data which is in line with what was highlighted by other studies on this topic. Considering the respondent’s life-style, there is a tendency of non-smoking students (47,9%) to consume fruit every day (significant Pearson’s Chi-square Test with p<0.05) (Table 6). The following table, instead, indicates the tendency to consume fruit on a daily basis of those who do not make use of alcoholic drinks (Table 7). Moreover, we can notice a higher daily fruit consumption among the students coming from small size families (less than or equal to three components). Finally, the relationship between fruit consumption and age group was analyzed. The students who mainly consume fruit are aged on average between 22 and 24 (Table 8).
Table 5. How many times a week fruit consumption?
Male Fermale Total
Everyday 45 89 134 41,7% 45,4% 44,1% 3-5 times 35 51 86 32,4% 26% 28,3% 1-2 times 27 50 77 25% 25,5% 25,3% Never 1 6 7 0,90% 3,10% 2,30% Total 108 196 304 100% 100% 100%
Table 6. How many times a week fruit consumption? Do you smoke? Do yousmoke? --- Yes No Ex Total Everyday 35 92 7 134 36,5% 47,9% 46,7% 44,2% 3-5 times 27 59 0 86 28,1% 30,7% 0,00% 28,4% 1-2 times 30 39 7 76 31,3% 20,3% 46,7% 25,1% Never 4 2 1 7 4,2% 1% 6,7% 2,3% Total 96 192 15 303 100% 100% 100% 100%
Table 7. How many times a week fruit consumption? Alcoholconsumtion?
Alcoholconsumption?
---
Yes No Rarely Total
Everyday 15 67 52 134 37,5% 48,6% 41,6% 44,2% 3-5 times 13 38 35 86 32,5% 27,5% 28% 28,4% 1-2 times 10 30 36 76 25% 21,7% 28,8% 25,1% Never 2 3 2 7 5% 2,2% 1,6% 2,3% Total 40 138 125 303 100% 100% 100% 100%
Table 8. How many times a week fruit consumption? Age group <=21 age 22-24 age >=25 age Total
Everyday 44 46 40 130 44,9% 40,4% 47,1% 43,8% 3-5 times 28 33 25 86 28,6% 28,9% 29,4% 29% 1-2 times 23 32 20 75 23,5% 28,1% 23,5% 25,3% Never 3 3 0 6 3,1% 2,6% 0,00% 2% Total 98 114 85 297 100% 100% 100% 100%
Statistical Analysis
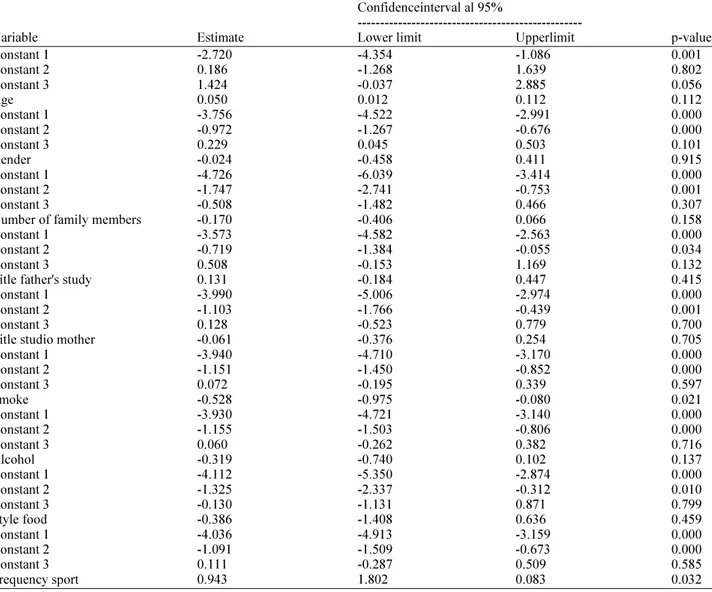
In order to identify the existence of possible variables that may influence the frequency of fruit consumption, it was deemed appropriate to estimate an adequate regression model. Since the response variable was one of ordinal type on 4 levels (0 = never; 1 = once or twice a week; 2 = 3-5 times a week; 3 = each day) the Cumulative Proportional Odds Model, an extension of the general linear model to ordinal categorical data, was used. It can be implemented through the Polytomous Universal Model (PLUM) procedure of the statistical software SPSS, within which it is possible to specify five targeted link functions. In the present work the logit link function was used (Norušis, 2009). We estimated as many models as the explanatory variables to be tested. In each model there are 3 constants, equal to the number of categories of the response variable less one. The model results are reported below. For
each model, the degree of association between the dependent variable and the explanatory variables is estimated. For this purpose we estimated Cox and Snell’s test, Nagelkerke’s tests and McFadden’s texts which have provided, in all the models, specific results that denote an adequate degree of adaptation to the data (Table 9). According to the results obtained by the estimate of the above mentioned model, it emerged that only two of the analyzed variables have a significant influence on the weekly frequency of fruit consumption and precisely smoking and the frequency of sport activity. In particular, the sign of the coefficient associated with smoking is negative, thus denoting that the students who do not smoke consume fruit more frequently; the positive sign of the coefficient related to the frequency of sport activies shows that those who assiduously attend a gym or, in general, practice a sport, are the same who habitually consume fruit.
Table 9. Cumulative results of the proportional odds Model for the dependence of the weekly frequency of fruit consumption by college students from the University of Messina
Confidenceinterval al 95%
---
Variable Estimate Lower limit Upperlimit p-value
Constant 1 -2.720 -4.354 -1.086 0.001 Constant 2 0.186 -1.268 1.639 0.802 Constant 3 1.424 -0.037 2.885 0.056 Age 0.050 0.012 0.112 0.112 Constant 1 -3.756 -4.522 -2.991 0.000 Constant 2 -0.972 -1.267 -0.676 0.000 Constant 3 0.229 0.045 0.503 0.101 Gender -0.024 -0.458 0.411 0.915 Constant 1 -4.726 -6.039 -3.414 0.000 Constant 2 -1.747 -2.741 -0.753 0.001 Constant 3 -0.508 -1.482 0.466 0.307
Number of family members -0.170 -0.406 0.066 0.158
Constant 1 -3.573 -4.582 -2.563 0.000
Constant 2 -0.719 -1.384 -0.055 0.034
Constant 3 0.508 -0.153 1.169 0.132
Title father's study 0.131 -0.184 0.447 0.415
Constant 1 -3.990 -5.006 -2.974 0.000
Constant 2 -1.103 -1.766 -0.439 0.001
Constant 3 0.128 -0.523 0.779 0.700
Title studio mother -0.061 -0.376 0.254 0.705
Constant 1 -3.940 -4.710 -3.170 0.000 Constant 2 -1.151 -1.450 -0.852 0.000 Constant 3 0.072 -0.195 0.339 0.597 Smoke -0.528 -0.975 -0.080 0.021 Constant 1 -3.930 -4.721 -3.140 0.000 Constant 2 -1.155 -1.503 -0.806 0.000 Constant 3 0.060 -0.262 0.382 0.716 Alcohol -0.319 -0.740 0.102 0.137 Constant 1 -4.112 -5.350 -2.874 0.000 Constant 2 -1.325 -2.337 -0.312 0.010 Constant 3 -0.130 -1.131 0.871 0.799 Style food -0.386 -1.408 0.636 0.459 Constant 1 -4.036 -4.913 -3.159 0.000 Constant 2 -1.091 -1.509 -0.673 0.000 Constant 3 0.111 -0.287 0.509 0.585 Frequency sport 0.943 1.802 0.083 0.032
Therefore, it can be affirmed that a healthy life-style is closely related to healthy eating habits. Lastly, in order to outline “the ideal consumer’s profile”, according to what emerged from the analysis of the sample which is the object of study, it is possible to affirm that it is that of a woman; who does not smoke, regularly practices sporting activity, does not drink alcohol, consumes fruit for the whole year (mainly seasonal fruit) both at lunch and between meals, purchases mainly at the greengrocer’s or at the supermarket and spends an average of 10 and 20 € each week.
Conclusion
The present survey establishing an informative reference framework regarding the propensity to fruit consumption in the diet of the students attending the University of Messina. The work highlighted that only 44,1% of the surveyed young people declare a daily fruit consumption of 75%, compared with the national data. Therefore, the prevalent food model is still far from the desirable one which implies the consumption of 3 or more portions of fruit each day (recommended quantity). Essentially, the majority of the sample consumes fruit every day, but only a percentage inferior to 10% eats more than three portions, namely a quantity which may represent an effective preventive action against a broad range of diseases. In most cases, the consumer doesn't know the meaning the healthy effects of the Mediterranean Diet. Consequently, the study which was carried out leads to propose the implementation of a dietary education and information system such as to favour the diffusion of healthy food models able to correct young people’s eating habits. In conclusion, although the results produced by this survey cannot be considered as originating from a typical random sampling procedure, they can definitely be used for cognitive purposes and for future researches. Indeed, it is a pilot survey on a good number of interviewed subjects in which the informative element is one of particular interest.
Author’s Contributions
The work is the result of a full collaboration of the authors. However, Maurizio Lanfranchi, in addition to coordination and setting of the study, designed the research plan, interpretations of data and contributed to the writing and reviewing the manuscript; Carlo Giannetto, involved in data investigation and drafting the manuscript; Agata Zirilli and Angela Alibrandi, contributed to the writing related statistical analysis and to the interpretations of data.
Ethics
This article is original and has not published elsewhere.
References
Asciuto, A., V. Borsellino, M. D'Acquisto, C.P. Di Franco and M. Di Gesaro et al., 2014. Land consolidation policies in Sicily and their effects on its farmland. Quality Access Success, 15: 79-85. Caracciolo, F., D. Depalo and J.B. Macias, 2014. Food
price changes and poverty in Zambia: An empirical assessment using household microdata. J. Int. Develop., 26: 492-507.DOI: 10.1002/jid.2976 Crescimanno, M., G.B. Ficani and G. Guccione, 2002.
The production and marketing of organic wine in Sicily. Briti. Food J., 104: 274-286.
DOI:10.1108/00070700210425714
Crescimanno, M., A. Galati and T. Bal, 2014. The role of the economic crisis on the competitiveness of the agri-food sector in the main Mediterranean countries. Agric. Economics, 60: 49-64.
D’Amico, M., G. Di Vita and G. Bracco, 2014a. Direct sale of agro-food product: The case of wine in Italy. Quality Access Success, 15: 247-253.
D’Amico, M., G. Di Vita, G. Chinnici, G. Pappalardo and B. Pecorino, 2014b. Short food supply chain and locally produced wines: Factors affecting consumer behavior. Italian J. Food Sci., 26: 329-334.
De Magistris, T., T. Del Giudice and F. Verneau, 2015. The effect of information on willingness to pay for canned tuna fish with different Corporate Social Responsibility (CSR) certification: A pilot study. J. Consumer Affairs, 49: 457-471.
DOI: 10.1111/joca.12046
Di Vita, G., G. Chinnici, G. Pappalardo, M. D'Amico and S. Bracco, 2014. Standard output versus standard gross margin, a new paradigm in the EU farm economic typology: What are the implications for wine-grape growers. J. Wine Res., 25: 229-242. DOI: 10.1080/09571264.2014.959660
Di Vita, G., M. D’Amico, G. La Via and E. Caniglia, 2013. Quality perception of PDO extra-virgin olive oil: Which attributes most influence Italian consumer. Agric. Econom. Rev., 14: 46-58.
Lanfranchi, M. and C
.
Giannetto, 2014.
Analysis of producers' knowledge about farmers' markets. Italian J. Food Sci., 26: 335-340.Lanfranchi, M., C. Giannetto and A. De Pascale, 2014a. Nature based tourism: Natural balance, impacts and management. Quality Access Success, 15: 224-229. Lanfranchi, M., C. Giannetto and A. De Pascale, 2014b.
A consideration of the factors influencing tourism development in relation to biodiversity conservation. WSEAS Trans. Bus. Econom., 11: 508-513.
Lanfranchi, M., C. Giannetto and A. De Pascale, 2014c. Economic implications of climate change for agricultural productivity. WSEAS Trans. Environ. Develop., 10: 233-241.
Lanfranchi, M., C. Giannetto and A. Zirilli, 2014d. Analysis of demand determinants of high quality food products through the application of the cumulative proportional odds model. Applied Math. Sci., 8: 3297-3305.
Lanfranchi, M., C. Giannetto, M. D’Amico and G. Di Vita, 2014e. Analysis of demand determinants of fish products in Messina: An economic survey on the fish consumption. Quality Access Success, 15: 106-108. Norušis, M.J., 2009. PASW Statistics 18 Statistical
Procedures Companion. 1st Edn., Prentice Hall,Upper Saddle River,ISBN-10: 0321673360, pp:630.
Schimmenti, E., A. Galati, V. Borsellino, C. Ievoli and C. Lupi et al., 2013. Behaviour of consumers of conventional and organic flowers and ornamental plants in Italy. Horticultural Sci., 40: 162-171. Sgroi, F., M. Candela, A.M. Di Trapani, M. Foderà and
R. Squatrito et al., 2015. Economic and financial comparison between organic and conventional farming in Sicilian lemon orchards. Sustainability, 7: 947-961.
Sgroi, F., A.M. Di Trapani, R. Testa and S. Tudisca, 2014. The rural tourism as development opportunity or farms. The case of direct sales in Sicily. Am. J. Agric. Biological Sci., 9: 407-419.
DOI: 10.3844/ajabssp.2014.407.419
Tudisca, S., A.M. Di Trapani, E. Donia, F. Sgroi and R. Testa, 2015. The market reorientation of farms: The case of olive growing in the nebrodi area. J. Food Products Market., 21: 179-192.
DOI: 10.1080/10454446.2013.843484
Verneau, F., F. Caracciolo, A. Coppola and P. Lombardi, 2014. Consumer fears and familiarity of processed food. The value of information provided by the FTNS. Appetite, 73: 140-146.