U
NIVERSITA’
D
EGLI
S
TUDI
D
I
N
APOLI
F
EDERICO
II
DOTTORATO DI RICERCA IN
BIOLOGIA
XXXI CICLO
IDENTIFICATION AND EXPLORATION OF NOVEL
MOLECULAR SIGNATURES IN BIOLOGICAL
SYSTEMS THROUGH GENOMICS AND
BIOINFORMATICS
ANNO ACCADEMICO 2017 – 2018
Tutor
Candidato
To my amazing wife
& my adorable son.
Tables of Contents
Introduction…..……….
6
Chapter I………....
9
Next Generation Sequencing applications for research: a genomics
(r)evolution………...
9
Bioinformatics: turning data into knowledge……….. 14
Use of public resources for integrative data analysis………... 17
Diatoms: a biological model for regulatory genomics………....
20
Understanding the biology of the sleeping malaria parasite………...
23
Hepatocellular carcinoma: the third leading cause of cancer deaths
worldwide………..
27
References………...
30
Chapter II……….
38
Short Tandem Repeats are enriched in promoters of diatom genes...
38
Introduction………
39
Methods………..
45
Results………...
45
Diatom genomes are enriched in triplet repeats………...
45
STRs are abundant in diatom promoters and introns………...
51
Diatom promoters are enriched in AAC repeats………
53
Discussion……...………...
58
Appendix. Code Example: annotate.pl………...
69
Chapter III……….………...
75
A comparative transcriptomic analysis of replicating and dormant
liver stages of the relapsing malaria parasite Plasmodium cynomolgi
75
Introduction………
76
Material and methods……….
78
Results………...
95
Hypnozoites express a smaller set of genes than schizonts………...
95
Comparative transcriptomic analysis allows the identification of
differential markers of P. Cynomolgi liver stages………. 101
Hypnozoites express few core pathways including the physiological
hallmarks of dormancy…………... 104
Expression pattern of potential drug targets in P. Cynomolgi liver stages 109
Discussion……….. 112
References………... 118
Chapter IV………...
128
Genomic analysis revealed new oncogenic signatures in
TP53-mutant hepatocellular carcinoma………... 128
Introduction……… 130
Material and methods………... 134
Results………... 139
Clinicopathologic characterization and molecular classification of HCCs 139
Spectrum of TP53 somatic mutations in HCCs……….………….... 140
Genomic instability is not associated with TP53 mutation type……...
146
TP53-mutant HCCs displayed heterogeneous oncogenic signatures…... 147
Mutational signatures in TP53-mutant HCCs……….... 150
Distinct types of TP53 mutations are associated with different prognoses 154
Discussion………... 156
Conclusion……….. 160
References………... 161
Introduction
The last two decades have witnessed rapid developments in –omics technologies which enable the study of biological and disease processes in a high throughput manner. Among the -omics approaches, genomics and the related bioinformatic methods have emerged as most popular applications able to accelerate science discoveries in basic research and drug discovery and therapeutics.
Genomics is an interdisciplinary field of science focusing on the structure, function, evolution, mapping, and editing of genomes (Wikipedia, url: https://en.wikipedia.org/wiki/Genomics). Over the years, the field of genomics has undergone several revolutions. Prior to the advent of Next Generation Sequencing (NGS), genomics was limited to the characterization of single disease-associated genes (e.g. Huntington disease, cystic fibrosis, cancer) or to the study of small genomes (e.g. bacteria, viruses). As physical mapping with large-insert clones became possible, the subcloned fragments of large genomes could be sequenced as individual projects, and their finished sequences combined together to reconstruct the sequence of entire chromosomes. Using this approach and beginning from 1985, in 2003 the Human Genome Project was able to complete the sequence of the DNA in the human genome (I. H. G. S. Consortium et al., 2001; Venter et al., 2001), thus providing a basic platform for the development of new technologies. In the same period, other large genomes, including those of model organisms, were also decoded (M. G. S.
from genome projects to develop rapid, high throughput assays to allow the measurement of genetic variation, gene expression and chromatin binding, which spread rapidly in all fields of research. Most recently, these methods were quickly replaced by NGS, which allows similar studies to be conducted with much higher sensitivity and in an unbiased whole-genome and –transcriptome fashion. As a result, sequencing has become an essential and obligatory tool and not only for biologists. In the early days of NGS, the initial focus of every genomic scientist was on the
de-novo assembly of novel genomes for species that were never sequenced before. These
efforts led to the completion of many novel genomic sequences which include even large genomes of mammals and plants. In the case of de-novo assembly, the genomic sequence is built from scratch without the use of an existing scaffold. Advances in sequencing technology have recently led to a dramatic increase in speed and throughput capacity, and a sharp reduction in costs. These improvements enabled the shift from de-novo to re-sequencing of entire genomes from additional individuals of species already sequenced. In the case of re-sequencing, short reads can be aligned to reference genomes as a substrate for variation discovery or gene expression analysis. Re-sequencing applications provide the scientific community with an unprecedented opportunity to address fundamental evolutionary questions, as well as to extend the use of sequencing to population genetic studies to infer ancient population history. The availability of new data types given by an always increasing number of NGS applications continues to engage and excite the computational biology community working on software development and on the analysis of new data types generated to solve complex biomedical problems.
In this context, the main objective of my research was to explore different biological systems to identify new molecular signals through the development and implementation of genomic and bioinformatic methods. This objective was accomplished by participating to three different research projects where I applied genomic and bioinformatic solutions to different areas of biology: genome composition, organization and regulation, malaria biology, and cancer. The first chapter provides an introduction to the main technology and biology concepts explored in my research, while the following three chapters describe in details the research work conducted during my studies.
Chapter I
Next Generation Sequencing applications for research: a
genomics (r)evolution.
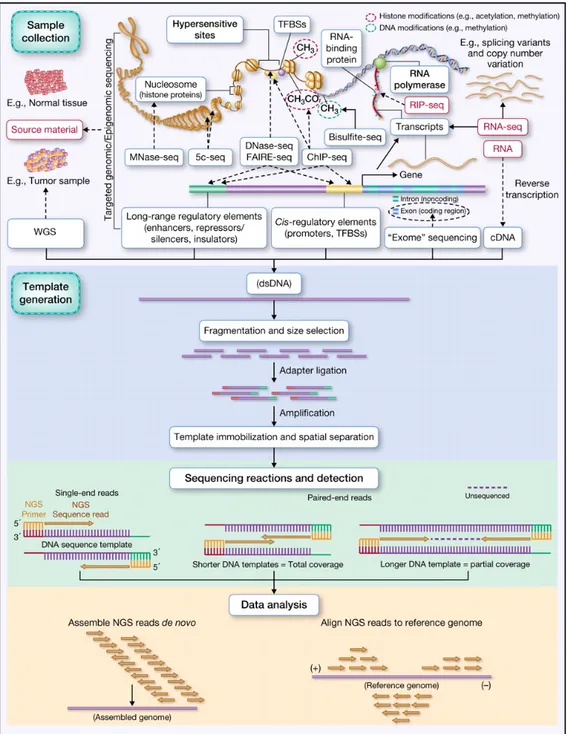
The use of sequencers as molecule-counting devices is immensely popular. DNA sequencers are capable of sequencing large numbers of different DNA fragments in parallel in a single reaction. In general, NGS experiments consist of 4 phases: sample collection, template generation, sequencing reactions and detection, and data analysis. All the sequencing methods monitor the sequential addition of nucleotides to immobilized and spatially arrayed DNA templates in more or less similar ways, but mostly differ in how the templates are generated and interrogated to obtain the sequences (Linnarsson, 2010). Figure 1 shows a basic workflow for NGS analysis (Rizzo & Buck, 2012).
The range and the scope of DNA sequencing applications is very broad and largely depends on the biological questions to address in the study (Figure 1). Normal and diseased tissues can be used as source for the extraction of nucleic acids in a whole genome or targeted experiment. Among the most popular applications, whole genome sequencing starts from genomic DNA as input and can be applied to human genetics and evolution studies for the detection of genome-wide genetic variations like Single Nucleotide Polymorphims (SNPs), Insertion and Deletions (InDels), large genomic rearrangements (e.g. large deletions, duplications, insertions, inversions or
translocations), and even DNA repeats like Short Tandem Repeats (STRs). Whole genome sequencing can also provide information on cancer and disease-associated mutations, which makes it a key application in the field of precision medicine. Alternatively to the whole genome, whole-exome sequencing can be used for sequencing all of the known exons of protein-coding genes in a genome (known as the “exome”). This method also starts from genomic DNA and consists of a first step to select only the subset of DNA that encodes proteins (the “exons”) and a second step to sequence the selected exonic DNA using any high-throughput sequencing technology.
Transcriptome sequencing starts from either total RNA or enriched RNA fractions. This application is based on shotgun sequencing of either full-length or 3′ ends of cDNA, and is used to reveal the presence, quantity and structure of RNA in a biological sample under specific conditions (Wang, Gerstein, & Snyder, 2009). Compared to hybridization-based RNA quantification methods such as microarrays, sequencing-based transcriptome detection can quantify gene expression with low background, high accuracy and high levels of reproducibility within a large dynamic range. In addition, transcriptome sequencing does not require an existing genome sequence and can detect mutations, splice variants and fusion genes that cannot be detected by microarrays. Among the library preparation methods available, the standard poly(A)+ enrichment provides a comprehensive, detailed, and accurate view of polyadenylated RNAs. However, on samples of suboptimal quality ribosomal RNA depletion and exon capture methods have recently been reported as better alternatives (S. Schuierer et al.,
ChIP-sequencing is widely used to analyze protein-DNA interactions for epigenetic studies. It combines chromatin immunoprecipitation (ChIP) with massively parallel DNA sequencing to identify binding sites of DNA-associated proteins, and can be used to precisely map global binding sites for any protein of interest. ChIP sequencing offers higher resolution and more precise and abundant information in comparison with array-based ChIP-on-chip. Likewise ChIP-seq for the genomic DNA, RIP-Sequencing identifies the binding sites of proteins to the RNA within RNA-protein complexes extracted through immunoprecipitation with antibodies targeting the protein of interest. After RNase digestion, the RNA fragments protected by protein binding are extracted, reverse-transcribed to cDNA and sequenced.
The above-listed NGS applications, and in general all the methods shown in Figure 1, generate nucleic acids (e.g. genomic DNA, immunoprecipitated DNA, total RNA, enriched RNA fractions) that in the case of RNA need to be converted into double-stranded DNA (dsDNA) to proceed with the library preparation. These dsDNA fragments are subsequently converted into a “library” of sequencing templates, through standard steps of fragmentation, size selection, and adapter ligation. Fragmentation allows to break the DNA templates into smaller “sequenceable” fragments, which are then “size-selected” to enrich for fragments of a size range that is compatible with the sequencing platform’s specifications. The ligation of platform-specific primers (or adapters) to the ends of the library fragments is used to enable priming for downstream amplification (e.g. clustering generation) and the sequencing reactions. Depending on the NGS technology used, a library is either sequenced directly or is amplified then sequenced (e.g. cluster generation via bridge
DNA fragment populations for sequencing, typically by attachment to solid surfaces (e.g. a flow cell) or beads. This allows the downstream sequencing reaction to operate as millions of microreactions carried out in parallel on each spatially distinct template.
Figure 1. Basic workflow for NGS experiments.
Bioinformatics: turning data into knowledge.
Driven by the rapid introduction of high-throughput sequencing in biological research, data generation has shifted to become faster and cheaper while data have been growing in complexity, diversity, and volume. This poses an important challenge to those research institutes that are not adequately prepared for the storage and for the high-performance computing analysis of “big data” and are required to access the external cloud computing to scale up to extra informatics capacity. Moreover, investing in the training of the next generation of scientists on “data science” disciplines is becoming fundamental for all research centers nowadays.
Bioinformatics is an interdisciplinary field that develops methods, databases, and software for the management, analysis and interpretation of biological data. As important as techniques to produce the NGS data are, bioinformatic approaches are equally critical for the successful analysis of those data. Many analytical approaches depend on the digital nature of NGS data, which depends on how the individual DNA fragments of the library are prepared prior to the sequencing reaction (e.g. targeted or whole genome). These fragments can be sequenced either as single-read or paired-end reads (e.g. originating from both ends of the molecule) to generate the raw data used for downstream analysis (Figure 1). The description of the standard RNA-seq workflow can serve as an example of how bioinformatics is applied to NGS data analysis.
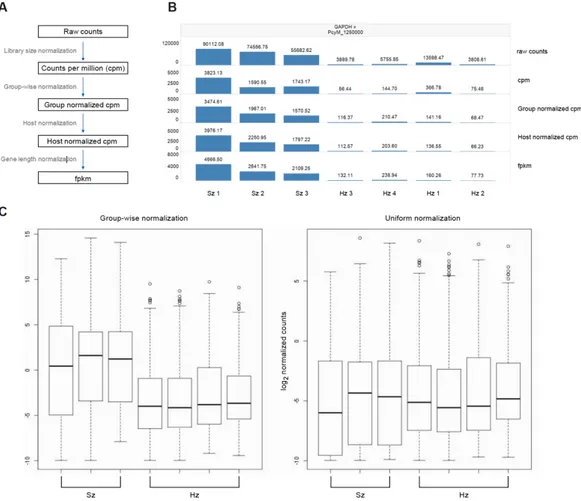
such as quality control, alignment, quantification and identification of differentially expressed genes (Figure 2). First, raw NGS reads undergo quality assessment and filtering. Second, the quality-filtered reads in Fastq format are aligned against reference sequences (e.g. genome or transcriptome). The choice of the right reference genome and annotation is key for the success of the downstream analysis. Third, expression estimates are derived from the aligned reads to obtain the gene expression counts. For baseline expression, gene counts, which represent the total number of reads aligned to each gene, can be further transformed into Counts Per Million (CPM; normalization by total number of mapped reads per sample) or Fragments per Kilobase of exon per Million of fragments mapped (FPKM; further normalization by effective gene length). Fourth, for differential analysis, these count estimates are used to identify differentially expressed genes, usually by computing fold changes and P-values (Figure 2). The bioinformatic community has been very proficient in the development of software tools for the analysis of RNA-seq gene expression data. Tophat2 (Kim et al., 2013) and STAR (Dobin et al., 2013) are among the most popular aligners; EQP (Sven Schuierer & Roma, 2016), htseq-count (Anders, Pyl, & Huber, 2015), featureCounts (Liao, Smyth, & Shi, 2014) and Cufflinks2 (Trapnell et al., 2012) are used for the quantification step for the generation of gene counts. DESeq2 (Love, Huber, & Anders, 2014) and Cuffdiff (Trapnell et al., 2012) are used for the differential gene expression analysis.
Use of public resources for integrative data analysis.
Over the last decades, the scientific community has generated an immense amount of genomic data that is now deposited in large public repositories and available to other scientists wanting to conduct further analyses. For instance, reference genome sequences and annotation files can be accessed in genomic repositories like the “Ensembl Genome database” developed by the European Bioinformatics Institute (EBI) and the Wellcome Trust Sanger Institute in UK (Zerbino et al., 2018), the “UCSC Genome Browser” hosted at the University of Santa Cruz in California (Casper et al., 2018), and the “Genome Portal” of the Joint Genome Institute (JGI) (Nordberg et al., 2014), or even in species-specific repositories as for instance “PlasmoDB” which is a genome database for the genus Plasmodia useful to study the biology of the malaria parasites (Aurrecoechea et al., 2009).
Likewise, there has been a multitude of NGS experimental datasets deposited in the public domain which provides unprecedented opportunities for computational scientists to explore biology by data integrative approaches. For instance, the NCBI Sequence Read Archive (SRA, https://www.ncbi.nlm.nih.gov/sra) (Leinonen, Sugawara, & Shumway, 2011) and the European Nucleotide Archive (ENA,
https://www.ebi.ac.uk/ena) (Leinonen, Akhtar, et al., 2011) are major public repositories hosting sequencing data generated by individual scientists or large consortia. In addition, for human relevant datasets, the database of Genotypes and Phenotypes (dbGAP, https://www.ncbi.nlm.nih.gov/gap) hosts and distributes the data and results from studies that have investigated the interaction of genotype and
phenotype in humans (Tryka et al., 2014); similarly, the recent European Genome-phenome Archive (EGA, https://ega-archive.org) enables the archiving and sharing of all types of personally identifiable genetic and phenotypic data resulting from biomedical research projects (Lappalainen et al., 2015). Large scale sequencing projects that are led by public or private consortia routinely share their datasets in one or more of these repositories. Examples related to cancer studies are provided by The
Cancer Genome Atlas Research Network Atlas (TCGA,
https://cancergenome.nih.gov) (Gao et al., 2013; Hutter & Zenklusen, 2018), the Cancer Cell Line Encyclopedia (CCLE, https://portals.broadinstitute.org/ccle) (Barretina et al., 2012), and the Catalogue Of Somatic Mutations In Cancer (COSMIC,
https://cancer.sanger.ac.uk/cosmic) (Forbes et al., 2017). The sequencing results generated by these large cancer projects, for instance, could be compared with the sequencing information from 53 non-diseased tissue sites across nearly 1000 individuals obtained by the Genotype-Tissue Expression (GTEx) project (The GTEx Consortium, 2013).
Data sharing is more and more considered good practice in computational biology to ensure research reproducibility. To enhance data reusability, the scientific community has been working on making the data FAIR, e.g. Findable, Accessible, Interoperable, and Reusable according to the FAIR principles (Wilkinson et al., 2016). For the same reason, scientific journals often require deposition of raw sequencing data and downstream results in public repository. This means that other scientists may access these data and materials in the future to conduct further research on these subjects.
systems biology approaches in solving complex biomedical problems. Genomics, transcriptomics, proteomics and metabolomics are being combined in a systems biology approach to understand the biological system as a whole rather than focusing on individual factors. Being at the core of this new discipline, genomics approaches are now converging rapidly through the use of next-generation sequencing which enables, via a single technology, the acquisition of large datasets on genetic markers, epigenetic markers, transcriptome profiles, translational profiling, as well as relationships amongst these. The integration of such genomic datasets with proteomic and metabolomic data require the development of novel approaches for meta-analysis. Multi-omics studies are highly promising but also challenging as profound coordinated efforts in bioinformatics and biostatistics are required to connect the individual factors. One major challenge is represented by the heterogeneity of data formats that are generated by the different omic- technologies. Integration of more than two different omics data formats is still not routine and requires optimized software tools together with well-trained computational scientists to generate comprehensible workflows for the analysis of big data.
Diatoms: a biological model for regulatory genomics.
Marine diatoms are unicellular photosynthetic algae and a key phytoplankton group in the ocean (Armbrust, 2009). They play a fundamental role in global carbon cycles as they are estimated to be responsible for about 20% of global primary productivity (Armbrust, 2009; Smith et al., 2015). Diatoms have played a decisive role in the ecosystem for millions of years for the enormous amount of oxygen they generate on earth and for being the most important sources of biomass in oceans. These single-celled organisms are being studied in several commercial and industrial applications for the production of carbon-neutral fuels, pharmaceuticals, foods, biomolecules, nanomaterials, and for the bioremediation of contaminated water (Bozarth, Maier, & Zauner, 2009). Diatom cells are surrounded by a silica wall known as a “frustule” made up of two valves called “thecae”, that typically overlap one another. Based on the shape of their frustule diatoms are classified into: 1) Centrales, centric diatoms that are radially symmetrical; 2) Pennales, pennate diatoms that are bilaterally symmetrical (Armbrust, 2009). The frustules of death diatoms sink to the bottom of the oceans and decomposes into diatomite, a remnant material that is used commercially as filters, mineral fillers, insulation material, insecticide, anti-caking agents, or fine abrasive. These simple eukaryotic organisms are of interest to many biologists for their extraordinary capacity to rapidly adapt to new environments. They represent an unique evolutionary model for investigating the role of genomic
The study described in Chapter II exemplifies the application of genomics and bioinformatics to the study of short tandem repeats (STRs) in diatoms. Specifically, it provides an alternative to the classical view of evolution in which changes occur via the accumulation of single point mutations by extending it to the inclusion of additional mechanisms that allow for the rapid gain, loss, and rearrangement of significant portions of the genome for instance through dynamic expansion or contraction of short repetitive sequences. These dynamic modifications of the genomes are truly fascinating as they enable simple organisms like protists to evolve rapidly in response to environmental changes, accounting for their wide dissemination in the biosphere. The study identified and characterized STR sequences in all the diatom genomes sequenced so far, including the Pennate diatoms Phaeodactylum tricornutum (Bowler et al., 2008), Pseudo-nitzschia multistriata (Basu et al., 2017) and
Fragilariopsis cylindrus (Mock et al., 2017), and the centric diatom Thalassiosira pseudonana (Armbrust et al., 2004) (Figure 3). Results show, for the first time, that
these genomes are enriched in triplet repeats that are mostly located in gene regulatory regions like promoters.
Understanding the biology of the sleeping malaria parasite.
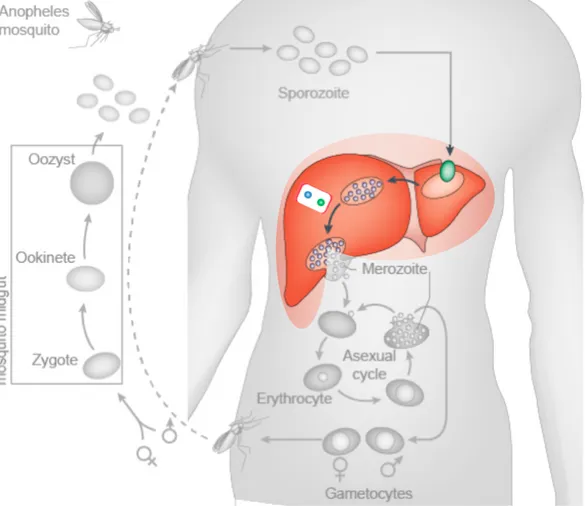
Malaria is a life-threatening disease transmitted to humans through the bite of an infected Anopheles mosquito carrying the Plasmodium parasite. More than 100 species of Plasmodium have been identified so far, of which only four have long been recognized to infect humans: P. falciparum, P. vivax, P. ovale and P. malariae.
At the beginning of the parasite life cycle, female mosquitoes take blood meals to carry out egg production (Figure 4). Once injected in the human skin, the sporozoites rapidly leave the injection site and migrate through the bloodstream to the liver, where they invade hepatocytes and develop into the growing liver stage, the “schizonts”. P. vivax and P. Ovale, however, can form dormant liver stages called “hypnozoites” that can re-activate months or years later giving rise to clinical malaria (relapses) without being exposed to new infectious mosquito bites. The schizonts parasites grow and multiply first in the liver cells and then in the red blood cells. When growing inside these cells the parasites destroy them, releasing daughter parasites called “merozoites” that continue the cycle by invading other cells. Malaria symptoms (like fever, headache, nausea, vomiting, abdominal pain, diarrhea, among others) are caused by the blood stage parasites. In the blood stream the parasites enter the asexual cycle. There the new forms termed “gametocytes” can be picked up by a female Anopheles mosquito during a new blood meal to start another cycle of growth and multiplication in the mosquito. Thus the mosquito acts as a vector carrying the disease from one human to another.
P. vivax is the major cause of malaria outside of Africa with an estimated 13.8
million malaria cases globally in 2015 (World Health Organization (WHO), 2015). Eradication of vivax malaria will only be feasible if effective and well-tolerated therapies kill hypnozoites and hence prevent disease relapse. Recently, the FDA approved tafenoquine as a radical cure therapy and prophylactic for P. vivax malaria infection (Frampton, 2018). This represents a significant advance in the field as tafenoquine is administered as a single dose regimen, which is a very important improvement for patient compliance when compared to the 14-day long drug regimen of its closely related predecessor primaquine. Like primaquine, tafenoquine cannot be administered to patients with glucose-6-phosphate dehydrogenase (G6PD) deficiency, a common genetic disorder in malaria endemic countries, due to serious adverse side-effects and life-threatening drug-induced hemolysis (Mazier, Rénia, & Snounou, 2009; Wells, Burrows, & Baird, 2010). For this reason, new drugs are urgently needed to achieve malaria elimination.
The second study presented in Chapter III describes the application of genomics and bioinformatics for the transcriptomic analysis of the malaria hypnozoites. Using a combination of genetically engineered fluorescent P. cynomolgi parasites (the P. vivax sister parasites displaying identical biology in the monkeys), in vitro liver stage culture, cell-sorting and RNA-seq, primary monkey hepatocytes were profiled six and seven days after infection with the Plasmodium parasites to investigate the hypnozoite biology. The analysis of the sequencing data revealed that hypnozoites have a reduced transcriptional rate and express a lower number of genes compared to schizonts, the
minimum number of biological pathways that allow only the maintenance of the basic cellular functions necessary for its survival in the host hepatocyte. This data set and the analyses carried out represent a precious resource for the discovery of new vaccines and effective treatments to combat malaria.
Hepatocellular carcinoma: the third leading cause of cancer
deaths worldwide.
Representing more than 90% of all primary liver malignancies, hepatocellular carcinoma (HCC) is one of the few cancer types with rising incidence and mortality. This cancer occurs primarily in patients affected by chronic liver disease and cirrhosis. Although still under investigation, it is hypothesized that hepatic stem cells are the cells that give rise to this disease. Available treatments include only three approved systemic agents, namely sorafenib and regorafenib (both kinase inhibitors) and nivolumab (immune checkpoint inhibitor). Despite the extensive genomic and transcriptomic characterization of the features and diversity of HCC, there is still a urgent need for the identification of novel therapeutic targets in HCC and of robust biomarkers of response to therapy.
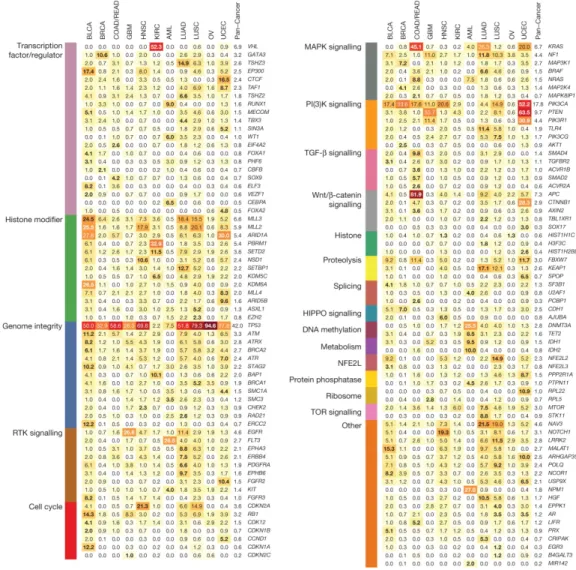
Cancer is a genetic disease caused by accumulation of DNA mutations and epigenetic alterations leading to uncontrolled cell proliferation and tumor formation. Genes involved in liver metabolism, Wnt and p53 signalling have been shown to be recurrently altered in HCC (Ahn et al., 2014; Ally et al., 2017; Fujimoto et al., 2012; Guichard et al., 2012; Hutter & Zenklusen, 2018; Schulze et al., 2015). CTNNB1 (β-catenin) and TP53 (p53) are the most frequently mutated protein-coding genes, both mutated in 20–40% of HCC patients (Ahn et al., 2014; Ally et al., 2017; Fujimoto et al., 2012; Guichard et al., 2012; Hutter & Zenklusen, 2018; Schulze et al., 2015). TP53 is also the most frequently mutated gene in human cancer (Kandoth et al., 2013)
(Figure 5). The p53 protein modulates multiple cellular functions, including transcription, DNA synthesis and repair, cell cycle arrest, senescence and apoptosis (Vogelstein, Lane, & Levine, 2000). Mutations in TP53 can abrogate these functions, leading to genetic instability and progression to cancer (Vogelstein et al., 2000).
The third study, presented in Chapter IV, exemplifies the use of genomics and bioinformatics to discover new molecular signals in the patients affected by hepatocellular carcinoma and bearing mutations in the TP53 gene. Taking advantage of the public RNA-seq data sets from The Cancer Genome Atlas (TCGA), the study defines the spectrum of the TP53 somatic mutations in HCC patients and its association with clinicopathologic features. Four distinct subsets of TP53 mutations, each characterized by specific molecular signals, were identified from 373 HCC cases. Patients with TP53 mutations had worse survival than patients with wild-type TP53. The study indicated that some genetic heterogeneity of the TP53 mutation exists in HCC cancer and that mutations in TP53 should be considered for the molecular characterization of HCC.
Figure 5. The 127 Significantly Mutated Genes (SMGs) from 20 cellular processes in cancer
identified in 12 cancer types. Source: Kandoth et al, Nature, 2013.
References
Ahn, S.-M., Jang, S. J., Shim, J. H., Kim, D., Hong, S.-M., Sung, C. O., … Kong, G. (2014). Genomic portrait of resectable hepatocellular carcinomas: Implications of RB1 and FGF19 aberrations for patient stratification. Hepatology, 60(6), 1972–1982. https://doi.org/10.1002/hep.27198
Ally, A., Balasundaram, M., Carlsen, R., Chuah, E., Clarke, A., Dhalla, N., … Laird, P. W. (2017). Comprehensive and Integrative Genomic Characterization of Hepatocellular Carcinoma. Cell, 169(7), 1327–1341.e23.
https://doi.org/https://doi.org/10.1016/j.cell.2017.05.046
Anders, S., Pyl, P. T., & Huber, W. (2015). HTSeq—a Python framework to work with high-throughput sequencing data. Bioinformatics, 31(2), 166–169. https://doi.org/10.1093/bioinformatics/btu638
Armbrust, E. V. (2009). The life of diatoms in the world ’ s oceans, 459(May), 185– 192. https://doi.org/10.1038/nature08057
Armbrust, E. V., Berges, J. A., Bowler, C., Green, B. R., Martinez, D., Putnam, N. H., … Rokhsar, D. S. (2004). The Genome of the Diatom Thalassiosira
Pseudonana: Ecology, Evolution, and Metabolism. Science, 306(5693), 79–86. https://doi.org/10.1126/science.1101156
Aurrecoechea, C., Brestelli, J., Brunk, B. P., Dommer, J., Fischer, S., Gajria, B., … Wang, H. (2009). PlasmoDB : a functional genomic database for malaria parasites, 37(October 2008), 539–543. https://doi.org/10.1093/nar/gkn814
… Garraway, L. A. (2012). The Cancer Cell Line Encyclopedia enables
predictive modelling of anticancer drug sensitivity. Nature, 483, 603. Retrieved from http://dx.doi.org/10.1038/nature11003
Basu, S., Patil, S., Mapleson, D., Russo, M. T., Vitale, L., Fevola, C., … Ferrante, M. I. (2017). Finding a partner in the ocean: molecular and evolutionary bases of the response to sexual cues in a planktonic diatom. New Phytologist, 215(1), 140–156. https://doi.org/10.1111/nph.14557
Bowler, C., Allen, A. E., Badger, J. H., Grimwood, J., Jabbari, K., Kuo, A., … Grigoriev, I. V. (2008). The Phaeodactylum genome reveals the evolutionary history of diatom genomes. Nature, 456, 239. Retrieved from
http://dx.doi.org/10.1038/nature07410
Bozarth, A., Maier, U., & Zauner, S. (2009). Diatoms in biotechnology : modern tools and applications, 195–201. https://doi.org/10.1007/s00253-008-1804-8 Casper, J., Zweig, A. S., Villarreal, C., Tyner, C., Speir, M. L., Rosenbloom, K. R.,
… Kent, W. J. (2018). The UCSC Genome Browser database: 2018 update.
Nucleic Acids Research, 46(D1), D762–D769.
https://doi.org/10.1093/nar/gkx1020
Consortium, I. H. G. S., Lander, E. S., Linton, L. M., Birren, B., Nusbaum, C., Zody, M. C., … Morgan, M. J. (2001). Initial sequencing and analysis of the human genome. Nature, 409, 860. Retrieved from http://dx.doi.org/10.1038/35057062 Consortium, M. G. S., Chinwalla, A. T., Cook, L. L., Delehaunty, K. D., Fewell, G.
A., Fulton, L. A., … Zody, M. C. (2002). Initial sequencing and comparative analysis of the mouse genome. Nature, 420, 520. Retrieved from
Consortium, R. G. S. P., Gibbs, R. A., Weinstock, G. M., Metzker, M. L., Muzny, D. M., Sodergren, E. J., … Collins, F. (2004). Genome sequence of the Brown Norway rat yields insights into mammalian evolution. Nature, 428, 493. Retrieved from http://dx.doi.org/10.1038/nature02426
Dobin, A., Davis, C. A., Schlesinger, F., Drenkow, J., Zaleski, C., Jha, S., … Gingeras, T. R. (2013). STAR: ultrafast universal RNA-seq aligner.
Bioinformatics, 29(1), 15–21. https://doi.org/10.1093/bioinformatics/bts635
Forbes, S. A., Beare, D., Boutselakis, H., Bamford, S., Bindal, N., Tate, J., … Campbell, P. J. (2017). COSMIC: somatic cancer genetics at high-resolution.
Nucleic Acids Research, 45(D1), D777–D783.
https://doi.org/10.1093/nar/gkw1121
Frampton, J. E. (2018). Tafenoquine: First Global Approval. Drugs, 78(14), 1517– 1523. https://doi.org/10.1007/s40265-018-0979-2
Fujimoto, A., Totoki, Y., Abe, T., Boroevich, K. A., Hosoda, F., Nguyen, H. H., … Nakagawa, H. (2012). Whole-genome sequencing of liver cancers identifies etiological influences on mutation patterns and recurrent mutations in chromatin regulators. Nature Genetics, 44, 760. Retrieved from
http://dx.doi.org/10.1038/ng.2291
Gao, J., Aksoy, B. A., Dogrusoz, U., Dresdner, G., Gross, B., Sumer, S. O., … Schultz, N. (2013). Integrative analysis of complex cancer genomics and clinical profiles using the cBioPortal. Science Signaling, 6(269), pl1. https://doi.org/10.1126/scisignal.2004088
copy-number changes identifies key genes and pathways in hepatocellular carcinoma. Nature Genetics, 44, 694. Retrieved from
http://dx.doi.org/10.1038/ng.2256
Hutter, C., & Zenklusen, J. C. (2018). The Cancer Genome Atlas: Creating Lasting Value beyond Its Data. Cell, 173(2), 283–285.
https://doi.org/https://doi.org/10.1016/j.cell.2018.03.042
Kandoth, C., McLellan, M. D., Vandin, F., Ye, K., Niu, B., Lu, C., … Ding, L. (2013). Mutational landscape and significance across 12 major cancer types.
Nature, 502, 333. Retrieved from http://dx.doi.org/10.1038/nature12634
Kim, D., Pertea, G., Trapnell, C., Pimentel, H., Kelley, R., & Salzberg, S. L. (2013). TopHat2: accurate alignment of transcriptomes in the presence of insertions, deletions and gene fusions. Genome Biology, 14(4), R36.
https://doi.org/10.1186/gb-2013-14-4-r36
Lappalainen, I., Almeida-King, J., Kumanduri, V., Senf, A., Spalding, J. D., ur-Rehman, S., … Flicek, P. (2015). The European Genome-phenome Archive of human data consented for biomedical research. Nature Genetics, 47, 692. Retrieved from http://dx.doi.org/10.1038/ng.3312
Leinonen, R., Akhtar, R., Birney, E., Bower, L., Cerdeno-Tárraga, A., Cheng, Y., … Cochrane, G. (2011). The European Nucleotide Archive. Nucleic Acids
Research, 39(suppl_1), D28–D31. https://doi.org/10.1093/nar/gkq967
Leinonen, R., Sugawara, H., & Shumway, M. (2011). The sequence read archive.
Nucleic Acids Research, 39(Database issue), D19-21.
purpose program for assigning sequence reads to genomic features.
Bioinformatics, 30(7), 923–930. https://doi.org/10.1093/bioinformatics/btt656
Linnarsson, S. (2010). Recent advances in DNA sequencing methods – general principles of sample preparation. Experimental Cell Research, 316(8), 1339– 1343. https://doi.org/https://doi.org/10.1016/j.yexcr.2010.02.036
Love, M. I., Huber, W., & Anders, S. (2014). Moderated estimation of fold change and dispersion for RNA-seq data with DESeq2. Genome Biology, 15(12), 550. https://doi.org/10.1186/s13059-014-0550-8
Mazier, D., Rénia, L., & Snounou, G. (2009). A pre-emptive strike against
malaria's stealthy hepatic forms. Nature Reviews Drug Discovery, 8, 854. Retrieved from http://dx.doi.org/10.1038/nrd2960
Mock, T., Otillar, R. P., Strauss, J., McMullan, M., Paajanen, P., Schmutz, J., … Grigoriev, I. V. (2017). Evolutionary genomics of the cold-adapted diatom Fragilariopsis cylindrus. Nature, 541(7638), 536–540.
Myers, E. W., Sutton, G. G., Delcher, A. L., Dew, I. M., Fasulo, D. P., Flanigan, M. J., … Venter, J. C. (2000). A Whole-Genome Assembly of Drosophila. Science,
287(5461), 2196–2204. https://doi.org/10.1126/science.287.5461.2196
Nordberg, H., Cantor, M., Dusheyko, S., Hua, S., Poliakov, A., Shabalov, I., … Dubchak, I. (2014). The genome portal of the Department of Energy Joint Genome Institute: 2014 updates. Nucleic Acids Research, 42(D1), D26–D31. Rizzo, J. M., & Buck, M. J. (2012). Key Principles and Clinical Applications of
Russo, M. T., Annunziata, R., Sanges, R., Ferrante, M. I., & Falciatore, A. (2015). The upstream regulatory sequence of the light harvesting complex Lhcf2 gene of the marine diatom Phaeodactylum tricornutum enhances transcription in an orientation- and distance-independent fashion. Marine Genomics, 24, 69–79. https://doi.org/https://doi.org/10.1016/j.margen.2015.06.010
Schuierer, S., Carbone, W., Knehr, J., Petitjean, V., Fernandez, A., Sultan, M., & Roma, G. (2017). A comprehensive assessment of RNA-seq protocols for degraded and low-quantity samples. BMC Genomics, 18(1).
https://doi.org/10.1186/s12864-017-3827-y
Schuierer, S., & Roma, G. (2016). The exon quantification pipeline (EQP): a comprehensive approach to the quantification of gene, exon and junction expression from RNA-seq data. Nucleic Acids Research, gkw538. https://doi.org/10.1093/nar/gkw538
Schulze, K., Imbeaud, S., Letouzé, E., Alexandrov, L. B., Calderaro, J., Rebouissou, S., … Zucman-Rossi, J. (2015). Exome sequencing of hepatocellular
carcinomas identifies new mutational signatures and potential therapeutic targets. Nature Genetics, 47(5), 505–511. https://doi.org/10.1038/ng.3252 Smith, S. R., Glé, C., Abbriano, R. M., Traller, J. C., Davis, A., Trentacoste, E., …
Hildebrand, M. (2015). Transcript level coordination of carbon pathways during silicon starvation-induced lipid accumulation in the diatom Thalassiosira
pseudonana. New Phytologist, 210(3), 890–904. https://doi.org/10.1111/nph.13843
Trapnell, C., Hendrickson, D. G., Sauvageau, M., Goff, L., Rinn, J. L., & Pachter, L. (2012). Differential analysis of gene regulation at transcript resolution with RNA-seq. Nature Biotechnology, 31, 46. Retrieved from
http://dx.doi.org/10.1038/nbt.2450
Tryka, K. A., Hao, L., Sturcke, A., Jin, Y., Wang, Z. Y., Ziyabari, L., … Feolo, M. (2014). NCBI’s Database of Genotypes and Phenotypes: dbGaP. Nucleic Acids
Research, 42(D1), D975–D979. https://doi.org/10.1093/nar/gkt1211
Venter, J. C., Adams, M. D., Myers, E. W., Li, P. W., Mural, R. J., Sutton, G. G., … Zhu, X. (2001). The Sequence of the Human Genome. Science, 291(5507), 1304–1351. https://doi.org/10.1126/science.1058040
Vogelstein, B., Lane, D., & Levine, A. J. (2000). Surfing the p53 network. Nature,
408, 307. Retrieved from http://dx.doi.org/10.1038/35042675
Wang, Z., Gerstein, M., & Snyder, M. (2009). RNA-Seq: a revolutionary tool for transcriptomics. Nature Reviews Genetics, 10, 57. Retrieved from
http://dx.doi.org/10.1038/nrg2484
Wells, T. N. C., Burrows, J. N., & Baird, J. K. (2010). Targeting the hypnozoite reservoir of Plasmodium vivax: the hidden obstacle to malaria elimination.
Trends in Parasitology, 26(3), 145–151.
https://doi.org/10.1016/j.pt.2009.12.005
Wilkinson, M. D., Dumontier, M., Aalbersberg, Ij. J., Appleton, G., Axton, M., Baak, A., … Mons, B. (2016). The FAIR Guiding Principles for scientific data management and stewardship. Scientific Data, 3, 160018. Retrieved from
(http://www.who.int/malaria/publications/world-malaria-report-2015/en/). Zerbino, D. R., Achuthan, P., Akanni, W., Amode, M. R., Barrell, D., Bhai, J., …
Flicek, P. (2018). Ensembl 2018. Nucleic Acids Research, 46(D1), D754–D761. https://doi.org/10.1093/nar/gkx1098
Chapter II
Short tandem repeats are enriched in promoters of diatom
genes
Abstract
To date, short tandem repeats (STRs) remain understudied in lower eukaryotes. Here, we present the first genome-wide survey of STRs in four marine diatom genomes, including the pennate diatoms Phaeodactylum tricornutum, Pseudo-nitzschia
multistriata and Fragilariopsis cylindrus and the centric diatom Thalassiosira pseudonana. For the first time we discover that the most common STRs in diatom
genomes are triplets, of which AAC is the most abundant. We found that over 75% of STRs are located in non-coding regions, particularly in promoters and in intronic regions. AAC is the most frequent repeat in the promoters of all diatom species, while AGT and ACT are copious only in P. multistriata promoters and TATA-box like DNA motifs (like AAT and ATT) only in F. cylindrus promoters. The presence of these repeats in diatom promoters might lead, in the cases of their expansion, to the gain of regulatory motifs upstream of the TSS or to their loss in cases of reduction. These sequences have therefore the capability to modulate gene expression. This dataset is a valuable resource to investigate transcriptional regulation in lower eukaryotes.
Introduction
Tandem repeats are an abundant class of genomic sequences that mutate faster than the surrounding genome (Lynch et al., 2008; Richard, Kerrest, & Dujon, 2008). At each cell division, these unstable genomic elements may change in the number of repeat units during DNA replication. These sequences, formerly-thought of as junk DNA, became of age as they are used as genomic markers and DNA fingerprints, are involved in human disease, and are linked to the evolution of coding and regulatory regions (Gemayel, Vinces, Legendre, & Verstrepen, 2010). Tandem repeats are composed of a short DNA motif, the so-called repeat unit, that is repeated several times head-to-tail. Based on the size of the repeat unit (or period size), tandem repeats are classified into microsatellites (unit size <10nt; also known as short tandem repeats, STRs) or minisatellites (unit size ³10nt). Microsatellites are the most prevalent types of repeats (Ellegren, 2004; Gemayel et al., 2010).
Recent studies have shown that STRs are ubiquitous and abundant in higher eukaryotic genomes (Gemayel et al., 2010). They occupy 3% of the human genome and are mainly located in coding regions and in gene expression regulatory regions like promoters (Sawaya et al., 2013). STRs located in such functional regions can modulate phenotypes via expansion or contraction of their repeat units thus potentially leading to an evolutionary advantage (Iii, Hammock, Hannan, & King, 2008)or even the onset of human diseases(Campuzano et al., n.d.; Day JW, n.d.; Gijselinck et al., 2012; Maclean, Warne, & Zajac, 1996; Orr & Zoghbi, 2007; Richard et al., 2008; Sawaya et al., 2013; Tabolacci, Palumbo, Nobile, & Neri, 2016).
STRs have also been observed in promoters of other eukaryotic genomes including single-celled organisms like yeast (Vinces, Legendre, Caldara, Hagihara, & Verstrepen, 2011) and complex organisms like birds (Abe & Gemmell, 2016), dogs (Eo et al., 2016), monkeys (Ohadi M, Valipour E, Ghadimi-Haddadan S, Namdar-Aligoodarzi P & Kowsari A, Rezazadeh M, Darvish H, 2014) or humans (Sawaya et al., 2013). Vinces et al. found that STRs can affect gene expression by acting as nucleosome inhibitory sequences that maintain an open chromatin structure in specific regions of the promoter(Vinces et al., 2011). These authors propose a possible role of tandem repeats as nucleosome positioning elements in eukaryotes (Vinces et al., 2011). Similarly, Sawaya et al. described that STRs are abundant in human promoters, often highly conserved, and enriched near the transcriptional start sites (TSS) of key regulatory genes involved in growth and development. These authors suggest that promoter STRs have the potential to affect promoter function by generating mutations in regulatory elements, which may ultimately lead to variation in phenotypes (Sawaya et al., 2013). Finally, Sonay et al. showed that tandem repeats have taken an evolutionary role in gene expression differences in human and ape grape populations since genes with tandem repeats had higher expression divergence than genes without repeats, in the following order of decreasing divergence: repeats in 3’UTR, exons, promoters, 1st intron, and other introns (Sonay et al., 2015). While these findings highlight the potential contribution of STRs to evolution, they mostly refer to studies in higher eukaryotes. However, it remains still unknown whether STRs are also present and possibly control gene expression in simpler eukaryotic organisms like protists.
played a decisive role in the ecosystem for millions of years as one of the foremost set of oxygen synthesizers on earth and as one of the most important sources of biomass in oceans (Armbrust, 2009). Diatoms are used in commercial and industrial applications as the carbon neutral synthesis of fuels, pharmaceuticals, health foods, biomolecules, materials relevant to nanotechnology, and bioremediators of contaminated water (Bozarth, Maier, & Zauner, 2009). These single-celled organisms show extraordinary adaptation capacities to rapidly changing environments and therefore represent an important evolutionary model for investigating the role of tandem repeats in evolution (Russo, Annunziata, Sanges, Ferrante, & Falciatore, 2015). Here we provide the first genome-wide survey of STRs in diatoms. Using an in-house bioinformatic workflow, we identified STRs in the four diatom genomes sequenced to date.
Methods
Identification of short tandem repeats in diatom genomes
For the identification of STRs in whole genomes, we gathered genome FASTA files and annotation GTF files of the four diatoms listed in Table 1. The P. tricornutum and T. pseudonana reference files were retrieved from the Protists Ensembl database (http://protists.ensembl.org/) (Kersey et al., 2016); the F. cylindrus genome was obtained from the Joint Genome Institute (JGI) Genome Portal
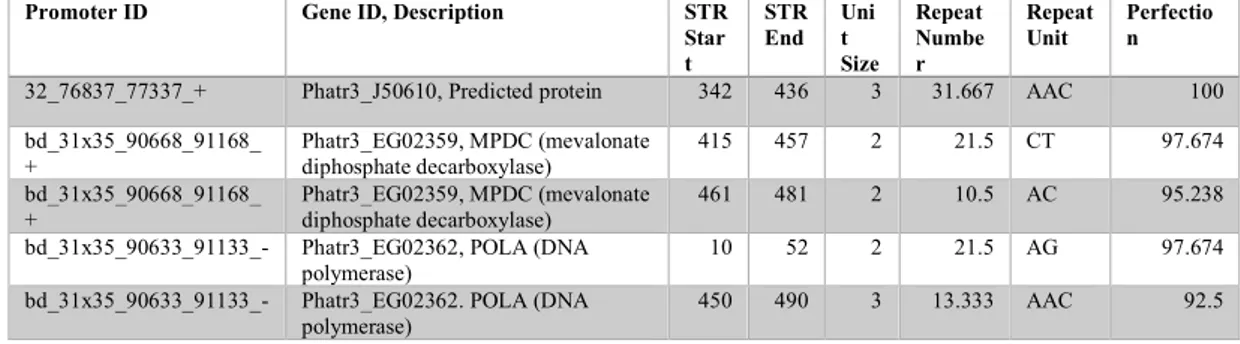
reference genome was recently sequenced at our institute (Basu et al., 2017). Diatom genomes were interrogated for the presence of STRs using the Phobos software version 3.3.12 (Mayer, 2007) with default options except for minUnitLen=2 to exclude homopolymer repeats and outputFormat=3 to generate the one-per-line tabular format. The software selected STRs with a minimum length of 8 bp and a unit size of at least 2 (e.g. from 4 dinucleotides, 3 trinucleotides and 2 tetranucleotides). We wrote a Perl script to parse this output and to summarize STR features such as the chromosomal location, repeat size, copy number, alignment score, consensus and sequence. As a quality control, we visually inspected examples of tandem repeats from
P. tricornutum and T. pseudonana using the Ensembl genome browser (Kersey et al.,
2016). In addition, the presence of specific STRs (e.g. CCTAAC repeats known to be located at the telomere regions) was confirmed using Ensembl karyotype plots to assess the correctness of our analysis. GTF files from the four diatoms were used as the source to annotate the repeats. For each STR, we used intersectBed from the BEDTools suite (Quinlan & Hall, 2010) to verify if it overlapped a promoter region defined as 500 bp upstream of the transcriptional start site (promoter-TSS), a gene exon (exon), a gene intron (intron), or none of the above features (intergenic). The STR occurrences were then normalized by the size of the feature as annotated in the reference genomes. Finally, we used genomecov from the BEDTools suite to compute the coverage of the repeat features in the region surrounding the gene TSS. The distribution plots presented in this article were generated with scripts written in the R language (R Core Team, 2013).
Identification of short tandem repeats in diatom promoters
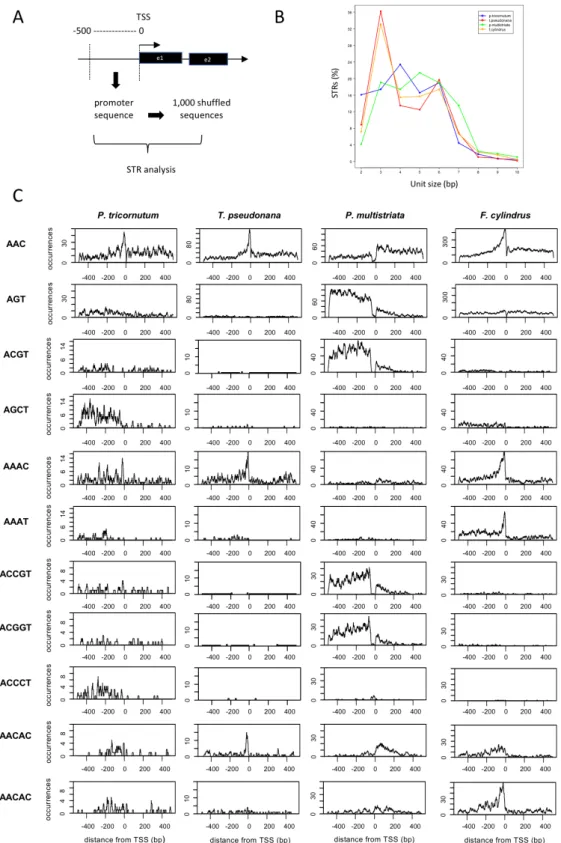
An in-depth analysis was carried out in promoter regions of each diatom genome. Here, we defined promoters as the sequences of the 500 bp upstream of each gene TSS, collected in the same orientation with respect to the coding strand of the related gene. Each promoter sequence was then randomized to obtain 1,000 random, shuffled sequences. In each randomization, the sequence of the promoter was shuffled so that we maintained the same base composition and length but created a non-biologically meaningful sequence. Promoter and shuffled sequences were inspected for the presence of STRs by running Phobos version 3.3.12 (Mayer, 2007) using the options reportUnit=1 to conduct a strand-specific analysis, minUnitLen=2 to exclude homopolymer repeats, and outputFormat=3 to generate the one-per-line output format that is easier to parse. As in the genome-wide analysis, the software selected STRs with a minimum length of 8 bp and a unit size of at least 2 (e.g. from 4 dinucleotides, 3 trinucleotides and 2 tetranucleotides). To assess the statistical enrichment of STRs in promoters, the occurrences of each STR were counted in both the real and the randomized data sets, and the corresponding statistics were calculated. Calculations based on the shuffled promoters represent the 'expected' frequencies of the STRs based solely on the nucleotidic composition and were used to calculate the Z-scores, while the calculations based on real promoters represent the 'observed' occurrences. Functional enrichment analysis was conducted performing the Fisher exact test comparing for each class the proportion of class specific genes in the total set of annotated genes with the proportion of class specific genes in the set associated to the
specific promoters. P-values were corrected using the Benjamini and Hochberg (BH) method.
A similar strand-specific STR analysis was performed for the genomic regions surrounding the gene TSS to generate the metagene plots shown in Figure 4.
Results
Diatom genomes are enriched in triplet repeats
To generate a comprehensive catalogue of STRs in marine diatoms, we surveyed the genomes of four different species: i) the centric diatom Thalassiosira
pseudonana, ii) the pennate diatom Phaeodactylum tricornutum, iii) the psychrophilic
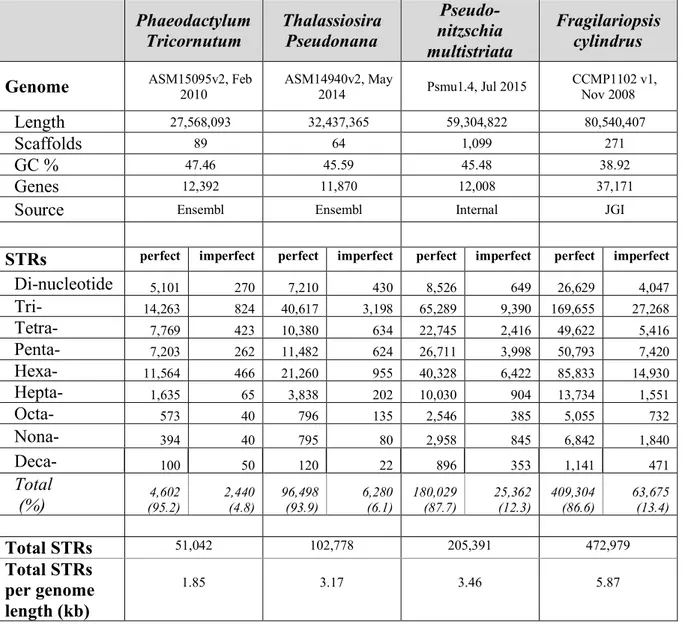
diatom Fragilariopsis cylindrus, and iv) the neurotoxin domoic acid-producing pennate diatom Pseudo-nitzschia multistriata. We found that the total number of STRs varies enormously among the species, ranging from a minimum of 51,042 sequences in P. tricornutum to a maximum of 472,979 in F. cylindrus (Table 1). Not surprisingly, we found that the total number of STRs increases with the genome size (Table 1). Over 86% of the STRs are perfect, pure repeats. In order to verify the correctness of our predictions, we searched for and confirmed the presence of CCTAAC repeats that are normally located at the telomere regions of each chromosome. From the STR analysis we gathered the full list of diatom repeats along with their chromosomal location, repeat size, copy number, alignment score, consensus and sequence.
Phaeodactylum Tricornutum Thalassiosira Pseudonana Pseudo-nitzschia multistriata Fragilariopsis cylindrus
Genome ASM15095v2, Feb 2010 ASM14940v2, May 2014 Psmu1.4, Jul 2015 CCMP1102 v1, Nov 2008
Length 27,568,093 32,437,365 59,304,822 80,540,407
Scaffolds 89 64 1,099 271
GC % 47.46 45.59 45.48 38.92
Genes 12,392 11,870 12,008 37,171
Source Ensembl Ensembl Internal JGI
STRs perfect imperfect perfect imperfect perfect imperfect perfect imperfect
Di-nucleotide 5,101 270 7,210 430 8,526 649 26,629 4,047 Tri- 14,263 824 40,617 3,198 65,289 9,390 169,655 27,268 Tetra- 7,769 423 10,380 634 22,745 2,416 49,622 5,416 Penta- 7,203 262 11,482 624 26,711 3,998 50,793 7,420 Hexa- 11,564 466 21,260 955 40,328 6,422 85,833 14,930 Hepta- 1,635 65 3,838 202 10,030 904 13,734 1,551 Octa- 573 40 796 135 2,546 385 5,055 732 Nona- 394 40 795 80 2,958 845 6,842 1,840 Deca- 100 50 120 22 896 353 1,141 471 Total (%) (95.2) 4,602 2,440 (4.8) 96,498 (93.9) 6,280 (6.1) 180,029 (87.7) 25,362 (12.3) 409,304 (86.6) 63,675 (13.4) Total STRs 51,042 102,778 205,391 472,979 Total STRs per genome length (kb) 1.85 3.17 3.46 5.87
Typically, STRs can vary in the size and in the number of copies of their repeat units. For the first time, we report that the most common STRs found in diatoms are DNA motifs with a repeat unit of 3 or 6 bases (Table 1; Fig. 1A). Triplet repeats alone account for almost one-third of the total STR sequence set (from 29.6 % in P.
tricornutum to 42.6 % in T. pseudonana); while, together, triplets and hexaplets
represent more than half of the repeat set. Most of the diatom STRs have up to 5 repeat copies, and only a small fraction more than 6 and up to 146 (P. tricornutum: 4.1%; T.
pseudonana: 4.2%; P. multistriata: 7.7%; F. cylindrus: 13.2%) (Fig. 1B). In all species
The sequence AAC is the most frequent repeat with a total of 61,199 occurrences across all diatoms. AAC occupies the first position in T. pseudonana and in F.
cylindrus, and the second position in P. tricornutum and in P. multistriata (Table 2).
This result extends our previous findings that the genome of F. cylindrus is enriched in CAA repeats (equivalent to AAC) (Mock et al., 2017). The second most prevalent repeat in diatoms is AAG, which is at the second position in T. pseudonana, at the third position in P. tricornutum and in P. multistriata, and at the fourth position in F.
cylindrus, with a total of 43,987 occurrences collectively. Along with repeats that are
highly frequent in all diatoms, we also found repeats that are at the top position in one species only. For instance, ACG is at the first position in P. tricornutum, but at the fifth position in P. multistriata and at the sixth position in T. pseudonana and in F.
cylindrus. Likewise, ACT is at the first position in P. multistriata, but at the fifth,
eighth and ninth positions in F. cylindrus, T. pseudonana and P. tricornutum, respectively. Finally, the AAT repeat is at the third position in F. cylindrus with 32,063 occurrences but at the very last position in P. tricornutum, T. pseudonana and P.
multistriata. Taken together our results indicate for the first time that diatom genomes
Unit Number of STRs Avg Repeat Number StdDev Repeat Number Phobos total score P. tricornutum ACG 2,851 3.51 0.86 20,176 AAC 2,435 3.86 1.94 19,352 AAG 2,293 3.34 0.78 15,418 AGC 1,510 3.33 0.65 10,274 CCG 1,395 3.28 0.55 9,236 ACC 1,378 3.45 0.85 9,659 ATC 1,179 3.37 0.87 8,034 AGG 902 3.36 0.77 6,177 ACT 781 3.69 1.93 5,750 AAT 363 3.25 0.62 2,382 T. pseudonana AAC 9,118 3.94 3.11 72,909 AAG 6,817 3.43 0.85 47,302 AGG 6,379 3.56 1 45,831 ATC 5,925 3.55 0.97 42,873 AGC 4,336 3.67 1.21 33,056 ACG 4,336 3.63 0.99 32,016 ACC 4,149 3.61 1.02 30,461 ACT 1,337 4.03 7.38 10,229 CCG 903 3.43 0.71 6,359 AAT 515 3.17 0.38 3,313 P. multistriata ACT 16,239 5.29 6.01 175,874 AAC 12,845 4.42 3.94 116,914 AAG 9,469 3.58 1.25 67,358 AGC 8,276 4.07 2.27 68,513 ACG 6,746 4 1.73 54,984 ACC 5,838 3.65 1.55 43,735 AGG 5,507 3.58 1.45 40,123 ATC 4,288 3.71 3.56 32,075 CCG 3,371 3.49 0.8 23,949 AAT 2,100 3.51 1.42 14 847 F. cylindrus AAC 36,801 4.56 2.24 344,162 ATC 33,137 4.42 2.24 296,677 AAT 32,063 4.12 1.96 265,976 AAG 25,408 4.09 1.78 210,149 ACT 18,782 4.28 1.88 166,747 ACG 17,029 4.37 1.92 155,388 AGC 14,541 4.55 2.22 139,321 ACC 10,979 4.01 1.51 91,488 AGG 6,609 3.96 1.54 54,975
STRs are abundant in diatom promoters and introns
To further characterize the repeat sequence set, we examined its distribution with respect to the genomic features by determining the occurrences of STRs in exons, introns, promoters (i.e. the 500 nucleotides upstream of gene TSS features) and intergenic regions. We identified highest occupancy in “promoter-TSS” regions in all species with the exception of F. cylindrus where STRs are slightly more abundant in introns (Fig. 2A). Through the visual inspection of the 20,000 nucleotides centered around the TSS of all diatom genes, we confirmed that STRs are preferentially located in promoters (Fig. 2B). We also noted that the density of STRs decreases near the gene TSS in all species (Fig. 2B). As second category after promoters-TSS, we found a high number of STRs in diatom “introns” (Fig. 2A). Further analyses indicated that STRs are significantly over-represented in the first introns of genes of T. pseudonana (BH-FDR adjusted p-value = 2.85 E-14), P. multistriata (BH-(BH-FDR adjusted p-value =1.38 E-13) and F. cylindrus (BH-FDR adjusted p-value = 1.16 E-12), and to some extent of
P. tricornutum (BH-FDR adjusted p-value = 0.15). Instead there was no significant
enrichment in the other introns (e.g. BH-FDR adjusted p-value = 1 in non-first introns of all diatom species). Finally, after promoters and introns, STRs occupy “exons” as third category, and “intergenic regions” as fourth and last category (Fig. 2A). Taken together these results show that STRs are very abundant in promoters and introns of diatoms and that they generally present the following decreasing order of occupancy: promoter-TSS, introns, exons, and intergenic regions.
Diatom promoters are enriched in AAC repeats
To investigate whether the strong signal in promoters was determined by one or more DNA repeat motifs, we refined our search in the 500 bp upstream of each TSS. We compared the STR occurrences found in each promoter sequence against those measured in a set of 1,000 shuffled sequences to assess the significance of the enrichment (Fig. 3A). Over two-thirds of diatom promoters harbor at least one STR, ranging from 68.3% promoters in P. tricornutum to 93.5% in F. cylindrus. Like for the genome-wide analysis, triplet repeats are very abundant also in promoters representing almost one third of the STRs (42,944 out of 147,843 total promoter STRs) (Fig. 3B); however, while triplets are the top class in T. pseudonana and in F. cylindrus promoters, tetra- and penta-nucleotide repeats are respectively more abundant than triplets in P. tricornutum and in P. multistriata promoters (Fig. 3B). Among triplets, AAC is the most frequent motif in P. tricornutum, in T. pseudonana and in F. cylindrus with a clear and sharp peak before the TSS (Fig. 3C), but not in P. multistriata where AGT is at the top (Fig. 3C). Among tetraplets, the top repeats are ACGT in P.
multistriata, AGCT in P. tricornutum, AAAT in F. cylindrus and AAAC in T. pseudonana. The latter is also abundant in F. cylindrus. Among pentaplets, ACCGT
and ACGGT are most abundant in P. multistriata with 1,512 counts overall (Fig. 3C), while other top frequent pentaplets are ACCCT in P. tricornutum, AACAC in T.
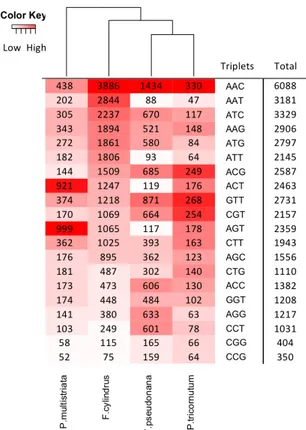
We further examined the promoter STRs focusing only on triplets. Hierarchical clustering analysis of STR occurrences indicated two similarity groups, with P.
tricornutum, T. pseudonana and F. cylindrus on one side and P. multistriata alone on
the other (Fig. 4). For comparison, we obtained similar results on tetraplets. AAC is the most statistically over-represented triplet in promoters (BH-FDR adjusted p-value = 0 in all diatoms) with a total of 6,088 occurrences (Fig. 4). This motif is at the top position in P. tricornutum, in T. pseudonana and in F. cylindrus but only third in P.
multistriata. The relative distribution of AAC in the 4,000 nucleotides around the TSS
confirms the strong enrichment in promoters of P. tricornutum, T. pseudonana and F.
cylindrus (Fig. 3C; Fig. 4).
Figure 4. Heatmap representation of triplet repeat occurrences found in promoters. Rows represent all
possible triplet repeats; columns represent all the diatom species under investigation. For each species (e.g. within each column), a white-to-red color gradient shows the number of STR occurrences (white
Other triplets were highly frequent only in one or two species. For instance, we found a specific enrichment of A[CG]T motifs in P. multistriata: AGT was first in P.
multistriata but fifth, eleventh and eighteenth in P. tricornutum, F. cylindrus and T. pseudonana; ACT was second in P. multistriata but sixth, eighth and seventeenth in P. tricornutum, F. cylindrus and T. pseudonana. The AGT and ACT motifs together
account for one-third of all triplets located in P. multistriata promoters (Fig. 4). As additional example, GTT was second in P. tricornutum and in T. pseudonana, fourth in P. multistriata, but only ninth in F. cylindrus (Fig. 4). Finally, several T and A rich motifs were extremely abundant in F. cylindrus promoters (Fig. 4): AAT was second in F. cylindrus but ninth in P. multistriata and twentieth in both P. tricornutum and T.
pseudonana, AAG was fourth in F. cylindrus but eleventh, thirteenth and fifteenth in T. pseudonana, P. tricornutum and P. multistriata, and ATT was sixth in F. cylindrus
but tenth, eighteenth and nineteenth respectively in P. multistriata, P. tricornutum and
T. pseudonana. Interestingly, we found AAT and ATT triplets significantly
represented in F. cylindrus promoters (ATT: 1,806 observed vs 564.6 expected with FDR adjusted p-value = 0, and AAT: 2,844 observed vs 748.9 expected with BH-FDR adjusted p-value = 0) and P. multistriata promoters (ATT: 182 observed vs 163.4 expected with BH-FDR adjusted p-value = 0.066, and AAT: 202 observed vs 165.8 expected with BH-FDR adjusted p-value = 0.0033), but not in P. tricornutum promoters (ATT: 64 observed vs 112.18 expected with BH-FDR adjusted p-value = 1, and AAT: 42 observed vs 112.91 expected with BH-FDR adjusted p-value = 1) and T.
value = 0.41, and AAT: 88 observed vs 110.8 expected with BH-FDR adjusted p-value = 0.90).
Taken together, we conclude that AAC is by far the most prevalent repeat motif in diatom promoters, although AGT and ACT are the most abundant triplets in P.
multistriata promoters (whereas AAC is only third) and AAT and ATT (i.e.
Discussion
The current study presents the first genome-wide catalogue of short repetitive elements in lower eukaryotes such as marine diatoms. Because repetitive sequences are more difficult to detect using standard high-throughput sequencing technologies (Bahlo et al., 2018), the study of short tandem repeats (STRs) has been so far neglected compared to the one of single nucleotide polymorphisms (SNPs) and short insertions and deletions (InDels). As a result, our collective knowledge of variations in STRs remains scarce.
Recent studies indicated that STRs are located both in genes and in non-coding regions (Gemayel et al., 2010; Sawaya et al., 2013). In higher eukaryotic genomes, STRs are also found in promoters (Sawaya et al., 2013). The repetitive nature of these sequences might induce strand-splippage events in DNA replication resulting in mutations in the number of repeats with possible effects on the phenotype. In this light, expansion or contraction of promoter STRs might affect gene expression through several possible mechanisms: they can form transcription factor binding sites (Contente, Dittmer, Koch, Roth, & Dobbelstein, 2002), can alter spacing between regulatory elements (Rockman & Wray, 2002), or modulate epigenetics via DNA methylation (Quilez et al., 2016). These unstable repetitive elements in promoters are very important as they may facilitate evolutionary changes in phenotypes (Gemayel et al., 2010).
The advent of high-throughput sequencing technologies has enabled the development of novel genomic resources. The genome sequences of four marine diatom species