Analyst coverage, market liquidity and disclosure quality: a study of
fair-value disclosures by European real estate companies
Stefan Sundgren
Umeå School of Business, Economics and Statistics, Umeå, Sweden Juha Mäki
University of Vaasa, Vaasa, Finland Antonio Somoza-López Barcelona University, Barcelona, Spain
Abstract
Disclosures in notes have been criticized by practitioners for being unwieldy and contributing little to the quality of the financial information. This study presents evidence on the association between disclosure quality, analyst following and liquidity in the real estate sector. More specifically, we study the disclosure of the methods and significant assumptions applied in determining fair values of investment properties under IAS 40 and IFRS 13. We find that disclosure quality is significantly higher under IFRS 13. Furthermore, we show that the quality is associated with analyst following and bid-ask spreads. However, the improved disclosures following the adoption of IFRS 13 are not associated with any significant positive economic consequences. This result indicates that the revised disclosure requirements in IFRS 13 did not solve any market imperfections.
1. Introduction
The purpose of the study is to examine the quality of fair value disclosures for companies in the real estate sector. International Accounting Standard (IAS) 40 regulates the accounting for investment properties; the key feature being that fair values of investment properties have to be reported on the balance sheet or disclosed in the notes. The fair value measurement is either based on market approaches or income approaches (discounted cash flows). Measurements of investment properties are basically Level 2 or 3 measurements in the fair value hierarchy (PwC, 2011). However, in this study we focus on companies reporting fair values on their balance sheets using an income approach (i.e. Level 3).
Level 3 fair values have been criticized for being vulnerable to manipulation and less value-relevant than Level 1 and 2 (e.g., Bernston, 2006; Aboody, Barth & Kaznik, 2006; Hitz, 2007; Song, Thomas & Yi, 2010). Reliability concerns increase information asymmetry and result in adverse selection problems. In the absence of credible and verifiable information, investment property companies with different quality properties may be valued similarly by investors because they do not have the necessary information to discriminate. One solution to this problem is that companies disclose their valuation assumptions so that they can be verified by third parties (Landsman, 2007).
Guidance on fair value measurement and disclosure has been included in IFRS 13 since the beginning of 2013. The former requirements in IAS 40 were much less detailed than the current ones in IFRS 13. In essence, IAS 40 only included a sentence requiring the disclosure of “the methods and significant assumptions applied in determining the fair value of investment property…” (IAS 40:75d), whereas IFRS 13 includes more detailed application guidance. There is a discussion amongst academics and practitioners about the pros and cons of detailed rules in accounting standards (e.g., Schipper, 2003; Nelson, 2003; Nobes, 2005; Sunder, 2010; New Zealand Institute of Chartered Accountants, 2011; European Financial Reporting Advisory Group, 2012). Proponents of detailed
guidance claim that it increases comparability, verifiability and reduces opportunities for earnings management (Schipper, 2003). However, more detailed disclosure requirements inevitably mean that financial reports will be longer and more complex. The European Financial Reporting Advisory Group (2012 p. 6) points out that: “There is a strong consensus in the financial community that disclosures in the notes to the financial statements have become unwieldy; the increasing length of the notes has done little to improve the quality of information, and may have even decreased it because of information overload.”1 Furthermore, a joint working group of the Institute of Chartered Accountants of Scotland and the New Zealand Institute of Chartered Accountants claim that it is time to discard the excess baggage and reduce the disclosures in financial statements to only those which are important (New Zealand Institute of Chartered Accountants, 2011).
Voluntary disclosure is an alternative to disclosure regulation and the economics based literature suggests that regulation can be defended if it solves market imperfections (e.g., Healy & Palepu, 2001; Beyer, Cohen, Lys & Walther, 2010). Disclosures in a regulated setting are also influenced by voluntary choices. Disclosure requirements differ in their detail and a standard with less precise guidance leaves more room for judgment by managers. Thus, actual disclosures are a product of a company’s compliance with mandatory requirements and its voluntary disclosure choices within the limits of the requirements. IFRS 13 leaves less room for judgment by managers, implying that the mandatory disclosure component is more significant under IFRS 13 than under IAS 40.
A first purpose of the study is to examine whether companies disclose more under IFRS 13 than under IAS 40. Next, we examine whether disclosure quality is associated with analyst following and market liquidity. The examination of market liquidity follows the suggestion that a greater disclosure of relevant items reduces information asymmetry and thereby increases liquidity (Verrecchia, 2001). The impact of fair value disclosures on analyst following and market liquidity is far from obvious.
1 IASB is currently also working on a new approach to draft disclosure requirements. See IASB Agenda ref 11A,
published in September 2015 (available at: http://www.ifrs.org/Meetings/MeetingDocs/IASB/2015/September/AP11A-Disclosure-Initiative.pdf).
On the one hand, higher quality fair value disclosures may reduce information asymmetry problems and thereby increase analysts’ incentives to follow a company and investors’ willingness to invest. On the other hand, there is a concern that readers will be blinded by so much data in financial reports that the main messages will be lost (New Zealand Institute of Chartered Accountants, 2011). Finally, we study whether regulation has a role by examining whether companies providing greater disclosure under IFRS 13 than under IAS 40 experience any positive economic consequences in the form of increased analyst following or market liquidity. Overall, this study contributes to the literature by providing new empirical evidence on how companies disclose under the less detailed IAS 40 and the more detailed IFRS 13.
Our study extends the literature on the economic consequences of disclosure quality by examining the impact of disclosures in the notes of the financial statements on analyst following and market liquidity. Prior studies of the association between disclosure quality and liquidity have focused on disclosure quality according to analysts’ perceptions of disclosure quality (e.g., Welker, 1995; Healy, Hutton & Palepu, 1999) and IAS/IFRS adoption (e.g., Daske, Hail, Leuz & Verdi, 2008; Muller, Riedl & Sellhorn, 2011; Christensen, Hail & Leuz, 2013). Muller et al. (2011) study the impact of fair value disclosures on bid-ask spreads in the real estate sector. Their study is closely related to our research, although an important difference is that they study the impact of fair value disclosures using a pre/post IAS/IFRS research design, whereas we study the impact of disclosure quality for firms following IAS/IFRS.
However, although the research reviewed above indicates that the overall disclosure quality improves market liquidity, it does not provide any guidance as to which types of disclosures mandated by IAS/IFRS standards are associated with market liquidity. The only published study we are aware of in which the economic consequences of specific disclosures are studied is that of Paugam and Ramond (2015), who examined the association between impairment testing disclosures and the cost
of capital. Another study that is related to ours is that conducted by Vergauwe and Gaeremynck (2014), who study the reliability effects of fair value disclosures on a sample of real estate companies. Overall, our research contributes to the literature on fair value accounting (e.g., Barth, 2007) and to research on factors associated with disclosure quality under IFRS (e.g., Kvaal & Nobes, 2010, 2012; Glaum Schmidt, Street & Vogel, 2013) by examining arguably important fair value disclosures that have received very little attention in the literature. Furthermore, our study is related to research on investment properties, which among other things has focused on the choice between the cost and fair value models (Quagli & Avallone, 2010), the impact of audit quality and the use of external valuers on information asymmetry (Muller & Riedl, 2002), the reliability of investment property fair values (Dietrich, Harris & Muller, 2001) and the value relevance of recognized versus disclosed fair values (Muller, Riedl and Sellhorn, 2015). Our study adds to this literature by providing evidence on factors associated with disclosure quality, as well as the economic consequences of fair value disclosures.
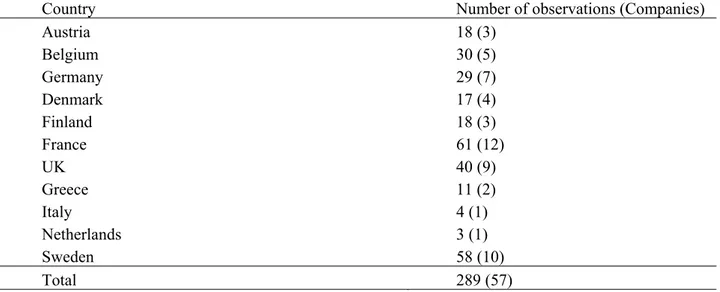
The empirical analyses are based on a small but homogeneous sample of listed real estate companies in the EU. The sample consists of 289 observations for 57 companies and covers the period 2009 to 2014. For inclusion in the sample, each company has to apply the fair value model under IAS 40, use an income approach (discounted cash flows) as its valuation technique and have investment properties that make up the major part of its assets. This selection process results in a sample for which the fair value measurement of the properties is based on unobservable inputs (Level 3 inputs). Furthermore, the criteria assure that the fair value measurement is a highly significant accounting policy in the companies.
Following prior studies (e.g., Botosan, 1997; Clarkson, Van Bueren & Walker, 2006; Shalev, 2009), we use a self-developed disclosure quality index. Our index focuses on the disclosure of significant assumptions and uncertainties in present-value calculations. The items in our index are the discount rate, estimated vacancy, estimated cash flows and a sensitivity analysis. Compared to many
other disclosures in the notes to the financial statements, these disclosures have the potential of being relevant for investors. However, it is debatable whether the disclosures actually increase verifiability and reduce opportunities for earnings management and, thereby, reduce information asymmetry. Companies only disclose summary information of assumptions and it is possible that disclosures are too concise to enable an examination of the precision of reported fair values. Thus, it is ultimately an empirical issue as to whether high quality disclosures have positive economic consequences.
To summarise, companies provide significantly greater disclosures under IFRS 13 than under IAS 40. Thus, the results show that the stricter disclosure requirements under IFRS 13 have led to companies disclosing more information. Furthermore, we find a significant positive association between disclosure quality and analyst following, indicating that demand factors affect disclosure quality. We employ the bid-ask spread, zero-returns, the price-impact and the Fong, Holden and Trzcinka (2014) measure of total trading costs as our liquidity proxies. The results suggest that disclosure quality is positively associated with the bid-ask spread, but we find little support using the other liquidity proxies. Finally, we study the economic consequences of improved disclosures under IFRS 13. More specifically, if the more extensive disclosure requirements under IFRS 13 made firms provide new and relevant information to investors and financial intermediaries, we would expect greater disclosures under IFRS 13 to have positive effects on analyst coverage and market liquidity. However, we find no support for these predictions.
The structure of this paper is as follows: section 2 includes an overview of the rules regulating the accounting of investment property under IAS/IFRS. Section 3 presents prior related literature and sets out the hypotheses. Section 4 presents the data and the research design, and section 5 includes the main results of the study. Section 6 contains some supplementary analyses and section 7 details the conclusions of the study.
EU regulations require publicly traded companies to follow IAS/IFRS in their consolidated financial statements starting from 2005. IAS 40 regulates the recognition, measurement and disclosure of investment properties. IAS 40.30 allows companies, after the initial recognition, to choose either the fair value model or the cost model as their accounting policy. If the fair value model is chosen, it is applied to all the company’s investment properties (IAS 40.33) and the company reports the fair value of these on its balance sheet. Gains or losses from changes in fair values are recognised as profit or loss for the period in which they arise (IAS 40.35). If the cost method is applied, companies report cost, minus the accumulated depreciation on the balance sheet. However, companies choosing the cost model have to report fair values of investment properties in the notes to their financial statements (IAS 40.79e).
This study investigates a sample from the period 2009 to 2014. It should be noted that until the beginning of 2013, guidance on fair value measurement was under IAS 40.45-46. Fair value is defined in IAS 40.36 as “the price at which the property could be exchanged between knowledgeable, willing parties in an arm’s length transaction”. The fair value is expected to reflect market conditions at the end of the reporting period. According to IAS 40.45, the best evidence of fair value is given by current prices in an active market for similar property in the same location and condition. However, if such prices are not available, other ways of determining fair value could be: (i) prices of property of a different nature or in a different location, (ii) recent prices of similar properties in less active markets, or (iii) discounted cash flow projections based on reliable estimates of future cash flows (IAS 40.46). The cash flows should be supported by the terms of existing leases and other contracts and, where possible, by external evidence such as current market rents for similar properties in the same location and condition. The discount rates used in the present value calculations should reflect current market assessments of the uncertainty in the timing and amount of cash flows (IAS 40.46c).
The fair value guidance in IFRS 13 applies to annual periods beginning on or after 1 January 2013. In IFRS 13.9 fair value is defined as “the price that would be received to sell an asset or paid
to transfer a liability in an orderly transaction between market participants at the measurement date”. IFRS 13 identifies the following three valuation techniques: market approaches, income approaches and cost approaches. A cost approach was not permitted under IAS 40, and IFRS 13 does not explicitly exclude the use of the cost approach for investment properties. However, the practical implications of this change are argued by some to be of limited significance, as market or income approaches are most likely to be in line with IFRS 13 requirements for investment properties (PwC 2011, p. 5). IFRS 13 also classifies fair value measurements into three levels, based on the observability of the input variables used in the measurements. Investment property measurements are likely to lie in Levels 2 or 3; a fair value measurement is a Level 3 measurement if it is based on unobservable inputs, or if significant adjustments of observable inputs have been made. For example, if the price received for sold properties is used as the basis for the fair value measurement, but significant adjustments are made because the location and/or condition of the valued and sold property differ, it is considered as a Level 3 measurement.
The main similarities and differences between the disclosure requirements in IAS 40 and IFRS 13 relating to fair value measurements will now be examined. The method used to determine fair values should be disclosed under both standards. IAS 40.75d stipulates that an entity should disclose “the method … applied in determining the fair value of investment property, including a statement whether the determination of fair value was supported by market evidence or was more heavily based on other factors (which the entity shall disclose) because of the nature of the property and the lack of comparable market data”. The current corresponding requirement is in IFRS 13.93d, which requires the valuation technique(s) used in the fair value measurement to be disclosed.
Both IAS 40 and IFRS 13 require companies to disclose information about the assumptions applied in determining the fair value of investment properties. However, IFRS 13 leaves less room for subjective judgment. IAS 40 merely stipulates that a company has to disclose the “…significant assumptions applied in determining the fair value of investment property…” without any further
guidance about which assumptions could be significant and what information to provide about the assumptions. IFRS 13.93d requires that an entity should disclose a description of the inputs used in the fair value measurements at Levels 2 or 3 in the fair value hierarchy.
Furthermore, IFRS 13.93d stipulates that, for fair value measurements categorised within Level 3 in the fair value hierarchy, an entity should “…provide quantitative information about the significant unobservable inputs used in the fair value measurement”. This rule is likely to apply to investment properties in many situations. Investment properties are not traded on a regular basis, which may mean that significant adjustments to observable prices have to be made in order to determine the fair values of properties. Furthermore, many companies use income-based valuation techniques (present value techniques) based on unobservable input variables, and these significant inputs have to be disclosed. Illustrative examples of IFRS 13 mention the disclosure of the price per square metre, long-term net operating margin and the capitalisation rate as examples of quantitative information about significant unobservable inputs for investment properties (see IFRS 13.IE63). The quantitative disclosures above are not required if the cost model is used (IFRS 13.97).
A further difference between the standards is that IFRS 13 instructs companies to disclose a sensitivity analysis if changes in unobservable assumptions have a significant effect on the fair value measurements. More specifically, IFRS 13.93h tells companies to disclose a “…narrative description of the sensitivity of the fair value measurement to changes in unobservable inputs if a change in those inputs to a different amount might result in a significantly higher or lower fair value measurement”. The disclosure of sensitivity information is not required under IAS 40 and the disclosure of quantitative information is voluntary under IFRS 13.
It can be concluded from the comparison that the IFRS 13 disclosure requirements are more precise and leave less room for subjective judgment by management. However, IFRS 13 does not remove all judgment. For example, it requires the disclosure of a description of the sensitivity of the fair value measurement to changes in unobservable inputs only if the changes in the inputs are
expected to have a significant impact on fair values. This wording gives management considerable discretion in defining ‘significant’.
3. Review of related literature and hypotheses
3.1 Background
One of the roles of disclosures is to reduce the information risk associated with investments. The literature defines information risk as an additional element of risk that arises because investors are uncertain about the parameters of expected return of investments (Botosan, 2006; Artiach & Clarkson, 2011). Given the benefits of disclosure, one would expect firms to voluntarily disclose all relevant information to investors. However, proprietary costs and other disclosure costs may impede full disclosure (for a review, see Beyer et al., 2010).
The literature discusses disclosures made voluntarily and disclosures mandated by accounting standards (Beyer et al, 2010). However, this taxonomy is frequently ambiguous, because accounting standards allow managerial discretion in the application of standards. Thus, disclosures in the financial statements are a product of a company’s compliance with the mandatory requirements and its voluntary choices. We concluded above that IFRS 13 leaves less room for judgment by managers, implying that the mandatory disclosure component is more significant under IFRS 13 than IAS 40.
3.2 Impact of IFRS 13 on disclosure quality
Companies have to apply IFRS 13 for annual periods beginning on or after 1 January 2013. The EU endorsed the standard only a few days before its effective date, implying that early adoption was not an option. Disclosures under IFRS 13 are expected to increase if the standard makes companies disclose information that is not thought to be useful for users of financial statements or if disclosure costs constrain disclosure before the adoption of IFRS 13.
The literature suggests that a disclosure cost arises if proprietary information that can harm the competitive position of a company is disclosed, although the analytical and empirical literature is inconclusive as to whether disclosure costs actually deter firms from full disclosure (e.g., Darrough & Stoughton, 1990; Wagenhofer, 1990; Arya & Mittendorf, 2007; Botosan & Stanford, 2005). In our setting, detailed information about vacancy rates and other assumptions used in present value calculation could potentially provide competitors with valuable information, for example, when deciding to enter a market. However, knowledge about vacancy rates and other market terms can also be acquired in other ways. Thus, the impact of proprietary costs on disclosure decisions in the real estate industry has to be small or non-existent.
Studies suggest that agency conflicts between managers and shareholders can drive firms to invest in unprofitable projects (Botosan & Stanford, 2005; Shalev, 2009; Hope, Thomas & Yoo, 2008). Investments in negative net present value projects will eventually materialise in lower earnings. However, managers can delay the realisation through earnings management. In real estate companies, one way of managing earnings is to change the assumptions in fair value calculations. For example, a company can cut the discount rate in present value calculations or modify expected cash flows if the incentive is to increase earnings. Thus, agency problems could make companies disclose less information than that which is required by investors and other users of financial statements.
In sum, assuming that disclosure costs mean that the level of disclosure is less than optimal under IAS 40, or that IFRS 13 obliges firms to disclose more information than is required by the users of financial statements, the following hypothesis is proposed:
Hypothesis 1: companies provide more extensive disclosures under IFRS 13 than under IAS 40.
Analysts are among the primary users of financial information and can be seen as a representative group to whom financial reports should be addressed (Schipper, 1991). Detailed and verifiable information about the significant assumptions applied in fair value measurements are potentially important input variables in analysts’ earnings forecasts.
Prior studies also suggest that the level of analyst following is a factor affecting the demand for disclosure, but the empirical results are inconclusive (e.g., Lang & Lundholm, 1996; Healy, Palepu & Sutton, 1999; Botosan & Harris, 2000; Ayers, Schwab & Utke, 2015; Gao, Dong, Ni & Fu, 2016). A possible reason for these inconclusive findings is the multifaceted role of analysts. It has been suggested that analysts have an information intermediation role as well as an information provision role (Lang & Lundholm, 1996). If analysts are primarily information intermediaries, then an increase in firm-provided information means that analysts have more information to process and sell. A positive association between analyst following and disclosures can therefore be expected. On the other hand, if analysts are mainly information providers, the information provided by firms will compete with analyst reports, which means that an increase in firm-provided information would substitute for analyst following. On balance, research suggests that there is a positive association between analyst forecast accuracy and various kinds of disclosure, which in turn suggests that disclosure complements rather than replaces analyst activities (Lang & Lundholm, 1996; Hope, 2003; Dhaliwal, Radhakrishnan, Tsang & Yang, 2012). In view of this, the following hypothesis is proposed:
Hypothesis 2: analyst following is positively associated with disclosure quality.
3.4 Disclosure quality and market liquidity
Theory suggests that a commitment to greater disclosure reduces information asymmetry, which in turn lowers the cost of capital (Diamond & Verrecchia, 1991; Verrecchia, 2001). Following Christensen, Hail & Leutz (2013), we focus on liquidity effects because these measures are less
anticipatory in nature and can be empirically measured over short intervals. Furthermore, the literature only provides limited guidance on the appropriate choice of cost of capital proxy (Artiach & Clarkson, 2011).
A number of studies measure the quality of companies’ disclosure policies with analysts’ ratings of disclosure quality. Generally, this research shows that analyst ratings are positively associated with market liquidity (e.g., Welker, 1995; Healy, Hutton & Palepu, 1999; Heflin, Shaw & Wild, 2005). The impact of IAS/IFRS adoption on market liquidity has also been investigated in a number of studies. Based on the notion that IAS/IFRS improves comparability, transparency and the quality of financial reporting, the studies predict and find a positive association between IAS/IFRS adoption and market liquidity (Leuz & Verrecchia, 2000; Daske et al, 2008; Christensen et al, 2013). Furthermore, Muller et al. (2011) find that the mandatory disclosure of fair values of investment properties under IAS 40 has a positive effect on the bid-ask spreads. However, alternative liquidity measures (e.g., zero-trading days and share turnover) provided directionally consistent yet insignificant results.
Although the research reviewed above indicates that the overall disclosure quality improves market liquidity, it does not provide any guidance as to which types of disclosure mandated by IAS/IFRS standards are associated with market liquidity. The impact of the disclosure of key assumptions applied in fair value measurements of investment properties is far from obvious. Level 3 fair values have been criticised as being vulnerable to manipulation. Reliability concerns increase information asymmetry, but one potentially mitigating factor is that companies disclose their valuation assumptions so that they can be verified by investors and other users of financial statements (Landsman, 2007). However, disclosures in the notes inevitably include summary information, which could make it difficult for users of financial statements to determine whether a company has been pessimistic, optimistic or neutral in its assumptions. It is possible that companies should provide much more detailed information about the assumptions in DCF calculations that they currently do in order
to facilitate an evaluation of the fairness of the fair values. Thus, it is ultimately an empirical issue as to whether fair value disclosures are relevant for investors. Assuming that disclosures are of some relevance for investors, the hypothesis is that:
Hypothesis 3: there is a positive association between market liquidity and disclosure quality.
3.5 IFRS 13 adoption, analyst following and market liquidity
We suggest above that companies may disclose more information under IFRS 13 than under IAS 40 because agency costs stemming from conflicts of interest between the firm and managers reduce the incentive to disclose (cf. Botosan & Stanford, 2005; Shalev, 2009; Hope et al., 2008). If this is the case, we would expect the increased disclosures mandated by IFRS 13 to have a positive effect on analyst following and market liquidity. However, if IFRS 13 obliges firms to disclose more information than is optimal for investors, we would expect no or a negative association between IFRS 13 adoption and analyst following/market liquidity. The discussion is summarized in the following hypothesis.
Hypothesis 4: greater disclosures under IFRS 13 are associated with improved market liquidity and analyst following.
4. Data and methodology
4.1 Data and sample characteristics
Our analyses are based on a sample of 289 observations for 57 publicly traded real estate companies within the EU from 2009 to 2014. We started with all publicly traded companies in the Orbis database reporting real estate (NACE code 68) as their main activity in the European Union, which gave us a primary sample of 223 companies. Data on disclosures was hand-collected by the authors of the study from the notes to the consolidated financial statements. The language knowledge
of the authors made it possible to include companies with financial statements in English, Spanish, Italian, French, German, Danish, Dutch, Swedish or Finnish. Observations were excluded if the financial statements of the companies could not be found on the websites, or if the reports were prepared in a language that we did not understand. Furthermore, for some of the companies, investment property only constitutes a small proportion of their assets (for inclusion in the sample we require that investment property should make up more than half the total assets). These omissions left us with 492 observations.
[Insert Table 1 here]
Next, we excluded 92 observations for companies using the cost model under IAS 40 in order to only have companies in the sample that recognised the fair value of investment properties on their balance sheets. Furthermore, we excluded 55 observations for companies not using the income approach (discounted cash flows) in their fair value measurement of the properties, leaving 345 observations.2 Finally, we excluded 41 observations with missing market value of equity and 15 observations for which any of the other key variables were missing, leaving an unbalanced panel of 289 observations for 57 companies. Financial statement data and ownership data was taken from the Orbis database. Information about the number of analysts and stock market data was taken from Datastream and I/B/E/S. The identity of the auditors and information about whether the fair value of investment properties was based on a valuation by an independent valuer were hand-collected from the notes to the financial statements.
The mean (median) investment properties to total assets are 89.0% (92.0%), showing that the key operation of the companies in the sample is the ownership of investment properties. These figures
2 Companies using the income approach (discounted cash flows in practice) were identified as follows: first, we reviewed
relevant sections in financial statements in order to find information about the method used. Although companies were required to disclose the valuation method used, the information could not be found for some of the observations (see IAS 40:75d and IFRS 13). Thus, in a second step, we assumed that a company was using the income method if at least one of the items in the disclosure indices was disclosed in the notes. Fifty-five observations in our final sample were identified in the second step.
also suggest that the valuation of investment properties is a central accounting policy for the companies in the sample. Of the fair value measurements, 91.4% (264/289) are based on a valuation by an independent valuer. The mean (median) assets are € 2,330 (1,065) million, and the mean (median) revenues are € 182 (90) million. Table 1 presents the number of observations per country. It can be seen from the table that the companies in the sample are from 10 different countries, with two-thirds of the observations being from Sweden, France, Germany and the UK.
4.2 Methodology
We estimate variants of the following ordered logistic regression in our tests of Hypothesis 1:
DISCLOSURE = + IFRS13 + 2LNMV + 3ROE + 4pROE + 5LEVER +
6pLEVER + 7ISSUE + 8BIG4 + 9OWN10-50 + 10OWN50-100
+ 11‐19COUNTRYi+
(1)
The exact calculations of all variables in the model are presented in Appendix 1. The test variable in the regression is the indicator variable IFRS13, which takes the value 1 for companies whose financial year started on or after 1 January 2013.
We measure the dependent variable with a disclosure index. Following prior studies (e.g., Botosan, 1997; Clarkson et al., 2006; Shalev, 2009), the index is self-developed and aims to capture the disclosure of the key assumptions applied in the DCF calculations as well as the sensitivity of the fair value to changes of unobservable input variables.
Generally, the use of present value techniques requires the estimate of expected future cash flows and an appropriate risk-adjusted discount rate (e.g., Penman, 2010, p. 119; IFRS 13: B13). The first components of the disclosure index is discount rate, the two following components focus on assumptions underlying expected cash flows and the final component focuses on uncertainties linked to the estimates. The components are presented and explained below.
The discount rate. The discount is one of the key inputs in present value calculations and is also included in a list of illustrative disclosures in the real estate sector under IFRS 13 (see Ernst & Young, 2013, p. 19-24). We code the variable COSTCAP as 1 if the company discloses the discount and/or yield rates.
Assumptions about expected rental income and operating expenses. We code the variable OPINCEXP as 1 if any quantitative information about the expected rental income and/or operating expenses used in present value calculations is disclosed. The variable is coded 1, for example, if a company discloses the maximum expected rents per square meter. Ernst & Young (2013, p. 19-24) lists the contractual cash rental income and the rent growth per year as examples related to this item. The vacancy rate. The expected rental income depends on both the expected rent level if properties are leased out and the expected vacancy rate. The variable VACANCY is coded as 1 if the expected vacancy rate, or an interval of vacancy levels is disclosed. Ernst & Young (2013, p. 19-24) lists the long-term vacancy rate as one item that should be disclosed by real estate entities.
Sensitivity. Fair values based on present value calculations are influenced by the assumptions used in the calculations and, therefore, a sensitivity analysis to assess how changes in assumptions about rent revenues, property costs, rental vacancy levels and yield/discount rates affect fair values and net income may be relevant for investors. Although IFRS 13 only requires narrative sensitivity information, Ernst & Young (2013, p. 34) points out that quantitative information on sensitivities may be useful for the users of financial statements. The variable SENSITIVITY takes the value 1, if any kind of quantitative sensitivity analysis of how fair values of investment properties or net income is influenced by changes in key input variables is disclosed in the notes to the financial statements.
Our main disclosure measure (DISCLOSURE) is calculated as the sum of all the measures detailed above. However, we also present results for its components in the empirical analysis section.
The following control variables are included in the regression. We would expect larger companies to have the incentive to provide higher quality disclosures due to their public exposure (e.g., Lang & Lundholm, 1993). We include the logarithm of the market value of the equity as the measure (LNMV). Furthermore, prior studies suggest that the capital structure affects disclosure quality (Clarkson et al., 2006; Gao et al., 2015; Ayers et al., 2015). We include LEVER, measured as long-term liabilities to total assets. Following prior disclosure studies, we also control for performance (Clarkson et al., 2006; Robinson et al., 2011; Gao et al., 2015). We use ROE as the measure, calculated as the net income before tax to shareholders’ equity. Companies might apply disclosure policies that are stable over time and, therefore, financial ratios in previous years might correlate with disclosure practices. In order to control for this possibility, we include return on equity and leverage calculated as the average over the three previous years as control variables (pROA and pLEVER).
Previous studies also suggest that companies issuing debt or equity have the incentive to provide better disclosures (Lang & Lundholm, 1993; Gelb, 2000; Glaum et al., 2013). Following Gelb (2000) and Glaum et al. (2013), we use a variable capturing either an equity or debt issue. ISSUE takes the value 1 if either common stock or debentures and convertibles (measured in local currency) increased more than 10% compared to the previous year. The purpose of the 10% rule is to eliminate insignificant changes in the variables, e.g., those arising from the issuance of shares to employees.3 Prior studies suggest that large international audit firms conduct higher quality audits than smaller ones (Francis, 2004; Knechel, Krishnan, Pevzner, Shefchik & Velury, 2013). We thus include a ‘Big 4’ indicator variable as a control (BIG 4).
The inclusion of the ownership variables is based on the notion that the relative importance of financial reports as a medium for communication is smaller if a company has concentrated ownership (Givoly, Hayn & Katz, 2010) and the characteristics of the ownership structure has also previously
been controlled for in the disclosure literature (e.g., Gelb, 2000; Glaum et al., 2013; Ayers et al., 2015). We focus on ownership concentration and include indicator variables taking the value 1 if the largest owner control is between 10% and 50% of the shares (OWN10-50) or more than 50% of the shares (OWN50-100). Finally, we include country indicator variables in the ordered logistic regressions, with DISCLOSURE as the dependent variable and origin indicator variables in the binary logistic regressions with the components of the index as the dependent variable.
A significant number of the companies in the sample are not followed by analysts. We therefore use the Heckman procedure in the tests of Hypothesis 2 and in the first step estimate a probit model expressing the likelihood that the company is followed by an analyst (FOLLOWING). In the second step, we estimate an OLS regression and add the Inverse Mills Ratio in order to control for selection bias (Heckman, 1979). This procedure has been used previously in the accounting literature by, for example, Chaney, Jeter and Shivakumar (2004):
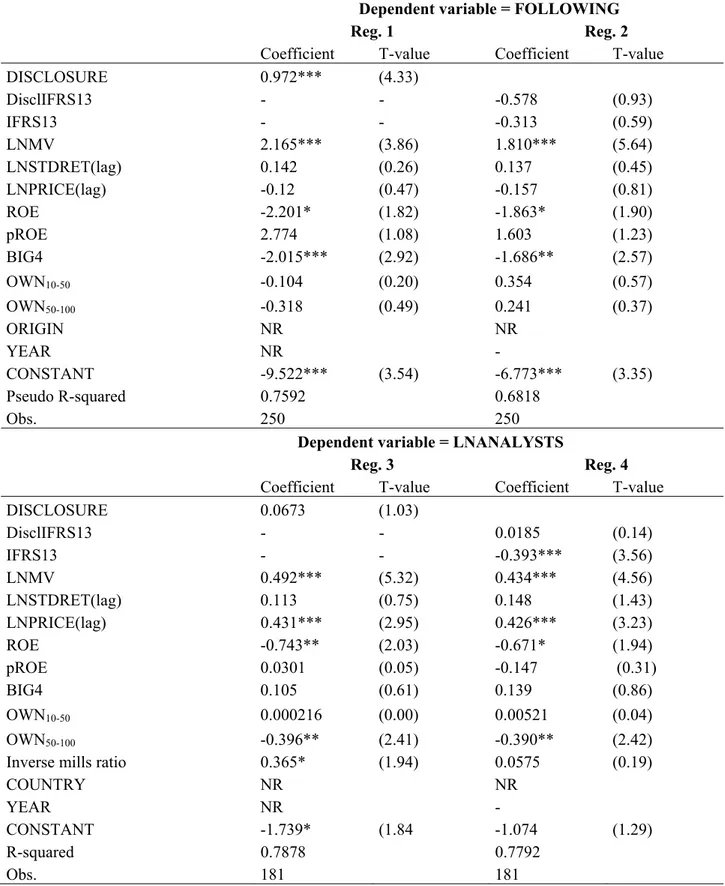
FOLLOWING = + DISCLOSURE + 2LNMV +3LNSTDRET(lag) +
4LNPRICE(lag) + 5ROE + 6pROE + 7BIG4 + 8OWN10-50 +
9OWN50-100 + 10‐13ORIGINi + 14‐18YEARi +
(2) LnANALYSTS = + DISCLOSURE + 2LNMV +3LNSTDRET(lag) +
4LNPRICE(lag) + 5ROE + 6pROE + 7BIG4 + 8OWN10-50 +
9OWN50-100 + 10InverseMillsRatio+ 11‐21COUNTRYi + 22‐26YEARi +
The dependent variable in the selection model is an indicator variable taking the value one if at least one analyst prepares a one year IFRS earnings per share forecast. LNANALYSTS is the logarithm of the number of analysts preparing a one-year forecast. The number is measured as the monthly average of the second quarter after the balance sheet date. For example, if the balance sheet
date is 31st December 20X1, LNANALYSTS is calculated as the average of the number of analysts in April to June in 20X2. Hypothesis 2 predicts a positive coefficient of DISCLOSURE.
In our tests of Hypothesis 4, we replace DISCLOSURE with the indicator variables IFRS13 and DisclIFRS13. The latter variable takes the value 1 if the company has a higher value on DISCLOSURE in the years after the IFRS13 adoption than in the year immediately prior to it. Thus, DisclIFRS13 takes the value one if the IFRS 13 adoption made the company disclose more information than it did voluntarily under IAS 40. Thus, Hypothesis 4 predicts a positive coefficient on DisclIFRS13. The year indicator variables are omitted from the regressions above in our tests of Hypothesis 4.
Below, we detail the control variables included in the regressions. Bhushan (1989) suggests that the value of analyst coverage is higher if the return variability is high. We use the logarithm of the standard deviation of the stock return in the previous year as the measure (LNSTDRET). Bhushan also suggests that the ownership structure is likely to affect the demand and supply for analyst services. We thus include OWN10-50 and OWN50-100 to control for this possibility. We include LNMV as a control for size (Lang & Lundholm, 1996; Ali, Chen & Radakrishnan, 2007), LEVER as a control for possible effects of the capital structure (Gao et al., 2015), ROE as a control for performance (Ali et al., 2007; Gao et al., 2015) and BIG4 as a control for audit quality (Knechel et al., 2013). Following Ali et al. (2007) we also include an average of prior years’ ROE (pROE) and the share price as control variables (LNPRICE). Finally, we include year indicator variables as well as country indicator variables (in regression with LNANALYSTS as the dependent variable) or legal origin indicator variables (in selection model with FOLLOWING as the dependent variable).
Market liquidity = + DISCLOSURE + 2LNMV +3LNSTDRET + 4LNPRICE +
5LNTURN + 6BIG4 + 7OWN10-50 + 8OWN50-100 + 9‐20COUNTRYi
+ 21‐25YEARi + 26‐75COUNTRYi*YEARi +
(3)
DISCLOSURE is used as the measure of disclosure quality in our tests of Hypothesis 3. As explained in conjunction with the analyst forecast regressions above, IFRS13 and DisclIFRS13 are used to test Hypothesis 4.
Following prior studies (e.g., Daske et al., 2008; Christensen et al., 2013), we use the following four proxies for market liquidity. ZERORETURN is the number of trading days with zero return out of all trading days measured over the second quarter following the balance sheet date for a given firm. For example, if the balance sheet date is 31st December 20X1, ZERORETURN is calculated April to June in 20X2. The second measure is the price impact, calculated as the median of the daily absolute stock return divided by the trading volume (measured in local currency). We omit zero-return observations from the calculations and use the log of the ratio for the second quarter (LNPRICEIMPACT). Our third measure is the bid-ask spread. This is calculated as the log of the median daily quoted spread divided by the midpoint measured over the second quarter (LNBIDASK). Our fourth measure is total trading costs. However, unlike Daske et al. (2008) and Christensen et al. (2013) we use the FHT-ratio, which is a simplified version of the total trading cost measure proposed by Lesmond, Ogden and Trzcinka (1999). The FHT-ratio is discussed by Fong, Holden and Trzcinka (2014) and Johann and Theissen (2013 p. 246).4 As above, the logarithm of the ratio is used and is measured over the second quarter following the balance sheet date (LNFHT).
4 The measure is based on the transaction cost ratio proposed by Lesmond et al. (1999). However Fong et al. (2014) first
assumed that the transaction costs of buying and selling are identical and secondly that they replaced the market model assumption by the assumption that true returns follow a normal distribution. Based on these assumptions they derive the transaction cost estimator: 𝐹𝐻𝑇 2𝜎∅ (1+ ), where 𝜎 is the daily standard deviation of returns (days with zero returns omitted), ∅ is the inverse of the normal density function and Zeroreturn is the proportion of zero return days (as defined above).
We include variables in the regressions to control for the size of the company (LNMV), the standard deviation of the returns (LNSTDRET), the price of the share (LNPRICE) and share-turnover (LNTURN) (e.g., Daske et al., 2008; Muller et al., 2011). We control for the possible effect of audit quality by the inclusion of BIG4 and ownership structure by the inclusion of OWN10-50 and OWN 50-100. Finally, we include year indicator variables, country indicator variables and interactions between year and country in order to control for possible year and country effects on market liquidity in the tests of Hypothesis 3 (year and interactions between country and year are omitted from the regressions in the tests of Hypothesis 4). ROE and pROE have some extreme values and are winsorized 1 per cent in each tail.
5. Empirical results
5.1 Determinants of disclosure quality
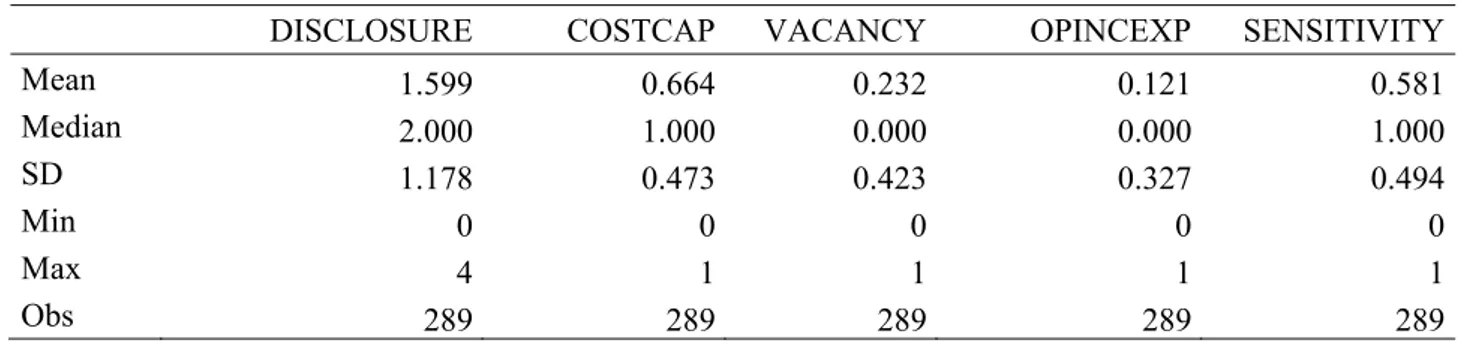
Table 2 (Panel A) reports summary characteristics for the disclosure index and its components. It can be seen from the panel that the minimum, mean and maximum values of DISCLOSURE are 0, 1.6 and 4 respectively. The distribution of the index is the following: it takes the value 0 for 65 (22.5%), 1 for 67 (23.2%), 2 for 95 (32.9%), 3 for 43 (14.9%) and 4 for 19 (6.6%) of the observations (not reported in the tables).
Table 2, Panel A, shows that the most frequently disclosed item is the discount rate (COSTCAP), which is disclosed by 66.4% of the companies in the sample. It was disclosed by 57.8% before the adoption of IFRS 13 and 87.1% after the adoption (not reported in the tables). A two-sample test of proportions shows that the increase is statistically significant (p-value < 0.001). Furthermore, 23.2% disclose the expected vacancy rate. The proportions before and after IFRS 13 are 16.7% and 40.0% respectively (p-value < 0.001). However, only 12.1% of the companies disclose any quantitative information related to expected rental income and/or the operating expenses used in
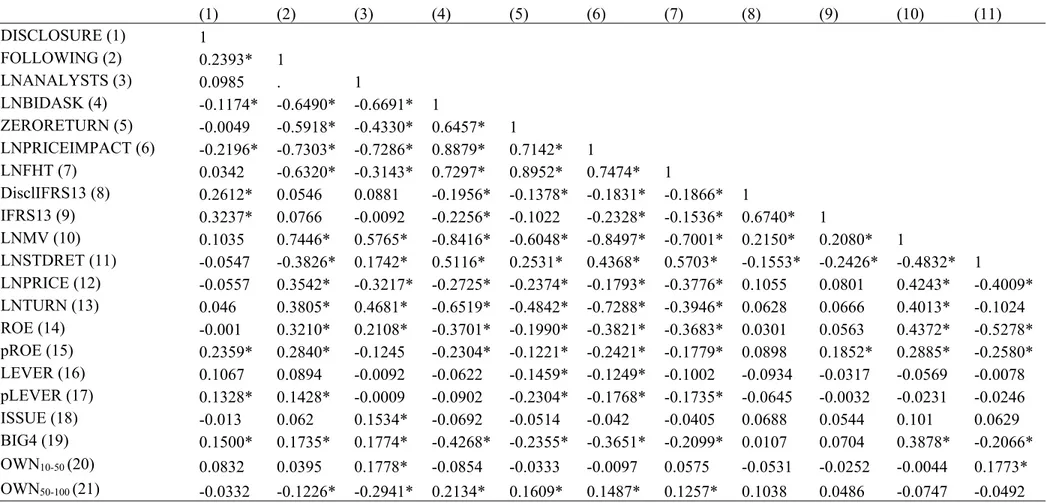
their present value calculations (e.g., average rent per square-metre used in present value calculations). The proportions before and after IFRS 13 are 8.3% and 21.2% respectively (p-value = 0.002).5 Furthermore, 58.1% disclose a quantitative sensitivity analysis (SENSITIVITY), which typically shows how fair values change with a change in key unobservable input variables in the fair value measurement. The proportions before and after IFRS 13 are 52.9% and 70.6% (p-value = 0.006). Table 2 (Panel C) presents descriptive statistics on the explanatory variables in the regressions. Table 3 reports the correlations between the variables. It can be seen that the correlation between DISCLOSURE and FOLLOWING is positive and significant (p-value < 0.05). The association between LNANALYSTS and DISCLOSURE is insignificant.
[Insert Tables 2 and 3 here]
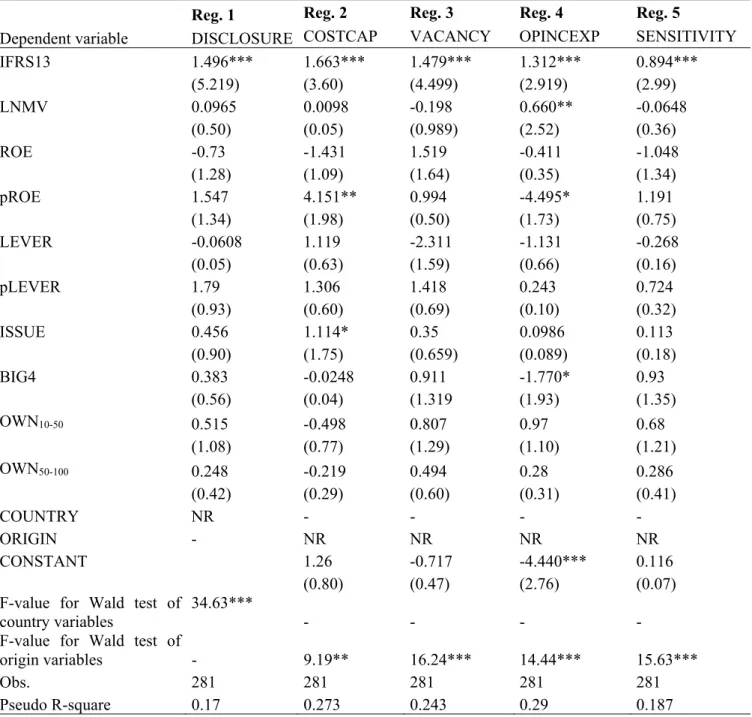
Table 4 reports ordered logistic regression results with DISCLOSURE as the dependent variable as well as binary logistic regressions with the components of the disclosure index as dependent variables. The standard errors in the regressions are clustered by company (Cameron & Trivedi, 2010, p. 527-529; Rogers, 1993).
Hypothesis 1 predicts a positive association between IFRS13 and DISCLOSURE. It can be seen that IFRS13 has a positive coefficient significant at the 0.01 level in the regressions with DISCLOSURE, as well as in the regressions with the components of the index (i.e., COSTCAP, VACANCY, OPINCEXP and SENSITIVITY) as the dependent variables. Thus, the results strongly support Hypothesis 1, which predicts that companies disclose more under IFRS 13 than IAS 40.
[Insert Table 4 here]
5 Indeed, although this type of quantitative information was disclosed, the disclosures were, according to observations
made by the authors when the data was collected, often too concise to make an evaluation of the fairness of the assumptions possible.
A further observation that can be made from regression 1 is that there seems to be considerable cross-country variation in disclosure quality (country coefficients not reported in the table). A Wald test shows that the null hypothesis (that the joint significance of the country variables) can be rejected at the 0.001 level. More specifically, the countries with the highest coefficient estimates in the left-hand regression are Sweden, Germany and Finland. The countries with the lowest coefficient estimates are Italy, Britain and France. Prior studies suggest that cross-country differences may be driven by institutional or cultural factors (e.g., Hope, 2003; Glaum et al, 2013). However, the result is also consistent with herding behaviour, that is, companies mimic the disclosures of other companies in the industry and country-wide industry practices emerge. Finally, Arya and Mittendorf (2007) suggest that companies within an industry will co-ordinate their disclosure policies. This finding is based on a theoretical model in which proprietary costs deter companies from disclosure, but that better disclosures will attract more analyst following. Their model suggests that companies in any given country will only disclose if other companies in the industry do likewise. It is beyond the scope of this study to evaluate these alternative explanations.
A final observation that can be made is that financial ratios are generally not significantly associated with disclosure quality. A possible reason for this is that companies maintain the same disclosure policies over time but that financial ratios vary. A result showing that disclosure policies are fairly stable is that the Spearman rank correlation between DISCLOSURE in year t and year t-1 is 0.81 (not reported).
5.2 Disclosure quality and analyst following
It can be seen from Table 2 (Panel B) that 70.5 % of the firm-years (182 / 258) are followed by analysts. The table also reports that the logarithm of the number of analysts following the 182 companies is 1.62, suggesting that on average 5.1 analysts prepare one year EPS forecasts. The proportion of the firm-years followed by analysts is 68.3 % and 76.0 % before and after IFRS 13 (not
reported in tables). Furthermore, a two-sample test of the proportions shows that the difference is insignificant (p-value = 0.218). The average log of the number of analysts (LNANALYSTS) is 1.62 before and 1.61 after the adoption of IFRS 13. Table 3 displays the correlations between the variables. Here it can be seen that the correlation between FOLLOWING and DISCLOSURE is 0.24 (p-value = 0.001) and that the correlation between LNANALYSTS and DISCLOSURE is 0.10 (p-value = 0.186). Thus, the univariate results provide some support for Hypothesis 2.
Table 5 relates disclosure quality to analyst following using the two-stage Heckman procedure. The results from the first step in which we estimate probit regressions with FOLLOWING as the dependent variable are reported in the upper part of the table. In the lower part of the table, we estimate OLS regressions with LNANALYSTS as the dependent variable and the Inverse Mills ratio as an additional explanatory variable in order to control for selection bias.6 The total number of observations is 250, of which 181 are uncensored.7
It can be seen from the selection model results for regression 1 (reported in the lower part of the table) that DISCLOSURE is significantly associated with analyst following (p-value < 0.001). However, DISCLOSURE is insignificant when LNANALYSTS is the dependent variable (reported in the lower part of the table). Thus, companies with higher disclosure quality are more likely to be followed by analysts. However, the number of analysts following the company is not associated with disclosure quality.8
[Insert Table 5 here]
We also attempted to replace the disclosure index with its components (i.e., COSTCAP, VACANCY, OPINCEXP and SENSITIVITY) and those results show that VACANCY and
6 The results are qualitatively similar when the Inverse Mills ratio is dropped from the regressions.
7 Data on analyst following was retrieved from Datastream but was not available for 31 firm-years, most probably because
the companies were not followed by analysts. We attempted to run the models in Table 5 under the assumption that those firms are not followed by analysts. The results are qualitatively similar to those reported in Table 5.
8 We also attempted to use an extended disclosure index including the disclosure the change in the discount rate and the
SENSITIVITY are significantly associated with analyst following (FOLLOWING) in the selection regressions (p-values < 0.01) (not reported in the tables). Thus, the results provide partial support for Hypothesis 2, which predicts that analyst following is positively associated with disclosure quality.
In the motivation for Hypothesis 4, we argue that if companies disclosed less information than users of financial statements required under IAS 40, and IFRS 13 mandated them to disclose more, then we would expect positive economic consequences with the adoption of IFRS 13. We expect to see this effect for companies disclosing more under IFRS 13 than IAS 40. The sample includes 85 firm-years under IFRS 13 and for those the disclosure quality is higher in years under IFRS 13 than in the final year under IAS 40 for 54.1 % (46 / 85) of the observations. DisclIFRS13 takes the value 1 for those observations. Regressions 2 and 4 (in Table 5) include tests of Hypothesis 4. The hypothesis predicts positive coefficients on DisclIFRS13, but they are insignificant. Thus, the results do not provide significant support for the hypothesis.
In order to provide a better control for time invariant uncontrolled variables, we also attempted to test Hypothesis 4 using a random effect logistic regression with FOLLOWING as the dependent variable, DisclIFRS13 as the test variable and the same control variables as in Table 5 with the exception of ORIGIN (Cameron & Trivedi, 2010, pp. 625-627). DisclIFRS13 is also insignificant in that regression. We attempted to estimate a fixed-effects model (Cameron and Trivedi, 2010, pp. 235-258) with LNANALYSTS as the dependent variable. DisclIFRS13 is also insignificant in this regression, in which we control for firm-specific effects on analyst following (not reported in the tables).
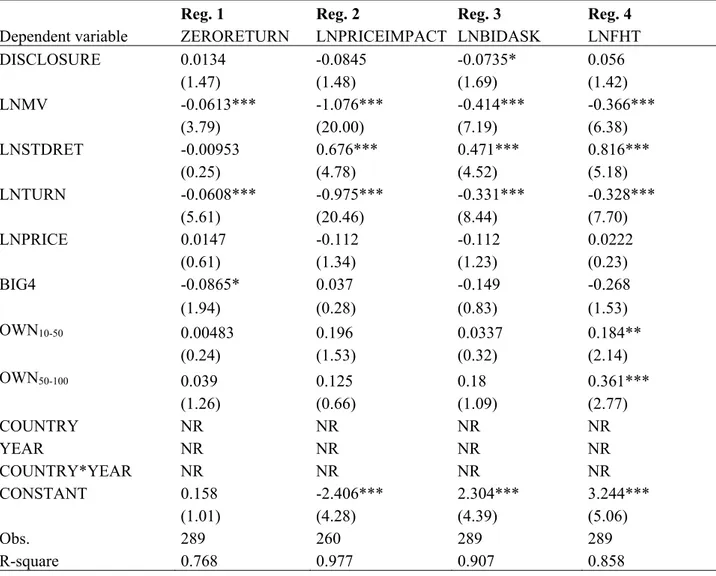
5.3 Disclosure quality and market liquidity
We use ZERORETURN, LNPRICEIMPACT, LNBIDASK and LNFHT as market liquidity proxies in our tests of Hypothesis 3. Lower values on the market liquidity ratios suggest better
liquidity. Therefore, Hypothesis 3 predicts a negative association between disclosure quality and the market liquidity proxies.
Descriptive statistics on the market liquidity ratios and the test and control variables in the regressions are reported in Table 2. Pearson correlations provide a first indication of the associations between disclosure quality and market liquidity. Lower values of the market liquidity proxies suggest better liquidity. Table 3 shows that the correlation between DISCLOSURE and LNPRICEIMPACT is -0.22 (p-value < 0.01) and that the correlation between DISCLOSURE and LNBIDASK is -0.12 (p-value = 0.05). Thus, these correlations suggest a positive association between market liquidity and disclosure quality. However, the correlations between DISCLOSURE and ZERORETURN, and DISCLOSURE and LNFHT are insignificant.
Table 6 (Panel A) includes Ordinary-least-square (OLS) regressions relating disclosure quality to market liquidity. Lower values of the market liquidity proxies suggest better liquidity. Thus, Hypothesis 3 predicts negative coefficients on DISCLOSURE. The following observations can be made from the table. DISCLOSURE has the predicted negative sign (p-value 0.096) when LNBIDASK is the dependent variable in the regression. Furthermore, DISCLOSURE has a negative but insignificant coefficient (p-value 0.145) in the regression with LNPRICEIMPACT as the dependent variable and DISCLOSURE is also insignificant in the regressions with ZERORETURNS and LNFHT as the dependent variables.
We ran two variants of the regressions in Table 6 (Panel A) in order to further explore the association between disclosure quality and market liquidity (not reported in the tables). First, we replaced DISCLOSURE with the four indicator variables representing each of the levels of the disclosure index. This analysis was done in order to explore possible non-linear associations between disclosure quality and market liquidity. In these regressions, DISCLD1 takes the value one for companies disclosing one of the items in the index, DISCLD2 takes the value one for companies disclosing two of the items in the index, DISCLD3 takes the value one for companies disclosing three
of the items in the index and DISCLD4 takes the value one for companies disclosing all four items in the disclosure index. Companies not disclosing any items at all are in the comparison group.
In the regression with LNBIDASK as the dependent variable DISCLD4 has a negative coefficient significant at the 0.10 level (p-value = 0.094), thus suggesting that companies disclosing all the four items in the index have lower bid-ask spreads than companies not disclosing any items at all. The coefficient of DISCLD4 is also lower than the coefficient of DISCLD1 and a Wald-test shows that the difference is significant at the 0.05 level (p-value = 0.038). In the regressions with LNPRICEIMPACT as the dependent variable, DISCLD4 has a negative coefficient significant at the 0.10 level (p-value = 0.082). A further result showing that better disclosures are associated with a lower price impact is that the coefficient of DISCLD4 is significantly smaller than the coefficient of DISCLD1. A Wald-test shows that the difference between the coefficient estimates is significant at the 0.05 level (p-value = 0.018). No significant associations in the regressions with ZERORETURN or LNFHT as the liquidity measures are found.
Secondly, we replaced the disclosure index with its components COSTCAP, VACANCY, OPINCEXP and SENSITIVITY (not reported in the tables). These results show that the disclosure of SENSITIVITY is negatively associated with the bid-ask spread (p-value = 0.063). All the other associations are insignificant. The results thus provide limited support for Hypothesis 3, which predicts a positive association between disclosure quality and market liquidity.
Hypothesis 4 predicts that increased disclosure after IFRS13 adoption is associated with improved market liquidity. We use DisclIFRS13 as the empirical measure in the tests of this hypothesis. OLS regression results are reported in Table 6 (Panel B). It can be seen that DisclIFRS13 has insignificant coefficients in all regressions.
In a further test of Hypothesis 4, we attempted to estimate fixed effect regressions with robust standard errors (Cameron & Trivedi, 2010, pp. 257-258). The dependent and independent variables in these regressions are the same as in Table 6 (Panel B), with the exception that country is omitted
because it is time-invariant (regressions not reported in the tables). The coefficients of DisclIFRS13 are insignificant in all the fixed effect regressions.
Another observation that can be made from the fixed effect regressions and from the OLS regressions reported in Table 6 is that IFRS13 has a negative sign significant at the 0.05 level in the regression with LNPRICEIMPACT as the dependent variable. IFRS13 has a negative and significant coefficient in the fixed effect regression with LNBIDASK as the dependent variable as well. However, it would be premature to conclude that the arguably improved guidance on fair value measurements under IFRS 13 has improved market liquidity. This association may also be driven by macroeconomic changes. Thus, the results with market liquidity as the dependent variable do not support Hypothesis 4.
5.4 Did companies adhere to IFRS 13 disclosure requirement before the standard’s effective date?
A possible reason for the insignificant effects of increased disclosures on analyst following and market liquidity is that companies started to follow the disclosure requirements in IFRS 13 prior to the standard’s effective date. As a consequence, only part of the total effect of IFRS 13 would be able to be observed around the effective date of the standard. This possibility is explored by identifying when disclosure requirements that are essentially similar to those in IFRS 13 were first published. After that, we provide evidence about when companies changed their disclosures. Finally, the analyses are repeated after excluding the years that companies could have been aware of the forthcoming disclosure requirements under IFRS 13.
IFRS 13 has a fairly long history. The first steps to develop the standard were taken in 2005 when IASB added the project to its agenda and in 2006 when a discussion paper was developed. IASB published the Exposure Draft (ED) of Fair Value Measurement (ED 2009/5) in September 2009. However, the disclosure requirements in the ED were less detailed than those in the final
standard and therefore gave poor signals about the final disclosure requirements.9 In June 2010, IASB issued ED 2010/7 “Measurement Uncertainty Analysis Disclosure for Fair Value Measurement: Limited Re-exposure of Proposed Disclosure”. This ED includes requirements to conduct a sensitivity analysis (ED 2010/7 para. 2a). Unlike IFRS 13, ED 2009/5 and ED 2010/7 did not require firms to provide quantitative information about the significant unobservable inputs. In conclusion, the disclosure requirements in the EDs differed quite a bit from the final ones, thus suggesting companies had little information about the required disclosures before the publication of the final standard in May 2011.
In order to study whether the revised disclosure requirements motivated companies to disclose more prior to the effective date, we examined the temporal evolution of the disclosure index (DISCLOSURE). Its average evolves as follows between 2009 and 2014: 1.1 in 2009, 1.4 in 2010, 1.4 in 2011, 1.4 in 2012, 1.9 in 2013 and 2.5 in 2014.10 Thus, the jump in disclosure quality took place in 2013 when IFRS 13 became mandatory. Furthermore, disclosure quality seems to have improved in 2014. A possible reason for this is that during the first year under IFRS 13 companies learned what kind of disclosures competitors and other similar companies made and therefore improved their own disclosures in 2014.
To gain further insights into the effects of the IFRS 13 transition period on the results, the regressions were re-run after an exclusion of years 2011 and 2012. The key issue of interest here is whether improved disclosures are associated with increased analyst coverage and market liquidity. We measure improved disclosures with an indicator variable taking the value one if the disclosure index of the company is smaller in 2010 than in 2013 or 2014 (DisclIFRS13rev). The sample includes 103 observations before IFRS 13 was adopted and 81 observations under IFRS 13. Of these 81
9 In essence, the ED required companies to disclose “the methods and inputs used the fair value measurement and the
information used to develop those inputs” (see ED/2009/5, para. 57d). This requirement was similar to that in IAS 40.
10 These numbers are marginally influenced by the use of an unbalanced panel. The corresponding numbers when we only
include the 34 companies for which information is available for the entire 2009-2014 period are: 1.2 in 2009, 1.5 in 2010 and 2011, 1.4 in 2012, 2.0 in 2013 and 2.5 in 2014.
observations, 43 are for companies disclosing more under IFRS 13. We first attempted to regress FOLLOWING on DisclIFRS13rev and the same control variables as in regression 2 in the upper part of Table 5. The coefficient and p-value of DisclIFRS13rev are -0.29 and 0.62 respectively. The coefficient of DisclIFRS13rev is insignificant in a regression with LNANALYSTS as the dependent variable as well. We next regressed the market liquidity measures ZERORETURN, LNPRICEIMPACT, LNBIDASK and LNFHT on DisclIFRS13rev and the control variables in Panel B of Table 5. DisclIFRS13rev is insignificant in all the regressions. Thus, the results are qualitatively similar to those reported in Tables 4 and 5, when we exclude the years in which companies could have voluntarily started to adhere to the disclosure requirements in IFRS 13.
6. Conclusions
Prior literature suggests that fair values are relevant for users of financial statements, but that the reliability of fair values may be questionable if unobservable inputs have been used. Arguably, the disclosure of the significant assumptions applied could reduce information asymmetry problems between the firm and users of financial information. Based on this assertion, it can be argued that extensive disclosure requirements supported by detailed implementation guidance are beneficial in that they improve comparability, increase verifiability and reduce opportunities for earnings management (Schipper, 2003). However, the current disclosure requirements under the IAS/IFRS standards have also been criticised for being excessive and for having lost relevance (New Zealand Institute of Chartered Accountants, 2011; European Financial Reporting Advisory Group, 2012). The adoption of IFRS 13 in 2013 meant that fair value disclosure requirements became more complex. Thus, this change is consistent with the view expressed by proponents of detailed requirements, but is not consistent with views expressed by the critics of the same. This study contributes to this debate by providing evidence on the determinants and economic consequences of disclosure quality.
The empirical analyses in this study are based on a small but homogeneous sample of companies in the real estate sector that report fair values of their investment properties on their balance sheets. The companies in the sample use DCF as the valuation technique to measure the fair values. We focus on disclosure quality related to key input variables in the DCF calculations and the results show that the provision of high quality disclosures are valued favourably by analysts and investors. More specifically, we find a strong association between disclosure quality and the likelihood that a company is followed by analysts. Furthermore, our results also indicate that bid-ask spreads are lower for companies providing higher quality disclosures.
Additionally, we find that companies disclose significantly more information about the key assumptions applied in the fair value measurement under IFRS 13 than IAS 40. A central but challenging question is whether companies are now compelled to disclose more than they think users demand under IFRS 13, or whether costs of disclosure impeded the disclosure under IAS 40. In order to provide some evidence related to this issue, we study whether improved disclosures under IFRS 13 have a positive impact on analyst following and market liquidity. We failed to find any support for these predictions.
What are the implications for companies and standard setters? First, the impact of disclosure quality on analyst following and bid-ask spreads indicates that high quality disclosures are valued positively by investors. Thus, it seems to lie in the interest of companies to provide extensive disclosures. The implications for standard setters are less straightforward and ultimately depend on the assumed role of disclosure regulation. The overall objective of financial reporting is to provide information that is useful for investors and other stakeholders (e.g., IASB Conceptual Framework, OB2). One view is that all information that could possibly make a difference to users should be disclosed. However, the disadvantage of this approach is that financial reports will become unnecessarily long and costly to prepare. Thus, another approach is to only regulate if it passes the test of making a difference to users (cf. New Zealand Institute of Chartered Accountants and the
Institute of Chartered Accountants of Scotland, 2011 p. 3). Passing this test may be interpreted as solving a market failure or having empirically documented positive effects. We fail to find support for the existence of positive economic consequences of the change in the disclosure requirements: the short and simple requirements under IAS 40 seem to work as well as the more detailed ones under IFRS 13.
Our study has some limitations. Firstly, our economic consequences analysis is limited to analyst coverage and market liquidity measures. A study of other economic consequences may have yielded other results. Secondly, our sample is small and focused on one industry only. We therefore encourage further research in other industries and/or with other samples. Finally, we have only studied disclosures in the notes to the financial statements included in annual reports. Companies can disclose information to shareholders in a number of other ways, including the front part of the annual report, the company’s website or at ‘road-shows’ where managers meet investors. We cannot rule out the possibility of companies with scant information in financial statements using other channels for the communication of fair value measurement practices to investors and other stakeholders. This is a topic for further study.