UNIVERSITÀ POLITECNICA DELLE MARCHE
FACOLT
ÀDI
SCIENZE
Doctoral Program in Life and Environmental Sciences
XIV cycle
Civil and Environmental Protection
INTEGRATED APPROACHES FOR THE MONITORING
AND ASSESSMENT OF ENVIRONMENTAL STATUS OF
THE ADRIATIC SEA IN THE FRAMEWORK OF THE
EUROPEAN MARINE STRATEGY DIRECTIVE
PhD candidate
Claudia Busca
Tutor
Prof. Antonio Dell'Anno
Co-tutors
Prof. Aniello Russo
Dott. Antonio Novellino
ii
Abstract
There are growing evidence that human activities together with climate change are driving profound changes of marine ecosystems with important repercussions on the goods and services they provide for human wellbeing. The Marine Strategy Framework Directive (MSFD, 2008/56/EU), approved in 2008 by the European Parliament and transposed at Italian level in 2010 (Legislative Decree 190/2010), requires Member States to provide information on marine environmental status and to take the necessary measures to achieve or maintain Good Environmental Status (GES) of the marine environment by the year 2020. The main objective of this PhD thesis is to improve knowledge on the trophic and thermohaline conditions of the Adriatic Sea related to descriptors 5 (eutrophication) and 7 (hydrographic alterations) which are included in the MSFD and used along with other 9 descriptors for the assessment of GES, through the use and integration of outputs of predictive models, physical and biological data measured in situ and satellite data analyzed at different spatial and temporal scales. In order to better clarify dynamics occurring at local scale, data on thermohaline and biogeochemical characteristics of coastal waters of Marche Region have been acquired along with information on the river outflows and nutrient load. Results of this study highlight that during the investigated period temporal patterns occurring at the basin scale are different than those observed at local scale. In particular, while at the basin an increase of water temperature and salinity together with an increase of the phytoplankton biomass have been observed in the last 10-15 years, at a local scale patterns of thermohaline and biogeochemical characteristics on a decade are generally opposite and influenced by the river dynamics. Overall results of this study on the one hand highlight the importance of using integrated tools and approaches for the study of the thermohaline and biogeochemical characteristics at different spatial scales (Adriatic basin vs. local scale), and on the other represent an important benchmark for a better understanding of the functioning of the Adriatic Sea and the potential changes that could affect the achievement of GES and its maintenance over time.
iii
Table of contents
Abstract...ii
Introduction ... 1
Objectives ... 18
The study area: the Adriatic Sea ... 19
References ...29
Chapter 1 ... 35
Quality check of forecasting system output ... 35
Introduction ...35 Materials ...36 Methods ...44 Results ...50 Conclusions ...54 References ...55 Chapter 2 ... 57
Spatial and temporal analysis of the thermohaline conditions and chlorophyll-a concentration in the Adriatic basin ... 57
Introduction ...57 Materials ...60 Methods ...64 Results ...68 Temperature ... 68 Salinity ... 73 Chlorophyll-a ... 74 Conclusions ...80 References ...82 Chapter 3 ... 85
Spatial and temporal changes of the thermohaline and biogeochemical characteristics of coastal marine systems at local scale (Marche region) and interactions with river outflow ... 85
Introduction ...85
Materials and methods ...88
Results ...92
iv
References ...115
Final remarks and needs for further researches ... 117
Annex I ... 119
Annex II ... 131
Introduction
The marine strategy:
a framework
for community action in the field of
marine environmental policy
The Marine Strategy Framework Directive (MSFD, 2008/56/EU) requires European Countries to provide information about marine environmental status and related strategies for improving ecosystem quality, where necessary, in order to ensure resources exploitation for the next generations.
The Marine Strategy Framework Directive (MSFD, 2008/56/EC) was approved in 2008, by the European Parliament and the European Council, for "establishing a framework for
community action in the field of marine environmental policy” (European Commission,
2008).By now at the second implementation, it is the environmental pillar of the Integrated Maritime Policy. It requires Member States to 'take the necessary measures to achieve or
maintain Good Environmental Status (GES) in the marine environment by the year 2020 at the latest' (OJ L 164/9, Chapter I, Article 1.1; 2008). The Directive defines the Good
Environmental Status (GES) as "the environmental status of marine waters where these provide ecologically diverse and dynamic oceans and seas which are clear, healthy and productive". GES means that the different uses made of the marine resources are conducted at a sustainable level, ensuring their continuity for future generations. In order to achieve GES by 2020, each Member State is required to develop a strategy for its marine waters (or Marine Strategy). In addition, because the Directive follows an adaptive management approach, the Marine Strategies must be kept up-to-date and reviewed every 6 years. Figure 1 from Claussen et al. (2011) shows the management cycle of the MSFD. Several discussions arise for the definition of GES under Article 3(5), because of its vagueness and lack of legal precision, leading to over 20 different GES determinants across the Member States with Article 10 not clearly defining or exactly prescribing the difference between GES and targets or how they relate to each other. Moreover, on the achievement and maintenance of GES, the MSFD considers only direct pressures due to anthropogenic activities while also climate change should be strongly kept into account, especially because of its unmanaged nature. All regional seas, their catchments and the adjacent areas will be affected by climate change, one of many stressors in a wider typology of marine hazards and risks (Elliott et al, 2016).
Figure 1- MSFD management cycle (summarized by Claussen et al., 2011).
The MSFD includes a set of 11 descriptors on the basis of which GES should be determined. The eleven descriptors are listed below:
Descriptor 1. Biodiversity is maintained.
Descriptor 2. Non-indigenous species do not adversely alter the ecosystem. Descriptor 3. The population of commercial fish species is healthy.
Descriptor 4. Elements of food webs ensure long-term abundance and reproduction. Descriptor 5. Eutrophication is minimised.
3
Descriptor 7. Permanent alteration of hydrographical conditions does not adversely affect the ecosystem.
Descriptor 8. Concentrations of contaminants give no effects. Descriptor 9. Contaminants in seafood are below safe levels. Descriptor 10. Marine litter does not cause harm.
Descriptor 11. Introduction of energy (including underwater noise) does not adversely affect the ecosystem.
Moreover, commission decision 2010/477/EU includes 29 agreed criteria and 56 indicators on which GES could be defined (Table 1).
Table 1- Descriptors, criteria and indicators for ecosystems monitoring
Descriptor Criteria Indicator
Descriptor 1. Biodiversity is maintained 1.1. Species distribution - Distributional range (1.1.1) - Distributional pattern within the latter, where appropriate (1.1.2) - Area covered by the species (for sessile/benthic species) (1.1.3) 1.2. Population size - Population abundance and/or biomass, as appropriate (1.2.1) 1.3. Population
condition - Population demographic characteristics (e.g. body size or age class structure, sex ratio, fecundity rates, survival/mortality rates) (1.3.1) - Population genetic structure, where appropriate (1.3.2)
1.4. Habitat distribution
- Distributional range (1.4.1) - Distributional pattern (1.4.2) 1.5. Habitat extent - Habitat area (1.5.1)
- Habitat volume, where relevant (1.5.2)
1.6. Habitat condition
- Condition of the typical species and communities (1.6.1)
- Relative abundance and/or biomass, as appropriate (1.6.2) - Physical, hydrological and chemical conditions (1.6.3) 1.7. Ecosystem
structure - Composition and relative proportions of ecosystem
components (habitats and species) (1.7.1)
4 indigenous species do
not adversely alter the ecosystem
state characterisation of non-indigenous species, in particular invasive species
occurrence and spatial distribution in the wild of non-indigenous species, particularly invasive non-indigenous species, notably in risk areas, in relation to the main vectors and pathways of spreading of such species (2.1.1)
2.2. Environmental impact of invasive non-indigenous species
- Ratio between invasive non-indigenous species and native species in some well-studied taxonomic groups (e.g. fish, macroalgae, molluscs) that may provide a measure of change in species composition (e.g. further to the displacement of native species) (2.2.1)
- Impacts of non-indigenous invasive species at the level of species,
habitats and ecosystem, where feasible (2.2.2)
Descriptor 3. The population of
commercial fish species is healthy 3.1. Level of pressure of the fishing activity - Fishing mortality (F) (3.1.1). (primary indicator)
- Ratio between catch and biomass index (hereinafter „catch/biomass ratio‟) (3.1.2). (secondary indicator) 3.2. Reproductive
capacity of the stock
- Spawning Stock Biomass (SSB) (3.2.1). (primary indicator)
- Biomass indices (3.2.2) (secondary
indicator)
3.3. Population age and size distribution
- Proportion of fish larger than the mean size of first sexual maturation (3.3.1) (primary indicator)
- Mean maximum length across all species found in research vessel surveys (3.3.2) (primary indicator) - 95 % percentile of the fish length distribution observed in research vessel surveys (3.3.3) (primary
indicator)
- Size at first sexual maturation, which may reflect the extent of undesirable genetic effects of exploitation (3.3.4) (secondary
indicator)
Descriptor 4. Elements of food webs ensure long-term abundance
4.1. Productivity (production per unit biomass) of key
- Performance of key predator species using their production per unit biomass (productivity) (4.1.1)
5 and reproduction species or trophic
groups
4.2. Proportion of selected species at the top of food webs
- Large fish (by weight) (4.2.1) E30+E31
4.3. Abundance/dist ribution of key trophic
groups/species
- Abundance trends of functionally important selected groups/species (4.3.1)
Descriptor 5. Eutrophication is minimised
5.1. Nutrients levels - Nutrients concentration in the water column (5.1.1)
- Nutrient ratios (silica, nitrogen and phosphorus), where appropriate (5.1.2)
5.2. Direct effects of nutrient
enrichment
- Chlorophyll concentration in the water column (5.2.1)
- Water transparency related to increase in suspended algae, where relevant (5.2.2)
- Abundance of opportunistic macroalgae (5.2.3)
- Species shift in floristic composition such as diatom to flagellate ratio, benthic to pelagic shifts, as well as bloom events of nuisance/toxic algal blooms (e.g. cyanobacteria) caused by human activities (5.2.4)
5.3. Indirect effects of nutrient
enrichment
- Abundance of perennial seaweeds and seagrasses (e.g. fucoids, eelgrass and Neptune grass) adversely
impacted by decrease in water transparency (5.3.1)
- Dissolved oxygen, i.e. changes due to increased organic matter
decomposition and size of the area concerned (5.3.2)
Descriptor 6. The sea floor integrity ensures functioning of the ecosystem 6.1. Physical damage, having regard to substrate characteristics
Type, abundance, biomass and areal extent of relevant biogenic substrate (6.1.1)
- Extent of the seabed significantly affected by human activities for the different substrate types (6.1.2) 6.2. Condition of
benthic community
- Presence of particularly sensitive and/or tolerant species (6.2.1) - Multi-metric indexes assessing
6
benthic community condition and functionality, such as species
diversity and richness, proportion of opportunistic to sensitive species (6.2.2)
- Proportion of biomass or number of individuals in the macrobenthos above some specified length/size (6.2.3)
- Parameters describing the characteristics (shape, slope and intercept) of the size spectrum of the benthic community (6.2.4)
Descriptor 7.
Permanent alteration of hydrographical
conditions does not adversely affect the ecosystem
7.1. Spatial characterisation of permanent alterations
- Extent of area affected by permanent alterations (7.1.1)
7.2. Impact of permanent hydrographical changes
- Spatial extent of habitats affected by the permanent alteration (7.2.1) - Changes in habitats, in particular the functions provided (e.g. spawning, breeding and feeding areas and migration routes of fish, birds and mammals), due to altered hydrographical conditions (7.2.2) Descriptor 8. Concentrations of contaminants give no effects 8.1. Concentration of contaminants
- Concentration of the contaminants mentioned above, measured in the relevant matrix (such as biota, sediment and water) in a way that ensures comparability with the assessments under Directive 2000/60/EC (8.1.1)
8.2. Effects of contaminants
- Levels of pollution effects on the ecosystem components concerned, having regard to the selected biological processes and taxonomic groups where a cause/effect
relationship has been established and needs to be monitored (8.2.1)
- Occurrence, origin (where
possible), extent of significant acute pollution events (e.g. slicks from oil and oil products) and their impact on biota physically affected by this pollution (8.2.2)
7 Descriptor 9.
Contaminants in seafood are below safe levels
9.1. Levels, number and frequency of contaminants
- Actual levels of contaminants that have been detected and number of contaminants which have exceeded maximum regulatory levels (9.1.1) - Frequency of regulatory levels being exceeded (9.1.2)
Descriptor 10. Marine litter does not cause harm
10.1. Characteristics of litter in the marine and coastal
environment
- Trends in the amount of litter washed ashore and/or deposited on coastlines, including analysis of its composition, spatial distribution and, where possible, source (10.1.1) - Trends in the amount of litter in the water column (including floating at the surface) and deposited on the sea-floor, including analysis of its composition, spatial distribution and, where possible, source (10.1.2) - Trends in the amount, distribution and, where possible, composition of particles (in particular micro-plastics) (10.1.3)
10.2. Impacts of litter on marine life
- Trends in the amount and composition of litter ingested by marine animals (e.g. stomach analysis) (10.2.1)
Descriptor 11.
Introduction of energy (including underwater noise) does not
adversely affect the ecosystem
11.1. Distribution in time and place of loud, low and mid frequency impulsive sounds
- Proportion of days and their distribution within a calendar year over areas of a determined surface, as well as their spatial distribution, in which anthropogenic sound sources exceed levels that are likely to entail significant impact on marine animals measured as Sound Exposure Level (in dB re 1μPa2.s) or as peak sound pressure level (in dB re 1μPapeak) at one metre, measured over the frequency band 10 Hz to 10 kHz (11.1.1)
11.2. Continuous low frequency sound
- Trends in the ambient noise level within the 1/3 octave bands 63 and 125 Hz (centre frequency) (re 1μΡa RMS; average noise level in these octave bands over a year) measured by observation stations and/or with the use of models if appropriate (11.2.1)
8
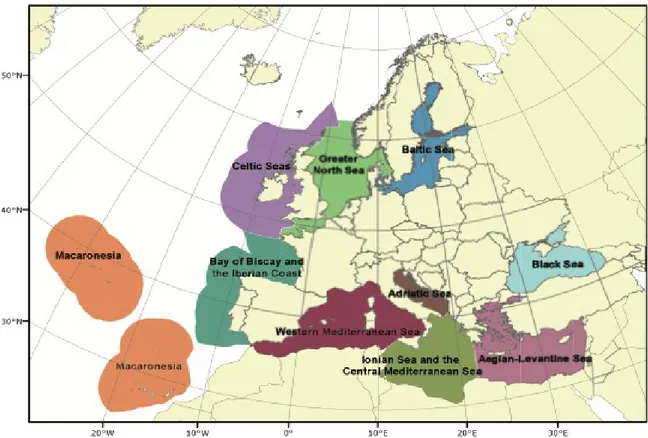
In order to achieve its goal, the Directive establishes European marine regions and sub-regions on the basis of geographical and environmental criteria. Four marine region are listed: the Baltic Sea, the North-East Atlantic Ocean, the Mediterranean Sea and the Black Sea, located within the geographical boundaries of the existing Regional Seas Conventions. The Mediterranean Sea, in turn, is divided in three sub-regions: the Western Mediterranean Sea, the Ionian Sea and the Central Mediterranean Sea and the Adriatic Sea (Figure 2).
The Directive established that monitoring programmes should be carried out and implemented on the basis on the initial assessment and be compatible within marine regions or subregions and shall integrate and complement the monitoring requirements imposed by other EU legislation (e.g. Water Framework Directive).Consistency, coherence and comparability within marine regions and subregions should be ensured by coordination of monitoring programmes and methods in the framework of Regional Sea Convention (RSCs) taking into account transboundary features and impacts.
Figure 2 European seas sub-division identified by Marine Strategy Framework Directive.
There are numerous on-going or planned marine monitoring activities in Member States. Still, the MSFD requires additional efforts to be implemented in a meaningful manner and gives an opportunity to review, revise and integrate existing activities. Efforts towards integration have already started and Members States should take them into account when
9
finalizing and reporting their monitoring programmes and are encouraged to consider cooperation in common cruises and sharing of capacities and know-how. Member States should also make the most of existing monitoring activities, e.g. ensure that monitoring under the DCF serves also to collect data for as many descriptors as possible.
The review of current MSFD related research programmes demonstrated that there is a wealth of on-going research and there are high expectations for delivering applicable outputs. However, gaps in basic knowledge and applied tools will continue to exist in the near future.
Gaps and needs for further research differ between descriptors depending on their level of maturity in respect to the methods, indicators and existing datasets. Some deficits and gaps concerning the majority of descriptors could be grouped as:
Lack of adequate data and time-series (e.g. on distribution of marine organisms, traceability of seafood, catches and by-catches for a number of non-targeted species, quantitative information on intermediate size litter-particles).
Lack of baseline knowledge (e.g. information on specific habitats-deep sea, knowledge of biology and ecology of invasive species).
Gaps on indicators relevant to answer MSFD objectives or describe GES and correspondent monitoring parameters (e.g. indicators for specific habitats and species communities).
The identification of the gaps drives future research on monitoring. Such research could be implemented directly when appropriate methods are available to support monitoring for MSFD. In case of not available methods or data, additional investment and research is required to ensure a medium- or long –term implementation of efficient monitoring. Moreover, investment on common data platforms and on integration of observations from different surveys and sources will be useful in terms of knowledge-sharing, as well as compilation of geo-referenced monitoring data (GIS data) should become self-evident as this is a pre-requisite when applying the ecosystem based approach to planning and management of marine areas.
Infrastructure for Spatial Information in Europe (INSPIRE)
The challenges regarding the lack of availability, quality, organization, accessibility, and sharing of spatial information are common to a large number of policies and activities and
10
are experienced across the various levels of public authority in Europe. In order to solve these problems it is necessary to take measures of coordination between the users and providers of spatial information. The Directive 2007/2/EC of the European Parliament and of the Council adopted on 14 March 2007 aims at establishing an Infrastructure for Spatial Information in the European Community (INSPIRE) for environmental policies, or policies and activities that have an impact on the environment. INSPIRE is based on the infrastructures for spatial information that are created and maintained by the Member States. To support the establishment of a European infrastructure, Implementing Rules addressing the following components of the infrastructure have been specified: metadata, inter-operability of spatial data sets and spatial data services, network services, data and service sharing, and monitoring and reporting procedures.
INSPIRE does not require collection of new data. However, after the period specified in the Directive (within 5 years) Member States have to make their data available according to the Implementing Rules.
Interoperability in INSPIRE means the possibility to combine spatial data and services from different sources across the European Community in a consistent way without involving specific efforts of humans or machines. It is important to note that “interoperability” is understood as providing access to spatial datasets through network services, typically via Internet. Interoperability may be achieved by either changing (harmonizing) and storing existing datasets or transforming them via services for publication in the INSPIRE infrastructure. It is expected that users will spend less time and efforts on understanding and integrating data when they build their applications based on data delivered in accordance with INSPIRE. In order to benefit from the endeavors of international standardization bodies and organizations established under international law their standards and technical means have been utilized and referenced, whenever possible. To facilitate the implementation of INSPIRE, it is important that all stakeholders have the opportunity to participate in specification and development. For this reason, the Commission has put in place a consensus building process involving data users and providers together with representatives of industry, research and government. This open and participatory approach was successfully used during phases of decision processing such as the development of data specifications and data themes.
11
European Marine Observation and Data Network (EMODnet)
An example of effort in terms of marine data collection and sharing is the European Marine Observation and Data Network (EMODnet; Figure 3). It is a long term marine data initiative from the European Commission Directorate-General for Maritime Affairs and Fisheries (DG MARE) underpinning its Marine Knowledge 2020 strategy. EMODnet is a consortium of organizations assembling European marine data, data products and metadata from diverse sources in a uniform way. EMODnet consists of more than 100 organizations assembling marine data, products and metadata.
The main purpose of EMODnet is to unlock fragmented and hidden marine data resources and to make these available to individuals and organizations (public and private), and to facilitate investment in sustainable coastal and offshore activities through improved access to quality-assured, standardized and harmonized marine data which are interoperable and free of restrictions on use.EMODnet is currently in its second development phase with the target to be fully deployed by 2020.
Figure 3 - Example of screenshot from EMODnet platform (www.emodnet.eu).
The EMODnet data infrastructure is developed through a stepwise approach in three major phases. Currently EMODnet is at the end of the 2nd phase of development with seven sub-portals in operation that provide access to marine data from the following themes: bathymetry, geology, physics, chemistry, biology, seabed habitats and human activities. EMODnet development is a dynamic process so new data, products and functionality are
12
added regularly while portals are continuously improved to make the service more fit for purpose and user friendly with the help of users and stakeholders.
Phase I (2009-2013) - developed a prototype (so called ur-EMODnet) with coverage of a limited selection of sea-basins, parameters and data products at low resolution;
Phase II (2013-2016) - aims to move from a prototype to an operational service with full coverage of all European sea-basins, a wider selection of parameters and medium resolution data products;
Phase III (2015-2020) - will work towards providing a seamless multi-resolution digital map of the entire seabed of European waters providing highest resolution possible in areas that have been surveyed, including topography, geology, habitats and ecosystems; accompanied by timely information on physical, chemical and biological state of the overlying water column as well as oceanographic forecasts. EMODnet is subdivided into several categories: bathymetry, geology, seabed habitats, chemistry, biology, physics, human activities, coastal mapping.
This PhD thesis has been partially developed within the project EMODnet physics, thanks to the economic support of ETT Ltd, which coordinates such project. Physics portal has been developed under the ur-EMODnet preparatory actions during EMODnet Phase I (2009-2013). In the current phase, EMODnet Physics will enhance and expand existing services to move, together with the six other EMODnet sub-portals, towards an operational service with full coverage of all European sea-basins, a wider selection of parameters and medium resolution data products.
Access to archived and real-time data on the physical conditions of European sea-basins and oceans is important for a wide range of users and for many different reasons; to monitor sea level variability, to make predictions on climate change or for the operation and planning of off-shore activities. Physical parameters include; sea water salinity and temperature, currents, turbidity, wind direction and speed, sea level and ice cover.
Data on the physical state of our sea basins and oceans are currently collected and stored by a myriad of public and private organizations throughout Europe, using fixed measuring stations (e.g. moored buoys, rigs/platforms, coastal stations) or automatic observatories at sea (e.g. profiling floats, drifting buoys, ships of opportunity, research vessels). However,
13
until recently, there was no coordinated effort to assemble these data into integrated data streams and make them easily available for users at a pan-European scale.
This second phase will strengthen the existing structure and infrastructure of the EuroGOOS ROOSs as the backbone of EMODnet Physics and will improve and expand the data portal in order to:
Provide better access to additional data not yet in the current system; Provide access to additional Ferrybox data;
Streamline and optimize the data flow;
Fully exploit opportunities to obtain additional parameters from existing data sites; Fill in gaps in time series;
Assist the work on the completeness of stations, leading to a list of uniform station names that reduces duplication between ROOSs;
Achieve greater uptime of services and synchronization of data sources between ROOSs and data centers.
The challenge to achieve Good Environmental Status in a changing marine ecosystem due to global climate changes
There is now overwhelming evidence that human activities are driving rapid changes on marine ecosystems. Many of these changes are already occurring within the world‟s oceans with serious consequences likely over the coming decades. Our understanding of how climate change is affecting marine ecosystems has lagged behind that of terrestrial ecosystems. This is partly due to the size and complexity of the oceans, but also to the relative difficulty of taking measurements in marine environments. Studies on the impacts of climate changes on marine ecosystems revealed that the world oceans are changing rapidly with an increased risk of sudden nonlinear transformations (Hoegh-Guldberg and Bruno, 2010).
Alterations of hydrographical conditions (Descriptor 7) can occur as a consequence of global climate changes or human-related structures and/or activities (e.g. coastal defense structures, discharges of warm/cool waters by industrial plants, wind farms, fish farm). MSFD does not consider thermohaline and circulation's modifications due to climate changes but only the impact produced by direct anthropogenic pressures. Infrastructures can only affect hydrological conditions at local scales. The alteration of hydrographical conditions has a combined effect on both ecosystem processes and functions which in turn
14
complicates the assessment of the impact level. For example, changes in currents and waves can in turn induce further changes to sediment transportation, bed forms, salinity and temperature which might lead to further positive or negative impacts on the biota as a result of environmental changes or through food chain effects (Zampoukas et al., 2014). Changes in thermohaline regime and seawater circulation can have cascading effects on species and community (Descriptor 1 and 4; Table 2): species distribution is strongly related to their thermal tolerance and ability to adapt. Even individual physiological/phenological response depends on temperature regime: demographic changes resulting from alterations to recruitment, growth and survival together with phenological changes lead to potential predator-prey mismatches, along with the increased susceptibility to alien and invasive species (Descriptor 1,2,4; Table 2) ultimately determining ecosystem composition, spatial structure and functioning (Descriptor 1,4,6; Table 2). This will have repercussion on fisheries (Descriptor 3) and conservation management (Descriptor 1, 6). Altered temperature regime can profoundly modify the breeding cycle with consequent competitive advantage/disadvantage and changes in community structure and functioning along with increased growing season and growth rate, that means higher and longer productivity and changes in nutrient budget with symptoms of eutrophication and, once again, repercussion on fisheries and conservation management.
Large scale climatic patterns influence catchment run-off, including nutrients and contaminants, into semi-enclosed seas. Arguably, the greatest challenge in predicting the effects of climate change on the hydrodynamics of a catchment and hence the nutrient inputs to, and response in, enclosed coastal seas is the ability to understand these interlinked relationships (Meier et al., 2011). In particular, nutrient run-off will create the adverse consequences of eutrophication (i.e. Descriptor 5) but this is difficult to predict against a background of inherent variability due to changes in land-use patterns (Elliott et
15
Table 2 Main topics relating to the marine consequences of climate change and the way in which they influence the Good Environmental Status Descriptors D1-D11 (summarized from Elliott et al., 2016).
Descriptor D1 D2 D3 D4 D5 D6 D7 D8 D9 D10 D11
Topics
Altered temperature regime - species re-distribution and community response
• • • • •
Altered temperature regime - individual
physiological/phenological response
• • • • • • Increased relative sea level
rise-physiographic changes
• • • • •
Increased climate variability effects on coastal hydrodynamics
• • • •
Changes to large scale climatic patterns due to land run-off
• • • • • • • •
Increased relative sea level rise changing estuarine hydrodynamics
• • • •
Increased ocean acidification and seawater physical-chemical changes
• • • • • •
Loss of polar ice cover and global
transport repercussion • • • • • • • •
Sum categories 8 3 6 8 3 7 5 2 2 1 1
As shown here, climate change produces impediments to implementing the MSFD and achieving GES and there are repercussions of those impediments: (1) the science-base is good on conceptual aspects but is required to give precise links between changes in biota and climate features; the „so-what?‟ and what-if?‟ questions cannot yet be answered. New scientific developments may overcome this during several iterations of the MSFD process. (2) Climate change produces „shifting baselines‟ which need to be accommodated in monitoring, particularly during the assessment of GES and marine management; actions will have to account for „unbounded boundaries‟ given the ecology and climate change-induced
migrations and dispersal of highly-mobile, nekton and plankton species. Hence, long-term and spatially large datasets are essential for signal-noise separation, to identify changes in ecological indicators, detect sudden and gradual ecosystem shifts and regime changes, and provide a baseline against which to interpret future changes. However, given that such datasets do not exist for most components then this may not be achieved. As the MSFD
16
takes the current conditions as the baseline, predictions are required against current values.(3) The absence of empirical data will increase the use of modelling but the error limits on the models may be large, and increase because of climate change, or even be unknown, thus giving poor predictability. Furthermore, existing models are adequate for scenario and semi-quantitative testing but not for detailed quantitative and accurate predictions.(4) Member States at present are only considering the means of determining GES on a Descriptor-by-Descriptor basis but at some stage before 2020 they need to consider aggregating these to give GES for a regional or sub-regional area (Borja et al., 2014). Hence while assessing climate change on single Descriptors is the first priority, interactions amongst Descriptors and their changes due to climate change need addressing. Unless GES is defined across the Descriptors then ecosystem health will not be determined. However, it is questioned whether the science is adequate to judge changes in health due to climate change and whether any resulting system is regarded as „unhealthy‟ („deteriorated‟ à la MSFD) or just different.(5) The challenges for marine monitoring and management result from having climate change superimposed on the effects of local activities and where climate change may either exacerbate or mask anthropogenic changes in the Descriptors. Detecting change against a greater inherent variability will increase monitoring costs, a challenge in economically difficult times (Borja and Elliott, 2013).(6) Climate-driven spatial and temporal variation should be interrogated including a potential geographic disparity to achieving GES across the marine environment in general and across the regional seas. Raised temperature may have greater effects in northern than southern Europe but these are equivocal. Hence, baselines will have to be revised on a site-specific basis although the evidence needs to be extrapolated to show the short, medium and long-term effects and the speed of environmental response. Modelling is required to indicate how quickly communities can reach a new equilibrium but there is now an urgent need to show adaptation (or the lack of it) over 10s to 100s of generation times for marine organisms.(7) Society will place emphasis on the repercussions of non-achieving GES for the Ecosystem Services and Societal Benefits obtained from the regional seas (e.g. Atkins
et al., 2011). The loss of these due both to managed pressures but also climate change has
to be determined and emphasized to environmental managers and policymakers (Luisetti et
al., 2014; Turner et al, 2014).(8) The failure to meet GES because of climate change has
wide-ranging legal repercussions and could lead to a Member State being placed in infraction proceedings. A legal challenge will arise not because of the pressures inside the
17
waters of a Member State under which they might have some control but because of the external and no controlled pressures. The legal defence, that the failure was the result of third-party actions, natural causes or force majeure, would require to be supported by robust science.(9) These lessons are relevant and applicable not only to European seas and the implementation of the MSFD but also to other global areas, for example during the implementation of the Canada Oceans Act and the US Oceans Act 2000 (US Congress 2002). While the latter does not give the same degree of detail as the MSFD in achieving healthy and productive seas and it does not mention climate change in its few pages, determining and managing change due to separating this from other anthropogenic pressures have to be considered.
18
Objectives
To protect and manage the marine ecosystem it is necessary, first of all, to acquire a deep knowledge of its natural dynamics (deYoung et al., 2008; Giani et al., 2012). At national level, till July 2015 monitoring activities of marine systems carried out by the different Regional Agency for Environmental Protection are restricted to coastal waters (within 3 km far the coastline) and data acquired by scientific institutions in offshore systems are generally spatially and temporally fragmented. Thus, there is a urgent need from one side to integrate the different dataset and from the other to improve the spatial and temporal coverage. To this regard, remote sensing represents a powerful tool to increase the temporal and spatial coverage of environmental information (Barale et al., 2005) providing daily update of data. However, such tool allows only to obtain information on surface layer of the oceans, thus requiring an integration with other tools for the analysis of water masses and biological characteristics below the sea surface. Forecasting systems can help to improve 3D knowledge of marine ecosystems, but the reliability of their outputs should be carefully assessed.
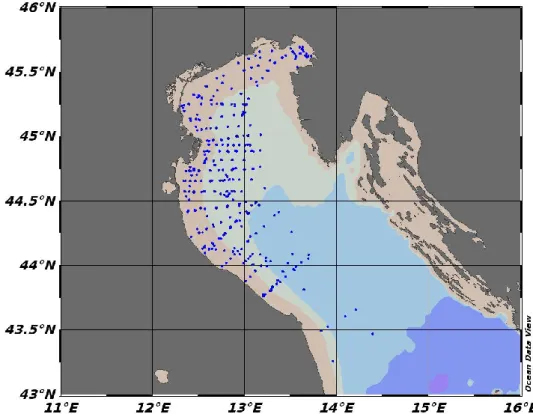
The main objective of this PhD thesis is to integrate data collected by in situ measurements, remote sensing and forecasting systems output in order to investigate at different spatial (from local to regional to basin) and temporal (from day, month, season, annual and interannual) scales changes in the main physical and biological variables of the Adriatic Sea related to descriptors 5 (i.e. eutrophication) and 7 (hydrographic alterations) of the MSFD. The variables investigated at the basin scale includes temperature and salinity and chlorophyll-a concentrations (as a proxy of phytoplankton biomass). To better understand spatial patterns, the basin has been divided into four areas on the basis of the bathymetry (Artegiani et al., 1996; Zavatarelli et al., 1998). Moreover, in order to better clarify dynamics occurring at local and regional scale, data on coastal waters of Marche Region have been acquired, thanks to the collaboration of the Agency for Environmental Protection of the Marche Region, along with information on the river outflows (data acquired from the Civil Protection of the Marche Region) and nutrient load.
Given the general spatial and temporal fragmentation of environmental data on the Adriatic Sea and the lack of validated data availability, the final purpose of this thesis is to share acquired data and knowledge by means of EMODnet platform, according to the Marine Strategy Framework Directive objective.
19
The study area: the Adriatic sea
One of the sub-regions identified by MSFD, and that has been investigated in this thesis, is the Adriatic Sea. The Adriatic Sea (Figure 4) is a complex natural system from both hydrological and biological point of view (Russo and Artegiani, 1996), characterized by a strong human pressure. Such human pressure along with the current global climate changes are strongly affecting the ecosystem health and resilience of the Adriatic Sea.The Adriatic Sea is located in the northern part of the Mediterranean Sea, orientated in northwest-southeast direction from 40°N to 46°N, with an average depth of 250 m and total surface of 138 000 km², which makes 1/20th of the entire Mediterranean. This elongated basin (800 km long and 90-200 km wide) is surrounded by Dinaric, Alpine and Apennine mountain chains. Its northern end is very shallow and gently sloping, with an average bottom depth of about 35m. The middle Adriatic is 140 m deep on the average, with the two Pomo Depressions reaching 260 m, situated between the two lines Ancona-Zadar and Gargano-Lastovo. The southern end is characterized by a wide depression deeper than 1200 m, situated between Gargano-Lastovo line and Otranto Channel.
This epicontinental basin, characterized by regular, low and sandy Italian coast on the west and generally high, rocky and torned by channels and islands eastern coast, is connected with the Ionian Sea by the Otranto Strait (800 m deep), where the water exchange with the rest of the Mediterranean Sea takes place suggesting an inflow along the eastern and an outflow along the western coast.
Although strong annual and year-to-year fluctuations of oceanographic properties give the Adriatic Sea a clearly continental aspect, from different points of view it can be considerate a miniature ocean because of its geomorphologic and hydrodynamic characteristics.
River runoff is particularly strong in the northern basin and affects the circulation through buoyancy input and the ecosystem by introducing large amounts of nutrients. Runoff is also responsible for making the Adriatic a dilution basin, with an average fresh water gain of about 1 m, since evaporation and precipitation almost compensate each other (Raicich,1996).
The Po River is the largest Italian river, with average discharge of 1500 m3/s, flowing trough very large and highly populated industrial and agricultural region that includes large cities like Milan and Torino. In this area intensive agricultural and industrial activities, with consequent nutrient losses, generate nutrient-rich discharges and increase of primary
20
production in northern Adriatic basin. In fact, although there are important nutrient inputs of Isonzo and Adige rivers, and some other point sources along both coasts, the Po River is responsible for 70% of nutrient input in Adriatic basin (Degobbis and Gilmartin, 1990; Beg Paklar et al., 2001).
Extension of the Po River plume influences granulometry, hydrodynamic and biogeochemical processes of northern and western part of the basin (Russo et al., 2005); the plume evolution depends on seasonality of river discharge that has two maxima, the first one in spring due to snow melting, and the second one in autumn due to strong precipitation (Marchetti, 1984). Other factors that influence the extension of the plume are seasonal meteorological and hydrological conditions: during winter period Po River discharge is confined along the Italian coastline, while in summertime, when stratification of water column is very noticeable, the warmer freshwater remains in the surface layer and spreads in all directions, even towards northern and eastern coasts; the varying wind regime induces further variability of the plume extension. These seasonal and higher frequency fluctuations of river inflow and meteorological and hydrological conditions can cause important biological effects, in particularly in spring and summer when short and relevant inputs could be important for development of mucilage events (Degobbis et al., 1995, 2005).
The Adriatic Sea presents a decreasing trophic gradient from north to south, due to the major nutrient input in northern part and general circulation in entire basin, with eutrophic conditions in northern basin and oligotrophic in central and southern basins (Degobbis and Gilmartin, 1990; Revelante and Gilmartin, 1976a,b, 1995; Zavatarelli et al., 1998). As the Po River discharge is the major source of nutrient input in the Adriatic Sea, the eutrophic coastal waters of northern Adriatic represent the most productive part with high primary productivity, while central and southern basins show oligotrophic characteristics and a lower primary productivity (Degobbis, 1988; Viličić, 1989, 2002; Viličićet al., 1998, 2002; Degobbis and Gilmartin, 1990; Degobbis et al., 1997).
In general, related to the spreading of Po River plume, a west-east decreasing gradient of biomass and production is observed (Smodlaka and Revelante, 1983; Smodlaka, 1986), that reflects climatic and trophic gradients. This eutrophic conditions and a high primary productivity induced by nutrient discharges in the coastal water of northern basin can cause local events of anoxic conditions in bottom water and consequent mass mortality of
21
benthic organism (Stachowitsch, 1984, 1991; Justićet al., 1987; Justić, 1991; Šimunovićet
al., 1999; Travizi and Vidaković, 1994; Travizi, 2000; Stachowitschet al. 2007).
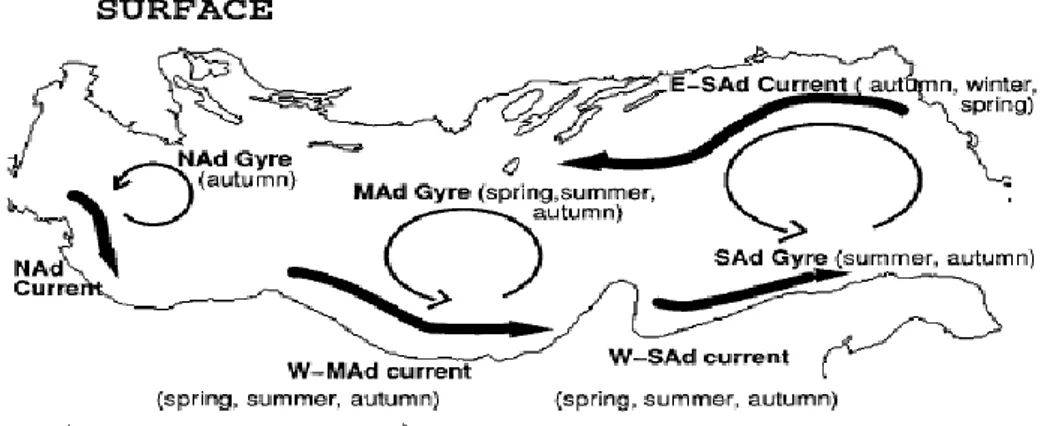
Because of its geomorphologic characteristics of epicontinental basin, the Adriatic is subject to highly variable atmospheric forcing, river discharges and air-sea fluxes that play an important role in controlling the dynamics of its waters and variability in circulation and distribution of its water masses, presenting a seasonal variability in the circulation (Artegiani et al., 1997a,b; Cushman-Roisinet al., 2001; Figure 4) and the ecosystem (Zavatarelli et al., 1998). It has been shown that the Adriatic circulation is influenced by morphology and seasonal meteorological changes (Buljan and Zore-Armanda, 1976; Franco et al., 1982) that cause changes in intensity of marine currents (stronger in autumn- winter period and less intensive in spring-summer period), due to stronger wind stress in autumn and winter and weaker one in spring and summer (Budillon et al., 2002).
Figure 4 - Schematic picture of the Adriatic Sea surface baroclinic circulation (Artegiani et al. 1997b).
The general circulation in the Adriatic basin is cyclonic with two main circulation currents and three sub-basin gyres (Russo and Artegiani 1996; Artegiani et al., 1997a,b; Bergamasco et al., 1999; Alvera-Azcarateet al., 2005): warmer and more saline Levantine Intermediate Waters (LIW) enter in Adriatic from the Ionian Sea through the Strait of Otranto and flow north-westward along the eastern coast as weak and wide current, called Eastern Adriatic Current (EAC); while western current, called Western Adriatic Current (WAC), flows southward along the western coast exporting to the Ionian Sea water with lower salinity due to the riverine inputs in northern basin (Orlićet al., 1992; Vilibić and Orlić, 2002; Vilibić, 2003; Vilibićet al., 2004; Alvera-Azcarateet al., 2005). Some authors found that the stronger advection of warmer and more saline Mediterranean waters, coincided with higher primary production and higher zooplankton in the Adriatic basin
22
(Buljan 1957, 1968; Zore-Armanda, 1963; Petković, 1970; Vučetić, 1970; Pucher-Petkovićet al., 1971).
The Adriatic basin shows a seasonal thermal cycle, with winter vertical mixing of the water column induced by surface cooling and wind stress, and formation of seasonal thermocline in spring and summer induced by freshwater input and surface heating that generate a stratifies water column (Franco, 1983, 1989; Franco and Michelato, 1992; Artegiani et al., 1997, 1989; Vested et al., 1998). Winter period is characterized by cooling of the water column, caused by formation of cold and dense water masses stressed by Bora that helps vertical mixing and causes its homogeneity, while summer period is characterized by vertical stratification and horizontal heterogeneity due to intensive heating of the surface and input of freshwater from Po River that generate a seasonal thermocline and halocline. The intensity of three basin cyclonic gyres, generated in every sub-basin, vary due to seasonal conditions and fluctuation of riverine inputs.
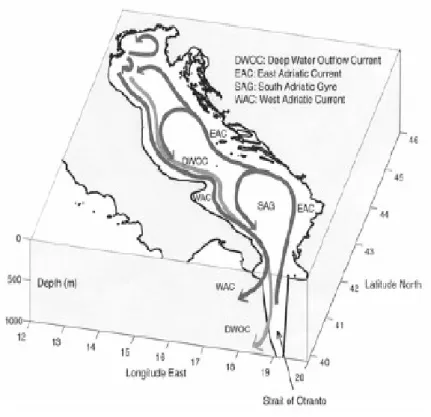
On basis of different temperature and salinity profiles it is possible to distinguish three main water masses in Adriatic basin: Surface Water, Adriatic Deep Water (ADW) and Modified Levantine Intermediate Water (MLIW; Figure 5). Surface Water occupies the layer above 100 meter of depth in the southern basin, layer that going toward the north-western end of the basin becomes thinner, up to order of 10 m in the north north-western most area. Surface Water includes Ionian and possibly Atlantic waters that enter in Adriatic Sea, flow along the eastern coast, as well as waters freshened by Po and other western rivers and outflow to Ionian Sea along western coast (Artegiani et al., 1997). The northern Adriatic Current (NAd current) can be found in front of the Po River mouth and during the winter period extends 100 km to the south along the Italian coast, while in summer period results separated from the current in the middle Adriatic that is called Western-Middle Adriatic Current (Artegiani et al., 1997; Zore-Armanda, 1969).
23
Figure 5 - Schematic picture of general circulation in the Adriatic Sea (Cushman-Roisinet al. 2001)
The Adriatic Sea behaves like a dilution basin due to Po River runoff (Artegiani et al., 1997) and it is one of the site where deep water formation occurs: generated by surface heat losses in the northern basin, the Northern Adriatic Dense Water (NADW) is generated due to strong wind stress of Bora, more pronounced in wintertime, and cool and fresh water which flow along the western coast (Artegiani et al., 1997; Roether and Schlitzer, 1991; Zavatarelli et al., 1998; Bergamasco et al., 1999; Vilibić and Orlić, 2002). Very low winter temperatures and wind stress of cold Bora cause deep water formation and mixing of surface waters with deeper water layers. Besides the formation of dense water in northern Adriatic, its formation has been reported in the southern and even in the middle Adriatic (Zore-Armanda, 1963). This dense water, called Adriatic Deep Water (ADW) spreads through the Strait of Otranto and becomes a component of the Eastern Mediterranean Deep Water (EMDW; Figure 6).
24
Figure 6 - Seasonal maps of surface mean flow (Poulain, 2001)
The two dominant winds in Adriatic basin are: cold and generally dry wind from northeast direction called Bora, mainly present in winter, spring and autumn; and the south-easterly warm and humid wind called Sirocco, mainly present in autumn and summer (Cavaleri et
al., 1996; Bergamasco et al., 1999; Poulain, 1999; Russo et al., 2005; Pullen et al., 2007).
Other winds present in Adriatic Sea, with lower frequencies, are north-westerly wind Maestrale and Tramontana. In general, Bora implies advection of cold, dry air, while sirocco usually carries warm, humid air to the Adriatic area, but sometimes there are exceptions to this pattern when “dry Sirocco“ and “dark Bora“ events occur. Mean wind fields over the Adriatic are weak, but episodes of Bora and Sirocco affect significantly the Adriatic flow field.
25
The Bora wind is formed when the air pressure in Central Europe is high, especially in wintertime, and the Mediterranean basin is subjected to atmospheric depression that causes low pressure in the Adriatic basin, so that the flux of cold continental air from Central Europe passes through narrow valleys of Dinaric Alps to the Adriatic, increasing in this way the speed of the wind, reaching the maximum speed in eastern coast of Adriatic near Trieste, Senj and Šibenik. Such conditions, depending on different atmospheric configuration can generate both “light Bora” (dry wind) and “dark Bora” (wind with rain and snow). Once arrived in Adriatic basin, Bora wind of is subjected to weakening while proceeds across the Adriatic Sea, which creates the alternation of areas with high and low wind intensity and influences the marine currents, causing stronger current from the Gulf of Trieste and from the Kvarner Bay. Bora winds coming from the northeast, as well as Sirocco from southeast, can raise sea level meters up its mean and drown low. western coastlines This phenomenon generally occurs in autumn-winter period and it is called aqua
alta (high water in Italian) because of high tides that influence all the Venice Lagoon.
The Sirocco wind blows from south-east and it is generally warm, humid and less strong than Bora, incrementing gradually to the maximum intensity on the east cost of the middle Adriatic and then decreasing toward western and northern coasts. It causes different effects on marine current, generating major intensity of the Eastern Adriatic Current and, in combination with other factors, it can cause inversions in Western Adriatic Current with rare phenomena of upwelling in western coast of middle Adriatic (Poulain et al., 2004). There are two types of Sirocco, one is dry wind associated with anticyclonic atmospheric circulation and with clear sky, while the other one, more frequent, is associated with cyclonic circulation and accompanied by rain.
Biogeochemical characteristics of the Adriatic Sea
Several studies had been carried out in order to characterize Adriatic Sea from biogeochemical point of view. One of the more interesting data collection has been published by Zavatarelli et al. (1998) who consider a large amount of published and available unpublished data relative to the Adriatic Sea in the period 1911-1914 and 1948-1991. Despite data was affected by a certain degree of uncertainty - due to a large intrinsic variability of the properties considered and to the insufficient spatial-temporal coverage- provide a quite clear picture of the biogeochemical characteristics of the Adriatic Sea at basin scale as well as of the factors influencing the nutrients levels.
26
The nutrient levels in the northern Adriatic are clearly controlled by the river inputs (not only from the Po but also from the other Adriatic rivers) inducing intense phytoplankton development in late winter (due to rain and snow melting in the Alps and Appennines) and autumn, during intense raining events. Thus, in the northern Adriatic Sea the runoff is significantly dependent on interannual oscillations of precipitations, which might be easily affected in the future by climate modifications (Zanchettin et al., 2008; Cozzi et al., 2012). Another factor controlling the nutrient distribution is the assimilative processes of phytoplankton. In fact, during the winter bloom the biological demand for phosphate and silicate is such to determine a horizontal distribution of these two nutrients which is totally different from the distribution of nitrate (which appear more controlled by the advective processes), confirming the nature of the northern Adriatic Sea (NAd) as a phosphorus limited ecosystem (Degobbis, 1990).
The annual external input of nutrients, mostly anthropogenic, is of the same order of magnitude as the regenerated amounts during their seasonal cycle (Degobbis and
Gilmartin, 1990). Therefore,small changes of these inputs, combined with changes in the
water exchange rate with the central Adriatic, which is strongly influenced by climatic fluctuations, significantly affected the eutrophication pressure in the NAd. Changes of mean surface salinity and temperature in the open NAd during the period 1972-2000 were generally well correlated with Po River flow rates, except during the late 1980s, when salinity was lower and temperatures higher than expected from such correlations
(Degobbis et al., 2000; Djakovac,2003). This departure was explained by unusually long
periods of meteorological stability, during which freshwater mixing was limited to a thinner surface layer, in which heat accumulation was favored. Higher nutrient concentrations in seawater were measured during 1972-1978 as compared to 1980-1985, despite the increased DIN and PO4 levels in the Po River waters. This was due to higher flow rates in the earlier period. After 1986, the average flow rate of the Po River was similar to the preceding period, but the seawater concentrations of PO4 were lower, whereas DIN and SiO4 concentrations were higher, mainly due to changes in the Po River nutrient composition (Degobbis et al., 2000).
In relation to this, when compared at the same salinity (i.e. same dilution degree, independently from the freshwater discharge rate), the chlorophyll-a concentrations and the primary production rates were higher in periods of higher river PO4 concentrations, but not of DIN concentrations. The mean Po River flow rate in recent years (2003-2009) was
27
significantly lower than in the previous period (1972-1999). Consequently, a marked increase in surface salinity and decrease in PO4 and chlorophyll-a concentrations occurred in the eastern NAd during the more recent period (Djakovac et al., 2012), as well as at the western waters. Concurrently, a significant increasing trend of the DIN/PO4 ratio occurred. A significant decreasing trend of the PO4 and chlorophyll-a concentrations and an increasing trend of DIN and of DIN/PO4 ratio were detected during the last four decades (Giani et al., 2012).
Other analyses over the period 1970-2007 confirmed the aforementioned observations, showing significant decreasing trends for PO4, ammonium and chlorophyll-a concentrations in the NAd, but not for nitrate and SiO4 (Solidoro et al., 2009; Mozetic et al., 2010). These changes were marked in the 2000s, particularly in the area directly affected by Po River discharges. In the more oligotrophic eastern coastal waters the decrement was the lowest, while intermediate values were obtained for the Gulf of Trieste, the Gulf of Venice and the central open waters. Related to this, the concentration of surface active organic substances, primarily phytoplankton exudates and their degradation products, also considerably decreased in the upper water column during the period 2003-2010 compared to 1998-2003 (Gasparovic, 2012; Giani et al., 2012).
The organic matter produced sinks to the bottom and undergoes strong bacterial regeneration with high apparent oxygen utilization (AOU), that during stratification periods (spring–summer), determines a sensible reduction of the oxygen concentration and a strong nutrient increase in the bottom layers. This situation is particularly evident on the western side of the basin, the most affected by the river inputs.
The middle Adriatic shows a much reduced influence of the riverine inputs, as the river-diluted, nutrient-rich waters are confined to the coastal areas of the basin during most of the year. Also the phytoplankton biomass is sensibly lower than in the northern Adriatic but it seems to control significantly the nutrient distributions. The Pomo Depressions appear as sites of strong nutrient cycling processes associated to the resident dense water. Finally, the vertical distributions computed for the southern Adriatic show clearly that the MLIW is characterized by high levels of nitrate in all seasons with a well-defined seasonal cycle affecting also the nutrient concentrations in the deep water. In the surface layers the influence of the general cyclonic circulation on the horizontal distribution of the nutrients can be recognized.
28
A deficiency of phosphorus arise in both the surface and the deep water in the northern Adriatic and in the deep water of the rest of the basin. For the middle and southern Adriatic surface waters is clear a nitrogen deficiency particularly marked in the southern basin. In accordance with Zavatarelli et al. (1998) this result needs a more accurate analysis and also more information relative to the amount and distribution of phytoplankton biomass in the basin.
All of this information need to be better analyzed, harmonized and made available through a free repository (e.g. EMODnet) in order to be consulted or used by any stakeholder and, overall, for the implementation of descriptors and indicators specified by MSFD in the contest of different criteria identified for the GES. It is also necessary to perform further analyses, starting from both in situ observations (collected by Regional Agencies for the Environmental Protection) and from remote sensing ─ and where no data are available, from forecasting models ─ which keep into account adequate spatial-temporal scales. The following work represents attempts to integrate and harmonize different sources of data in order to provide information at different spatial and temporal scales in one of the sub-region identified by MSFD, as request by the Directive.
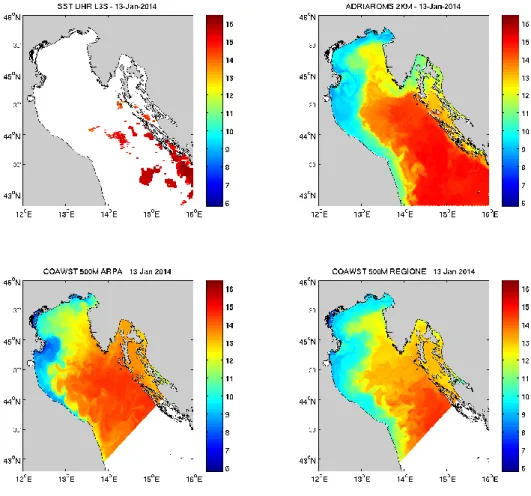
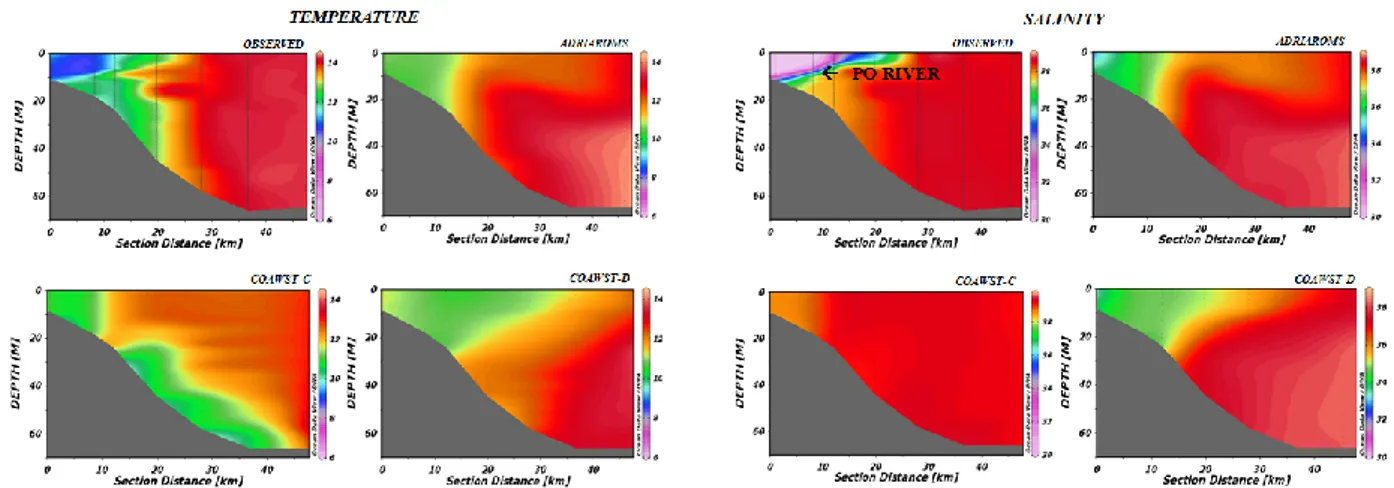
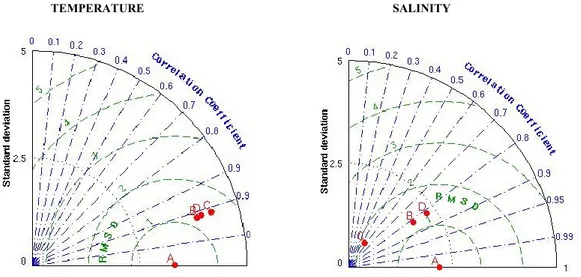
In the first chapter, the output of three operational forecasting systems will be analyzed in order to identify the one with the best performance for the Adriatic Sea. In the second chapter, temporal patterns of key physical and biological parameters at the basin scale has been analyzed on the basis of forecasting models output and validated remote sensing data in order to improve our comprehension on ecosystem dynamics and potential changes related to global climate changes. In the last chapter, the role of nutrient loads related to river outflows on spatial and temporal dynamics of physical-chemical and biochemical variables in a coastal area of the Adriatic Sea (Marche Region) has been investigated.
29
References
Alvera-Azcarate A., Barth A., Rixen M., Beckers J.M. (2005) Reconstruction of incomplete oceanographic data sets using empirical orthogonal functions: application to the Adriatic Sea surface temperature. Ocean Modelling 9: 325– 346.
Artegiani A., Azzolini R., Salusti E. (1989) On the dense water in the Adriatic Sea.
Oceanol. Acta, 12: 151–160.
Artegiani A, Bregant D, Paschini E, Pinardi N, Raicich F, Russo A. 1996. The Adriatic Sea general circulation. Part I: Air-Sea interactions and water mass structure. Journal of Physical Oceanography 27 (8) 1492-1514.
Artegiani A, Bregant D, Paschini E, Pinardi N, Raicich F, Russo A. 1996. The Adriatic Sea general circulation. Part II: Baroclinic circulation structure. Journal of Physical Oceanography 27(8) 1515-1532.
Atkins JP, Burdon D, Elliott M, Gregory AJ. 2011. Management of the Marine Environment:Integrating Ecosystem Services and Societal Benefits with the DPSIR Framework in a SystemsApproach. Marine Pollution Bulletin, 62(2): 215-226.
Barale V, Schiller C, Tacchi R, Merachal C. 2005. Trends and interactions of physical and bio-geo-chemical features in the Adriatic Sea as derived from satellite observations. Science of Total Environment 353 (2005) 68-81.
Beg-Paklar G., Isakov V., Korain D., Kourafalou V., Orlić M. (2001) A case study of bora-driven flow and density changes on the Adriatic Shelf (January 1987) Continental
Shelf Research 21 (16-17): 1751-1783.
Bergamasco A., Oguz T., Malanotte-Rizzoli P. (1999) Modeling dense water mass formation and winter circulation in the northern and central Adriatic Sea. Journal of
Marine Systems 20: 279–300.
Borja Á, Elliott M. 2013. Marine monitoring during an economic crisis: the cure is worse thanthe disease. Marine Pollution Bulletin 68: 1-3.
Budillon G., Grilli F., Ortona A., Russo A., Tramontin M. (2002) An assessment of surface dynamics observed offshore Ancona with HF Radar. P.S.Z.N.: Marine Ecology, 23, Supplement 1, 21-37.
Buljan M. (1957) Fluctuation of temperature in the open Adriatic. Acta Adriatica 8(7): 1–26.
30
Buljan M., Zore-Armanda M. (1976) Oceanographical properties of the Adriatic Sea. Oceanography and marine biology, Aberdeen University Press Ann. Rev. 14, 11–98.
Cavaleri L., Lavagnini A., Martorelli S. (1996) The wind climatology of the Adriatic Sea deduced from coastal stations, Nuovo Cimento, 19: 37–50.
Claussen U, Connor D, de Vrees L, Leppänen JM, Percelay J, Kapari M, Mihail O, Ejdung G, Rendell J. 2011. Common Understanding of (Initial) Assessment, Determination of Good Environmental Status (GES) and Establishment of Environmental Targets (Art. 8, 9 & 10 640 MSFD). WG GES EU MSFD.
Cozzi, S.M., Giani, M. (2011). River water and nutrient discharges in the northern Adriatic Sea: current importance and long term changes. Continental Shelf Research 31:1881-1893
Cushman-Roisin B., Gačić M., Poulain P.M., Artegiani A. (2001) Physical Oceanography of the Adriatic Sea: Past, Present and Future. Kluwer Academic Publishers, Dordrecht/Boston/London.
Degobbis D., Gilmartin M. (1990) Nitrogen, phosphorus, and biogenic silicon budgets for the northern Adriatic Sea. Oceanologica acta 13:31-45.
Degobbis D., Fonda Umani S., Franco P., Malej A., Precali R., Smodlaka N. (1995) Changes in the northern Adriatic ecosystem and the hypetrophic appearance of gelatinous aggregates. The Science of the Total Environment, 165, pp. 43-58.
Degobbis D., Precali R., Ivančić I., Smodlaka N., Kveder S. (1997) The importance and problems of nutrient flux measurements for study eutrophication of the northern Adriatic. Periodicum Biologorum 99, 161-167.
Degobbis D., Precali R., Ferrari C.R., Djaković T., Rinaldi A., Ivančić I., Gismondi M., Smodlaka, N. (2005) Changes in nutrient concentrations and ratios during mucilage events in the period 1999-2002. Science of the Total Environment 353, 103-114.
Djakovac T., Degobbis D., Supic N., Precali R. Marked reduction of eutrophication pressure in the northeastern Adriatic in the period 2000-2009. Estuarine, coastal and shelf science 115 (1012) 25-32.
deYoung B, Barange M, Beaugrand G, Harris R, Perry R.I., Scheffer M, Werner F. Regime shift in marine ecosystems: detection, prediction and management. Trends in Ecology and Evolution 23(7) pp. 402-409.
31
Elliott M, Borja A, McQuatters-Gollop A, Mazik K, Birchenough S, Andersen J.H., Painting S, Peck M. 2016. Force majeure: will climate change affect our ability to attain Good Environmental Status for marine biodiversity?. Marine Pollution Bullettin
Franco P. (1983a) L‟Adriatico settentrionale – caratteri oceanografici e problemi. Atti del 5° Congresso AIOL, 1-27.
Franco P. (1983b) Distribuzione verticale della produttività primaria e struttura della colonna d‟acqua nell‟Adriatico Settentrionale. Atti del 5° Congresso AIOL, 515- 524. Franco P, Michelato A. (1992) Northern Adriatic Sea: oceanography of the basin proper and of the western coastal zone. Sci Total Environ 35–62 [Suppl].
Franco P., Bregant D., Voltolina D. (1982) Oceanography of the middle Adriatic Sea. Data from the cruises December 1970, March–April 1971 and March 1972. Archo.
Oceanol. Limnol. 20 (suppl. 1): 1–72.
Giani M, Djakovac T, Degobbis D, Cozzi S, Solidoro C, Fonda Umani S. 2012. Recent changes in the marine ecosystems of the northern Adriatic Sea. Estuarine, Coastal and Shelf Science 115 (2012) 1-13.
Hoegh-Guldberg O., Bruno, J.F.. The impact of climate change on the world‟s marine ecosystems. Science328 (2010) pp.1523-1528.
Justić D. (1991) An analysis of factors affecting oxygen depletion in the northern Adriatic sea. Acta Adriatica 32 (2) 741-752.
Justić D., Legović T., Rottini-Sandrini L. (1987) Trends in oxygen content 1911-1984 and occurrence of benthic mortality in the northern Adriatic Sea Estuarine Coastal and Shelf Science 25(4):435-445.
Luisetti T, Turner RK, Jickells T, Andrews J, Elliott M, Schaafsma M, Beaumont N, Malcolm, Burdon D, Adams C, Watts W. 2014. Coastal Zone Ecosystem Services: From science tovalues and decision making; a case study. Science of the Total
Environment 493: 682–693.
Marchetti R. (1984) Quadro di sintesi delle indagini svolte dal 1978 sul problema dell'eutrofizzazione delle acque costiere dell'Emilia-Romagna. Atti Convegno: Eutrofizzazione dell'Adriatico: Ricerche e linee di intervento. 18-20 Maggio 1983: 37-75.
Meier HEM, Eilola K, Almroth E. 2011. Climate-related changes in marine ecosystemssimulated with a 3-dimensional coupled physical-biogeochemical model of the Baltic Sea.Climatic Research 48, 31-55