1 INTRODUCTION ... 7
2 ANITA-4M ACTIVATION CODE ... 9
2.1 Decay, Hazard and Clearance Data library (file “fl1”) ... 10
2.1.1 Decay data ... 10
2.1.2 Hazard data ... 11
2.1.3 Clearance level data ... 11
2.1.4 Nuclide and Material Clearance Indexes ... 11
2.2 Gamma Library (file “fl2”) ... 13
2.3 Neutron activation cross section data library (file “lib175”) ... 14
3 VALIDATION OF THE UPDATED DECAY LIBRARIES AGAINST DECAY HEAT MEASUREMENTS AT FUSION NEUTRON SOURCE FNS-JAERI ... 15
3.1 Experiment description ... 15
3.2 Calculation approach... 16
4 CALCULATION-EXPERIMENT COMPARISON: RESULTS AND DISCUSSION ... 18
5 RESULTS ANALYSIS ... 81
6 CONCLUSION ... 88
FIGURE LIST
Figure 1 – Anita-4M activation code block diagram ... 9
Figure 2 – Decay heat vs. cooling time of Aluminum sample irradiated for 5 min. ... 20
Figure 3 – Decay heat vs. cooling time of Aluminum sample irradiated for 7 hours. Comparison of calculation with experiment (C-E)/E %. ... 20
Figure 4 – Decay heat vs. cooling time of Boron Carbide sample irradiated for 5 min. Comparison of calculation with experiment (C-E)/E %. ... 22
Figure 5 – Decay heat vs. cooling time of Barium Carbonate sample irradiated for 5 min. Comparison of calculation with experiment (C-E)/E %. ... 24
Figure 6 – Decay heat vs. cooling time of Barium Carbonate sample irradiated for 7 hours. Comparison of calculation with experiment (C-E)/E %. ... 24
Figure 7 – Decay heat vs. cooling time of Bismuth sample irradiated for 5 min. ... 26
Figure 8 – Decay heat vs. cooling time of Bismuth sample irradiated for 7 hours. ... 26
Figure 9 – Decay heat vs. cooling time of Calcium Oxide sample irradiated for 5 min. Comparison of calculation with experiment (C-E)/E %. ... 28
Figure 10 – Decay heat vs. cooling time of Calcium Oxide sample irradiated for 7 hours. Comparison of calculation with experiment (C-E)/E %. ... 28
Figure 11 – Decay heat vs. cooling time of PTFE Teflon sample irradiated for 5 min. Comparison of calculation with experiment (C-E)/E %. ... 30
Figure 12 – Decay heat vs. cooling time of Cobalt sample irradiated for 5 min. ... 32
Figure 13 – Decay heat vs. cooling time of Cobalt sample irradiated for 7 hours. ... 32
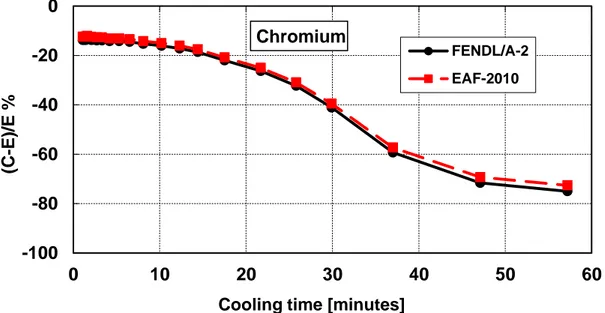
Figure 14 – Decay heat vs. cooling time of Chromium sample irradiated for 5 min. Comparison of calculation with experiment (C-E)/E %. ... 34
Figure 15 – Decay heat vs. cooling time of Chromium sample irradiated for 7 hours. Comparison of calculation with experiment (C-E)/E %. ... 34
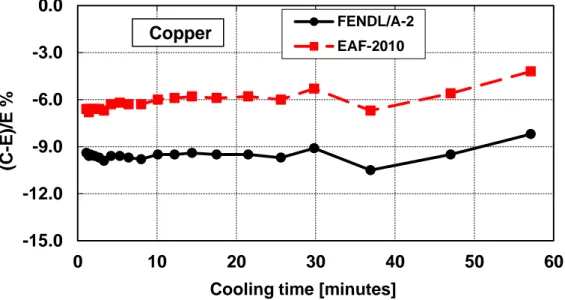
Figure 16 – Decay heat vs. cooling time of Copper sample irradiated for 5 min. ... 36
Figure 17 – Decay heat vs. cooling time of Copper sample irradiated for 7 hours. ... 36
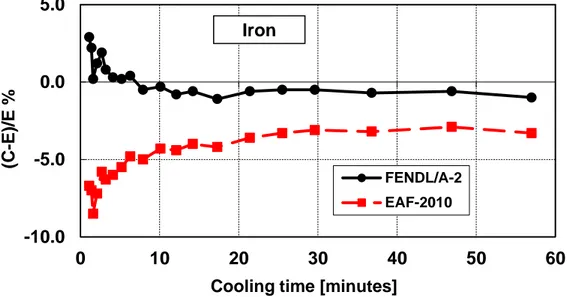
Figure 18 – Decay heat vs. cooling time of Iron sample irradiated for 5 min. ... 38
Figure 19 – Decay heat vs. cooling time of Iron sample irradiated for 7 hours. ... 38
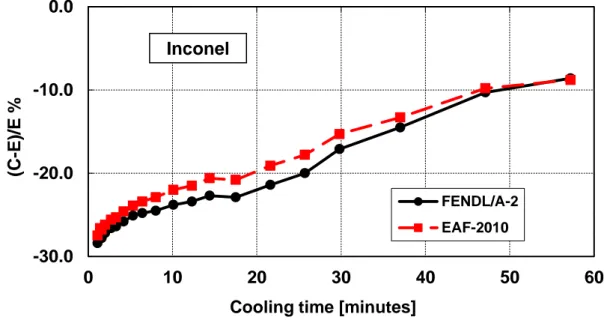
Figure 20 – Decay heat vs. cooling time of Inconel-600 sample irradiated for 5 min. Comparison of calculation with experiment (C-E)/E %. ... 40
Figure 21 – Decay heat vs. cooling time of Inconel-600 sample irradiated for 7 hours. Comparison of calculation with experiment (C-E)/E %. ... 40
Figure 22 – Decay heat vs. cooling time of Potassium Carbonate sample irradiated for 5 min. Comparison of calculation with experiment (C-E)/E %. ... 42 Figure 23 – Decay heat vs. cooling time of Potassium Carbonate sample irradiated for 7 hours.
Figure 25 – Decay heat vs. cooling time of Manganese sample irradiated for 7 hours. Comparison of
calculation with experiment (C-E)/E %. ... 44
Figure 26 – Decay heat vs. cooling time of Molybdenum sample irradiated for 5 min. Comparison of calculation with experiment (C-E)/E %. ... 46
Figure 27 – Decay heat vs. cooling time of Molybdenum sample irradiated for 7 hours. Comparison of calculation with experiment (C-E)/E %. ... 46
Figure 28 – Decay heat vs. cooling time of Sodium Carbonate sample irradiated for 5 min. Comparison of calculation with experiment (C-E)/E %. ... 48
Figure 29 – Decay heat vs. cooling time of Sodium Carbonate sample irradiated for 7 hours. Comparison of calculation with experiment (C-E)/E %. ... 48
Figure 30 – Decay heat vs. cooling time of Niobium sample irradiated for 5 min... 50
Figure 31 – Decay heat vs. cooling time of Niobium sample irradiated for 7 hours. Comparison of calculation with experiment (C-E)/E %. ... 50
Figure 32 – Decay heat vs. cooling time of Nickel sample irradiated for 5 min. ... 52
Figure 33 – Decay heat vs. cooling time of Nickel sample irradiated for 7 hours. ... 52
Figure 34 – Decay heat vs. cooling time of Nichrome sample irradiated for 5 min. ... 54
Figure 35 – Decay heat vs. cooling time of Nichrome sample irradiated for 7 hours. Comparison of calculation with experiment (C-E)/E %. ... 54
Figure 36 – Decay heat vs. cooling time of Lead sample irradiated for 5 min. ... 56
Figure 37 – Decay heat vs. cooling time of Lead sample irradiated for 7 hours. ... 56
Figure 38 – Decay heat vs. cooling time of Rhenium sample irradiated for 5 min. Comparison of calculation with experiment (C-E)/E %. ... 58
Figure 39 – Decay heat vs. cooling time of Rhenium sample irradiated for 7 hours. Comparison of calculation with experiment (C-E)/E %. ... 58
Figure 40 – Decay heat vs. cooling time of Sulfur sample irradiated for 5 min. ... 60
Figure 41 – Decay heat vs. cooling time of Sulfur sample irradiated for 7 hours. ... 60
Figure 42 – Decay heat vs. cooling time of Silicon Dioxide sample irradiated for 5 min. Comparison of calculation with experiment (C-E)/E %. ... 62
Figure 43 – Decay heat vs. cooling time of Tin Dioxide sample irradiated for 5 min. Comparison of calculation with experiment (C-E)/E %. ... 64
Figure 44 – Decay heat vs. cooling time of Tin Dioxide sample irradiated for 7 hours. Comparison of calculation with experiment (C-E)/E %. ... 64
Figure 45 – Decay heat vs. cooling time of Strontium Carbonate sample irradiated for 5 min. Comparison of calculation with experiment (C-E)/E %. ... 66 Figure 46 – Decay heat vs. cooling time of Strontium Carbonate sample irradiated for 7 hours.
Figure 47 – Decay heat vs. cooling time of Stainless Steel SS304 sample irradiated for 5 min. Comparison of calculation with experiment (C-E)/E %. ... 68 Figure 48 – Decay heat vs. cooling time of Stainless Steel SS304 sample irradiated for 7 hours.
Comparison of calculation with experiment (C-E)/E %. ... 68 Figure 49 – Decay heat vs. cooling time of Stainless Steel AISI 316 sample irradiated for 5 min.
Comparison of calculation with experiment (C-E)/E %. ... 70 Figure 50 – Decay heat vs. cooling time of Stainless Steel AISI 316 sample irradiated for 7 hours.
Comparison of calculation with experiment (C-E)/E %. ... 70 Figure 51 – Decay heat vs. cooling time of Tantalum sample irradiated for 5 min. Comparison of
calculation with experiment (C-E)/E %. ... 72 Figure 52 – Decay heat vs. cooling time of Tantalum sample irradiated for 7 hours. Comparison of
calculation with experiment (C-E)/E %. ... 72 Figure 53 – Decay heat vs. cooling time of Titanium sample irradiated for 5 min. Comparison of
calculation with experiment (C-E)/E %. ... 74 Figure 54 – Decay heat vs. cooling time of Titanium sample irradiated for 7 hours. Comparison of
calculation with experiment (C-E)/E %. ... 74 Figure 55 – Decay heat vs. cooling time of Vanadium sample irradiated for 5 min. ... 76 Figure 56 – Decay heat vs. cooling time of Vanadium sample irradiated for 7 hours. Comparison of
calculation with experiment (C-E)/E %. ... 76 Figure 57 – Decay heat vs. cooling time of Yttrium Oxide sample irradiated for 5 min. Comparison
of calculation with experiment (C-E)/E %. ... 78 Figure 58 – Decay heat vs. cooling time of Yttrium Oxide sample irradiated for 7 hours.
Comparison of calculation with experiment (C-E)/E %. ... 78 Figure 59 – Decay heat vs. cooling time of Zirconium sample irradiated for 5 min. Comparison of
calculation with experiment (C-E)/E %. ... 80 Figure 60 – Decay heat vs. cooling time of Zirconium sample irradiated for 7 hours. Comparison of
Table 1 – ORNL-SCALE 18- energy group structure ... 13
Table 2 – Aluminum decay heat calculation-experiment comparison ... 19
Table 3 – Boron Carbide decay heat calculation-experiment comparison ... 21
Table 4 – Barium Carbonate decay heat calculation-experiment comparison ... 23
Table 5 – Bismuth decay heat calculation-experiment comparison ... 25
Table 6 – Calcium Oxide decay heat calculation-experiment comparison ... 27
Table 7 – PTFE Teflon decay heat calculation-experiment comparison ... 29
Table 8 – Cobalt decay heat calculation-experiment comparison ... 31
Table 9 – Chromium decay heat calculation-experiment comparison ... 33
Table 10 – Copper decay heat calculation-experiment comparison ... 35
Table 11 – Iron decay heat calculation-experiment comparison ... 37
Table 12 – Inconel-600 decay heat calculation-experiment comparison ... 39
Table 13 – Potassium Carbonate decay heat calculation-experiment comparison ... 41
Table 14 – Manganese decay heat calculation-experiment comparison ... 43
Table 15 – Molybdenum decay heat calculation-experiment comparison ... 45
Table 16 – Sodium Carbonate decay heat calculation-experiment comparison ... 47
Table 17 – Niobium decay heat calculation-experiment comparison ... 49
Table 18 – Nickel decay heat calculation-experiment comparison ... 51
Table 19 – Nichrome decay heat calculation-experiment comparison ... 53
Table 20 – Lead decay heat calculation-experiment comparison ... 55
Table 21 – Rhenium decay heat calculation-experiment comparison ... 57
Table 22 – Sulfur decay heat calculation-experiment comparison ... 59
Table 23 – Silicon Dioxide decay heat calculation-experiment comparison ... 61
Table 24 – Tin Dioxide decay heat calculation-experiment comparison ... 63
Table 25 – Strontium Carbonate decay heat calculation-experiment comparison ... 65
Table 26 – Stainless Steel SS304 decay heat calculation-experiment comparison ... 67
Table 27 – Stainless Steel AISI 316 decay heat calculation-experiment comparison ... 69
Table 28 – Tantalum decay heat calculation-experiment comparison ... 71
Table 29 – Titanium decay heat calculation-experiment comparison ... 73
Table 30 – Vanadium decay heat calculation-experiment comparison ... 75
Validation of the updated decay data libraries of the ANITA-2000
activation code package on experimental data produced by FNS-JAERI
Manuela Frisoni September 2015
1 INTRODUCTION
ANITA-2000 is a code package for the activation characterization of materials exposed to neutron irradiation developed by ENEA and freely distributed at OECD-NEADB [1] and ORNL-RSICC [2]. It has been widely used, improved and validated in the past by ENEA [3] [4] [5] [6] [7] [8] [9] [10] [11]. ANITA-2000 has been also utilized in MANCINTAP, a computational “4D rigorous-2-step” tool, developed at Ansaldo Nucleare, that automatically combines neutron transport calculations (via MCNP5) with activation calculations (via ANITA-2000) in order to evaluate decay gamma dose rates due to activated materials [12][13].
The main component of the ANITA-2000 package is the activation code ANITA-4M that computes the radioactive inventory of a material exposed to neutron irradiation, continuous or stepwise. It traces back to the ANITA code (Analysis of Neutron Induced Transmutation and Activation) [14]. The ANITA-4M code provides activity, atomic density, decay heat, biological hazard, clearance index and decay gamma-ray sources versus cooling time. Results are given as for each nuclide as for the material.
The ANITA-2000 code package is provided with a complete data base allowing to perform calculations for all the elements with the atomic number up to 94. The libraries contained in the code package are:
1) Neutron activation cross section data libraries
2) Decay, Hazard and Clearance data library (“fl1” file) 3) Gamma library (“fl2” file)
Two neutron activation cross section data libraries are contained in the ANITA-2000 code package based on the European Activation File EAF-99 [15] and on the Fusion Evaluated Nuclear Activation Data Library FENDL/A-2.0 [16], respectively. The data contained in the libraries “fl1” and “fl2” are based on the Fusion Evaluated Nuclear Decay Data Library FENDL/D-2.0 [17].
In this report the validation of the new data libraries is presented, following the work already made in the past [4][10], through the comparison of the ANITA-4M results against decay heat measurements, performed for ITER-relevant materials in the frame of an international benchmark exercise launched in the late 1990s, using the Fusion Neutronics Source (FNS) at the Japan Atomic Energy Research Institute (JAERI), (actually JAEA), Tokai, Japan [21][22].
2 ANITA-4M ACTIVATION CODE
The package ANITA-2000 includes the activation code ANITA-4M that computes the radioactive inventory of a material exposed to neutron irradiation, continuous or stepwise. The ANITA-4M code provides activity, atomic density, decay heat, biological hazard, clearance index and decay gamma-ray source spectra at shutdown and at different cooling times. It treats all the elements with the atomic number up to 94.
The ANITA-4M activation code requires the following data libraries:
Decay, Hazard and Clearance data library (file “fl1”)
Gamma library (file “fl2”)
Neutron activation cross section data library (file “lib175”)
The schematic block diagram of the data/libraries required by the ANITA-4M code is shown in Figure 1.
Figure 1 – Anita-4M activation code block diagram
ANITA-4M
Activation code
INPUT
175-Group neutron fluxes Irradiation and cooling scenario Material characterization
OUTPUT
Radioactive Inventories:
activity, atomic density, decay heat, biological hazard, clearance index, decay gamma sources (18 groups) at shutdown and for various cooling times.
Results are given as for each nuclide as for the material
Gamma library file fl2
Neutron activation cross section data
library file lib175 Decay, Hazard and Clearance data library file fl1
This library contains the information describing the decay properties of unstable nuclides useful for the calculations performed by ANITA-4M.
For each nuclide, the decay data, as the decay mode, the decay constant (s-1), the total energy (MeV) released in the decay and the energy (MeV) released in the form of gamma or X-rays are provided. Different competitive decay modes are taken into account when contemporary.
The file contains also the hazard data (ALI) for each radionuclide describing its potential biological impact on human beings. The ALI quantities are defined as the Annual Limit of Intake (Bq) by ingestion or inhalation for the public or workers.
The library contains also the clearance level for each radionuclide.
The fl1 file has been completely updated and actually contains data for 3433 nuclides. The description of the data contained in the file and their sources are described in the following.
2.1.1 Decay data
The decay data have been taken from the JEFF-3.1.1 Radioactive Decay Data library [18]. The standard library JEFF-3.1.1 is in ENDF-6 [23] format. The radioactive decay data are given in the section identified by MF=8, MT=457 (in ENDF-6 standard format notation). This section is restricted to single nuclides in their ground state or an isomeric state (a “long lived” excited state of the nucleus). The main purpose of MT=457 is to describe the energy spectra resulting from radioactive decay and give average parameters useful for applications such as decay heat and waste disposal studies, shielding, etc. For each isotope the following decay data are given: nuclide identification, half-life, number of decay modes, fractions of decay in each decay mode (branching ratio), energy released by the decay, gamma-ray intensity and energy spectrum in each decay mode. The standard library contains data for 3853 nuclei, ranging from the neutron (0-nn-1) to roentgenium 272 (111-Rg-272).
In the fl1 file used by ANITA-4M code the following basic decay data are included for each unstable nuclide:
- nuclide identification - decay mode
- decay constant
- total energy released in the decay (MeV) used to calculate decay heat
- energy released in the form of gamma or X-rays (MeV)
2.1.2 Hazard data
The ALI quantities were obtained from the “eaf_haz_20100” file contained in the EASY-2010 code package [25]. In the fl1 file used by the ANITA- 4M code, the ALI values by ingestion for the public are given. A conversion factor of 0.001 (Sv/y) has been adopted to convert the dose coefficients from Ref. 25 to the ALI quantities. The ALI quantity is provided only for the 2006 nuclides contained in the “eaf_haz_20100” file.
2.1.3 Clearance level data
The fl1 file provides also for each radionuclide the clearance level CL (Bq/g). This value allows
to establish if a radioactive material can be potentially moved out of the originating facility and recycled.
The safe handling of radioactive waste is recognized as crucial to ensure protection of human health and the environment. IAEA publish regulations on these issues and Ref. [26] gives information on suggested clearance level values for a set of important radionuclides.
The clearance level data contained in the new fl1 file have been produced by including the information contained in [26].
The clearance levels for the 242 nuclides up to Pu-244 contained in Table 2 of Ref. [26] were included in the file fl1. The clearance level CL=10 has been attributed to 40K as suggested in Table 1
of Ref. [26].
Following the suggestion of Table 1 of Ref. [26], moreover, the clearance level CL=1 has been
attributed to radionuclides of natural origin. The list of the “Radioactive Nuclides in Nature” has been taken from Ref. [24].
For any other nuclide the clearance level was calculated by using the following Eq. (6) taken from Ref. [27]:
C
L=min
1/(E
+ 0.1
xE
) ; ALI
inhaled/10
3; ALI
ingested/10
5
(6)The values of E and E in Eq. (6) have been taken from the JEFF-3.1.1 library [18].
The ALI quantities in Eq. (6) have been obtained from the “eaf_haz_20100” file of EASY-2010 [25]. The conversion factor of 0.020 (Sv/y) has been adopted to convert the dose coefficients from Ref. [25] to the ALI quantities.
2.1.4 Nuclide and Material Clearance Indexes
The Isotope Clearance Index (ICI) of a single nuclide is calculated in ANITA-4M as:
C
iIndex Clearance
In Eq. (7) activities and clearance levels have units of Bq g-1.
When a material contains several nuclides, the equation given below, and suggested in [27], is used to evaluate in ANITA-4M the Material Clearance Index (MCI) :
1
n i
i Li
Material Clearance Index
C
C
(8)2.2 Gamma Library (file “fl2”)
This data base contains the gamma ray spectra emitted by the radioactive nuclei in the ORNL-SCALE 18- energy group structure given in Table 1.
Group Energy Group Energy
1 10-100 KeV 10 1.66-2.0 MeV 2 .1-.2 MeV 11 2.0-2.5 MeV 3 .2-.4 MeV 12 2.5-3.0 MeV 4 .4-.6 MeV 13 3.0-4.0 MeV 5 .6-.8 MeV 14 4.0-5.0 MeV 6 .8-1. MeV 15 5.0-6.5 MeV 7 1.0-1.22 MeV 16 6.5-8.0 MeV 8 1.22-1.44 MeV 17 8.0-10.0 MeV 9 1.44-1.66 MeV 18 10.-20. MeV
Table 1 – ORNL-SCALE 18- energy group structure
The data contained in the library are based on the JEFF-3.1.1 evaluated decay data file (gamma radiation spectra). In the gamma library of ANITA-4M in each group the contribution in MeV of the total energy emitted is given. The gamma spectra include both the -rays spectra and the x-rays and annihilation radiation spectra (photons not arising as transitions between nuclear states) (STYP=0 and STYP=9 in the ENDF-6 standard format). In the library, four cards are given for each nuclide: the first one contains the identification number IDNUC (Z*10000+A*10+M), the alphanumeric symbol and the total energy Ecalculated as the sum over the 18-group values. Then
three cards follow for the 18-group values.
The data given in the gamma library are used in ANITA-4M to compute the intensity and the energy distribution of the gamma-rays emitted by the irradiated composition. This gamma-ray source (Photons/cm3 s) in the ORNL-SCALE 18- energy group structure (see Table 1) may be given as input to a radiation transport code to compute the space and energy distribution of the decay gamma-rays and the relative dose equivalent rate.
As shown in Figure 1 the ANITA-4M code requires a neutron activation cross section data library, defined as “lib175” in binary format, in order to perform the activation calculations.
In the ANITA-2000 code package in free distribution at NEADB and RSICC two different libraries are included:
The activation library “eaf99_lib”, based on the EAF-99 neutron activation cross section data library [15]. It contains 12,039 activation reactions, up to Pu-247, in the 175- group VITAMIN-J neutron energy structure.
The activation library “fendl2a_lib”, based on the Fusion Evaluated Nuclear Data File FENDL/A-2.0 [16]. It contains 12,392 activation reactions, up to Pu-247, in the 175- group VITAMIN-J neutron energy structure.
The format of these multi-group libraries (VITAMIN-J 175 neutron groups structure [28] ) is the LIBOUT format of the code FOUR ACES (ENEA Bologna) with two additional comment lines for each reaction. For the reaction numbers the ENDF-6 reaction number MT multiplied by 10 has been adopted, with the convention that for the excitation of each isomeric state the reaction number is increased by one. The material numbers consist of Z,A and an identifier, LIS, to indicate ground or isomeric target (MAT=Z*10000+A*10+LIS). The order of the cross sections is in accordance with increasing Z,A,LIS and MT. The cross section values of each reaction MT are in accordance with decreasing energy of the 175 VITAMIN-J group structure.
These libraries are given in card-image format. The MODBIN module, provided in the package, makes the conversion to lib175 in binary format as required by ANITA-4M code
The updating of the fl1 file, that now contains data for more nuclides than the original one, allows ANITA-4M code to perform activation calculations by using the neutron-induced cross section library EAF-2010 [19] contained in the package EASY-2010 [20], named “eaf-ngxs_175_fus_20100”. This cross section library contains 66,256 excitation functions involving 816 different targets from 1H to 257Fm, atomic numbers 1 to 100, in the energy range 10-5 eV to 20 MeV. It was obtained at Culham by processing the point-wise file with a micro-flux weighting spectrum combining a thermal Maxwellian at low energies, a 1/E function at intermediate energies, and a velocity exponential fusion peak spectrum with a peak at 14.07 MeV, in the 175-group VITAMIN-J 175 neutron energy structure.
The card image library “eaf2010_lib” for ANITA-4M has been derived from the file “eaf-ngxs_175_fus_20100” of EASY-2010 package. It contains 63,512 activation reactions, up to Pu-247, in the 175- group VITAMIN-J neutron energy structure. The MODBIN module must be used
3 VALIDATION OF THE UPDATED DECAY LIBRARIES AGAINST
DECAY HEAT MEASUREMENTS AT FUSION NEUTRON SOURCE
FNS-JAERI
The aim of this assessment is the validation of the ANITA-4M activation code using the updated libraries based on the JEFF-3.1.1 Radioactive Decay Data Library and the EAF-2010 neutron activation cross section library.
The ANITA-4M calculations are compared with the experimental decay heat results related to the material samples irradiated in the 14 MeV neutron flux of the Fusion Neutronics Source (FNS) of the Japan Atomic Energy Research Institute (JAERI), (actually JAEA), Tokai, Japan. These measurements were performed for ITER-relevant materials in the frame of an international benchmark exercise launched in the late 1990s in order to validate nuclear data and codes used for activation calculations. Several codes and data libraries available at that time were involved in this international benchmark (see [22]).
3.1 Experiment description
The Fusion Neutronics Source (FNS) at Tokai was used to irradiate in a 14 MeV neutron flux samples of various materials. The decay heat in the samples was measured at a series of times after the irradiation (cooling times). The experiments included measurements of decay heat for 32 different materials. However the benchmark comparisons have concentrated on those materials relevant to ITER safety studies, namely stainless steel 316, copper and nickel-chromium alloy. Furthermore most attention has been given to the time scale of interest in loss-of-cooling accident scenarios, up to three days decay following the longer irradiation in FNS. The overall experimental uncertainty totals generally between 6% - 10%. A detailed description of the experiments is given in [21].
Irradiations were performed in two series, with durations of either 5 min or 7 hours. After the irradiation, each sample was transferred to a Whole Energy Absorption Spectrometer (WEAS) for measurement of decay energy , up to about one hour, for the 5 min irradiation, and 100 days, for the 7 hour irradiation. The experiments included measurements of decay heat for the following 32 materials:
Al, B4C, BaCO3, Bi, CaO3, CF2, Co, Cr, Cu, Fe, Inconel, K2CO3, Mn, Mo, Na2CO3, Nb, Ni,
NiCr, Pb, Re, S, SiO2, SnO2, SrCO3, SS304, SS316, Ta, Ti, V, W, Y2O3, Zr.
The sample material wt. % compositions provided by the experimental group and used for the activation calculations are:
• Calcium Oxide (CaO) : O 28.53, Ca 71.47; • PTFE, Teflon (CF2): C 24.02, F 75.98; • Cobalt: Co 100; • Chromium: Cr 100; • Copper: Cu 100; • Iron: Fe 100; • Inconel-600 : Cr 15,97, Mn 0.39, Fe 7.82, Ni 75.82; • Potassium carbonate (K2CO3): C 8.69, O 34.73, K 56.58 ; • Manganese: Mn 100; • Molybdenum : Mo 100;
• Sodium carbonate (Na2CO3) : C 11.33, O 45.29, Na 43.38; • Niobium: Nb 100; • Nicrome (Nicr): Cr 19.64, Fe 0.06, Ni 80.30; • Nickel : Ni 100; • Lead : Pb 199; • Rhenium. Re 100; • Sulfur : S 100;
• Silicon Dioxide (SiO2): O 53.26, Si 46.74;
• Tin Dioxide (SnO2): O 21.23, Sn 78.77;
• Strontium Carbonate (SrCO3): C 8.14, O 32.51, Sr 59.35;
• Stainless Steel SS304: Si 0.55, Cr 18.02, Mn 1.44, Fe 71.17, Ni 8.82;
• Stainless Steel AISI 316: Si 0.96, Cr 18.28, Mn 1.44, Fe 63.72, Ni 13.49, Mo 2.11; • Tantalum : Ta 100;
• Titanium : Ti 100; • Vanadium: V 100;
• Yttrium Oxide (Y2O3): O 21.26, Y 78.74;
• Zirconium: Zr 100.
No material impurities content information was provided by the experimental team.
3.2 Calculation approach
Neutron energy spectrum, in the 175-group VITAMIN-J energy structure, and source neutron intensity were provided by the experimental group.
and the decay data library fl1 based on FENDL/D-2 data, 2) using the new decay data library fl1 based on JEFF-3.1.1 data and the activation library “eaf2010_lib” based on the “eaf-ngxs_175_fus_20100” file of EASY-2010 package.
The decay heat (E) (µW/g) of the material samples irradiated for 5-minutes was measured (at 20 discrete points in times) up to about one hour after the end of the irradiation at the FNS.
The decay heat (E) (µW/g) of the material samples irradiated for 7-hours was measured (at 7 discrete points in times) up to about one hundred days after the end of the irradiation at the FNS.
The measured decay data for all the material samples are included into Table 2 to Table 32. The same tables list also the calculated values, obtained by ANITA-4M code using the FENDL/A-2 with FENDL/D-2 and EAF-2010 with JEFF-3.1.1 libraries, respectively.
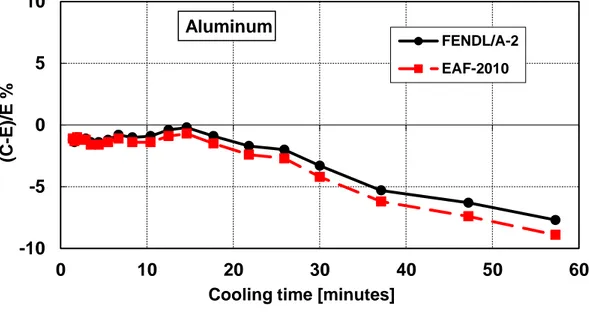
To estimate the discrepancy between the calculated and the experimental decay heat values, the percentage ratios (C-E)/E % have been evaluated. They are plotted in Figure 2 to Figure 60.
In these plots, the points connected by black solid lines correspond to the ANITA-4M calculations using the FENDL/A-2 neutron activation library and the decay data library based on FENDL/D-2 data. The points connected by red dotted lines refer to calculations performed using the EAF-2010 neutron activation library and the updated decay data library based on JEFF-3.1.1 data.
N.B. For sake of simplicity the two ANITA calculations performed by using FENDL/A-2+FENDL/D-2 and EAF-2010+JEFF-3.1.1 are referred to as FENDL/A-2 and EAF-2010, respectively.
Aluminum (Al)
Material composition : Al 100EXP-5m CALC-5m (C-E)/E CALC-5m (C-E)/E
FENDL/A-2 % EAF-2010 %
FENDL/D-2 JEFF-3.1.1
Cooling Time microW/g microW/g microW/g
1.4 (m) 1.20E+00 1.19E+00 -1.2 1.19E+00 -1.1
1.6 (m) 1.18E+00 1.16E+00 -1.4 1.17E+00 -1.3
1.9 (m) 1.15E+00 1.14E+00 -1.0 1.14E+00 -1.0
2.3 (m) 1.12E+00 1.10E+00 -1.2 1.10E+00 -1.2
2.9 (m) 1.07E+00 1.05E+00 -1.1 1.05E+00 -1.2
3.5 (m) 1.02E+00 1.01E+00 -1.4 1.01E+00 -1.6
4.4 (m) 9.60E-01 9.47E-01 -1.4 9.45E-01 -1.6
5.5 (m) 8.85E-01 8.75E-01 -1.2 8.73E-01 -1.4
6.7 (m) 8.16E-01 8.10E-01 -0.8 8.07E-01 -1.1
8.3 (m) 7.32E-01 7.24E-01 -1.0 7.22E-01 -1.4
10.4 (m) 6.35E-01 6.29E-01 -0.9 6.26E-01 -1.4
12.5 (m) 5.51E-01 5.48E-01 -0.4 5.45E-01 -0.9
14.6 (m) 4.80E-01 4.79E-01 -0.2 4.77E-01 -0.7
17.7 (m) 4.00E-01 3.96E-01 -0.9 3.94E-01 -1.5
21.8 (m) 3.18E-01 3.12E-01 -1.7 3.10E-01 -2.4
25.9 (m) 2.54E-01 2.49E-01 -2.0 2.47E-01 -2.7
30.0 (m) 2.10E-01 2.03E-01 -3.3 2.01E-01 -4.2
37.1 (m) 1.57E-01 1.49E-01 -5.3 1.47E-01 -6.2
47.2 (m) 1.15E-01 1.07E-01 -6.3 1.06E-01 -7.4
57.3 (m) 9.43E-02 8.70E-02 -7.7 8.59E-02 -8.9
EXP-7h CALC-7h (C-E)/E CALC-7h (C-E)/E
FENDL/A-2 % EAF-2010 %
FENDL/D-2 JEFF-3.1.1
Cooling Time microW/g microW/g microW/g
15.7 (h) 2.31E+00 2.76E+00 19.5 2.74E+00 18.6
1.3 (d) 1.46E+00 1.30E+00 -10.8 1.29E+00 -11.6
2.9 (d) 2.25E-01 2.25E-01 0.0 2.22E-01 -1.2
6.9 (d) 2.69E-03 2.60E-03 -3.2 2.55E-03 -5.0
12.9 (d) 5.78E-05 3.50E-06 -93.9 3.40E-06 -94.1
23.9 (d) 4.40E-05 3.02E-08 -99.9 2.96E-08 -99.9
49.7 (d) 6.28E-05 3.01E-08 -100.0 2.95E-08 -100.0
Table 2 – Aluminum decay heat calculation-experiment comparison (5 minutes and 7 hours irradiation)
Figure 2 – Decay heat vs. cooling time of Aluminum sample irradiated for 5 min. Comparison of calculation with experiment (C-E)/E %.
Figure 3 – Decay heat vs. cooling time of Aluminum sample irradiated for 7 hours. Comparison of calculation with experiment (C-E)/E %.
-10 -5 0 5 10 0 10 20 30 40 50 60 (C -E )/E %
Cooling time [minutes]
FENDL/A-2 EAF-2010 Aluminum -125 -100 -75 -50 -25 0 25 50 0 10 20 30 40 50 60 (C -E )/E %
Cooling time [days]
FENDL/A-2 EAF-2010
Boron Carbide (B
4C)
Material composition : B 78.26, C 21.74EXP-5m CALC-5m (C-E)/E CALC-5m (C-E)/E
FENDL/A-2 % EAF2010 %
FENDL/D-2 JEFF-3.1.1
CoolingTime µW/g µW/g µW/g
1.2 (m) 4.98E-02 5.09E-02 2.2 5.09E-02 2.1
1.5 (m) 2.72E-02 2.28E-02 -16.1 2.28E-02 -16.2
1.8 (m) 1.63E-02 1.02E-02 -37.3 1.02E-02 -37.4
2.2 (m) 1.06E-02 2.64E-03 -75.2 2.63E-03 -75.2
2.8 (m) 8.20E-03 4.11E-04 -95.0 4.11E-04 -95.0
3.4 (m) 7.06E-03 6.43E-05 -99.1 6.42E-05 -99.1
4.3 (m) 6.20E-03 4.50E-06 -99.9 4.50E-06 -99.9
5.4 (m) 5.29E-03 1.63E-07 -100.0 1.63E-07 -100.0
6.6 (m) 4.53E-03 1.23E-08 -100.0 1.30E-08 -100.0
8.2 (m) 3.97E-03 6.90E-09 -100.0 7.61E-09 -100.0
10.3 (m) 3.32E-03 6.90E-09 -100.0 7.61E-09 -100.0
12.4 (m) 2.88E-03 6.90E-09 -100.0 7.61E-09 -100.0
14.6 (m) 2.61E-03 6.90E-09 -100.0 7.61E-09 -100.0
17.7 (m) 2.23E-03 6.90E-09 -100.0 7.61E-09 -100.0
21.8 (m) 1.86E-03 6.90E-09 -100.0 7.61E-09 -100.0
25.9 (m) 1.56E-03 6.90E-09 -100.0 7.61E-09 -100.0
30.0 (m) 1.28E-03 6.90E-09 -100.0 7.61E-09 -100.0
37.1 (m) 9.61E-04 6.90E-09 -100.0 7.61E-09 -100.0
47.2 (m) 5.91E-04 6.90E-09 -100.0 7.61E-09 -100.0
57.2 (m) 2.43E-04 6.90E-09 -100.0 7.61E-09 -100.0
Table 3 – Boron Carbide decay heat calculation-experiment comparison (5 minutes irradiation)
Figure 4 – Decay heat vs. cooling time of Boron Carbide sample irradiated for 5 min. Comparison of calculation with experiment (C-E)/E %.
-125 -100 -75 -50 -25 0 10 20 30 40 50 60 (C -E )/E %
Cooling time [minutes]
FENDL/A-2 EAF-2010
Barium Carbonate (BaCO
3)
Material composition : C 6.09, O 24.32, Ba 69.59EXP-5m CALC-5m (C-E)/E CALC-5m (C-E)/E
FENDL/A-2 % EAF-2010 %
FENDL/D-2 JEFF-3.1.1
Cooling Time µW/g µW/g µW/g
1.1 (m) 1.31E+00 1.35E+00 2.8 1.20E+00 -8.6
1.4 (m) 1.22E+00 1.25E+00 2.3 1.11E+00 -9.2
1.6 (m) 1.14E+00 1.16E+00 1.7 1.03E+00 -9.7
2.1 (m) 1.01E+00 1.02E+00 1.0 9.10E-01 -10.3
2.7 (m) 8.76E-01 8.79E-01 0.3 7.81E-01 -10.9
3.3 (m) 7.48E-01 7.44E-01 -0.6 6.61E-01 -11.6
4.2 (m) 5.92E-01 5.83E-01 -1.4 5.19E-01 -12.3
5.3 (m) 4.44E-01 4.32E-01 -2.9 3.84E-01 -13.5
6.4 (m) 3.35E-01 3.20E-01 -4.6 2.85E-01 -15.0
8.1 (m) 2.28E-01 2.06E-01 -9.5 1.84E-01 -19.1
10.2 (m) 1.40E-01 1.17E-01 -16.5 1.05E-01 -24.9
12.2 (m) 9.09E-02 6.79E-02 -25.3 6.16E-02 -32.3
14.4 (m) 6.25E-02 3.92E-02 -37.3 3.61E-02 -42.2
17.5 (m) 4.19E-02 1.82E-02 -56.7 1.74E-02 -58.5
21.6 (m) 3.10E-02 7.55E-03 -75.7 7.89E-03 -74.6
25.7 (m) 2.72E-02 3.98E-03 -85.4 4.65E-03 -82.9
29.9 (m) 2.49E-02 2.69E-03 -89.2 3.41E-03 -86.3
36.9 (m) 2.36E-02 1.97E-03 -91.6 2.65E-03 -88.8
47.0 (m) 2.15E-02 1.61E-03 -92.5 2.17E-03 -89.9
57.2 (m) 1.92E-02 1.38E-03 -92.8 1.84E-03 -90.4
EXP-7h CALC-7h (C-E)/E CALC-7h (C-E)/E
FENDL/A-2 % EAF-2010 %
FENDL/D-2 JEFF-3.1.1
Cooling Time µW/g µW/g µW/g
0.7 (d) 1.57E-02 1.67E-02 6.6 1.68E-02 7.1
1.7 (d) 8.33E-03 9.12E-03 9.4 9.15E-03 9.8
3.9 (d) 2.58E-03 2.85E-03 10.6 2.85E-03 10.5
6.7 (d) 6.90E-04 6.95E-04 0.7 6.84E-04 -0.9
12.2 (d) 1.18E-04 1.22E-04 3.4 1.11E-04 -5.8
24.2 (d) 3.60E-05 4.81E-05 33.5 4.21E-05 16.9
Table 4 – Barium Carbonate decay heat calculation-experiment comparison (5 minutes and 7 hours irradiation)
Figure 5 – Decay heat vs. cooling time of Barium Carbonate sample irradiated for 5 min. Comparison of calculation with experiment (C-E)/E %.
Figure 6 – Decay heat vs. cooling time of Barium Carbonate sample irradiated for 7 hours. Comparison of calculation with experiment (C-E)/E %.
-100 -75 -50 -25 0 0 10 20 30 40 50 60 (C -E )/E %
Cooling time [minutes]
FENDL/A-2 EAF-2010 BaCO3 -10 0 10 20 30 40 0 5 10 15 20 25 30 (C -E )/E %
Cooling time [days]
FENDL/A-2 EAF-2010
Bismuth (Bi)
Material composition : Bi 100EXP-5m CALC-5m (C-E)/E CALC-5m (C-E)/E
FENDL/A-2 % EAF-2010 %
FENDL/D-2 JEFF-3.1.1
Cooling Time µW/g µW/g µW/g
1.1 (m) 8.15E-04 8.25E-04 1.3 1.15E-03 40.9
1.4 (m) 7.23E-04 7.90E-04 9.3 1.10E-03 52.1
1.6 (m) 6.38E-04 7.57E-04 18.6 1.05E-03 65.2
2.1 (m) 6.92E-04 7.03E-04 1.6 9.80E-04 41.6
2.7 (m) 7.50E-04 6.37E-04 -15.1 8.88E-04 18.4
3.3 (m) 6.69E-04 5.76E-04 -13.9 8.04E-04 20.2
4.2 (m) 5.54E-04 5.00E-04 -9.7 6.99E-04 26.2
5.3 (m) 4.04E-04 4.18E-04 3.4 5.85E-04 44.9
6.4 (m) 2.56E-04 3.52E-04 37.3 4.93E-04 92.7
8.0 (m) 2.48E-04 2.71E-04 9.4 3.82E-04 54.2
10.1 (m) 1.71E-04 1.95E-04 13.7 2.76E-04 61.3
12.2 (m) 9.24E-05 1.42E-04 53.5 2.03E-04 119.4
14.3 (m) 1.06E-04 1.04E-04 -2.7 1.49E-04 40.4
17.4 (m) 4.34E-05 6.67E-05 53.9 9.83E-05 126.7
21.5 (m) 3.00E-05 3.93E-05 31.3 6.00E-05 100.4
25.7 (m) 2.40E-05 2.53E-05 5.7 4.04E-05 68.7
29.8 (m) 3.10E-05 1.82E-05 -41.4 3.03E-05 -2.1
36.9 (m) 3.50E-05 1.29E-05 -63.1 2.29E-05 -34.7
47.0 (m) 4.90E-05 1.08E-05 -78.0 1.97E-05 -59.8
57.0 (m) 4.27E-05 1.01E-05 -76.3 1.86E-05 -56.5
EXP-7h CALC-7h (C-E)/E CALC-7h (C-E)/E
FENDL/A-2 % EAF-2010 %
FENDL/D-2 JEFF-3.1.1
Cooling Time µW/g µW/g µW/g
0.7 (d) 1.39E-05 8.56E-05 516.5 9.90E-05 613.1
1.7 (d) 2.03E-06 6.51E-05 3104.9 6.39E-05 3048.8
3.9 (d) 2.00E-06 5.77E-05 2784.4 5.66E-05 2732.4
6.7 (d) 2.28E-06 5.06E-05 2115.1 4.97E-05 2076.5
12.2 (d) 3.73E-06 4.25E-05 1038.0 4.18E-05 1019.5
Table 5 – Bismuth decay heat calculation-experiment comparison (5 minutes and 7 hours irradiation)
Figure 7 – Decay heat vs. cooling time of Bismuth sample irradiated for 5 min. Comparison of calculation with experiment (C-E)/E %.
Figure 8 – Decay heat vs. cooling time of Bismuth sample irradiated for 7 hours. Comparison of calculation with experiment (C-E)/E %.
-100 -75 -50 -25 0 25 50 75 100 125 0 10 20 30 40 50 60 (C -E )/E %
Cooling time [minutes]
FENDL/A-2 EAF-2010 Bismuth 0 1000 2000 3000 4000 0 5 10 15 (C -E )/E %
Cooling time [days]
FENDL/A-2 EAF-2010
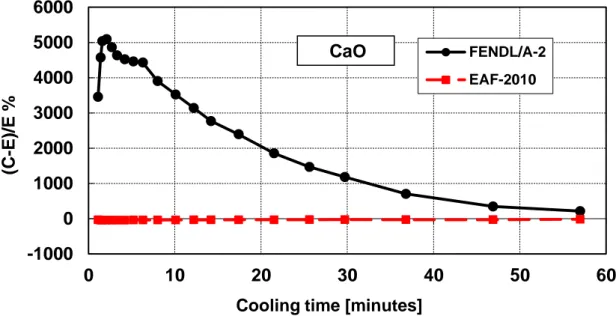
Calcium Oxide (CaO)
Material composition : O 28.53, Ca 71.47EXP-5m CALC-5m (C-E)/E CALC-5m (C-E)/E
FENDL/A-2 % EAF-2010 %
FENDL/D-2 JEFF-3.1.1
Cooling Time µW/g µW/g µW/g
1.1 (m) 2.42E-02 8.60E-01 3453.7 1.62E-02 -33.1
1.4 (m) 1.79E-02 8.34E-01 4570.0 1.02E-02 -43.0
1.6 (m) 1.58E-02 8.13E-01 5035.9 8.84E-03 -44.1
2.1 (m) 1.50E-02 7.80E-01 5091.7 8.41E-03 -44.0
2.7 (m) 1.49E-02 7.38E-01 4863.0 8.23E-03 -44.6
3.3 (m) 1.47E-02 6.98E-01 4632.0 8.08E-03 -45.2
4.2 (m) 1.40E-02 6.47E-01 4521.4 7.88E-03 -43.7
5.2 (m) 1.29E-02 5.88E-01 4461.3 7.64E-03 -40.7
6.3 (m) 1.17E-02 5.31E-01 4428.6 7.39E-03 -37.0
8.0 (m) 1.15E-02 4.59E-01 3904.4 7.05E-03 -38.4
10.1 (m) 1.05E-02 3.80E-01 3522.5 6.64E-03 -36.7
12.2 (m) 9.68E-03 3.14E-01 3140.4 6.24E-03 -35.5
14.2 (m) 9.09E-03 2.61E-01 2767.8 5.89E-03 -35.2
17.4 (m) 7.90E-03 1.97E-01 2393.4 5.39E-03 -31.8
21.5 (m) 7.01E-03 1.37E-01 1855.5 4.81E-03 -31.3
25.6 (m) 6.07E-03 9.52E-02 1468.4 4.30E-03 -29.2
29.7 (m) 5.16E-03 6.62E-02 1182.1 3.84E-03 -25.6
36.8 (m) 4.48E-03 3.59E-02 702.2 3.18E-03 -28.8
46.9 (m) 3.47E-03 1.55E-02 345.9 2.46E-03 -29.1
57.0 (m) 2.28E-03 7.13E-03 212.6 1.93E-03 -15.3
EXP-7h CALC-7h (C-E)/E CALC-7h (C-E)/E
FENDL/A-2 % EAF-2010 %
FENDL/D-2 JEFF-3.1.1
Cooling Time µW/g µW/g µW/g
0.7 (d) 8.41E-03 6.73E-03 -19.9 6.87E-03 -18.3
1.7 (d) 3.40E-03 2.70E-03 -20.5 2.81E-03 -17.3
3.9 (d) 1.47E-03 1.13E-03 -23.0 1.21E-03 -17.6
6.7 (d) 9.49E-04 7.26E-04 -23.5 7.79E-04 -18.0
12.2 (d) 4.32E-04 3.59E-04 -16.9 3.84E-04 -11.2
24.2 (d) 9.00E-05 8.11E-05 -9.9 8.51E-05 -5.4
Table 6 – Calcium Oxide decay heat calculation-experiment comparison (5 minutes and 7 hours irradiation)
Figure 9 – Decay heat vs. cooling time of Calcium Oxide sample irradiated for 5 min. Comparison of calculation with experiment (C-E)/E %.
Figure 10 – Decay heat vs. cooling time of Calcium Oxide sample irradiated for 7 hours. Comparison of calculation with experiment (C-E)/E %.
-1000 0 1000 2000 3000 4000 5000 0 10 20 30 40 50 60 (C -E )/E %
Cooling time [minutes]
FENDL/A-2 EAF-2010 CaO -25 -20 -15 -10 -5 0 0 5 10 15 20 25 30 (C -E )/E %
Cooling time [days]
FENDL/A-2 EAF-2010
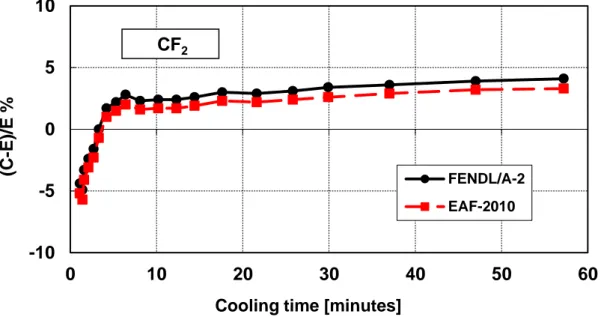
PTFE Teflon (CF
2)
Material composition : C 24.02, F 75.98EXP-5m CALC-5m (C-E)/E CALC-5m (C-E)/E
FENDL/A-2 % EAF2010 %
FENDL/D-2 JEFF-3.1.1
Cooling Time µW/g µW/g µW/g
1.1 (m) 4.52E-01 4.32E-01 -4.4 4.29E-01 -5.2
1.4 (m) 3.19E-01 3.03E-01 -4.9 3.01E-01 -5.7
1.6 (m) 2.31E-01 2.24E-01 -3.3 2.22E-01 -4.1
2.1 (m) 1.53E-01 1.49E-01 -2.4 1.48E-01 -3.1
2.7 (m) 1.03E-01 1.02E-01 -1.6 1.01E-01 -2.3
3.3 (m) 8.29E-02 8.29E-02 0.0 8.23E-02 -0.7
4.2 (m) 7.27E-02 7.40E-02 1.7 7.35E-02 1.0
5.3 (m) 6.95E-02 7.11E-02 2.2 7.06E-02 1.5
6.4 (m) 6.83E-02 7.01E-02 2.8 6.97E-02 2.0
8.1 (m) 6.78E-02 6.93E-02 2.3 6.89E-02 1.6
10.2 (m) 6.68E-02 6.84E-02 2.4 6.79E-02 1.7
12.3 (m) 6.59E-02 6.75E-02 2.4 6.70E-02 1.7
14.4 (m) 6.49E-02 6.66E-02 2.6 6.61E-02 1.9
17.6 (m) 6.34E-02 6.53E-02 3.0 6.48E-02 2.3
21.6 (m) 6.19E-02 6.36E-02 2.9 6.32E-02 2.2
25.8 (m) 6.01E-02 6.20E-02 3.1 6.16E-02 2.4
29.9 (m) 5.84E-02 6.04E-02 3.4 6.00E-02 2.6
37.0 (m) 5.57E-02 5.78E-02 3.6 5.74E-02 2.9
47.0 (m) 5.22E-02 5.42E-02 3.9 5.38E-02 3.2
57.2 (m) 4.89E-02 5.08E-02 4.1 5.05E-02 3.3
Table 7 – PTFE Teflon decay heat calculation-experiment comparison (5 minutes irradiation)
Figure 11 – Decay heat vs. cooling time of PTFE Teflon sample irradiated for 5 min. Comparison of calculation with experiment (C-E)/E %.
-10 -5 0 5 0 10 20 30 40 50 60 (C -E )/E %
Cooling time [minutes]
FENDL/A-2 EAF-2010
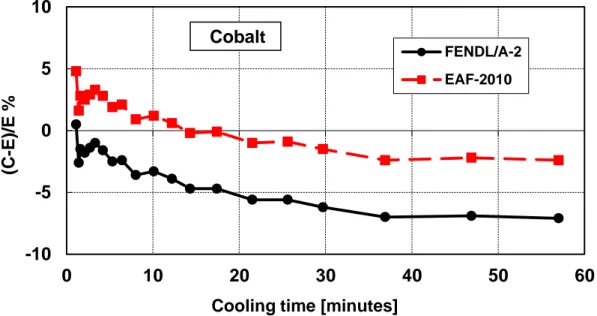
Cobalt (Co)
Material composition : Co 100EXP-5m CALC-5m (C-E)/E CALC-5m (C-E)/E
FENDL/A-2 % EAF-2010 %
FENDL/D-2 JEFF-3.1.1
Cooling Time µW/g µW/g µW/g
1.1 (m) 3.11E-02 3.13E-02 0.5 3.26E-02 4.8
1.4 (m) 3.20E-02 3.12E-02 -2.6 3.25E-02 1.6
1.6 (m) 3.16E-02 3.11E-02 -1.5 3.24E-02 2.8
2.1 (m) 3.15E-02 3.10E-02 -1.8 3.23E-02 2.5
2.7 (m) 3.12E-02 3.08E-02 -1.4 3.21E-02 2.9
3.3 (m) 3.09E-02 3.06E-02 -1.0 3.19E-02 3.3
4.2 (m) 3.08E-02 3.03E-02 -1.6 3.17E-02 2.8
5.3 (m) 3.08E-02 3.00E-02 -2.5 3.14E-02 1.9
6.4 (m) 3.05E-02 2.97E-02 -2.4 3.11E-02 2.1
8.0 (m) 3.04E-02 2.93E-02 -3.6 3.07E-02 0.9
10.1 (m) 2.98E-02 2.89E-02 -3.3 3.02E-02 1.2
12.2 (m) 2.95E-02 2.84E-02 -3.9 2.97E-02 0.6
14.3 (m) 2.93E-02 2.80E-02 -4.7 2.93E-02 -0.2
17.4 (m) 2.87E-02 2.74E-02 -4.7 2.87E-02 -0.1
21.5 (m) 2.83E-02 2.67E-02 -5.6 2.80E-02 -1.0
25.6 (m) 2.76E-02 2.61E-02 -5.6 2.73E-02 -0.9
29.7 (m) 2.72E-02 2.55E-02 -6.2 2.67E-02 -1.5
36.9 (m) 2.64E-02 2.46E-02 -7.0 2.58E-02 -2.4
46.9 (m) 2.51E-02 2.34E-02 -6.9 2.46E-02 -2.2
57.0 (m) 2.41E-02 2.24E-02 -7.1 2.35E-02 -2.4
EXP-7h CALC-7h (C-E)/E CALC-7h (C-E)/E
FENDL/A-2 % EAF-2010 %
FENDL/D-2 JEFF-3.1.1
Cooling Time µW/g µW/g µW/g
0.6 (d) 5.90E-02 7.66E-02 29.7 8.08E-02 36.8
1.3 (d) 4.28E-02 4.61E-02 7.7 4.69E-02 9.5
2.9 (d) 4.33E-02 4.06E-02 -6.3 4.05E-02 -6.6
6.9 (d) 4.19E-02 3.87E-02 -7.6 3.85E-02 -8.0
12.8 (d) 3.94E-02 3.64E-02 -7.7 3.62E-02 -8.1
23.8 (d) 3.52E-02 3.24E-02 -7.8 3.23E-02 -8.2
49.7 (d) 2.69E-02 2.48E-02 -7.9 2.47E-02 -8.3
99.9 (d) 1.63E-02 1.48E-02 -9.0 1.48E-02 -9.4
Table 8 – Cobalt decay heat calculation-experiment comparison (5 minutes and 7 hours irradiation)
Figure 12 – Decay heat vs. cooling time of Cobalt sample irradiated for 5 min. Comparison of calculation with experiment (C-E)/E %.
Figure 13 – Decay heat vs. cooling time of Cobalt sample irradiated for 7 hours. Comparison of calculation with experiment (C-E)/E %.
-10 -5 0 5 0 10 20 30 40 50 60 (C -E )/E %
Cooling time [minutes]
FENDL/A-2 EAF-2010 Cobalt -20 -10 0 10 20 30 40 0 20 40 60 80 100 120 (C -E )/E %
Cooling time [days]
FENDL/A-2 EAF-2010
Chromium (Cr)
Material composition : Cr 100EXP-5m CALC-5m (C-E)/E CALC-5m (C-E)/E
FENDL/A-2 % EAF-2010 %
FENDL/D-2 JEFF-3.1.1
Cooling Time µW/g µW/g µW/g
1.1 (m) 1.81E+00 1.56E+00 -13.8 1.58E+00 -12.4
1.4 (m) 1.71E+00 1.48E+00 -13.8 1.50E+00 -12.4
1.6 (m) 1.62E+00 1.40E+00 -13.4 1.42E+00 -12.1
2.1 (m) 1.48E+00 1.28E+00 -13.8 1.29E+00 -12.5
2.7 (m) 1.31E+00 1.13E+00 -13.9 1.14E+00 -12.7
3.3 (m) 1.16E+00 1.00E+00 -13.9 1.01E+00 -12.7
4.2 (m) 9.82E-01 8.43E-01 -14.2 8.54E-01 -13.1
5.3 (m) 7.93E-01 6.80E-01 -14.2 6.89E-01 -13.1
6.5 (m) 6.42E-01 5.49E-01 -14.5 5.56E-01 -13.4
8.1 (m) 4.82E-01 4.08E-01 -15.3 4.13E-01 -14.2
10.2 (m) 3.28E-01 2.75E-01 -16.1 2.79E-01 -15.0
12.3 (m) 2.24E-01 1.86E-01 -17.2 1.88E-01 -16.0
14.4 (m) 1.55E-01 1.26E-01 -18.6 1.27E-01 -17.5
17.5 (m) 9.11E-02 7.11E-02 -22 7.21E-02 -20.8
21.7 (m) 4.60E-02 3.39E-02 -26.3 3.45E-02 -25.0
25.8 (m) 2.48E-02 1.68E-02 -32.3 1.71E-02 -30.9
29.9 (m) 1.46E-02 8.58E-03 -41.1 8.81E-03 -39.5
37.0 (m) 7.87E-03 3.20E-03 -59.3 3.36E-03 -57.3
47.1 (m) 4.89E-03 1.39E-03 -71.6 1.50E-03 -69.3
57.2 (m) 3.89E-03 9.72E-04 -75 1.07E-03 -72.6
EXP-7h CALC-7h (C-E)/E CALC-7h (C-E)/E
FENDL/A-2 % EAF-2010 %
FENDL/D-2 JEFF-3.1.1
Cooling Time µW/g µW/g µW/g
0.7 (d) 1.40E-02 1.47E-03 -89.5 1.49E-03 -89.3
1.7 (d) 5.39E-03 1.43E-03 -73.5 1.45E-03 -73.1
3.9 (d) 1.83E-03 1.36E-03 -25.8 1.37E-03 -24.7
6.8 (d) 1.37E-03 1.26E-03 -7.6 1.28E-03 -6.4
12.2 (d) 1.14E-03 1.10E-03 -3.6 1.12E-03 -2.3
24.2 (d) 8.31E-04 8.16E-04 -1.9 8.27E-04 -0.6
50.0 (d) 4.04E-04 4.29E-04 6.3 4.34E-04 7.6
100.1 (d) 1.15E-04 1.23E-04 7.4 1.24E-04 8.3
Table 9 – Chromium decay heat calculation-experiment comparison (5 minutes and 7 hours irradiation)
Figure 14 – Decay heat vs. cooling time of Chromium sample irradiated for 5 min. Comparison of calculation with experiment (C-E)/E %.
Figure 15 – Decay heat vs. cooling time of Chromium sample irradiated for 7 hours. Comparison of calculation with experiment (C-E)/E %.
-100 -80 -60 -40 -20 0 10 20 30 40 50 60 (C -E )/E %
Cooling time [minutes]
FENDL/A-2 EAF-2010 Chromium -100 -80 -60 -40 -20 0 20 0 20 40 60 80 100 120 (C -E )/E %
Cooling time [days]
FENDL/A-2 EAF-2010
Copper (Cu)
Material composition : Cu 100EXP-5m CALC-5m (C-E)/E CALC-5m (C-E)/E
FENDL/A-2 % EAF-2010 %
FENDL/D-2 JEFF-3.1.1
Cooling Time µW/g µW/g µW/g
1.1 (m) 4.16E+00 3.77E+00 -9.4 3.88E+00 -6.6
1.4 (m) 4.08E+00 3.69E+00 -9.6 3.81E+00 -6.8
1.6 (m) 3.99E+00 3.61E+00 -9.5 3.73E+00 -6.6
2.1 (m) 3.86E+00 3.49E+00 -9.6 3.61E+00 -6.6
2.7 (m) 3.69E+00 3.33E+00 -9.7 3.45E+00 -6.6
3.3 (m) 3.53E+00 3.18E+00 -9.9 3.29E+00 -6.7
4.2 (m) 3.30E+00 2.98E+00 -9.6 3.09E+00 -6.3
5.3 (m) 3.05E+00 2.76E+00 -9.6 2.86E+00 -6.2
6.4 (m) 2.82E+00 2.55E+00 -9.7 2.64E+00 -6.3
8.0 (m) 2.51E+00 2.27E+00 -9.8 2.35E+00 -6.3
10.1 (m) 2.15E+00 1.95E+00 -9.5 2.03E+00 -6.0
12.2 (m) 1.85E+00 1.68E+00 -9.5 1.74E+00 -5.9
14.4 (m) 1.59E+00 1.44E+00 -9.4 1.50E+00 -5.8
17.5 (m) 1.28E+00 1.16E+00 -9.5 1.21E+00 -5.9
21.5 (m) 9.62E-01 8.70E-01 -9.5 9.06E-01 -5.8
25.6 (m) 7.22E-01 6.52E-01 -9.7 6.79E-01 -6.0
29.8 (m) 5.38E-01 4.89E-01 -9.1 5.09E-01 -5.3
36.9 (m) 3.33E-01 2.98E-01 -10.5 3.11E-01 -6.7
47.0 (m) 1.66E-01 1.50E-01 -9.5 1.57E-01 -5.6
57.1 (m) 8.44E-02 7.75E-02 -8.2 8.09E-02 -4.2
EXP-7h CALC-7h (C-E)/E CALC-7h (C-E)/E
FENDL/A-2 % EAF-2010 %
FENDL/D-2 JEFF-3.1.1
Cooling Time µW/g µW/g µW/g
0.7 (d) 1.95E-01 2.04E-01 4.4 2.04E-01 4.5
1.3 (d) 8.31E-02 8.39E-02 1.0 8.40E-02 1.1
2.9 (d) 1.07E-02 1.07E-02 -0.4 1.07E-02 0.0
6.9 (d) 1.96E-04 1.71E-04 -12.5 2.02E-04 3.0
12.9 (d) 1.42E-04 1.12E-04 -20.7 1.43E-04 0.7
23.9 (d) 1.40E-04 1.12E-04 -20.0 1.42E-04 1.6
49.7 (d) 1.51E-04 1.11E-04 -26.7 1.41E-04 -6.9
99.9 (d) 1.48E-04 1.09E-04 -26.2 1.38E-04 -6.3
Table 10 – Copper decay heat calculation-experiment comparison (5 minutes and 7 hours irradiation)
Figure 16 – Decay heat vs. cooling time of Copper sample irradiated for 5 min. Comparison of calculation with experiment (C-E)/E %.
Figure 17 – Decay heat vs. cooling time of Copper sample irradiated for 7 hours. Comparison of calculation with experiment (C-E)/E %.
-15.0 -12.0 -9.0 -6.0 -3.0 0 10 20 30 40 50 60 (C -E )/E %
Cooling time [minutes]
EAF-2010 Copper -30.0 -20.0 -10.0 0.0 10.0 0 20 40 60 80 100 120 (C -E )/E %
Cooling time [days]
FENDL/A-2 EAF-2010
Iron (Fe)
Material composition : Fe 100EXP-5m CALC-5m (C-E)/E CALC-5m (C-E)/E
FENDL/A-2 % EAF-2010 %
FENDL/D-2 JEFF-3.1.1
Cooling Time µW/g µW/g µW/g
1.1 (m) 1.28E-01 1.32E-01 2.9 1.20E-01 -6.7
1.4 (m) 1.26E-01 1.29E-01 2.2 1.18E-01 -7.0
1.6 (m) 1.26E-01 1.27E-01 0.2 1.16E-01 -8.5
2.1 (m) 1.22E-01 1.23E-01 1.2 1.13E-01 -7.2
2.7 (m) 1.17E-01 1.19E-01 1.9 1.10E-01 -5.8
3.2 (m) 1.15E-01 1.16E-01 0.8 1.08E-01 -6.3
4.1 (m) 1.11E-01 1.12E-01 0.3 1.05E-01 -6.0
5.2 (m) 1.08E-01 1.08E-01 0.2 1.02E-01 -5.5
6.3 (m) 1.05E-01 1.05E-01 0.4 1.00E-01 -4.8
7.9 (m) 1.03E-01 1.02E-01 -0.5 9.78E-02 -5.0
10.1 (m) 9.98E-02 9.95E-02 -0.3 9.55E-02 -4.3
12.1 (m) 9.80E-02 9.72E-02 -0.8 9.36E-02 -4.4
14.2 (m) 9.58E-02 9.53E-02 -0.6 9.20E-02 -4.0
17.3 (m) 9.38E-02 9.28E-02 -1.1 8.98E-02 -4.2
21.4 (m) 9.06E-02 9.00E-02 -0.6 8.73E-02 -3.6
25.5 (m) 8.80E-02 8.76E-02 -0.5 8.51E-02 -3.3
29.6 (m) 8.58E-02 8.54E-02 -0.5 8.31E-02 -3.1
36.8 (m) 8.26E-02 8.21E-02 -0.7 8.00E-02 -3.2
46.9 (m) 7.84E-02 7.80E-02 -0.6 7.62E-02 -2.9
57.0 (m) 7.51E-02 7.43E-02 -1.0 7.26E-02 -3.3
EXP-7h CALC-7h (C-E)/E CALC-7h (C-E)/E
FENDL/A-2 % EAF-2010 %
FENDL/D-2 JEFF-3.1.1
Cooling Time µW/g µW/g µW/g
0.6 (d) 6.58E-02 6.44E-02 -2.1 6.44E-02 -2.2
1.3 (d) 1.23E-03 1.09E-03 -11.4 1.10E-03 -10.4
2.9 (d) 2.53E-04 2.28E-04 -10.0 2.37E-04 -6.4
6.9 (d) 2.30E-04 2.23E-04 -3.0 2.32E-04 1.2
12.9 (d) 2.25E-04 2.17E-04 -3.6 2.27E-04 0.9
23.9 (d) 2.14E-04 2.07E-04 -3.4 2.18E-04 1.5
49.7 (d) 2.03E-04 1.90E-04 -6.3 2.00E-04 -1.4
99.9 (d) 1.67E-04 1.66E-04 -0.7 1.75E-04 4.7
Table 11 – Iron decay heat calculation-experiment comparison (5 minutes and 7 hours irradiation)
Figure 18 – Decay heat vs. cooling time of Iron sample irradiated for 5 min. Comparison of calculation with experiment (C-E)/E %.
Figure 19 – Decay heat vs. cooling time of Iron sample irradiated for 7 hours. Comparison of calculation with experiment (C-E)/E %.
-10.0 -5.0 0.0 0 10 20 30 40 50 60 (C -E )/E %
Cooling time [minutes]
FENDL/A-2 EAF-2010 Iron -15.0 -10.0 -5.0 0.0 5.0 0 20 40 60 80 100 120 (C -E )/E %
Cooling time [days]
FENDL/A-2 EAF-2010
Inconel-600 (Inconel)
Material composition : Cr 15.97, Mn 0.39, Fe 7.82, Ni 75.82EXP-5m CALC-5m (C-E)/E CALC-5m (C-E)/E
FENDL/A-2 % EAF-2010 %
FENDL/D-2 JEFF-3.1.1
Cooling Time µW/g µW/g µW/g
1.1 (m) 4.07E-01 2.91E-01 -28.4 2.95E-01 -27.5
1.4 (m) 3.81E-01 2.76E-01 -27.5 2.80E-01 -26.6
1.6 (m) 3.62E-01 2.61E-01 -27.8 2.65E-01 -26.8
2.0 (m) 3.29E-01 2.39E-01 -27.2 2.43E-01 -26.2
2.7 (m) 2.89E-01 2.12E-01 -26.6 2.15E-01 -25.6
3.3 (m) 2.56E-01 1.88E-01 -26.4 1.91E-01 -25.3
4.2 (m) 2.15E-01 1.60E-01 -25.8 1.62E-01 -24.6
5.3 (m) 1.74E-01 1.31E-01 -25.1 1.33E-01 -23.9
6.4 (m) 1.43E-01 1.08E-01 -24.8 1.10E-01 -23.4
8.0 (m) 1.09E-01 8.23E-02 -24.5 8.40E-02 -22.9
10.1 (m) 7.82E-02 5.96E-02 -23.8 6.10E-02 -22.0
12.3 (m) 5.76E-02 4.41E-02 -23.4 4.52E-02 -21.5
14.4 (m) 4.35E-02 3.36E-02 -22.7 3.45E-02 -20.6
17.5 (m) 3.11E-02 2.40E-02 -22.9 2.47E-02 -20.8
21.6 (m) 2.16E-02 1.70E-02 -21.4 1.75E-02 -19.1
25.7 (m) 1.67E-02 1.34E-02 -20.0 1.37E-02 -17.8
29.8 (m) 1.38E-02 1.14E-02 -17.1 1.17E-02 -15.3
37.0 (m) 1.14E-02 9.71E-03 -14.5 9.85E-03 -13.3
47.1 (m) 9.58E-03 8.60E-03 -10.3 8.64E-03 -9.8
57.2 (m) 8.70E-03 7.95E-03 -8.6 7.93E-03 -8.8
EXP-7h CALC-7h (C-E)/E CALC-7h (C-E)/E
FENDL/A-2 % EAF-2010 %
FENDL/D-2 JEFF-3.1.1
Cooling Time µW/g µW/g µW/g
0.6 (d) 8.29E-02 8.12E-02 -2.1 8.14E-02 -1.9
1.3 (d) 5.70E-02 5.56E-02 -2.5 5.63E-02 -1.3
2.9 (d) 3.11E-02 3.09E-02 -0.6 3.15E-02 1.5
6.9 (d) 1.22E-02 1.24E-02 1.4 1.27E-02 4.4
12.9 (d) 8.55E-03 8.68E-03 1.4 8.94E-03 4.5
23.8 (d) 7.47E-03 7.64E-03 2.3 7.87E-03 5.3
49.7 (d) 5.92E-03 6.02E-03 1.8 6.21E-03 4.8
99.9 (d) 3.68E-03 3.87E-03 5.2 3.99E-03 8.5
Table 12 – Inconel-600 decay heat calculation-experiment comparison (5 minutes and 7 hours irradiation)
Figure 20 – Decay heat vs. cooling time of Inconel-600 sample irradiated for 5 min. Comparison of calculation with experiment (C-E)/E %.
Figure 21 – Decay heat vs. cooling time of Inconel-600 sample irradiated for 7 hours. Comparison of calculation with experiment (C-E)/E %.
-30.0 -20.0 -10.0 0 10 20 30 40 50 60 (C -E )/E %
Cooling time [minutes]
FENDL/A-2 EAF-2010 Inconel -5 0 5 10 0 20 40 60 80 100 120 (C -E )/E %
Cooling time [days]
FENDL/A-2 EAF-2010
Potassium Carbonate (K
2CO
3)
Material composition : C 8.69, O 34.73, K 56.58EXP-5m CALC-5m (C-E)/E CALC-5m (C-E)/E
FENDL/A-2 % EAF-2010 %
FENDL/D-2 JEFF-3.1.1
Cooling Time µW/g µW/g µW/g
1.1 (m) 1.25E-01 9.68E-02 -22.4 1.53E-01 23.0
1.4 (m) 1.11E-01 8.76E-02 -21.1 1.43E-01 28.9
1.6 (m) 1.06E-01 8.42E-02 -20.7 1.38E-01 30.3
2.1 (m) 1.02E-01 8.08E-02 -20.7 1.33E-01 30.4
2.7 (m) 9.64E-02 7.68E-02 -20.3 1.26E-01 30.6
3.3 (m) 9.19E-02 7.32E-02 -20.3 1.20E-01 30.2
4.1 (m) 8.55E-02 6.85E-02 -19.9 1.12E-01 30.4
5.2 (m) 7.79E-02 6.27E-02 -19.5 1.02E-01 30.4
6.4 (m) 7.10E-02 5.74E-02 -19.1 9.25E-02 30.3
8.0 (m) 6.22E-02 5.06E-02 -18.7 8.09E-02 29.9
10.1 (m) 5.25E-02 4.32E-02 -17.8 6.80E-02 29.6
12.2 (m) 4.46E-02 3.71E-02 -17.0 5.77E-02 29.2
14.3 (m) 3.78E-02 3.19E-02 -15.6 4.88E-02 29.2
17.5 (m) 2.99E-02 2.57E-02 -14.0 3.84E-02 28.4
21.6 (m) 2.28E-02 1.98E-02 -13.0 2.85E-02 25.1
25.7 (m) 1.74E-02 1.56E-02 -10.4 2.16E-02 23.6
29.8 (m) 1.40E-02 1.26E-02 -9.6 1.67E-02 19.3
37.0 (m) 1.00E-02 9.23E-03 -7.9 1.13E-02 12.6
47.1 (m) 6.73E-03 6.60E-03 -1.9 7.36E-03 9.5
57.2 (m) 4.99E-03 5.17E-03 3.6 5.43E-03 8.8
EXP-7h CALC-7h (C-E)/E CALC-7h (C-E)/E
FENDL/A-2 % EAF-2010 %
FENDL/D-2 JEFF-3.1.1
Cooling Time µW/g µW/g µW/g
0.7 (d) 4.21E-04 3.84E-04 -8.7 3.90E-04 -7.4
1.7 (d) 6.62E-05 4.69E-05 -29.2 5.24E-05 -20.8
3.9 (d) 2.07E-05 5.09E-06 -75.4 1.10E-05 -47.0
6.7 (d) 1.40E-05 2.70E-06 -80.8 8.43E-06 -39.9
12.2 (d) 1.09E-05 2.64E-06 -75.7 8.10E-06 -25.4
24.2 (d) 6.72E-06 2.63E-06 -60.8 7.60E-06 13.1
49.9 (d) 2.68E-06 2.63E-06 -1.9 6.81E-06 154.6
100.1 (d) 3.53E-07 2.62E-06 640.0 5.84E-06 1553.1
Table 13 – Potassium Carbonate decay heat calculation-experiment comparison (5 minutes and 7 hours irradiation)
Figure 22 – Decay heat vs. cooling time of Potassium Carbonate sample irradiated for 5 min. Comparison of calculation with experiment (C-E)/E %.
Figure 23 – Decay heat vs. cooling time of Potassium Carbonate sample irradiated for 7 hours. Comparison of calculation with experiment (C-E)/E %.
-30.0 -20.0 -10.0 0.0 10.0 20.0 30.0 0 10 20 30 40 50 60 (C -E )/E %
Cooling time [minutes]
FENDL/A-2 EAF-2010 K2Co3 -200.0 200.0 600.0 1000.0 1400.0 0 20 40 60 80 100 120 (C -E )/E %
Cooling time [days]
FENDL/A-2 EAF-2010
Manganese (Mn)
Material composition : Mn 100EXP-5m CALC-5m (C-E)/E CALC-5m (C-E)/E
FENDL/A-2 % EAF-2010 %
FENDL/D-2 JEFF-3.1.1
Cooling Time µW/g µW/g µW/g
1.1 (m) 8.11E-01 9.78E-01 20.7 9.03E-01 11.4
1.4 (m) 7.67E-01 9.31E-01 21.3 8.59E-01 11.9
1.6 (m) 7.34E-01 8.85E-01 20.6 8.17E-01 11.2
2.1 (m) 6.74E-01 8.13E-01 20.6 7.50E-01 11.2
2.7 (m) 6.00E-01 7.24E-01 20.7 6.68E-01 11.3
3.3 (m) 5.33E-01 6.45E-01 21.0 5.95E-01 11.6
4.2 (m) 4.51E-01 5.45E-01 20.9 5.03E-01 11.5
5.3 (m) 3.67E-01 4.43E-01 20.6 4.08E-01 11.2
6.4 (m) 2.98E-01 3.59E-01 20.6 3.31E-01 11.0
8.1 (m) 2.22E-01 2.66E-01 19.4 2.44E-01 9.8
10.2 (m) 1.51E-01 1.80E-01 19.8 1.66E-01 10.0
12.3 (m) 1.03E-01 1.23E-01 19.0 1.12E-01 8.9
14.4 (m) 7.07E-02 8.37E-02 18.4 7.63E-02 7.9
17.6 (m) 4.20E-02 4.88E-02 16.0 4.40E-02 4.8
21.7 (m) 2.24E-02 2.53E-02 13.2 2.24E-02 0.3
25.8 (m) 1.30E-02 1.44E-02 11.1 1.24E-02 -4.4
29.9 (m) 8.65E-03 9.43E-03 9.0 7.83E-03 -9.5
37.0 (m) 5.97E-03 6.13E-03 2.7 4.82E-03 -19.1
47.2 (m) 4.79E-03 4.96E-03 3.7 3.79E-03 -20.8
57.3 (m) 4.16E-03 4.61E-03 10.9 3.50E-03 -15.7
EXP-7h CALC-7h (C-E)/E CALC-7h (C-E)/E
FENDL/A-2 % EAF-2010 %
FENDL/D-2 JEFF-3.1.1
Cooling Time µW/g µW/g µW/g
0.7 (d) 8.58E-03 8.27E-03 -3.6 8.41E-03 -2.0
1.7 (d) 7.64E-03 7.71E-03 0.9 7.98E-03 4.5
3.9 (d) 7.52E-03 7.67E-03 2.0 7.94E-03 5.6
6.8 (d) 7.43E-03 7.62E-03 2.6 7.89E-03 6.2
12.2 (d) 7.25E-03 7.53E-03 3.8 7.80E-03 7.5
24.2 (d) 7.19E-03 7.33E-03 2.0 7.59E-03 5.6
50.0 (d) 6.74E-03 6.93E-03 2.7 7.17E-03 6.3
100.1 (d) 5.93E-03 6.20E-03 4.5 6.41E-03 8.2
Table 14 – Manganese decay heat calculation-experiment comparison (5 minutes and 7 hours irradiation)
Figure 24 – Decay heat vs. cooling time of Manganese sample irradiated for 5 min. Comparison of calculation with experiment (C-E)/E %.
Figure 25 – Decay heat vs. cooling time of Manganese sample irradiated for 7 hours. Comparison of calculation with experiment (C-E)/E %.
-30.0 -20.0 -10.0 0.0 10.0 20.0 0 10 20 30 40 50 60 (C -E )/E %
Cooling time [minutes]
FENDL/A-2 EAF-2010 Manganese -5.0 -2.5 0.0 2.5 5.0 7.5 10.0 0 20 40 60 80 100 120 (C -E )/E %
Cooling time [days]
FENDL/A-2 EAF-2010
Molybdenum (Mo)
Material composition : Mo 100EXP-5m CALC-5m (C-E)/E CALC-5m (C-E)/E
FENDL/A-2 % EAF-2010 %
FENDL/D-2 JEFF-3.1.1
Cooling Time µW/g µW/g µW/g
1.1 (m) 2.32E-01 2.62E-01 12.8 2.90E-01 24.6
1.4 (m) 2.24E-01 2.54E-01 13.4 2.78E-01 23.9
1.6 (m) 2.17E-01 2.47E-01 14.1 2.67E-01 23.5
2.1 (m) 2.06E-01 2.37E-01 15.2 2.53E-01 23.0
2.7 (m) 1.95E-01 2.25E-01 15.6 2.37E-01 21.7
3.3 (m) 1.85E-01 2.16E-01 16.6 2.25E-01 21.4
4.2 (m) 1.75E-01 2.04E-01 16.5 2.11E-01 20.1
5.3 (m) 1.64E-01 1.92E-01 17.2 1.97E-01 20.0
6.3 (m) 1.55E-01 1.82E-01 17.5 1.86E-01 19.9
8.0 (m) 1.44E-01 1.68E-01 17.1 1.71E-01 19.2
10.1 (m) 1.30E-01 1.53E-01 17.3 1.56E-01 19.4
12.2 (m) 1.19E-01 1.40E-01 17.5 1.42E-01 19.5
14.3 (m) 1.08E-01 1.27E-01 17.2 1.29E-01 19.2
17.4 (m) 9.47E-02 1.11E-01 17.2 1.13E-01 19.3
21.5 (m) 7.96E-02 9.29E-02 16.7 9.46E-02 18.9
25.6 (m) 6.67E-02 7.76E-02 16.3 7.92E-02 18.6
29.6 (m) 5.62E-02 6.52E-02 15.8 6.65E-02 18.2
36.8 (m) 4.20E-02 4.81E-02 14.4 4.92E-02 17.0
46.9 (m) 2.80E-02 3.15E-02 12.5 3.23E-02 15.5
57.0 (m) 1.89E-02 2.09E-02 10.1 2.15E-02 13.6
EXP-7h CALC-7h (C-E)/E CALC-7h (C-E)/E
FENDL/A-2 % EAF-2010 %
FENDL/D-2 JEFF-3.1.1
Cooling Time µW/g µW/g µW/g
0.6 (d) 8.87E-02 8.07E-02 -9.1 8.59E-02 -3.2
1.3 (d) 7.23E-02 6.51E-02 -10.0 6.97E-02 -3.6
2.9 (d) 4.54E-02 4.10E-02 -9.7 4.42E-02 -2.8
6.9 (d) 1.71E-02 1.52E-02 -10.7 1.64E-02 -4.1
12.9 (d) 4.71E-03 4.31E-03 -8.5 4.48E-03 -4.8
23.9 (d) 9.95E-04 1.03E-03 3.0 9.55E-04 -4.0
49.7 (d) 3.14E-04 3.73E-04 18.8 3.15E-04 0.1
99.9 (d) 1.07E-04 1.54E-04 44.0 1.24E-04 15.8
Table 15 – Molybdenum decay heat calculation-experiment comparison (5 minutes and 7 hours irradiation)
Figure 26 – Decay heat vs. cooling time of Molybdenum sample irradiated for 5 min. Comparison of calculation with experiment (C-E)/E %.
Figure 27 – Decay heat vs. cooling time of Molybdenum sample irradiated for 7 hours. Comparison of calculation with experiment (C-E)/E %.
0.0 10.0 20.0 0 10 20 30 40 50 60 (C -E )/E %
Cooling time [minutes]
FENDL/A-2 EAF-2010 Molybdenum -20.0 0.0 20.0 40.0 60.0 0 20 40 60 80 100 120 (C -E )/E %
Cooling time [days]
FENDL/A-2 EAF-2010