PER LA
R
ICERCAT
ECNOLOGICAN
UCLEAREPOLITECNICO
DI
MILANO
DIPARTIMENTO DI ENERGIA, Sezione INGEGNERIA NUCLEARE-CeSNEF
Prove sperimentali per canali in parallelo e relative zone
di instabilità
Davide Papini, Marco Colombo, Antonio Cammi, Marco Ricotti
CIRTEN-POLIMI RL-1134/2010
Milano, Agosto 2010
Lavoro svolto in esecuzione della linea progettuale LP2 punto G1 – AdP ENEA MSE del 21/06/07 Tema 5.2.5.8 – “Nuovo Nucleare da Fissione”
LP2.G1 - 2 - CERSE-POLIMI RL-1134/2010
INDEX
E
XECUTIVES
UMMARY... - 3 -
1
P
REPARATION OF THEE
XPERIMENTALC
AMPAIGN... - 5 -
1.1
Introductory background on boiling channel instabilities... 5
-1.2
Stability maps – parametric effects ... 6
-1.2.1 Effects of heat input, flow rate and exit quality... - 7 -
1.2.2 Effects of pressure level ... - 7 -
1.2.3 Effects of inlet subcooling... - 7 -
1.2.4 Effects of inlet and exit throttling... 8
-1.3
Starting point experimental data... 8
-1.4
The experimental facility... 10
-1.5
Proposed experimental procedure ... 13
-1.6
Range of explored variables (proposed test matrix)... 14
-2
N
UMERICALI
NVESTIGATION ONB
OILINGC
HANNELI
NSTABILITIES WITHRELAP5
C
ODE. - 17 -
2.1
RELAP5 background ... 17
-2.2
RELAP5 modelling and numerical setting... 18
-2.3
Results ... 20
-2.3.1 Sensitivity study on bypass ratio ... - 22 -
2.4
Preliminary calculations on parallel channel instabilities ... 23
-3
P
RE-T
ESTA
NALYSIS WITHA
NALYTICALL
UMPEDP
ARAMETERM
ODEL... - 25 -
3.1
Mathematical modelling... 26
-3.1.1 Massenergy model in the twophase region ... 26
-3.1.2 Integration of momentum equation ... 27
-3.1.3 Boiling boundary dynamics... 28
-3.1.4 Exit quality dynamics ... 29
-3.1.5 Reaction frequency dynamics... 30
-3.2
Model development... 30
-3.2.1 Definition of the boundary conditions... 30
-3.2.2 Summary of the modelling equations ... 32
-3.2.3 Steadystate and dynamic solutions... 33
-3.3
Sensitivity of model predictions on twophase friction factor multiplier ... 36
-3.3.1 HEM2 model, with correction factor for viscosity effects ... 37
-3.3.2 Chen correlation, modified by Guo for helical tubes... 37
-3.3.3 Friedel correlation, modified for helical tubes... 37
-3.4
Test matrix simulation... 39
-4
F
IRSTR
ESULTS OF THEE
XPERIMENTALC
AMPAIGN... - 45 -
4.1
Valves characterization ... 45
-4.2
Experimental results... 45
LP2.G1 - 3 - CERSE-POLIMI RL-1134/2010
EXECUTIVE SUMMARY
This document describes the research activities carried out by Politecnico di Milano on the field of two-phase flow instabilities in parallel channels.
Density Wave Oscillations (DWOs) are probably the most common type of instabilities affecting vapour generation in boiling systems. They are “dynamic type” instabilities, which result from multiple feedback effects between the flow rate, the vapour generation rate and the pressure drops in the boiling channel. These instabilities constitute an issue of special interest both for Boiling Water Reactor (BWR) fuel channels (where they are moreover coupled through the neutronic feedback with the neutron field), and for parallel tubes of innovative steam generators. Extensive attention is required because parallel channel instability is very difficult to be immediately detected when occurs in steam power systems (widely used in the nuclear area). The total mass flow of the system remains in fact stable while the instability is locally triggered among some of the parallel channels. Thermally induced oscillations of the flow rate and system pressure are undesirable, as they can cause mechanical vibrations, problems of system control, and in extreme circumstances disturb the heat transfer characteristics so that the heat transfer surface may burn-out. Large amplitude fluctuations in the heater wall temperature (so named “thermal oscillations”) usually occur under DWO conditions. Continual cycling of the wall temperature can lead to thermal fatigue problems which may cause tube failure.
It is clear from these examples that the flow instabilities must be avoided, especially in the design of nuclear systems. The safe operating regime of a two-phase heat exchanger can be determined by the instability threshold values of such system parameters as flow rate, pressure, inlet temperature and exit quality. To the aim, both basic experiments and numerical analyses are necessary.
Density wave oscillations in parallel channels, with reference to steam generator tubes case, represent hence the topic of the present study. The modelling effort currently underway at the Nuclear Engineering Division of the Department of Energy (Politecnico di Milano) – dealing with two helically coiled tubes of the IRIS (International Reactor Innovative and Secure) steam generator – is described. DWO instability threshold and the influence of the different thermal-hydraulic parameters (thermal power, flow rate, pressure, channel inlet throttling and subcooling) are being studied via an analytical dynamic model based on the integration of 1D governing equations and via the well known “six-equations” system code RELAP5. The adoption of simple homogeneous equilibrium models is well established to study basic thermal-hydraulic phenomena; on the contrary, the use of complex numerical system codes represents a reliable option, since they can provide accurate quantitative predictions with simple and straightforward nodalizations.
The main objective of these analyses has been to prepare an experimental campaign at SIET labs (Piacenza), where such instability phenomenon is being directly investigated with a test section reproducing in full scale two helical tubes of the IRIS steam generator. The whole campaign is expected to provide a unique evidence of the influence of the helical shape (through the centrifugal field induced by tube bending) on instability occurrence, as well as a useful experimental database for model validation.
Preparation of the experimental campaign, with description of the used test section and proposed experimental procedure and test matrix, is discussed in Section 1 of the document. Section 2 is dedicated to the RELAP5 modelling of
LP2.G1 - 4 - CERSE-POLIMI RL-1134/2010 boiling channel instability, mainly devoted to a methodological assessment of the capability of the code to detect the onset on instability (a single boiling channel, with proper definition of the exact boundary conditions, is mainly referenced, rather than the two long parallel channels object of the experimental campaign). Pre-test analysis, carried out with an analytical dynamic model developed ad hoc for theoretical prediction of the instability threshold, is discussed in Section 3. Finally, the first experimental results on DWO inception (July 2010) are presented in Section 4. Preliminary argumentations about the triggering event of the instability and interpretation of the period of oscillations are proposed.
LP2.G1 - 5 - CERSE-POLIMI RL-1134/2010
1 PREPARATION OF THE EXPERIMENTAL CAMPAIGN
1.1 Introductory background on boiling channel instabilities
Two-phase flow instabilities have been widely studied in the past because they are of interest to the design and operation of many industrial systems, such as boiling water reactors or steam generators. The various types of self-sustained oscillations which could arise in a boiling channel have been reviewed and classified in different literature works [1][2]. Amongst them, density wave oscillations in parallel channels – with respect to steam generator parallel tubes – represent the object of the developed experimental campaign.
The origin of this instability is ascribed to the difference in density between the fluid entering the heated channel (subcooled liquid) and the fluid exiting (low density two-phase mixture), which triggers delays in the transient distribution of pressure drops along the duct and may lead to self-sustained oscillations. A constant-pressure-drop (or better, the same, not necessarily constant with time, pressure drop for the two channels) is the proper boundary condition which can excite those dynamic feedbacks which are at the source of the instability mechanism.
The physical mechanism leading to density wave oscillations is investigated since the ’60, and, for the sake of clarity, is briefly summarized in the followings [3].
A single heated channel is considered for simplicity. The instantaneous position of the boiling boundary, that is the point where the bulk of the fluid reaches saturation, divides the channel into a single-phase region and a two-phase region. A sudden outlet pressure drop perturbation, e.g. resulting from a local microscopic increase in void fraction, can be assumed to trigger the instability by propagating a corresponding low pressure pulse to the channel inlet, which in turn causes an increase in inlet flow. Considered as a consequence an oscillatory inlet flow entering the channel [4], a propagating enthalpy perturbation is created in the single-phase region. The boiling boundary will respond by oscillating according to the amplitude and the phase of the enthalpy perturbation at the point where the flow reaches saturation. Changes in the flow and in the length of the phase region will combine to create an oscillatory, single-phase, pressure drop perturbation (named δ∆P1). The enthalpy perturbation will appear in the two-phase region as
quality and void fraction perturbations and will travel with the flow along the channel (heavier fluid wave propagation). The combined effects of flow and void fraction perturbations and the variation of the two-phase length will create a two-phase pressure drop perturbation (named δ∆P2). Since the total pressure drop across the boiling channel is imposed
(δ∆Ptot = δ∆P1 +δ∆P2 = 0), the two-phase pressure drop perturbation will create a feedback pressure perturbation of the
opposite sign in the single-phase region (lighter fluid wave propagation), which may attenuate or reinforce the initial imposed perturbation. With correct timing, the flow oscillation can become self-sustained, matched by an oscillation of pressure and by the single-phase and two-phase pressure drop terms oscillating in counter-phase.
The period of the oscillations is closely related to transportation delays in the channel. In the single-phase region enthalpy perturbations propagate with the flow velocity [3]. In the two-phase region void fraction disturbances created by the enthalpy perturbations, according to Zuber and Staub [5][6], propagate with kinematic-wave velocity, which is of the order of magnitude of the velocity of the vapour phase. Since a complete oscillating cycle consists in the passage of two perturbations through the channel (positive “heavier fluid” wave and negative “lighter fluid” wave), the period of the oscillations should be in the range of twice the mixture transit time in the heated section:
τ 2 =
LP2.G1 - 6 - CERSE-POLIMI RL-1134/2010 On the other hand, the classical interpretation of density wave oscillations still confirmed by the noteworthy review of Kakaç and Bon [2] on two-phase flow dynamic instabilities, sounds well recognized and accepted just under low inlet subcooling conditions. At high inlet subcooling, instead, a different description has been raised by Ambrosini et al. [7], on the basis of the criticism on classical point of view due to Podowski [8] and Rizwan-Uddin [9]. Their explanation is based on the different speeds of propagation of velocity perturbations between the single-phase region (speed of sound) and the two-phase region (kinematic velocity). Briefly, at high inlet subcooling DWO phenomenon looks mostly governed by flow perturbations rather than by actual density wave perturbations, and the period of the oscillations may be considerably longer than twice the fluid transit time.
1.2 Stability maps – parametric effects
For stability investigations, the task of the analyst is to find the regions of stable and unstable operation in the three-dimensional space given by the channel flow rate w, thermal power q and inlet subcooling ∆hin (in enthalpy units). A
mapping of these regions in two dimensions is referred to as the stability map of the system (at a given pressure level). No universal map exists. Furthermore, the stability boundary in the (w, q, ∆hin) space is a surface and can be represented
only by a family of curves in any two-dimensional map. Hence, the usage of dimensionless stability maps is strongly recommended to cluster the information on the dynamic characteristics of the system.
The most used dimensionless stability map is due to Ishii and Zuber [10], and it consists of a phase change number Npch
versus a subcooling number Nsub.
The phase change number is the ratio of the characteristic frequency of phase change Ω to the inverse of a single-phase transit time in the system:
L V h v AL q L V N in fg fg in pch = Ω = A V w=ρf in f fg fg pch v v wh q N = (2)
The subcooling number reads:
f fg fg in sub v v h h N =∆ (3)
Figure 1 shows a typical stability map for a two parallel channel system, as obtained by the theoretical study of Guo Yun et al. [11] (see also the work of Zhang et al. [12]).
The typical stability boundary shape is usually a classical inclination “L” at some operating conditions (that is, when the system pressure is reasonably low and the inlet resistance coefficient is small). The stability boundary at high inlet subcooling, on the space of Npch – Nsub, is a line of constant equilibrium quality. In Figure 1, the results of preliminary
calculations with the RELAP5 code for the same two channels configuration are reported as well. Such results have to be intended just as a qualitative specimen of what can be the goal of a stability investigation on density wave
LP2.G1 - 7 - CERSE-POLIMI RL-1134/2010 oscillations. The theoretical results of Guo Yun et al. [11] (Figure 1-a), based on a homogeneous flow model, may be conservative in terms of predicting the stability boundary. The numerical results obtained with RELAP5 (Figure 1-b) may be affected by thermal crisis occurrence within the channels, as well as by numerical diffusion.
In the following parametric discussion, the influence of a change in a certain parameter is said to be stabilizing if it tends to take the operating point from the unstable to the stable region.
1.2.1 Effects of heat input, flow rate and exit quality
A stable system is brought into the unstable operating region by increases in heat input or decreases in flow rate; both effects increase the exit quality, hence the vapour compressibility effects which trigger flow oscillations.
The destabilizing effect of increasing the ratio q/w seems to be universally accepted, although islands of instability have been observed to occur by Yadigaroglu and Bergles [13] within the stable operating region (higher-mode oscillations obtained by reducing slowly and continuously the inlet flow rate).
1.2.2 Effects of pressure level
An increase of pressure level has always been found to be stabilizing, although one must be careful in stating which system parameters were kept constant while the pressure level was increased. At constant values of the dimensionless subcooling and exit quality, the pressure effect is made apparent by the density ratio vfg/vf (approximately equal to ρf/ρg).
However, it is worth to point out that pressure influence is the less effective on the stability boundary, as confirmed for instance by Van Bragt and Van Der Hagen [14]. Moreover, Ishii [15] noted that calculated stability boundaries at three different pressure levels could not be differentiated in the (Npch, Nsub) space.
1.2.3 Effects of inlet subcooling
The influence of inlet subcooling on the system stability is multi-valued. In the high inlet subcooling region the stability is strengthened by increasing the subcooling, whereas in the low inlet subcooling region the stability is strengthened by
0 2 4 6 8 10 12 10 15 20 25 NSU B NPCH
Figure 1 - Stability map on the space Npch-Nsub for a two parallel channel system: theoretical results of Guo Yun et al.
[11] (a) and RELAP5 simulations (b).
LP2.G1 - 8 - CERSE-POLIMI RL-1134/2010 decreasing the subcooling. That is, the inlet subcooling is stabilizing at high subcoolings and destabilizing at low subcoolings.
Intuitively this effect may be explained by the fact that, as the inlet subcooling is increased or decreased, the two-phase channel tends towards stable single-phase liquid and vapour operation, respectively. Thus, according to which stable region is closer, increases and decreases of subcooling tend to pull the system out of the unstable two-phase operating mode.
1.2.4 Effects of inlet and exit throttling
The effect of inlet throttling (single-phase region pressure drops) is always strongly stabilizing and is used to assure the stability of otherwise unstable channels.
On the contrary, the effect of flow resistances near the exit of the channel (two-phase region pressure drops) is strongly destabilizing. For example, stable channels can become unstable if an orifice is added at the exit, or if a riser section is provided.
1.3 Starting point experimental data
The most valuable experimental work available in open literature for the set-up of the campaign on parallel channel instabilities is due to Masini et al. [16]. A forced convection open loop circuit (IETI-1 facility) is built to obtain more than 200 flow instability threshold data. The circuit is composed of two parallel straight channels.
The mentioned paper is a lesson as the experimental procedure and flow instability detection method are concerned (The step-by-step description is given in Section 1.5 with reference to the presented facility with parallel helical heated tubes).
The experimental apparatus comprehends a throttling valve after tube preheater, which introduces a strong localized pressure drop on the feeding line (∆Pb = 30 bar).
Each channel is provided with two valves at inlet (V0 and VΓ) and one valve at outlet (Vv). V0 simulates the reactor flow
distribution orifice. The pressure drop across VΓ is utilized as flow rate signal. Vv is introduced to study the effect of a
pressure loss at channel outlet. In all the experiments these three sets of valves are manually adjusted in two different positions, either fully open (f.o.) or partially closed (p.c.).
A riser section is provided for each channel (destabilizing effect for instability threshold), before the common outlet discharge.
Parallel channel flow instability is studied for the following values of parameters: ¾ three levels of pressure (P): 50 – 30 – 10 bar;
¾ two levels of mass flow rate (w): 266 – 133 kg/h; ¾ different configurations concerning the valve positions;
¾ inlet subcooling from -20% ÷ -30% to ~0 for each set of P, w and valve positions.
For the sake of brevity, threshold data with just a particular configuration of valves are presented in this document. VΓ
(at inlet) and Vv (at outlet) are p.c.; V0 (at inlet) is f.o.. It is worth noticing that the Authors deal with concentrated
LP2.G1 - 9 - CERSE-POLIMI RL-1134/2010 two different values of flow rate are experienced (w1 = 133 kg/h – w2 = 266 kg/h), VΓ and Vv throttling is adjusted in
order to respect always: - ∆PΓ = 10 kPa;
- ∆Pv = 20 kPa (characterization of the valve done with a liquid fluid flowing, i.e. cold water at 20 °C and double
flow rate value).
Parallel channel flow instability thresholds can be presented in a dimensional form, plotting the limit power (at oscillations inception) as a function of inlet subcooling, at different flow rates and pressures (Figure 2-a). It is apparent that threshold power q increases with increasing w and P. Reasoning in terms of power-over-flow ratio (q/w), the curves at different flow rate but equal pressure are quite overlapped (Figure 2-b), confirming the statement of Par. 1.2.1. The most influencing parameter for density wave oscillations appearance is thus q/w, being strictly linked to the exit quality which triggers the whole phenomenon.
Limit power dependence on inlet subcooling is instead complex, but it is enough to confirm the conclusions drawn in Par 1.2.3: increasing the inlet subcooling is stabilizing for high subcooling values, and destabilizing for low subcooling values.
Moreover, the importance of the ratio q/w as regards the instability inception is at the basis of the usage of non-dimensional maps for stability investigations. Working on the Npch - Nsub space, for instance, permits to establish a
stability boundary which is independent on the actual flow rate experienced. This concern is clearly shown in Figure 3, where stability thresholds at the three different pressure values are reported. Stability boundary behaviour at different pressures, finally, is not easily understandable with this kind of map, where the two dimensionless groups should be built such to be insensitive on the pressure level. The stabilizing effect of an increasing pressure is evident considering the constant equilibrium quality line in the upper portion of the boundary: limit power increases with pressure, and limit equilibrium quality increases as well.
0 10 20 30 40 50 60 70 80 -25 -20 -15 -10 -5 0 q [ k W] xin[%]
Limit Power for oscillations inception [VΓ-Vvp.c.]
P=50 bar - w1 P=30 bar - w1 P=50 bar - w2 P=30 bar - w2 P=10 bar - w2 0 100 200 300 400 500 600 700 800 900 1000 -25 -20 -15 -10 -5 0 q /w [kJ/ kg ] xin[%]
Limit Power/Flow for oscillations inception [VΓ-Vvp.c.] P=50bar - w1 P=30bar - w1 P=50bar - w2 P=30 bar - w2 P=10bar - w2
Figure 2 - Influence of flow rate, pressure and inlet subcooling on threshold power. With throttling at inlet (VΓ) and outlet (Vv), according to what it is defined in the text.
LP2.G1 - 10 - CERSE-POLIMI RL-1134/2010 Various valve positions are investigated in the Article. Most significant results are given in Figure 4 (considered the highest level of pressure and mass flow). With respect to the “fully open valves” configuration (blue points), both the stabilizing effect of an inlet concentrated pressure drop and the destabilizing effect of an outlet concentrated pressure drop can be observed. The cases with a throttling both at inlet and outlet (gold and red points) are more unstable rather than the basic case (blue points), because of the stronger effect of a form loss at outlet than at inlet.
1.4 The experimental facility
Investigated experimental facility was built and operated at SIET labs in Piacenza, as an extension of an electrically heated test section used for the investigation of the thermal-hydraulics (two-phase pressure drops – under diabatic and adiabatic conditions – and dryout thermal crisis occurrence) in a helical-coil steam generator tube [17], already expanded to simulate a passive emergency heat removal system with natural circulation [18].
Original test section framed in the facility represents one single helical tube of IRIS SG. Coil diameter (1 m) has been chosen as representative of a mean value of IRIS SG tube, while tube inner diameter (12.53 mm) is the commercially scheduled value nearer to IRIS real value (13.24 mm). The heated tube is thermally insulated by means of rock wool. The thermal losses were already measured via runs with single-phase hot pressurized water flowing inside the steam generator, and estimated as a function of the temperature difference between external tube wall and the environment. Renewed design of the facility for flow instability detection comprised the adding of a second helical tube identical to the first one (same coil diameter, pitch and length), its instrumentation and its insulation with rock wool. The two helices have been connected with common lower and upper header to provide the equal-pressure-drop boundary condition required for the instability inception. The conceptual sketch of the new facility with the two electrically heated parallel helically coiled tubes is depicted in Figure 5.
0 2 4 6 8 10 12 5 10 15 20 25 Nsu b Npch
P=50bar - Mass Flow w2
All Valves f.o. Valve Vv p.c. Valves VG-Vv p.c. All valves p.c. Valve VG p.c.
Figure 4 - Stability maps at different valve position configurations [case with P = 50 bar – w = 266 kg/h]. VG Æ valve at inlet; Vv Æ valve at outlet
0 1 2 3 4 5 6 7 8 5 10 15 20 25 30 Nsu b Npch
Configuration: VΓ (inlet) - Vv(outlet) p.c.
P=50bar - w1 P=30bar - w1 P=50 bar - w2 P=30 bar - w2 P=10bar - w2
Figure 3 - Stability maps at different flow conditions [case with VΓ-Vv p.c.].
LP2.G1 - 11 - CERSE-POLIMI RL-1134/2010 The whole facility is made by a supply section and a test section.
The supply section feeds demineralized water from a tank to the test section, by means of a centrifugal booster pump and a feed-water pump, i.e. a volumetric three-cylindrical pump with a maximum head of about 200 bar driven by an asynchronous three-phases motor. Water is demineralised via an ionic exchanger resin bed, thus obtaining an electrical conductivity value for the fluid of about 1.5 µS/cm. The flow rate is controlled by a throttling valve (V3) positioned downwards the feed water pump and after a bypass line. System pressure control is accomplished by acting on a throttling valve (V4) placed at the end of the steam generator, whose degree of throttle is manually imposed by acting on a pneumatic actuator until the desired pressure is reached.
An electrically heated helically coiled pre-heater is located before the test section, and allows creating the desired temperature at the inlet of the test section. The test section in Figure 5 is electrically heated via Joule effect by DC current. Two distinct, independently controllable and contiguous sections are provided: the first one simulates the subcooling zone and the two-phase zone of the steam generator, while the second one was used in the past [17] to simulate the post dryout and superheating zone.
The possibility of controlling thermal flux in the two zones could allow to roughly simulate the variation in heat flux that occurs in a real once-through steam generator.
Storage tank V1 F T T P P V2 V3 V4 Pump Throttling valve Coriolis mass flow meter Loop pressure control valve Preheater Test section Lower header Upper header Bypass line
Figure 5 - Sketch of the experimental apparatus built for instability investigations on two helically coiled steam generator tubes.
LP2.G1 - 12 - CERSE-POLIMI RL-1134/2010 The main data of the two steam generator coiled tubes are listed in Table 1.
An accurate measurement of the total flow rate is obtained by a Coriolis flow-meter, placed between the pump and the pre-heater. The maximum error is about 0.3%, in the range of the explored flow rates.
The bulk temperatures are measured with a K-class thermocouple drowned in a small well at steam generator inlet and outlet headers. All the measurement devices have been tested and calibrated at the certified SIET labs (SIT certified). The water pressures at inlet and outlet headers are measured by absolute pressure transducers (maximum error of about 0.1%); nine pressure taps are disposed nearly every 4 m along one coiled tube and eight differential pressure transducers (maximum error of about 0.4%) connect the pressure taps.
Electric power is supplied to the steam generator via Joule effect using low voltage (a hundred Volts)-high amperage current. The electric power generator is the coupling of a AC transformer (from 130 kV to 3 kV) with a Chopper that converts alternate current into (nearly) direct current. Electrical power was obtained via separate measurement of current (by a shunt) and voltage drop along the test section by a voltmeter. The uncertainty in steam generator power balances was estimated to be 2.5%.
Just some comments are remarked in the followings, in order to clarify most crucial points for the preparation and execution of the experimental campaign on parallel channel instability.
¾ Test section electrical heating is considered in the current configuration, that is via Joule effect by DC current just on the first section of the two helical tubes (length of 24 m). Hence, a riser unheated section (length of 8 m) is considered. Moving the electrical terminals on the tubes could permit to investigate the influence of riser sections (though this is not a priority for the experimental campaign).
¾ Each tube is provided at inlet with a calibrated orifice (with a differential pressure transmitter) used to measure the flow rate in each channel and to visually detect the instability inception, and with a valve to impose a concentrated pressure drop (stabilizing on the system behaviour). V1 and V2 represent the total stabilizing pressure drops (instrumented orifice + valve) introduced at the inlet of the two helical tubes respectively. ¾ Wall thermocouples are mounted on the two coils to identify the risk of dryout crisis occurrence.
As a matter of fact, it is known [16] that thermal crisis can be reached by increasing the supplied power to get the instability threshold. More in detail, the two values of power q corresponding to flow oscillation threshold and to heat transfer crisis are nearly undistinguishable at high inlet subcooling; the difference increases for low inlet subcooling.
Table 1 - Test section main data.
Tube material SS AISI 316L Inner diameter, d [mm] 12.53 Outer diameter [mm] 17.24 Coil diameter, D [mm] 1000
Coil pitch [mm] 800
Tube length [m] 32
LP2.G1 - 13 - CERSE-POLIMI RL-1134/2010
1.5 Proposed experimental procedure
In order to excite flow unstable conditions starting from stable operating conditions, it has been proposed to gradually increase (by small steps) the electrical power supplied to the heated elements from nominal values up to the appearance of flow instability.
Flow instability power threshold can be experimentally defined as that power corresponding to the smallest permanent and regular flow oscillation, detected by visual observation of the pressure drop recording of the calibrated orifices (within V1 and V2 of Figure 5). An extrapolation toward zero of the oscillation amplitude plotted against the power input can also be used to define the threshold power level.
The approaching to instability inception by small increases of supplied power is preferred rather than changing (reducing) the mass flow rate, since a change in flow rate affects the amount of pressure drops concentrated at the valves before the heated tubes, and because of the strange instability behaviour observed by Yadigaroglu and Bergles [13]. On the other hand, approaching the instability by changing the inlet subcooling (via preheater power) is thoughtless due to the complicated effect that this parameter has on system stability.
The proposed test procedure can be summarized in the following steps: (1) Registration of the gravitational head of the different instruments.
(2) Characterization of the normal behaviour of the system (for instance, check that, at open V1 and V2 valves, the flow rate is reasonably balanced between the two coils).
(3) Impose a defined position of V1 and V2 valves.
(4) Define a pressure level (start from higher pressure toward lower pressure). (5) Impose a value of flow rate.
(6) Impose a value of inlet subcooling by means of the preheater.
(7) Reach the desired pressure level by generating vapour with a power increase. When the desired pressure is obtained, keep the system in a steady-state condition (measurements of temperature, pressure, flow rate and heat input).
(8) The electrical power is progressively increased by a small amount (small steps of 2-5 kW per tube), until sustained oscillations are observed (check that the system pressure remains more or less constant).
(9) Once the instability is recorded, bring the system back to step 6, and change the subcooling. Repeat step 7 up to the instability (same operating pressure).
(10) Once all the subcooling values are tested for a flow rate level, change the flow rate and repeat steps 6, 7 and 8. (11) Once all the flow rate values defined in step 5 are completely explored (every subcooling value), change the
desired pressure level (at least x3) and repeat steps 5 – 9.
(12) Finally, change the valve position (step 3) and repeat the whole procedure (steps 4 – 11).
The proposed procedure is based on a minimization of the actions required on the circuit valves, at the cost of many changes in the pressure level during the tests execution. If this issue is considered more critical, it can be thought to experience the various valve configurations (changing automatically from control room the throttling positions) before leaving each pressure level.
LP2.G1 - 14 - CERSE-POLIMI RL-1134/2010
1.6 Range of explored variables (proposed test matrix)
Before the execution of the experimental activities aimed at the detection of density wave oscillations and at the definition of steam generator instability regions, system valves have been carefully characterized.
Different values of flow rate have been used to record the concentrated pressure drops corresponding to the various closure positions (test carried out separately for each tube, both at cold and hot conditions). Correlating the results, it was possible to compute the form loss coefficients k at the different valve positions, where the measured pressure drop is simply expressed as:
in in G k V k P ρ ρ 2 2 2 1 2 1 = = ∆ 1 (4)
Knowledge of valve loss coefficients is of great importance to compute a pre-test analysis, and to refine on that basis a quantitative test campaign matrix (different throttling of inlet valves are in fact very influencing on the instability threshold).
When studying the influence of the inlet subcooling on the limit power (one of the main goals of the experimental campaign), it is preferable then reasoning in terms of per cent values (i.e., as negative xin) rather than in terms of
temperatures. Fixed ∆Tin correspond in fact to different subcoolings (and different Nsub points) in response to
remarkable changes of pressure (e.g. from 80 bar to 20 bar).
Therefore, considered all the information provided, a reasonably thorough experimental study of flow instability within two parallel heated tubes requires to examine:
¾ 3 levels of pressure: 80 bar, 40 bar, 20 bar
¾ 3 levels of mass flow: in terms of in-tube mass flux, G = 600 kg/sm2
, 400 kg/sm2, 200 kg/sm2 ¾ at least 2 configurations of V1, V2 inlet valves:
k1= - 1 turn to valve closure (basically open inlet valve configuration, with slight pressure drops introduced);
k2= - 2/6 turn to valve closure (partially closed valve configuration, with noticeable pressure drops
introduced);
some runs can be finally carried out with basically closed valves, to demonstrate that risk of parallel channel instability is properly avoided.
¾ up to 5 values of inlet subcooling, such as xin = -20%, -15%, -10%,-7.5%, -5% 2.
The proposed test matrix has been hence built as follows:
1 For the sake of simplicity, the considered valve loss coefficients k have been always referred to the fluid velocity within the test
section tubes.
LP2.G1 - 15 - CERSE-POLIMI RL-1134/2010
Valve Configuration Pressure [bar] Mass Flux [kg/sm2] Subcooling [xin]
k1 80 600 -20% k1 80 600 -15% k1 80 600 -10% k1 80 600 -7.5% k1 80 600 -5% k1 80 400 -20% k1 80 400 -15% k1 80 400 -10% k1 80 400 -7.5% k1 80 400 -5% k1 80 200 -20% k1 80 200 -15% k1 80 200 -10% k1 80 200 -7.5% k1 80 200 -5% k1 40 600 -20% k1 40 600 -15% k1 40 600 -10% k1 40 600 -7.5% k1 40 600 -5% k1 40 400 -20% k1 40 400 -15% k1 40 400 -10% k1 40 400 -7.5% k1 40 400 -5% k1 40 200 -20% k1 40 200 -15% k1 40 200 -10% k1 40 200 -7.5% k1 40 200 -5% k1 20 600 -20% k1 20 600 -15% k1 20 600 -10% k1 20 600 -7.5% k1 20 600 -5% k1 20 400 -20% k1 20 400 -15% k1 20 400 -10%
LP2.G1 - 16 - CERSE-POLIMI RL-1134/2010 k1 20 400 -7.5% k1 20 400 -5% k1 20 200 -20% k1 20 200 -15% k1 20 200 -10% k1 20 200 -7.5% k1 20 200 -5% k2 80 600 -20% k2 80 600 -15% k2 80 600 -10% k2 80 600 -7.5% k2 80 600 -5% k2 80 400 -20% k2 80 400 -15% k2 80 400 -10% k2 80 400 -7.5% k2 80 400 -5% k2 80 200 -20% k2 80 200 -15% k2 80 200 -10% k2 80 200 -7.5% k2 80 200 -5% k2 40 600 -20% k2 40 600 -15% k2 40 600 -10% k2 40 600 -7.5% k2 40 600 -5% k2 40 400 -20% k2 40 400 -15% k2 40 400 -10% k2 40 400 -7.5% k2 40 400 -5% k2 40 200 -20% k2 40 200 -15% k2 40 200 -10% k2 40 200 -7.5% k2 40 200 -5% k2 20 600 -20% k2 20 600 -15% k2 20 600 -10%
LP2.G1 - 17 - CERSE-POLIMI RL-1134/2010 k2 20 600 -7.5% k2 20 600 -5% k2 20 400 -20% k2 20 400 -15% k2 20 400 -10% k2 20 400 -7.5% k2 20 400 -5% k2 20 200 -20% k2 20 200 -15% k2 20 200 -10% k2 20 200 -7.5% k2 20 200 -5%
Resulting on the whole into 90 instability threshold points: for each point, the electrical heating power has to be gradually increased (by small steps) up the detection of flow oscillations.
2 NUMERICAL
INVESTIGATION ON BOILING
CHANNEL
INSTABILITIES WITH
RELAP5 CODE
2.1 RELAP5 background
Two different approaches are possible when studying boiling channel instabilities: the development of simplified analytical models, which are able to provide satisfactory explanations of various thermal-hydraulic phenomena, and the adoption of complex numerical system codes, which permit to provide accurate quantitative predictions. In this frame, the best estimate system code RELAP5 (Reactor Excursion and Leak Analysis Program) was designed for the analysis of all transient and postulated accidents in Light Water Reactor (LWR) systems, including loss-of-coolant accidents (LOCAs) as well as all different types of operational transients. The code is based on a “six-equations” non-homogeneous and non-equilibrium model for the two-phase system, which allows simulating general thermal-hydraulic phenomena.
In the recent years, numerous numerical studies published on DWOs featured the RELAP5 code as the main analysis tool. The majority of works concern with a single boiling channel with an imposed constant pressure drop boundary condition, which is the proper boundary condition to excite the dynamic feedbacks being at the source of the instability mechanism. Among them, Ambrosini and Ferreri [19] performed a detailed analysis about thermal-hydraulic instabilities in a boiling channel using the RELAP5/MOD3.2 code. They investigated a single channel layout with imposed pressures kept constant by two inlet and outlet plena, demonstrating the capability of the RELAP5 system code to detect the onset of DWO instability.
Because of the large amount of literature works already available on the subject, RELAP5 simulations were at first dedicated to the study of a single channel. In particular, we focused on a system configuration in which a large bypass is used to impose the constant pressure drop boundary condition. The bypass solution is typically adopted experimentally
LP2.G1 - 18 - CERSE-POLIMI RL-1134/2010 to impose the constant pressure drop boundary condition on the single heated channel, as depicted in Figure 6. As a matter of fact, the mass flow rate is forced by an external feedwater pump instead of being driven by the pressure difference across the channel. Besides the capability of the code to detect the onset of instability in the bypass configuration, this work aims at gaining experience in simulating boiling channel instabilities with the RELAP5 code, to correctly approach the preparation of the experimental campaign.
In spite of the lack of publications dedicated to the analysis of DWOs in a parallel channel system with the RELAP5 code, a preliminary study to assess the code behaviour has been performed. Even if more work is needed on the subject, some useful information were derived to preliminary analyse the code capabilities to reproduce boiling channel instabilities in a parallel channel system.
Storage Tank Pump Throttling Valve Preheater Pressure Control Valve BY PA SS T E S T SE CT IO N (H eat ed Ch an n el )
Figure 6 - Typical experimental layout adopted for studying single boiling channel instabilities.
2.2 RELAP5 modelling and numerical setting
Typical setup adopted to simulate DWOs in a single boiling channel is presented in Figure 7-b. A single circular pipe with uniform heating along its axis is connected to two inlet and outlet plena kept at imposed pressures, which let the flow rate adjust at the corresponding steady-state value. During dynamic conditions, perturbations in flow rate are thus allowed to freely evolve towards stable or unstable conditions. Local pressure losses at the inlet and at the outlet of the channel, as well as distributed friction losses, are accounted for. The operating pressures and characteristics of the channel analysed by Ambrosini and Ferreri [19] are inspired to a classical BWR subchannel (Table 2). The same values were considered when addressing the bypass configuration, to make easier a comparison of simulation results.
As concerns the bypass configuration, a large bypass tube is connected to the heated test channel, to guarantee a constant pressure drop across the channel. The layout is modelled with the RELAP5/MOD3.3 code connecting two pipe components of different diameter by means of two branches (Figure 7-a). The mass flow rate is provided by a dependent junction, connected directly to the lower branch. Inlet pressure and temperature are fixed using a time-dependent volume. Outlet pressure is imposed by another time-time-dependent volume connected to the upper branch by means of a single junction. Local pressure loss coefficients kin and kex are introduced on the four connections between
branches and pipe components, and simulate the presence of inlet and exit throttling. Pressure drop across the channel is imposed by the exit pressure, the mass flow rate and the characteristic of the channel.
LP2.G1 - 19 - CERSE-POLIMI RL-1134/2010 Table 2 - RELAP5 simulation parameters.
Heated Channel
Diameter [m] 0.0124
Length [m] 3.658
Roughness [m] 2.5·10-5
Operating parameters
Exit pressure [Pa] 7.0·106
Inlet temperatures [°C] 151.3 - 282.3 kin 23 kex 5 a) Lower Branch b) Heated Channel Time-dependent Volume Time-dependent Volume Heat Structure Time-dependent Volume Time-dependent Junction Bypass Heated Channel Heat Structure Single Junction Upper Branch Time-dependent Volume
Figure 7 - RELAP5 nodalization in the two different configurations: a) with a bypass tube; b) with a single channel alone.
The heated channel is subdivided in 48 nodes as in [19], to meet a better comparison of the results. The number of nodes is also selected following other remarks which will be discussed later. Imposed heat flux condition is adopted. The heat structures wherein power generation is accounted are assumed very thin and present high thermal conductivity and low heat capacity to avoid distortions in the imposed thermal flux condition, and to neglect tube wall dynamic behaviour as well. As far as the bypass ratio (Rby=Aby/Ahc) is concerned, the initial value of the bypass diameter is
assumed equal to 10 times the diameter of the heated channel (Rby=100), in order to ensure the constant pressure drop
boundary condition.
The following procedure is adopted to reach the instability boundary for the different operating conditions: at the beginning of each run specific values of exit pressure, mass flow rate and inlet water temperature are selected as initial conditions. Flow circulation in the system starts at zero power, then power generation in the heat structures is increased gradually till the unstable condition is reached. The increase rate is higher at the beginning of the transient, to quickly approach the unstable region, then it is lowered to guarantee an easier detection of the onset of instability.
LP2.G1 - 20 - CERSE-POLIMI RL-1134/2010 Ambrosini and Ferreri [19] performed a large number of calculations to analyze the effect on the results of the different models available in the code, as well as the nodalization and the numerical scheme. Their results were considered the starting point for the analysis in presence of the bypass, in which the same models and numerical settings are adopted. The UVUT (Unequal Velocities Unequal Temperatures) model is adopted, because it is found to be more robust and reliable when compared with the EVET (Equal Velocities Equal Temperatures) model, which is indeed more conservative [19]. The semi-implicit numerical scheme is selected. Calculations rarely crash due to numerical problems, and the introduction of numerical diffusion is limited with respect to the nearly-implicit numerical scheme [19]. To reduce as much as possible the amount of numerical diffusion introduced also with the semi-implicit discretization, a control variable which forces the time step to remain equal to a fixed value of the Courant number has been developed:
Cou
t t= ⋅∆
∆ 0.95 (5)
Finally, a number of nodes equal to 48 is selected as in [19]. Smoother prediction of the stability boundary is assured also in the case of the UVUT model, even though it is less sensitive to variations of the number of nodes.
2.3 Results
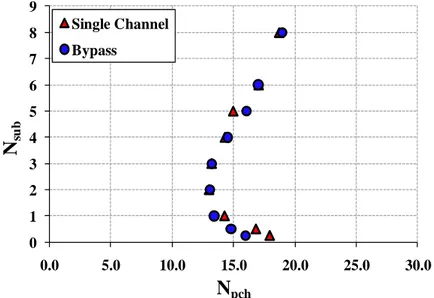
The first set of data were collected adopting a bypass ratio Rby=100 and exploring different inlet temperatures. Figure 8
shows a comparison between the maps obtained with the bypass tube and with the single heated channel.
The pressure drop across the heated channel was taken equal in the two different scenarios. The presence of a large bypass tube does not influence the onset of instability and only small deviations are observed at very low subcooling numbers.
It is important to notice that the criterion to detect the appearance of DWOs is not an exact one, thus it is expected to affect the results introducing some uncertainty. The stability boundary has been detected by the appearance of growing oscillations in the mass flow rate through the heated channel (Figure 9). The system was considered unstable when the oscillations appeared fully developed.
0 1 2 3 4 5 6 7 8 9 0.0 5.0 10.0 15.0 20.0 25.0 30.0
N
su bN
pch Single Channel BypassFigure 8 - Stability map calculated with the bypass tube (Rby=100) compared with the stability map obtained in a single
LP2.G1 - 21 - CERSE-POLIMI RL-1134/2010
Figure 9 - Mass flow rate behaviour in the heated channel during a simulation performed with Nsub=4.
In accordance with literature results [1], the effect of the inlet subcooling on system stability is found to be stabilizing at high subcoolings and destabilizing at low subcoolings. The results of the single channel alone simulations show also a fair agreement with the ones obtained in [19].
The period of oscillations, which is known from literature to grow with the subcooling number, is correctly reproduced by the RELAP5 code with the bypass configuration, as it is shown in Figure 10. The ratio between the period of oscillations and the transit time in the two configurations (single channel alone and with the bypass) is depicted. As expected, this ratio increases with higher inlet subcoolings [19].
The transit time in Figure 10 was calculated with a proper control variable developed in RELAP5, defined as the ratio between the total mass of water and steam in the heated channel and the mass flow rate.
Γ =
∑
= 48 1 i m t (6)Moreover, the transit time of the mixture in homogeneous flow is given by:
⎟ ⎟ ⎠ ⎞ ⎜ ⎜ ⎝ ⎛ ⋅ + ⋅ ⋅ + ∆ ⋅ = ∆ + ∆ = ex f fg fg fg in f x v v ln v q h q h t t t 1 '' ' '' ' 2 1 ρ (7) As it is shown in Figure 11, the two different expressions show the same trend. The analytical transit time is constantly
LP2.G1 - 22 - CERSE-POLIMI RL-1134/2010 0.0 0.5 1.0 1.5 2.0 2.5 3.0 0 2 4 6 8
T/t
N
sub Single Channel BypassFigure 10 - Ratio between the period of oscillations and the transit time in the heated channel with and without the bypass tube. 0.0 0.5 1.0 1.5 2.0 2.5 3.0 0 2 4 6 8
T/
t
N
sub Analytical RELAP5Figure 11 - Ratio between the period of oscillations and the transit time in the heated channel calculated with the analytical expression and with the RELAP5 control variable (with bypass configuration).
2.3.1 Sensitivity study on bypass ratio
The influence of the bypass area on system stability has been investigated performing a sensitivity analysis on the bypass ratio. Bypass ratio was at first reduced to find out the value required to guarantee a constant pressure drop across the heated channel. The results are presented in Figure 12. Halving the bypass ratio (Rby=50) does not modify the
stability of the heated channel. On the contrary, further reduction tends to render the system more stable (stability curves shifted to the right in the Npch-Nsub space).
LP2.G1 - 23 - CERSE-POLIMI RL-1134/2010 Stable region becomes larger when the bypass ratio is reduced to 20, except for low inlet subcoolings, for which the stability boundary is rather unchanged. A last reduction to 10 remarkably widens the stability region. Hence, a bypass ratio at least equal to 20 is needed to maintain properly the constant pressure drop boundary condition.
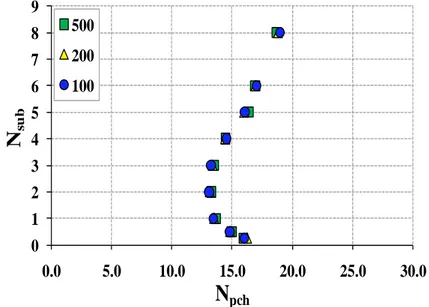
Increasing the bypass ratio (up to 200 and 500 respectively) does not affect significantly the stability of the system. As it is shown in Figure 13, the stability is independent on the bypass ratio for sufficiently large values.
0
1
2
3
4
5
6
7
8
9
0.0
5.0
10.0
15.0
20.0
25.0
30.0
N
su bN
pch10
20
50
100
Figure 12 - Stability maps obtained with different values of the bypass ratio Rby (respectively 100, 50, 20 and 10).
0
1
2
3
4
5
6
7
8
9
0.0
5.0
10.0
15.0
20.0
25.0
30.0
N
su bN
pch500
200
100
Figure 13 - Stability maps obtained with different values of the bypass ratio Rby (respectively 100, 200 and 500).
2.4 Preliminary calculations on parallel channel instabilities
A preliminary study about DWOs in a parallel channel system was made simulating with the RELAP5 code the experimental test section located at SIET labs. The same nodalization developed for the bypass case permitted to easily model the experimental facility only modifying the geometrical parameters of the two channels. The twin channels,
LP2.G1 - 24 - CERSE-POLIMI RL-1134/2010 simulated with two pipe components, are connected with two upper and lower branches. They are inclined to match the height of the test facility, in which the tubes are helically coiled. Pipe components are heated for the first 24 m, where uniform imposed heat flux is considered. The heated length is subdivided in 48 nodes. In the last 8 m, which represent the riser section, no heat is supplied. 8 nodes constitute the riser section. Inlet pressure and temperature are fixed using a time-dependent volume, whereas the mass flow rate is imposed by a time-dependent junction. Local pressure loss coefficients kin are introduced on the two connections between lower branches and pipe components, to simulate the
presence of inlet valves, namely V1 and V2 in Figure 5. Also the two valves V3 and V4, located respectively before the lower branch and after the upper branch, are simulated, although they seem to have no influence on the system stability. Twin channel characteristics are resumed in Table 3.
Table 3 - RELAP5 twin channels parameters. Channel Parameters Heated Length [m] 24 Riser Length [m] 8 Total Length [m] 32 Height [m] 8 Diameter [cm] 1.25 Inclination Angle [°] 14.48 Roughness [m] 3.08·10-6
Preliminary simulations explored different inlet subcoolings for fixed values of system pressure, mass flow rate and inlet throttling (Table 4).
Table 4 - RELAP5 system parameters. System Parameters
Inlet Temperatures [°C] 175.43 – 250.27
Exit Pressure [MPa] 4
Mass Flow Rate [kg/h] 261
kin 20
The stability map is shown in Figure 14. The onset of instability is found for values of the phase change number Npch
which are higher if compared with the results obtained in single channel configuration. On the other hand, they are consistent with the system stabilization obtained reducing the bypass ratio in Par.2.3.1. Moreover, the effect of subcooling seems to be always stabilizing, except for very low subcooling numbers, at which only a slight destabilization effect is observed.
LP2.G1 - 25 - CERSE-POLIMI RL-1134/2010
0
1
2
3
4
5
6
7
8
9
25
30
35
40
45
N
pc hN
subFigure 14 - Stability map calculated with parallel channels using the parameters resumed in Table 3 and Table 4. The study on RELAP5 code capabilities to correctly reproduce DWOs in a parallel channel system is far from completion and is currently underway. More work is needed focusing on different values of system pressure, mass flow rate and valve position. In addition, a sensitivity analysis is required to investigate the effect on results of various code models and settings, in particular concerning the nodalization. All these issues will be fully addressed after the completion of the experimental campaign at SIET labs.
3 PRE-TEST ANALYSIS WITH ANALYTICAL LUMPED PARAMETER MODEL
This Section describes the development of an analytical dynamic model aimed at a theoretical prediction of the instability thresholdsbes. Realized modelling is based on the work of Muñoz-Cobo et al. [20], who studied out-of-phase oscillations (DWO kind) between parallel channels of distinct core regions of a BWR reactor. Proper modifications have been introduced to fit the modelling approach with steam generator tubes with imposed thermal power (representative of the experimental facility conditions).
The developed model is based on a lumped approach (0-D) for the two zones characterizing a single boiling channel, that are single-phase region and two-phase region, divided by the boiling boundary (where the fluid reaches saturation temperature). Differential conservation equations of mass and energy are considered for each region, whereas momentum equation is integrated along the whole channel. Wall dynamics is accounted for in the two regions following lumped wall temperature dynamics by means of the respective heat transfer balances. Instability can be studied both for a single boiling channel and for two parallel channels. The respective boundary conditions are introduced as closure relationships, i.e. constant-pressure-drop (∆P = const) for the single channel, and equal-pressure-drop (same ∆P(t)) for the two parallel channels. The main hypotheses of the provided modelling are:
a) homogenous two-phase flow model;
b) uniform heating along the channel (linear increase of quality with tube abscissa z); c) system of constant pressure (pressure term is neglected within the energy equation).
LP2.G1 - 26 - CERSE-POLIMI RL-1134/2010
3.1 Mathematical modelling
Modelling equations are derived by the continuity of mass and energy for a single-phase fluid and a two-phase fluid, respectively.
Single-phase flow equations read: 0 = ∂ ∂ + ∂ ∂ z G t ρ (8)
( ) ( )
' '' Q z Gh t h = ∂ ∂ + ∂ ∂ ρ (9) Two-phase mixture is dealt according to homogeneous flow model. By defining the homogeneous density ρH and thereaction frequency Ω [4][21] as follows:
( )
fg f g f H v x v + = + − =ρ 1 α ρ α 1 ρ (10) fg fg AHh v t Q t) () ( = Ω (11) one gets: 0 = ∂ ∂ + ∂ ∂ z G t H ρ (12) ) (t z j =Ω ∂ ∂ (13) Momentum equation is then accounted for by integrating the pressure balance along the channel:frict H grav acc P P P t P dz t t z G ∆ − ∆ − ∆ − ∆ = ∂ ∂
∫
0 ) ( ) , ( (14)3.1.1 Mass-energy model in the two-phase region
The continuity equation for a homogeneous two-phase mixture – Eq.(13) – is integrated to calculate the average mass flux G2φ in the two-phase region (to be used for the calculation of two-phase frictional pressure drops). The well
known expression of the total volumetric flux is reminded: ) , ( 1 2 z t G x x j f g φ ρ ρ ⎟⎟⎠ ⎞ ⎜ ⎜ ⎝ ⎛ − + = (15)
Integrating Eq.(10) from the boiling boundary position zBB(t) to an arbitrary position z, and accounting for Eq.(15), one
obtains after some algebra:
[
]
fg f in f BB v t z x v t G v t z z t t z G ) , ( ) ( ) ( ) ( ) , ( 2 + + − Ω = φ (16)LP2.G1 - 27 - CERSE-POLIMI RL-1134/2010 Eq.(16) can be then used to calculate the mass flux at channel exit G (with z=H), and the average mass flux in the ex
two-phase region G2φ (by applying the theorem of integral average):
[
]
fg ex f in f BB ex v x v G v z H G + + − Ω = (17)[
]
[
]
⎟ ⎟ ⎠ ⎞ ⎜ ⎜ ⎝ ⎛ + ⎟ ⎟ ⎠ ⎞ ⎜ ⎜ ⎝ ⎛ Ω − − + − Ω = − =∫
ex f fg fg ex BB in fg ex f fg ex BB H z BB x v v v x z H G v x v v x z H dz t z G z H G BB 1 ln ) , ( 1 2 2φ φ (18)3.1.2 Integration of momentum equation
Within Eq.(14), ∆P(t) is the difference between the inlet and outlet channel pressure:
ex in P P t P = − ∆ ( ) (19)
The accelerative term of pressure drops ∆Pacc can be represented as:
(
)
(
)
f in f ex ex g ex ex ex acc G x x G P ρ ρ α ρ α 2 2 2 2 1 1 − ⎥ ⎥ ⎦ ⎤ ⎢ ⎢ ⎣ ⎡ − − + = ∆ (20)The gravitational term of pressure drops ∆Pgrav can be represented as:
( )
f[
BB]
g[
BB]
BB f grav g z g H z g H z P = + − − + − ∆ ρ 1 α ρ αρ (21)The frictional term of pressure drops ∆Pfrict can be represented as:
f ex ex ex f BB f in BB in frict G k G D z H f G D z f k P ρ ρ ρ φ 2 2 2 2 2 2 2 2 2 Φ + Φ − + ⎟ ⎠ ⎞ ⎜ ⎝ ⎛ + = ∆ (22)
single-phase two-phase distributed two-phase concentrated at outlet (concentrated at inlet +
distributed)
Left hand side term of the pressure drop balance – Eq.(14) – is treated by splitting the integration into two intervals, from 0 to the boiling boundary zBB, and from zBB to the channel length H, and applying for the second interval the
Leibniz rule: dt dz G dz G dt d dt dG z dz t G BB in H z H in BB BB + + = ∂ ∂
∫
∫
2φ 0 (23) Mass flux integral along two-phase region is computed according to Eq.(18), giving:dt d b dt dG b dt dx b dt dz b dz G dt d BB ex in H zBB Ω + + + =
∫
2φ 1 2 3 4 (24)LP2.G1 - 28 - CERSE-POLIMI RL-1134/2010
[
]
[
]
⎟ ⎟ ⎠ ⎞ ⎜ ⎜ ⎝ ⎛ − − Ω ⎟ ⎟ ⎠ ⎞ ⎜ ⎜ ⎝ ⎛ + + − Ω − = in ex fg BB ex fg f ex f fg fg ex BB G x v z H x v v x v v v x z H b1 2 ln 1 2 (25)[
]
[
]
[
]
[
]
(
)
[
]
⎟⎟ ⎠ ⎞ ⎜ ⎜ ⎝ ⎛ Ω − − + − + ⎟ ⎟ ⎠ ⎞ ⎜ ⎜ ⎝ ⎛ − − Ω ⎟ ⎟ ⎠ ⎞ ⎜ ⎜ ⎝ ⎛ + − + − Ω − = fg ex BB in ex fg f ex BB f in ex fg BB ex f fg ex fg BB f ex fg BB v x z H G x v v x z H v G x v z H x v v x v z H v x v z H b ... ... 2 1 ln 2 2 2 2 (26)[
]
⎟ ⎟ ⎠ ⎞ ⎜ ⎜ ⎝ ⎛ + − = ex f fg ex fg BB f x v v x v z H v b3 ln 1 (27)[
]
⎟ ⎟ ⎠ ⎞ ⎜ ⎜ ⎝ ⎛ ⎟ ⎟ ⎠ ⎞ ⎜ ⎜ ⎝ ⎛ + − − = ex f fg ex fg f ex fg BB x v v x v v x v z H b 1 ln 1 2 4 (28)Finally, the equation governing the rate of change of mass flux at the inlet of the channel is obtained substituting Eq.(24) into Eq.(14):
(
)
(
)
dt d b dt dx b dt dz b G P P P t P dt dG z b BB ex in frict grav acc in BB Ω − − + − ∆ − ∆ − ∆ − ∆ = + 1 2 4 3 () (29)This equation permits to know the dynamics of the flow rate entering the respective channel, once they are defined: i. the dynamics of the boiling boundary zBB;
ii. the dynamics of the exit quality xex;
iii. the dynamics of the reaction frequency Ω (from heated wall model);
3.1.3 Boiling boundary dynamics
Boiling boundary dynamics can be easily obtained by integrating the energy equation – Eq.(9) – in the single-phase region [14]:
( )
( )
∫
∫
⎥ = ∂∂ ⎦ ⎤ ⎢ ⎣ ⎡ ∂ ∂ − BB BB z z ch dz t h dz z Gh V Q 0 0 ρ (30) Leibniz rule is applied to the right hand size term of Eq.(30). The strong hypothesis that local enthalpy changessimultaneously at all the axial locations (with average value h=
(
hin +hf)
2) is assumed. It is just mentioned that this approximation is reasonable at low frequency.Integrating Eq.(30) and after some algebra, one obtains:
(
)
8 2 2 b V h h Qz G dt dz f ch in f BB f in BB = − − = ρ ρ (31)LP2.G1 - 29 - CERSE-POLIMI RL-1134/2010 3.1.4 Exit quality dynamics
Exit quality dynamics is obtained from the formula that relates the void fraction α to the quality, with homogenous flow model:
(
)
x x 1 1+ − = γ γ α (32) where: g f f g v v ρ ρ γ = = (33)The average void fraction α is computed as:
(
)
(
(
)
)
⎥⎦ ⎤ ⎢ ⎣ ⎡ − + − − − = =∫
ex ex t x ex x x dx t x ex 1 1 ln 1 1 1 1 ) ( 1 () 0 γ γ γ γ α α (34)If Eq.(34) is derived with respect to time, and two-phase mass conservation equation – Eq.(12) –is integrated along the boiling region, one has:
dt dx b dt d ex 5 = α (35)
(
)
[
]
dt dz z H z H G G dt d BB BB BB f g ex in − + − − − = α ρ ρ α (36) with:(
)
(
(
)
)
(
(
)
)
⎥⎦ ⎤ ⎢ ⎣ ⎡ + + − − + − − − = ex ex ex ex x x x x b ln1 1 1 1 1 12 5 γ γ γ γ γ (37) Rearranging Eqs.(34), (35), (36), the dynamics of the exit quality is finally obtained:9 b dt dxex = (38) where: 8 7 6 9 b bb b = + (39) with:


![Figure 3 - Stability maps at different flow conditions [case with V Γ -V v p.c.].](https://thumb-eu.123doks.com/thumbv2/123dokorg/5591068.67345/11.892.84.430.321.604/figure-stability-maps-different-flow-conditions-case-γ.webp)


![Table 3 - RELAP5 twin channels parameters. Channel Parameters Heated Length [m] 24 Riser Length [m] 8 Total Length [m] 32 Height [m] 8 Diameter [cm] 1.25 Inclination Angle [°] 14.48 Roughness [m] 3.08·10 -6](https://thumb-eu.123doks.com/thumbv2/123dokorg/5591068.67345/25.892.252.643.428.643/channels-parameters-channel-parameters-length-diameter-inclination-roughness.webp)
