ALMA MATER STUDIORUM - UNIVERSITÀ DI BOLOGNA
SCUOLA DI INGEGNERIA E ARCHITETTURA CAMPUS DI CESENA
CORSO DI LAUREA MAGISTRALE IN INGEGNERIA BIOMEDICA
TESI DI LAUREA
in
Bioingegneria molecolare e cellulare LM
PHAGE THERAPY: A SOFTWARE SYSTEM FOR PHAGE QUANTIFICATION
AND
KINETIC MODEL INFERENCE
Sessione III
Anno Accademico 2013/2014 CANDIDATA:
Nan Papili Gao
RELATORE: Prof. Emanuele D. Giordano
CORRELATORE: Prof. Alfonso Jaramillo
1
Abstract
One of the most serious problems of the modern medicine is the growing emergence of antibiotic resistance among pathogenic bacteria. In this circumstance, different and innovative approaches for treating infections caused by multidrug-resistant bacteria are imperatively required. Bacteriophage Therapy is one among the fascinating approaches to be taken into account. This consists of the use of bacteriophages, viruses that infect bacteria, in order to defeat specific bacterial pathogens. Phage therapy is not an innovative idea, indeed, it was widely used around the world in the 1930s and 1940s, in order to treat various infection diseases, and it is still used in Eastern Europe and the former Soviet Union. Nevertheless, Western scientists mostly lost interest in further use and study of phage therapy and abandoned it after the discovery and the spread of antibiotics. The advancement of scientific knowledge of the last years, together with the encouraging results from recent animal studies using phages to treat bacterial infections, and above all the urgent need for novel and effective antimicrobials, have given a prompt for additional rigorous researches in this field. In particular, in the laboratory of synthetic biology of the department of Life Sciences at the University of Warwick, a novel approach was adopted, starting from the original concept of phage therapy, in order to study a concrete alternative to antibiotics. The innovative idea of the project consists in the development of experimental methodologies, which allow to engineer a programmable synthetic phage system using a combination of directed evolution, automation and microfluidics. The main aim is to make “the therapeutics of tomorrow individualized, specific, and self-regulated” (Jaramillo, 2015). In this context, one of the most important key points is the Bacteriophage Quantification. Therefore, in this research work, a mathematical model describing complex dynamics occurring in biological systems involving continuous growth of bacteriophages, modulated by the performance of the host organisms, was implemented as algorithms into a working software using MATLAB. The developed program is able to predict different unknown concentrations of phages much faster than the classical overnight Plaque Assay. What is more, it
2
gives a meaning and an explanation to the obtained data, making inference about the parameter set of the model, that are representative of the bacteriophage-host interaction.
3
This thesis is dedicated to my parents.
4
Table of contents
Abstract ... 1
List of Figures ... 7
Introduction ... 10
1 The protagonists of Bacteriophage therapy ... 11
1.1 Bacteria ... 11
1.1.1 Bacterial growth ... 12
1.1.2 Escherichia Coli as phage host ... 14
1.2 Bacteriophages ... 16
1.2.1 Morphology of bacteriophages ... 16
1.2.2 Classification of bacteriophages ... 17
1.2.3 T7 Bacteriophages ... 18
1.3 Comparison between bacteriophage therapy and antibiotics 19 1.4 Overview of the presented research ... 21
2 Phage quantification and parameters inference ... 26
2.1 The initial idea of the project ... 26
2.2 Models for the bacteriophage-host interactions ... 27
2.2.1 Model formulations ... 28
2.2.2 The first data and the final model ... 31
3 Materials and methods ... 34
3.1 Experimental methods ... 34
3.1.1 Enumeration of bacteria ... 34
3.1.2 Enumeration of bacteriophage particles ... 36
5
3.1.4 Phage-host interaction experiment ... 38
3.1.5 Optical density - CFU/mL calibration... 42
3.1.6 Definition of delay model parameters ... 43
3.2 Software implementation ... 50
3.2.1 Plot and summary of the OD measurement results ... 50
3.2.2 Plot and summary of the OD measurement results ... 53
3.2.3 First fitting attempt and parameter research... 55
3.2.4 Final parameter optimization. ... 58
3.2.5 Model prediction ... 62
4 Results and Discussion ... 66
4.1 CFU/mL ... 66
4.2 PFU/mL ... 67
4.3 MOI... 68
4.4 A1mainPLOT.M ... 71
4.5 A2odCFUcalibration.m ... 72
4.6 A3mainFIT.m and A4mainCROSS.m ... 74
A.7 Experimental parameters ... 75
4.8 Comparison between experimental and model optimized parameter values ... 80
4.9 A5mainPREDITCION.m-Validation step ... 80
5 Conclusion and future directions ... 83
5.1 Conclusion ... 83 5.2 Future directions ... 83 Appendix-Matlab Codes ... 86 1 A1mainPLOT.m ... 86 1.1 sigmFITdata.m ... 92 1.2 sigmoide.m ... 94 A2odCFUcalibration.m ... 95
6 3 A3mainFIT.m ... 97 3.1 helper.m ... 101 3.2 cairns.m ... 102 3.3 MyEventFunction.m ... 103 A4mainCROSS.m ... 104 4.1 helper4.m ... 107 5 A5mainPREDICTION.m ... 108
6 Other MATLAB code used: ... 112
6.1 rgb.m. ... 112
6.2 herrorbar.m ... 112
7
List of Figures
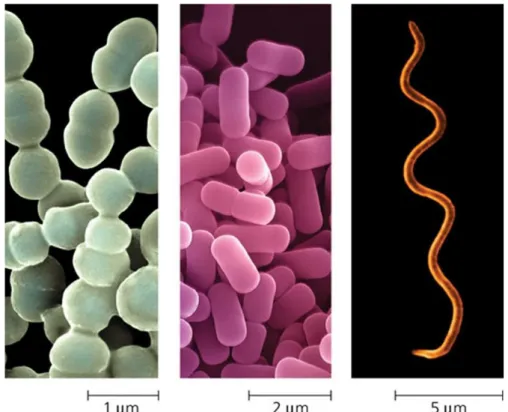
Figure 1: Most bacteria have diameters in the range of 1 µm
(micrometre) to 5 µm. From left to right: Spherical (cocci) bacteria, rod-shaped (bacilli) bacteria, Spiral bacteria.
(http://www.ppdictionary.com/gnbac.htm) ... 11 Figure 2: Bacteria during the process of binary fission.
(http://www.sflorg.com/sciencenews/scn061606_01.html) ... 12 Figure 3: The typical bacterial growth curve. (Alcamo I. Edward, 2001)
... 14 Figure 4: Difference between F-positive (on the left) and F-negative (on the right) cells. (http://leavingbio.net/bacteria%20page.htm) ... 15 Figure 5: The typical structure of a bacteriophage.
(http://en.wikipedia.org/wiki/Bacteriophage) ... 16 Figure 6: The lytic cycle of a T7 bacteriophage.
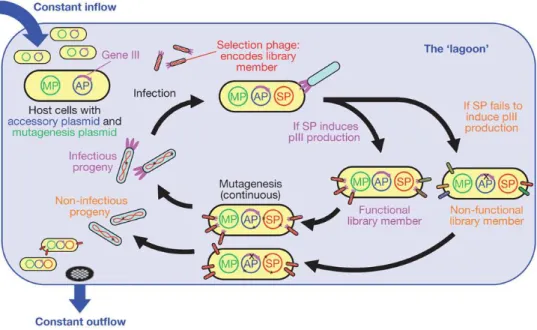
(http://textbookofbacteriology.net/phage.html) ... 18 Figure 7: Overview of the PACE system.
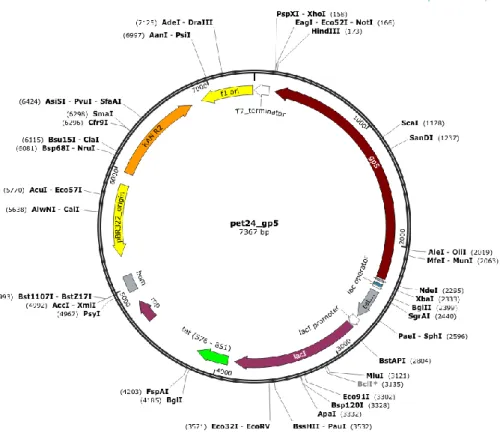
(http://www.nature.com/nature/journal/v472/n7344/fig_tab/nature0992 9_F1.html) ... 23 Figure 8: The accessory plasmid pet24_gp5 with Kanamycin resistance.
... 24 Figure 9: Phage and host evolution. ( Hassall, J., Jaramillo, A. (2014).
Engineering synthetic bacteriophage cocktails. Poster, University of Warwick) ... 25 Figure 10: Optical density measurement over time of the concentration
of bacteria infected by different dilution of phages. ... 32 Figure 11: Serial dilution.
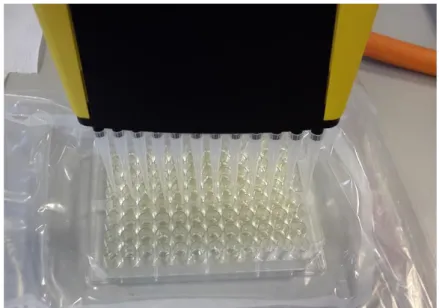
(http://2014.igem.org/Team:CSU_Fort_Collins/Notebook/KillSwitch/S ep) ... 35 Figure 12: Infinite® F500 Tecan microplate reader ... 39
8
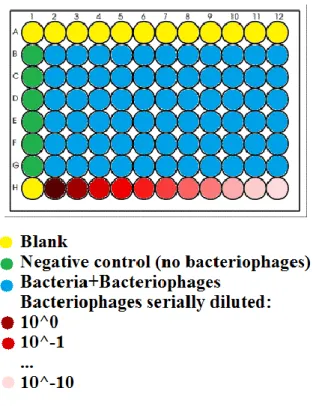
Figure 13: Standard disposition in a 96-well plate. ... 40 Figure 14: The use of a multichannel pipette for the dispensation of
phages and medium in the cells. ... 41 Figure 15: Log10 of the cell number over time.
http://colinmayfield.com/biology447/modules/intro/bacterialgrowthrate. htm ... 44 Figure 16: a-Latent period experiment on the stir plate. b- Double
filtering. ... 47 Figure 17: Standard protocol for the OD600 measurement in a microplate
reader. ... 51 Figure 18: Example of a logistic function (red) and an “inverted”
logistic function (blue). ... 52 Figure 19: A template for the OD-CFU/mL calibration results. X=OD;
Y=CFU/mL. ... 53 Figure 20: a-Matlab Curve Fitting application. b-Matlab Ginput
command. ... 54 Figure 21: The hold-out data split.
(http://scott.fortmann-roe.com/docs/MeasuringError.html) ... 58 Figure 22: K-fold Cross Validation with k=3 and dataset of 30
elements.
(http://homepages.inf.ed.ac.uk/pmartin/tutorial/case_studies.html) ... 59 Figure 23: The leave one out split. Every fold represents only one
sample and k=number of samples.
(https://www.packtpub.com/books/content/learning-how-classify-real-world-examples)... 59 Figure 24: Scatter plot of the variables X and Y.
(http://math.tutorvista.com/statistics/correlation-and-regression.html) 63 Figure 25: Bacterial colonies after an overnight incubation at 37°C. ... 66 Figure 26: Viral Plaques after an overnight incubation at 37°C. Plaques
are circular and clear zones formed in a lawn of cells due to lysis by phage. ... 67 Figure 27: Percentage of infected cells at different MOI. ... 68
9
Figure 28: Curves with the same phage dilution (the same colour) but
with different starting concentration of cells. X=time; Y=OD. ... 70
Figure 29: Curves after normalization, every colour represents a different dilution of phage. Solid lines: starting OD (0.2) value achieved directly from the growth of a low bacterial concentration (0.04). Dotted lines: starting OD (0.2) value achieved diluting a high bacterial concentration (0.7). ... 70
Figure 30: The plot over time of a single replicate with all its samples. ... 71
Figure 31: The command window of A1mainPLOT.m... 71
Figure 32: The summary of the data in mean curves. Each black line represents the standard deviation of the respective curve... 72
Figure 33: OD-CFU/mL calibration results. ... 73
Figure 34: The plot of the linear fitting equation... 73
Figure 35: The curve fitting with the optimized parameter set. ... 75
Figure 36: Experimental growth rate. ... 76
Figure 37: One-step growth for the Latent Period determination. ... 77
Figure 38: One-step growth for the Binding Rate determination. ... 78
Figure 39: Decay Rate Experiment... 79
Figure 40: The results of the prediction in the command window. ... 81
Figure 41: Examples of the prediction for different mean curves. ... 81
Figure 42: The variability for the samples of every phage dilution. ... 82
Figure 43: The curve fitting results of the interaction between MG1655 and T7∆gp5. ... 84
Figure 44: An example of the growth curve as result of the interaction of 100 cells and 10 phages. ... 85
10
Introduction
Phage therapy is the use of bacteriophages, also known as phages, as antimicrobial agents for the treatment of pathogenic bacteria and other problems. In recent years, the recognition of a phenomenon antibiotic resistance as a major healthcare issue has led to renew interest in alternative therapies including bacteriophage therapy (Merril & Adhya, 2003; Hanlon GW, 2007). The project of Professor Alfonso Jaramillo’s laboratory at the University of Warwick is part of this research orientation. In particular, its main purpose is the continuous production and directed evolution of synthetic bacteriophage cocktails using techniques and technologies that come from Biology, Chemistry and Engineering. In this context, one of the issues and urgencies is the phage quantification, in other words, the determination of the phage concentration. The classical method for the count of the number of phages, or simply the Phage Titer, is the Bacteriophage Plaques Assay. However, in order to have some results with this technique, it is necessary to await up to 24 hours.
In this thesis, a delay model was implemented and solved in Matlab environment, in order to obtain a faster prediction and quantification of a specific unknown concentration of phages and to make inference about the model parameters. The first chapter provides a succinct description of bacteria and bacteriophages, the basic interactions among them and the reason why the scientific research has focused the attention again on the phage therapy. In the second chapter, mathematical models which represent the dynamics of Bacteriophage-Host interaction are described in detail. The experimental techniques adopted and the architecture of the software implementation are examined in the third chapter. The experimental details and results are reported in the fourth chapter. Finally, the conclusion of the work are summarised in the last chapter.
11
Chapter 1:
1 The protagonists of Bacteriophage
therapy
1.1 Bacteria
Due to the presence of a rigid wall, bacteria maintain a definite shape. However, bacteria come in a wide variety of shapes, sizes and structures and most of them are very small, in the order of a few micrometers (10-6 meters). The most common shapes are the rod-like (Bacillus), the spherical (Coccus), and the spiral (Spiral) (Figure 1).
Figure 1: Most bacteria have diameters in the range of 1 µm (micrometre) to 5 µm. From left to
right: Spherical (cocci) bacteria, rod-shaped (bacilli) bacteria, Spiral bacteria. (http://www.ppdictionary.com/gnbac.htm)
12
A second major criterion for distinguishing bacteria is based on the cell wall structure. Using a series of stains and reagents called the Gram stain, the cells wall can give different staining characteristics. In particular, with this method of differentiation, bacteria that have a thin layer and an outer membrane stain red are called Gram negative while bacteria with a thicker wall layer, lacking the outer membrane, stain violet are called Gram positive.
1.1.1 Bacterial growth
Most bacteria share one major characteristic: they reproduce by an asexual process called “binary fission” (Figure 2). This means that the cell elongates and grows to about double its original size and then splits, after the equal division of the nuclear materials, into two genetically identical daughter cells called clones.
Growing bacteria on a solid surface as agar on a Petri dish, it is possible to distinguish different colonies. A colony is composed by all the progeny of a single original cell.
Figure 2: Bacteria during the process of binary fission.
(http://www.sflorg.com/sciencenews/scn061606_01.html)
It is simple to note that the mathematical series describing bacterial growth is: 1, 2, 4, 8, 16, etc. It can be also written as a series in base 2: 20, 21, 22, 23, 24, etc. For this reason, bacteria show an exponential growth since the number that increases in the series is the exponent. In reality, exponential growth is only one phase of the bacterial life cycle.
13
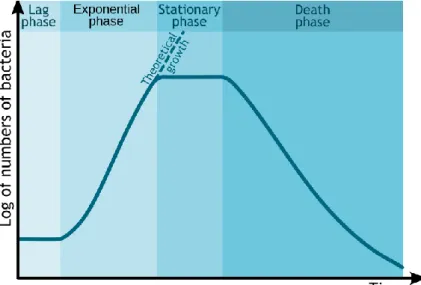
When a given number of bacteria is inoculated in a close system (or batch culture), like a test tube with fresh medium, it is possible to monitor the population growth trend over time. The graph that plots cell number versus time is called bacterial growth curve and usually the cell number is expressed as a log. In a growing culture, the plot gives a characteristic curve in which four phases of the bacterial growth cycle are distinguished: lag phase, exponential (log) phase, stationary phase, and death phase (Figure 3).
The lag phase is the first phase observed. Immediately after inoculation of bacteria into a new growth medium, there is no change in the cell number. However, the population can grow in volume or mass, synthesizing proteins, RNA, etc., and increase in metabolic activity in preparation for the cell division. The lag phase may be short or very long; its duration depends on several factors including recovery time necessary after the shock and/or damage in the transfer; time required for the production of division factors; and the quantity of the starting inoculum.
During the second phase called exponential or log phase, the cells begin DNA replication and shortly after they divide by binary fission. This is the period where the cells can grow most quickly, with a geometric progression. The time necessary for the culture to double is called “generation (or doubling) time”. This is represented as a fairly constant rate and it can be easily obtained from the graph. The exponential growth leads to rapidly increasing population but it cannot last forever in a batch culture because of the exhaustion of available nutrients; accumulation of end products and inhibitory metabolites; lack of “biological space” due to the increase of the population density.
The third phase in the bacterial growth is the stationary phase, that is not necessarily a period of quiescence. During this phase bacteria can divide slowly for a time, but soon stop dividing completely. Viable cells counted maintain a slow metabolic activity; if they are diluted into fresh medium they can quickly adopt again an exponential growth.
In the last phase, if there is no addition of new medium, the number of viable cells progressively decreases. Like the log phase, the death phase follows an exponential trend and within hours the
14
culture may not have any living cells. It is important to underline that most of dead bacteria look identical to live cells, so normal spectrophotometer measurements or microscopic count are not an indication of the observation of live cells. Hence, in order to have a culture with the maximum number of viable cells, it is best to grow bacteria only until early stationary phase and then refresh them with new medium.
The duration of the phases of the growth curve can be slightly different for different conditions of pH, oxygen, salt concentration, temperature, nutrients and for different types of bacteria.
Figure 3: The typical bacterial growth curve. (http://en.wikipedia.org/wiki/Bacterial_growth)
1.1.2 Escherichia Coli as phage host
Escherichia Coli (or simply called E. Coli) is a gram negative, rod-shaped bacterium. It is a common inhabitant of the lower intestinal part of man and warm-blooded animals. Most strains of E. Coli are harmless and they are part of the normal microflora of the gut. Their principal jobs are the suppression of harmful bacteria and the production of vitamins. Nevertheless, some species of E. Coli can be responsible of foodborne illness in their hosts.
In this project, a particular strain of E. Coli was adopted as bacteriophage host. There are many reasons that can support this
15
choice. Firstly, in the last 60 years E. Coli has been the subject of intensive research and now it is the most widely studied prokaryotic organism. In particular, it is considered as important host specie in Biotechnology and Biology where it is commonly used for the manipulation of recombinant DNA. Secondly, this type of bacteria can survive outside the body, also at freezing temperatures, so they can easily grow in a laboratory environment. Lastly, E. Coli represents a powerful model system thanks to its ability to grow in chemically prepared media and its high grow rate. Indeed, under favourable conditions of temperature, pH, etc., its doubling time is roughly 20-30 minutes.
Another important point to highlight is that the bacterial strain chosen as phage host is an F- (F minus) mutant. Usually, some E. Coli strains can carry an F-plasmid or also called fertility factor, because thanks to the production of the sex pilus, the bacterial conjugation can take place. It is an episome, in other words a plasmid that can integrate itself into bacterial chromosome by homologous recombination. There can be only one copy of the F-plasmid in a given bacterium and bacteria that possess a copy are called F-positive or F+ (F plus) while cells that lack F-plasmid are called F-negative or F- (F minus) (Figure 4). In order to avoid biofilm creation, a mutant F- strain of E. Coli was adopted in this work.
Figure 4: Difference between F-positive (on the left) and F-negative (on the right) cells.
16
1.2 Bacteriophages
During the 1890s, many bacteriologists had observed something that seemed to limit bacterial growth and activity. In particular the British Ernest Hanbury Harkin reported the presence of an unknown substance with an evident antibacterial activity against Cholera disease in the waters of rivers in India (Harkin,1896). But the official discover of Bacteriophages occurred only in 1915, when the English Frederick Twort observed a growing bacterial culture killed by an small agent and hypothesized that it could be a virus. The name Bacteriophage was coined by a Canadian biologist called Félix d’Hérelle two years later, in 1917, when he discovered “an invisible, antagonistic microbe of the dysentery bacillus” (d’Herelle, 1917). The meaning of the term “Bacteriophage” is “bacteria-eater” from the Greek word “phagein” which means “to devour”. So Bacteriophages, also known as phages simply, are viruses that can attack and kill bacteria. They are parasites and for this reason they need a bacterial host in order to replicate themselves. Phages, like bacteria, are easily findable in nature. For instance, they can be isolates from sewage, soil and feces.
1.2.1 Morphology of bacteriophages
17
It is possible to find phages with many different sizes and shapes but many of them share some common features. Like other viruses, bacteriophages are simple organisms which consist of a head, or capsid, and a tail (Figure 5). The capsid is composed by one or more proteins and its job is to coat and protect the genetic material (nucleic acid) that may be either DNA or RNA, double- or single- stranded. Most phages have also a tail that is a narrow tube indispensable for the viral DNA injection in bacterial hosts. Some of more complex phages have one or more tail fibers which ease the coupling of the phage to a bacterial cell.
1.2.2 Classification of bacteriophages
A wide range and variety of phages exists in nature, they can be classified in at least 12 different groups considering several factors such as viral morphology, genome type, auxiliary structures and their host preference. Bacterial viruses are very specific; they may infect only one or a limited number of bacteria. Therefore, they are usually named according to the bacteria group, strain that they infect. For instance, phages that infect the bacterium E. Coli are called coliphages.
A second criterion for the classification of bacteriophages is based on how they infect host cells and reproduce themselves. Indeed, it is possible to distinguish two principal categories of phages according to their life cycle: lytic (virulent) or lysogenic (temperate). The main difference between these two types of cycle is that during a lytic infection, after the injection of the genetic material into the host, phages multiply and kill the cell by lysis in order to release new viruses. Conversely, during the lysogenic cycle, phages are able to include their DNA or RNA into the cell chromosome and replicate it without bursting the host. Only the lytic phages are a good choice for developing therapeutic phage preparation because lysogenic phages may not destroy bacteria immediately and in addition they may transfer virulence genes and those mediating antibiotic-resistance to other bacteria (Sandeep, 2006).
18
1.2.3 T7 Bacteriophages
T7 phages are also called coliphages in so far as they can infect most strains of E. Coli. Their genetic material is composed by double-stranded DNA and this viral chromosome is coated and protected by a protein capsid. In addition to the head, T7 phages also possess a tail and some auxiliary structures. Bacteriophage T7 was discovered in 1945 and as other six members of the group T-phages, it has a lytic life cycle because it always brings about the death of its hosts by lysis after the infection (Figure 6).
Figure 6: The lytic cycle of a T7 bacteriophage. (http://textbookofbacteriology.net/phage.html)
In particular, the first step of the replication is the “adsorption”. During this phase, T7 phage recognizes specific receptors on the bacterial surface then adheres to those sites using the tail fibers. The irreversible binding of the phage to the host is followed by a second phase called “penetration” where T7 phage injects its viral DNA by means of its hollow tail that work like a syringe while the capsid remains outside the cell. Soon after the penetration phase, the phage life cycle entries in “eclipse” period. This phase represents the interval between the injection of viral genome into E. Coli and the release of new phages. The “eclipse” phase is dedicated firstly, to the synthesis of a set of early proteins required for the replication of the phage DNA; secondly to the production of several copies of phage nucleic acid; lastly to the synthesis of late proteins which are mainly structural proteins of the capsid and the
19
tail. After the production of all these parts, the assembly phase, better known as “maturation”, takes place. Viral genome is packaged into the capsid and the tail is linked to it, new mature infective phages are accumulated inside the host until a limit, called also the burst size. This is the last phase of the phage life cycle, it induces the “lysis” of the host and the release of intracellular bacteriophages that are able to infect and spread to nearby cells. All these phases take about 12-35 minutes to complete, so T7 phage has a short life cycle and an excellent ability to expand exponentially. Consequently, it is able to defeat pathogenic bacteria rapidly. In addition to its fast growth rate, T7 phage has shown a high flexibility and adaptivity that suggest it befitting for exploring evolutionary principles and for developing new tools to overcome the antibiotic resistance issue. (Qimron et al, 2010).
The points listed above are some of the several properties that demonstrate the reason why T7 phage was adopted in this project.
1.3 Comparison between bacteriophage therapy
and antibiotics
Phage therapy and traditional antibiotics have the same goal: defeat and kill pathogenic bacteria. Despite that, they have different behaviours and working principles, therefore different pros and cons. In particular, adopting phages as therapeutic agents, it is possible to list several advantages over antibiotics and the mains are (Chhibber et al., 2012; Sandeep, 2006):
1) Phages have a very high specificity and thanks to this they are not harmful for useful bacteria that live in and on the human body. Consequently there are not side effects like secondary infections or intestinal disorders that are typical cases of many antibiotic treatments. Furthermore, due to their high specificity, it is unlikely to obtain a selection for phage resistance in non-target bacteria while using
20
antibiotics with a broad spectrum activity is possible to select for resistance of many mutated pathogenic bacteria. 2) It is very easy to find phages throughout the nature, it is
estimated that there are about 1031 phages on earth and as a result of that, viruses are the most abundant life form. Using new phages is possible to overcome the issue of phage-resistant bacteria. Conversely, the development of new antibiotic in order to defeat antibiotic-resistant bacteria requires many years to accomplish.
3) Phages have a bactericidal action and usually a single dose of them is sufficient to kill pathogens because they are an ‘intelligent’ drug: they have an exponentially growth and they can multiply at the site of infection as long as there are bacteria to destroy. Once they have reached the purpose, phage too will die because they cannot grow without their specific host. Antibiotics can be bactericidal but also bacteriostatic, and usually it is necessary to administer repeated doses of the drug.
4) Phage therapy may become a useful alternative for patients that are allergic to antibiotics and it can be administered in different way in the form of pills, injections, etc.
Considering the features above, it is possible to look at phage therapy as a valid alternative approach for the treatment of superbugs, bacteria that are resistant to multiple antibiotics, and in general of bacterial infections. However it is necessary to overcome some problems associated with the use of phages (Chhibber & Kumari, 2012; Sandeep, 2006):
1) Their specificity can be a disadvantage when the exact species of infecting bacteria is unknown o in presence of a multiple infection. Because of this downside, it is necessary an identification prior of the pathogenic infection in the laboratory. Conversely, one type of antibiotic can defeat many different species of bacteria.
2) Cases of bacteriophage ineffective action were reported, maybe because of an incorrect diagnosis or choice of the method of phage administration. In particular oral phage administration could be neutralized by the gastric acidity; phage injected into the bloodstream are recognized by the immune system that can produce antibodies against these
21
viruses after a certain period; bacteriophages cannot be used against intracellular bacteria because this host is not available for the interaction.
3) Bacteria can also develop resistance to a certain type of phages, in this case it is necessary the adoption of new species.
4) A well-defined lytic phage in vitro environment could show a different behaviour in vivo and adopt a lysogenic cycle in some circumstances.
1.4 Overview of our research
One of the most critical and tricky problem related to the use of bacteriophages in order to defeat bacterial pathogens is the fact that bacteria can also become resistant to phages. But fortunately, phage-resistance is not even remotely as troubling as antibiotic-resistance. Indeed, one hypothetic solution for this issue is the use of new types of phages. When bacteria become resistant to a specific kind of phages, they continue to be susceptible to other types and it is very easy to find them in the nature that is an endless source of phages. But if each newly isolated phage needs approval, this process could take a very long time and become too expensive. An alternative to the previous solution could be the attempt to exploit the phage evolution. In other words, like their bacterial hosts and unlike antibiotics, phages are able to mutate, to evolve themselves, and then they can fight phage-resistant bacteria (Matsuzaki et al., 2005). Furthermore, usually phages can attack bacteria by attaching receptors on the bacterial surface that are virulence factors, but the development of phage-resistance can bring to an alteration of these receptors and consequently make new mutants less pathogenic than susceptible bacteria so they can be defeated by the human immune system (Inal, 2003). In addition, it is also possible to prevent the evolution and growth of phage-resistant bacteria, using during the treatments a cocktail of phages (a preparation containing different types of phages) and/or in combination with antibiotics.
22
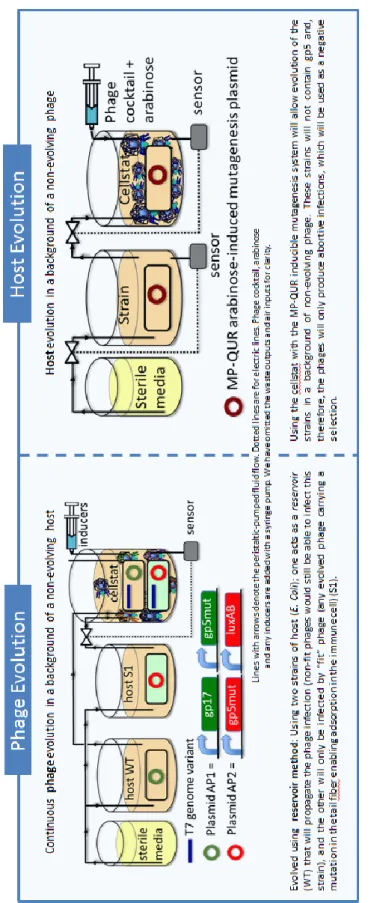
The research conducted by the team of Professor Alfonso Jaramillo Lab at the School of Life Sciences of the University of Warwick forms part of this scenario. The main aim of the work is the development of a methodical procedure in order to produce engineering synthetic bacteriophage cocktails against specific bacteria, forestalling possible phage-resistant mutants. This innovative idea is inspired to the principle of the system called PACE (phage-assisted continuous evolution) developed in the laboratory of Professor David Liu at the University of Harvard. Using the PACE platform (Figure 7), it is possible to evolve gene-encoded molecules that may be associated to protein production in E. Coli, continuously without the human intervention and 100 time faster than previous traditional methods (Carlson et al., 2014; Esvelt et al, 2011). To accomplish this, they have linked the desired activity to the production of infectious progeny phage, in particular exploiting the expression of protein III (or pIII that is encoded by gene III). According Esvelt et al., “phage infection requires protein III which mediates F pilus binding and host cell entry. Phage lacking pIII are approximately 108-fold less infectious than wild-type phage”. In order to couple pIII production to the desired activity, gene III was deleted from the phage genome and inserted into an accessory plasmid (AP) present in E. Coli host cells. These cells continuously flow through a fixed-volume called “lagoon” containing a replicating population of phages called “selection phage” (SP) encoding the gene of interest. Any mutation of host cells has a minimal impact on the outcome of the selection over many rounds of phage replication because the lagoon dilution rate is so fast that only the evolving selection phage population can replicate. In this way, only the selection phage with an activity of interest can induce the production of a sufficient amount of pIII from the accessory plasmid and survive in the lagoon. In theory, it is possible to apply PACE system to any gene that can be linked to pIII production in E. Coli. There are many activity of interest at transcriptional, translational or post-translational levels, for instance the evolution of T7 RNAP. This polymerase is very specific only for its promoter but using the PACE system the T7 RNAP was evolved to recognize the T3 promoter and to reject the initial sequence target. A second plasmid called “Mutagenesis Plasmid” (MP) has been included in the cell hosts. This arabinose-inducible mutagenesis plasmid promotes the evolution elevating the
23
error rate during DNA replication in particular suppressing proofreading and enhancing error-prone lesion bypass.
Figure 7: Overview of the PACE system.
(http://www.nature.com/nature/journal/v472/n7344/fig_tab/nature09929_F1.html)
Following a similar principle also the evolution of phages and bacteria can take place. Exploiting this idea, it is possible to achieve the goal of the research to get phage cocktails. Indeed, it is necessary to evolve bacteria and phages, one at time and repeat the procedure iteratively. The evolutions can occur using a system such as a bioreactor and typical tools of synthetic biology and bioengineering. In this work, a particular strain of E. Coli was
adopted as phage host: MG1655 ∆fimA-H; ∆flu;
∆matB::P2_luxCDABE. This is an F minus (F-) strain that underwent the deletion of three specific genes in order to avoid the formation of biofilm. T7 bacteriophage was adopted as selection phage, in particular the T7∆gp5 phage that lacks of the gene 5 in its genome. The gene 5 protein (gp5) of bacteriophage T7 is a DNA polymerase that is fundamental for the phage replication and growth. The deleted gp5 was inserted in an accessory plasmid (AP) and included in the F- strain through electroporation process. Consequently, the T7∆gp5 phage can reproduce itself only attacking the F- that possesses the AP (Figure 8) with gp5.
24
Figure 8: The accessory plasmid pet24_gp5 with Kanamycin resistance.
(Courtesy of J. Hassall, University of Warwick)
The host evolution takes place using the original F- strain (without AP) and including an arabinose-induced mutagenesis plasmid (MP) into it, which increases the probability of mutations. The cells are continuously pumped into the cellstat of a bioreactor in presence of a high concentration of phages (MOI>8, see below), in this way only the bacteria that develop phage-resistance can survive (Figure 1.9). New resistant bacteria will be used for the phage evolution using the reservoir method and mixing two types of host: one with AP and the other with MP (Figure 9). Cycling these two processes, it will be possible to get a set of different types of phages that could be used as cocktail.
25
Fi g u re 9 : P h ag e an d h o st e v o lu ti o n . ( Ha ss all , J., Ja ra m il lo , A . (2 0 1 4 ). En g in ee rin g sy n th eti c b ac teri o p h ag e co ck tails . P o ste r, Un iv ersity o f W ar w ic k )
26
Chapter 2:
2 Phage quantification and
parameters inference
2.1 The initial idea of the project
The traditional method for the phage quantification, also known as phage titration, is the plaque assay. This technique is used for the detection of the concentration of viruses in a sample. Initially the procedure was developed for the titers of bacteriophage stocks, then after the modification realized by Renato Dulbecco in 1952, it was widely exploited for the quantification of many different viruses as well (Dulbecco-Vogt, 1953). It is considered a reliable technique easy to implement as its protocol is composed by few simple passages (see Chapter 3). The main disadvantage of the procedure is the time to wait for the results. Indeed, this method is based on the count of the number of plaques, circular zones produced by the spread of new infectious viral progeny from infected cells on a Petri dish and these can be visible only after a period of incubation that lasts usually about 24 hours or at least overnight. The goal of this work was the development of an alternative method for phage quantification, able to predict the unknown concentration of a sample as quickly as possible and avoiding culture techniques with Petri plates. The task was accomplished taking advantage of the software implementation of a model, that is representative of phage-host interactions. In the context of continuous evolution and production of synthetic bacteriophage cocktails, this choice was also motivated by the need to control, over the time, the concentration of free-phages as outcome of the cellstat. In addition to the phage quantification, the programs developed for this new method have also a second but no less important purpose: the inference of unknown model parameters using optimization criteria. These parameters reveal some important information concerning the characteristics of phages and bacteria.
27
2.2 Models for the bacteriophage-host
interactions
The main purpose of the scientific research developed in the field of bacteriophage therapy is the possibility of considering the latter, in the next future, as a science, a concrete alternative to antibiotics in the treatment of pathogens. All this requires a wide knowledge of the interactions between bacteriophages and their hosts. Indeed, the dynamics that describe the behaviour of phages and cells play an important role in the result of the treatment and only the fully understanding of these intrinsic dynamical properties will be the key to the success. Unfortunately, it is easily comprehensible that the quantitative dynamics existing between prey (bacteria) and predator (bacteriophage) is too complex and elaborate only for human intuition, underlining the need to draw fully on the use of mathematical models. It is useful to develop models in order to reproduce conditions or theories in a simple way. There are many potential advantages and purpose in the use of mathematical models of dynamics, from providing a quantitative fitting to empirical data, to predicting future unknown outcomes and explaining complicated scientific material.
The interactions between bacteriophages and their hosts have been investigated for many years (Delbruck, 1940; Krueger & Northrop, 1930) and some interesting items about their features are still subject of scientific debates. Mathematical models, which have been proposed for a better understanding of these dynamical properties, cover many different area of interest, including ecological environment (Levin et al., 1977; Middleboe, 2000), food industry (Cattoën, 2003; Mudgal et al., 2006), therapeutic field (Cairns et al, 2009; Kasman et al., 2002; Levin & Bull, 1996; Payne & Jansen, 2000; Payne et al., 2000) and molecular evolution (Husimi, 1989). Some of them are mainly based on the classical Lotka-Volterra equations, known also as the predator-prey equations, used to describe the dynamical interaction of two general biological species. Only few models describing phage-host dynamics have also been validated or analysed mathematically (Mudgal et al., 2006). In this work, three different phage-host models have been considered and examined. The final best choice will be presented after a brief review of their main features and the
28
reasons of selection. It is also important to underline that these models are a description of in vitro bacteriophage-host interaction so they could not capture the real dynamics which occur in vivo environment where some parameters may be critical to treatment success. Therefore in the future it will be necessary a better understanding of the in vivo system in order to identify a relationship between in vivo and in vitro phage-host behaviour (Bull & Gill, 2014).
2.2.1 Model formulations
The following models have been chosen because they are easy to understand and their parameters are highly meaningful and purposeful. All state variables are time-dependent, but for the sake of simplicity this dependence will be omitted in the equations described.
a) In the paper “Understanding bacteriophage therapy as a density-dependent kinetic process” (Payne & Jansen, 2000), the authors present a simple and generic model which describes the variation over time of phage and host populations using three differential equations: 𝒅𝒙 𝒅𝒕 = 𝒂𝒙 − 𝒃𝒗𝒙 − 𝑯(𝒕)𝒙 𝒅𝒚 𝒅𝒕 = 𝒂𝒚 + 𝒃𝒗𝒙 − 𝒌𝒚 − 𝑯(𝒕)𝒚 𝒅𝒗 𝒅𝒕 = 𝒌𝑳𝒚 − 𝒃𝒗𝒙 − 𝒎𝒗 − 𝒉(𝒕)𝒗
• x(t) represents the concentration of uninfected bacteria • y(t) the lytic bacteria
• v(t) the free phage
• a is the replication coefficient of the bacteria • b is the transmission coefficient
• k is the lysis rate coefficient • L is the burst size
• m is the decay rate of free phage
• H(t) is the host response against the bacteria • h(t) is the host response against the phage
29
The model has been developed exploiting the kinetic properties of phage replication and it is able to show as outcome, a range of qualitative values for the variables. The work explains paradoxical and unpredictable results obtained with the use of bacteriophages in the therapeutic field splitting the outcome in different categories and considering some critical thresholds. The study illustrates the yielding points of bacteriophage biology which can be engineered, opening up the path for phage therapy.
b) The second model is described in the following paper: “Quantifying the Significance of Phage Attack on Starter Cultures: a Mechanistic Model for Population Dynamics of Phage and Their Hosts Isolated from Fermenting Sauerkraut” (Mudgal et al., 2006). Here the authors concern the possible use of a mechanistic mathematical model, in the food industry, in order to quantify the growth of phage and host population for different initial conditions. The model, validated with two different phage-host systems, is composed by 4 delay differential equations:
𝒅𝑺 𝒅𝒕 = 𝜶𝑺 (𝟏 − 𝑺 + 𝑰 + 𝑴 𝑪 ) − 𝑲(𝒕)𝑺𝑷 𝒅𝑰 𝒅𝒕= 𝑲(𝒕)𝑺𝑷 − 𝑯(𝒕 − 𝑳)𝑲(𝒕 − 𝑳)𝑺(𝒕 − 𝑳)𝑷(𝒕 − 𝑳) 𝒅𝑷 𝒅𝒕 = −𝑲(𝒕)𝑺𝑷 + 𝑩𝑯(𝒕 − 𝑳)𝑲(𝒕 − 𝑳)𝑺(𝒕 − 𝑳)𝑷(𝒕 − 𝑳) 𝒅𝑴 𝒅𝒕 = 𝜸𝑴 (𝟏 − 𝑺 + 𝑰 + 𝑴 𝑪 )
• S(t) represents the density of susceptible bacteria • I(t) the infected bacteria
• P(t) the free phage
• M(t) the resistant bacteria
• α is the growth rate of susceptible cells • γ is the growth rate of resistant cells • C the maximum cell density
• L is the latent period • B is the burst size
30
Considering phage-host kinetic properties, the model includes an important delay term (t - L) which represents phage maturation. Furthermore, the authors have introduced another change: a step function H for a better description of the adsorption rate that varies with time. The model results show a systematic difference between the parameters obtained from model optimization and those acquired from experiments and a possible dependence of some parameters on phage or cells densities.
c) The last model considered is described in the paper “Quantitative Models of In Vitro Bacteriophage–Host Dynamics and Their Application to Phage Therapy" (Cairns et al, 2009). The authors focus their attention on the non-linear kinetics of bacteriophage-host interactions combining experimental and model results. Their kinetic model sharing the assumption of Payne and Jansen (i.e. mass-action law), includes a delay term and a variable that represents resistant bacteria as in the second paper (Mudgal et al., 2006): 𝒅𝑺 𝒅𝒕 = 𝒂𝑺 − 𝒇𝑺 − 𝒃𝑺𝑽 𝒅𝑹 𝒅𝒕 = 𝒂𝑹 + 𝒇𝑺 𝒅𝑰 𝒅𝒕= 𝒃𝑺𝑽 − 𝒃𝑺(𝒕 − 𝑲)𝑽(𝒕 − 𝑲) 𝒅𝑽 𝒅𝒕 = 𝒉𝒃𝑺(𝒕 − 𝑲)𝑽(𝒕 − 𝑲) − 𝒃𝑺𝑽 − 𝒎𝑽
• S(t) represents the concentration of susceptible bacteria (CFU) • I(t) the infected bacteria (CFU)
• V(t) the free phage (PFU)
• R(t) the resistant bacteria (CFU)
• a is the growth rate of susceptible and resistant bacteria • f is the mutation rate of bacteria
• b is the binding rate of phages to susceptible bacteria • K is the latent period (time between infection and lysis) • h is the burst size at lysis
31
The presence of a delay term (t – K) is fundamental for the explanation of a phenomenon: after a period K, the burst of infected bacteria releases new phage progeny, in particular about h viruses per cell. In this way, at time t it is necessary to consider not only the current dynamics but also the concentration of free phage and susceptible bacteria at time (t – k). The research represents one of the first phage therapy study tested using data acquired on an in
vitro system and it can be seen as a precursor for the development
of in vivo phage therapy.
2.2.2 The first data and the final model
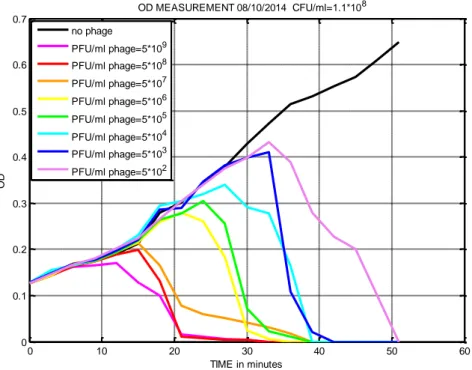
The main purposes in the use of a mathematical model are the fitting of experimental data and the attempt to give them a meaning through the study of the parameter set. An initial fresh cell culture (MG1655) with an optical density of 0.14 was divided in different tubes and each one was infected by a different concentration of phages (T7). The samples were shaken and incubated at 37°C. The optical density (OD600) was measured manually every three minutes
taking 1mL of each sample and using the spectrophotometer. The preliminary experimental results of this project are shown below (Figure 10). The coloured curves represent the different phage-host samples. They show that in a first moment, the concentration of bacteria increases following the same trend of the negative control, bacteria without the presence of bacteriophages, (black line) but after a period, slightly different for each of them, the optical densities decrease until zero as consequence of cells death caused by phage infection. The curves obtained are similar to the data described by Krueger & Northrop in 1930 about “the kinetics of the bacterium-bacteriophage reaction”.
32
Figure 10: Optical density measurement over time of the concentration of bacteria infected by
different dilution of phages.
The previous models chosen as possible candidates were implemented in MATLAB environment in order to try to use them for the fitting of these experimental data. The third model (c) has shown the best behaviour for our initial problem thanks to its flexibility, simplicity and stability. In addition, this mathematical model was simplified deleting one differential equation and one parameter. This has been possible because this project avoids the evolution of susceptible bacteria in resistant mutants (for details, see below). Below one will find the correct model adopted with R(t)=0 and f=0: 𝒅𝑺 𝒅𝒕 = 𝒂𝑺 − 𝒃𝑺𝑽 (𝟏) 𝒅𝑰 𝒅𝒕= 𝒃𝑺𝑽 − 𝒃𝑺(𝒕 − 𝑲)𝑽(𝒕 − 𝑲) (𝟐) 𝒅𝑽 𝒅𝒕 = 𝒉𝒃𝑺(𝒕 − 𝑲)𝑽(𝒕 − 𝑲) − 𝒃𝑺𝑽 − 𝒎𝑽 (𝟑) 0 10 20 30 40 50 60 0 0.1 0.2 0.3 0.4 0.5 0.6 0.7 OD MEASUREMENT 08/10/2014 CFU/ml=1.1*108 TIME in minutes OD no phage PFU/ml phage=5*109 PFU/ml phage=5*108 PFU/ml phage=5*107 PFU/ml phage=5*106 PFU/ml phage=5*105 PFU/ml phage=5*104 PFU/ml phage=5*103 PFU/ml phage=5*102
33
There are three state variables S, I, V which represents the concentration of susceptible, infected bacteria and free phage particles respectively. Five parameters complete the description of the model:
• a is the growth rate of susceptible bacteria [min-1]
• b is the binding rate of phages to susceptible bacteria [CFU-1min-1]
• K is the latent period (time between infection and lysis) [min] • h is the burst size at lysis [PFU]
• m is the phage decay rate due to thermodynamic and other effects [min-1].
34
Chapter 3
3 Materials and methods
In this chapter all the materials and methods adopted during the project will be illustrated. It is divided in two main sections: the first one includes a detailed description of the experimental procedures and protocols, while in the latter the programs implemented in MATLAB are presented.
3.1 Experimental methods
3.1.1 Enumeration of bacteria
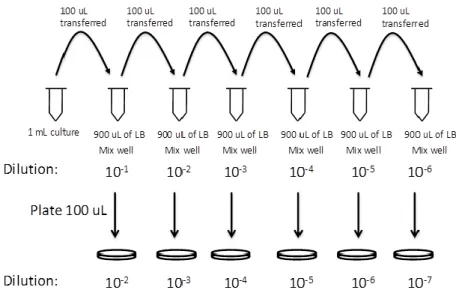
The number of viable bacteria in a sample is commonly measured in colony-forming unit (CFU). A colony represents an aggregate of cells derived from a single progenitor cell and becomes visible upon a proper incubation time. Their count represents a rough estimate of only living cells which are able to replicate themselves via binary fission. This is in contrast with the direct microscopic counts that include also dead cells. The results can be usually reported in CFU/ml or CFU/g for liquid or solid cultures respectively. The determination of the number of bacteria in an unknown sample is obtained using serial dilutions, plating and counting living cells. This method was invented by Robert Koch and used for the study of water quality as described in the paper “About Detection Methods for Microorganisms in Water” in 1883. The first step is the serial dilution (Figure 11), it is necessary because usually the concentration of cells in a culture sample exceeds the accurate detection range of the assay. It is very important to keep in mind the dilution factor adopted in order to mathematically compensate for it at the end of the experiment. Another relevant point: there is a limit for the number of dilutions
35
that is possible to do. The quantification of bacteria is more accurate if the number of colonies counted falls in the range of 30-300 per Petri dish. Therefore, when the concentration of the starting culture is unknown, it is recommended to plate different dilutions and have triplicates in order to average the counts together.
The protocol:
Figure 11: Serial dilution for the bacterial enumeration.
(http://2014.igem.org/Team:CSU_Fort_Collins/Notebook/KillSwitch/Sep)
After the preparation of six small, sterile test tubes labelled from 10-1 to 10-6, 0.9 mL of Luria-Bertani (LB) broth were added to each one. 0.1 mL of the original liquid culture were inoculated into the first test tube and mixed thoroughly using the vortex before proceeding. The procedure was repeated for each test tube until the last one, withdrawing 0.1 mL of diluted bacterial suspension from every last tube and pipetting that into the next one. 0.1 mL of every serially diluted specimen that is significant for the counting (30-300 colonies so usually 10-4, 10-5, 10-6), were plated onto different LBA (or LB agar + antibiotic where it was opportune) plates using spreaders or glass beads. Minimum three replicates for every dilution. After an overnight incubation at 37°C of the plates, upside down, the number of colony-forming units (CFU) was counted and averaged for each dilution. Finally the concentration of bacteria in the original suspension (in CFU/mL) was calculated using the following formula:
36
𝑪𝑭𝑼 𝒎𝑳 =
𝑵𝒖𝒎𝒃𝒆𝒓 𝒐𝒇 𝒄𝒐𝒍𝒐𝒏𝒊𝒆𝒔 𝒄𝒐𝒖𝒏𝒕𝒆𝒅 𝒊𝒏 𝒕𝒉𝒆 𝒑𝒍𝒂𝒕𝒆
𝑽𝒐𝒍𝒖𝒎𝒆 𝒑𝒍𝒂𝒕𝒆𝒅 (𝒊𝒏 𝒎𝑳) ∗ 𝑻𝒐𝒕𝒂𝒍 𝒅𝒊𝒍𝒖𝒕𝒊𝒐𝒏 𝒇𝒂𝒄𝒕𝒐𝒓 (𝟒)
For example: if the number of colonies counted in a plate with 0.1 mL of the sample with dilution 10-6 is 60, the CFU/ml is:
CFU
ml =
60
0.1 ∗ 10−6= 6 ∗ 108
3.1.2 Enumeration of bacteriophage particles
The traditional procedure for the measurement of the concentration of viruses in a sample is the Plaque Assay. The basic concept is similar to the method previously illustrated for the determination of CFU/ml. The final results represent only the number of virus particles able to form plaques per unit volume and not the total quantity of particles. The benchmark is in PFU/mL (plaque-forming unit/millilitre). A viral plaque is a circular region generated within a solid cell culture by the replication and the spreading of bacteriophage viruses and consequently the cell bursts. Usually, the final count involves only the plates that contain a number of plaques between 10 and 100 in order to minimize the error.The protocol:
To perform a plaque assay, 10-fold dilutions of a virus stock were prepared. 0.1 mL aliquots were inoculated into a tube containing 3mL of soft agar and 0.3mL of fresh bacteria at an OD value of 0.2 (or approximately with a CFU of 107). The mix was plated, in triplicates, and incubated at 37°C overnight. After the count of the number of plaques, the PFU/mL was calculated using the following formula:
𝑷𝑭𝑼 𝒎𝑳 =
𝑵𝒖𝒎𝒃𝒆𝒓 𝒐𝒇 𝑷𝒍𝒂𝒒𝒖𝒆𝒔 𝒄𝒐𝒖𝒏𝒕𝒆𝒅 𝒊𝒏 𝒕𝒉𝒂 𝒑𝒍𝒂𝒕𝒆
37
3.1.3 Multiplicity of infection
The multiplicity of infection, or simply MOI, is an important parameter to take into consideration in virology since it was introduced 70 years ago (Ellis et al., 1939). It is the ratio of infectious virions to viable cells in a sample. In other words, the MOI is the average number of bacteriophages per bacterium:
𝑴𝑶𝑰 = (𝑷𝑭𝑼 𝒎𝑳)⁄ ∗ 𝒎𝑳 𝒐𝒇 𝒑𝒉𝒂𝒈𝒆𝒔 𝒂𝒅𝒅𝒆𝒅
(𝑪𝑭𝑼 𝒎𝑳)⁄ ∗ 𝒎𝑳 𝒐𝒇 𝒄𝒆𝒍𝒍𝒔 𝒂𝒅𝒅𝒆𝒅 (𝟔)
This number could be 0.001, 0.01, 0.1, 1, 10, 100, etc., and its value can be decided at the beginning of an experiment or deducted in a second moment, if the starting concentration of phages or bacteria is unknown, using some prediction tools. An essential key point is the understanding of the concept of the multiplicity of infection. For instance, an MOI of one (e.g. 1000 phages added to 1000 cells) does not mean that each cell is infected by one virion. In fact, the number of phages that infects each bacterium at different MOI can be described by the Poisson distribution:
𝑷(𝒏) =𝒎
𝒏∗ 𝒆−𝒎
𝒏! (𝟕)
where m is the MOI so the average number of viral agents per target, P(n) is the probability to have bacteria infected by exactly n phages. In particular:
𝑷(𝟎) = 𝒆−𝒎 is the probability to get uninfected cells
𝑷(𝟏) = 𝒎 ∗ 𝒆−𝒎 is the probability to get cells infected by
one phage
𝑷(𝒏 > 𝟏) = 𝟏 − [𝑷(𝟎) + 𝑷(𝟏)] = 𝟏 − [𝒆−𝒎∗ (𝒎 + 𝟏)] is
the probability to get cells multiply infected
𝑷(𝒏 > 𝟎) = 𝟏 − 𝑷(𝟎) = 𝟏 − 𝒆−𝒎 is the probability to get infected cells.
38
There is an assumption which underpins this statistical description: an equal probability for all cells of a culture to be infected.
Therefore, for a better understanding of the MOI’s interpretation, another important concept has to be introduced. When considering two samples with the same number of phages and bacteria, then the same MOI, but in different volume of medium (e.g. 5mL and 10mL), even if the final number of infected cells in both cultures would be the same, the duration of the adsorption period will sho w different (much longer in the bigger volume) (Racaniello, 2014). The MOI is easy to calculate and simple to understand but it could not be sufficient to describe all the experimental conditions on its own (Shabram & Aguilar-Cordova, 2000). Furthermore, it has been demonstrated that the use of MOI cannot be appropriate in some conditions and an alternative parameter has been proposed (Kasman et al, 2002).
In this work, considering what described above, the MOI was used in order to keep a record of the concentration of phages and cells in the samples and only as a qualitative descriptor of the experimental situations.
3.1.4 Phage-host interaction experiment
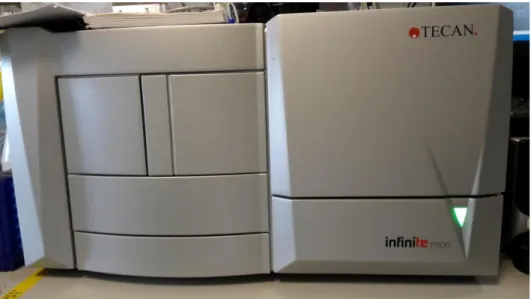
The first experiments were conducted using a spectrophotometer. In particular, a fresh cell culture with an optical density of 0.1- 0.2 was equally divided in different tubes, and a different dilution of phages was inoculated in each tube. The specimens were incubated at 37°C with shaking. Every 5 minutes, 1mL of each sample was withdrawn and its optical density was measured manually. This procedure has several disadvantages. Firstly, it is not reliable and accurate because of the many delays and imprecisions: no optimal growth condition for the culture (they were taken away from the incubator every 5 minutes); the need for the operator to fill different cuvettes and measure them one at a time; interoperator variability. Secondly, there is a waste in terms of time, resources and material. Lastly, there is an operative limit for the maximum number of samples measurable every 5 minutes. In order to overcome these issues, a new automatic procedure was adopted thanks to the use of a microplate reader (Figure 12). This instrument is able of
39
measuring automatically the absorbance over time of several samples, controlling the internal temperature and shaking in
different ways. The cells (MG1655 ∆fimA-H; ∆flu;
∆matB::P2_luxCDABE, with Kanamycin resistance) and the phages (T7∆Gp5) used during these experiments have been previously engineered in order to avoid any contamination problem. In other words, this type of bacteriophage is able to replicate only infecting the cells which possess the Gp5- plasmid.
Figure 12: Infinite® F500 Tecan microplate reader
Protocol:
The growth of fresh culture was obtained inoculating cells of an overnight culture into a tube with the antibiotic Kanamycin and LB medium considering the following proportions:
𝐾𝑎𝑛𝑎𝑚𝑦𝑐𝑖𝑛 𝐿𝐵 = 1 1000 𝐵𝑎𝑐𝑡𝑒𝑟𝑖𝑎 𝐿𝐵 = 2 100
the cells were incubated at 37°C and shaken until the achievement of an OD600 of 0.2 or better a CFU/ml of about 6*107 (see Chapter 4). This initial condition value was settled considering two key points. Firstly, in 2002, Kasman and his colleagues demonstrated
40
that the common definition of MOI is inadequate for experimental conditions in which the cell concentration is minor than 107/mL, and as a solution to this issue, they proposed an alternative parameter called MOIactual that considers the cell concentration, as
well as the adsorption time. In order to avoid this problem and simplify the picture, the minimum concentration of starting cells taken into account is 107/mL. Secondly, the purpose of this work is parameter inference and prediction of an unknown bacteriophage dilution as soon as possible. The time required to kill all the phage hosts, is shorter for a low concentration of cells than for a high one, considering a same amount of bacteriophages inoculated (MOIhighCONCENTRATION < MOIlowCONCENTRATION). Consequently, this represents an upper boundary so that the starting concentration of bacteria is approximately 107/mL. It is very important to take a record of the starting optical density value because a same amount of fresh cells will be used for the prediction of unknown concentrations of phages. A sample that comes from the original bacteriophage stock was serially diluted from 100 to 10-10. The standard disposition of bacteria and phages is shown in the figure:
41
A 96-well plate was used in the experiment for the measurement of optical density (Figure 13). Firstly, 0.2 mL of LB medium were dispensed in each yellow well; secondly the same amount of each different dilution of phages, from 100 to 10-10(dilution factor), were inoculated into the respective wells; lastly 0.18mL of cell suspension was distributed in every green and light blue well. After that, using a 12 well multichannel pipette and withdrawing from the last line (H) of the plate, a total of 0.02mL of T7∆Gp5 phages with different dilution was added to the cell suspension in the light blue wells (0.02mL of LB into the green wells) (Figure 14).
Figure 14: The use of a multichannel pipette for the dispensation of phages and medium in the
cells.
The plate was closed with the lid, previously maintained at 37°C, in order to decrease the formation of condensation during the experiment, and inserted in the pre-warmed microplate reader. The program was settled with a kinetic cycle that consisted in: the control of the temperature at 37°C; the shaking of the plate for three minutes each cycle; the OD600 measurement of every well except the last line sacrificed for the phage dispensation. In particular the optical density values were measured in four fixed point of every well, three times each, in order to get a better accuracy, so the final OD600 is the average of these values. The protocol adopted is a
modified procedure for the Kinetic Lysis Assays described by Qimron and colleagues in the paper “Genomewide screens for
Escherichia coli genes affecting growth of T7 bacteriophage” in
42
3.1.5 Optical density - CFU/mL calibration
The OD-CFU/mL calibration can be seen as a link between the experimental part and the software environment. Indeed, all the collected data, which represent the evolution over time of the number of cells, are OD values. In order to have a meaningful model parameter inference and phage quantification, it is necessary to translate these values in CFU/mL. The relationship between OD and CFU/mL can be considered linear.
Protocol:
A fresh cells culture was incubated at 37°C and shaken. 4 or 5 sample were collected from it during the growth and considering an OD600 range of 0.1-0.8 (e.g. 0.1 0.2 0.4 0.6 0.8). Each sample was
immediately serially diluted and the appropriate dilutions (e.g. 10-4, 10-5, 10-6) were plated in triplicates and incubated at 37°C overnight. After the count of the number of colonies, three CFU/mL values were determined for every OD600. The linear fitting equation of this relationship was obtained with the use of MATLAB. The general equation is:
𝑪𝑭𝑼
𝒎𝒍 = 𝒑𝟏 ∗ 𝑶𝑫𝟔𝟎𝟎 + 𝒑𝟐 (𝟖)
where p1 and p2 are parameters of the straight line and they were determined by the best fitting, obtained by the least square method. All the optical density values were measured using the spectrophotometer. For experimental results derived from the TECAN microplate reader, a conversion of ODtecan in ODspectrophotometer values has been necessary. In particular, a fresh cell
culture was incubated at 37°C and shaken, at regular intervals. A sample was withdrawn and its optical density was measured using both the spectrophotometer and the microplate reader.
43
3.1.6 Definition of delay model parameters
a) Growth Rate
As described in Chapter 1, the replication process of bacterial populations is called binary fission. Bacterial growth is represented by the variation of the cell number over time and it follows an exponential trend called also doubling. Indeed, during the replication, a bacterium can divide into two daughter cells, that are genetically identical to the mother cell if no mutation occurs. Thus, each bacterial generation is, theoretically, twice the number of the previous population but it is important to highlight that no necessarily all cells survive. Considering the first equation of the model adopted (1), after a simplification, it represents the first-order chemical reaction that occurs during the Log-phase of a bacteria culture growth, the only one useful for the growth rate determination (Hall et al., 2013).
𝒅𝑺
𝒅𝒕 = 𝒂𝑺 (𝟏. 𝒂) 𝒘𝒊𝒕𝒉 𝑽 = 𝟎 (𝒏𝒐 𝒃𝒂𝒄𝒕𝒆𝒓𝒊𝒐𝒑𝒉𝒂𝒈𝒆𝒔)
The equation describes the increment of cell population in time (dS/dt) proportional to the number of bacteria present at that time and the constant of proportionality a is called growth rate. Its value, expressed in h-1 or, as in this work, in min-1, can be easily determined solving the differential equation:
∫ 𝒅𝑺 𝑺 𝑺𝒕 𝑺𝒕𝟎 = ∫ 𝒂 𝒅𝒕 𝒕 𝒕𝟎 (𝟗) 𝐥𝐧 𝑺𝒕− 𝐥𝐧 𝑺𝒕𝟎 = 𝒂 ∗ (𝒕 − 𝒕𝟎) (𝟏𝟎)
Thus, the difference between the natural logarithm of the number of susceptible cells at time t and the natural logarithm of the number of susceptible cells at time t0 is directly proportional to the time interval through the constant growth rate a.
44
For a simpler interpretation, the equation can be converted in log10:
𝒍𝒐𝒈𝟏𝟎𝑺𝒕− 𝒍𝒐𝒈𝟏𝟎𝑺𝒕𝟎 = 𝒂
𝟐. 𝟑𝟎𝟑∗ (𝒕 − 𝒕𝟎) (𝟏𝟏) Plotting different concentrations of cells (CFUs) present at various times and using a log10 scale for the y axis, the result is a straight
line:
Figure 15: Log10 of the cell number over time.
http://colinmayfield.com/biology447/modules/intro/bacterialgrowthrate.htm
The growth rate value represents the slope of the line, namely how quickly a particular type of bacterium grows in a particular media. It can be calculated making a explicit from the previous equation:
𝒂 = (𝒍𝒐𝒈𝟏𝟎𝑺𝒕− 𝒍𝒐𝒈𝟏𝟎𝑺𝒕𝟎) ∗ 𝟐. 𝟑𝟎𝟑
(𝒕 − 𝒕𝟎) (𝟏𝟐)
There is a relationship between the growth rate and the doubling time or the mean generation time. In particular, the latter is the