POLITECNICO DI MILANO
School of Industrial and Information Engineering
Master of Science in Biomedical Engineering
AUTOMATED DETECTION OF HEARING LOSS BY
MACHINE LEARNING APPROACHES APPLIED TO
SPEECH-IN-NOISE TESTING FOR ADULT HEARING
SCREENING
Supervisors:
Prof. Alessia Paglialonga
Prof. Riccardo Barbieri
Co-supervisor:
Edoardo Maria Polo
Master thesis by:
Marta Lenatti, Matr: 916290
Ringraziamenti
Vorrei ringraziare la professoressa Alessia Paglialonga e il professor Riccardo Barbieri per essere sempre stati disponibili in questi mesi ed avere reso possibile lo svolgimento di questo progetto nonostante lo stato di incertezza in cui fin dall'inizio ci siamo trovati.
Un grazie particolare a Edoardo e Marco per i preziosi consigli, i suggerimenti su come procedere e il sostegno 'virtuale'.
Ringrazio i miei genitori, che con i loro sacrifici hanno permesso il completamento di questo percorso universitario, sostenendomi in ogni decisione presa.
I Abstract
Hearing loss is the fourth leading cause of disability worldwide, with almost half a billion people affected. Despite its significant burden, hearing loss is often underestimated and it is rarely considered a handicap, especially among older adults that tend to seek assistance very late. The development of dedicated mobile apps may allow the quick and widespread diffusion of hearing screening, so to promote awareness and early assessment of the hearing conditions.
Pure-tone audiometry (PTA) is the gold standard in audiological testing. However, a series of limitations prevent it from being used on a large scale. In addition, audiometry is not able to evaluate the abilities of speech recognition in presence of noise, whose decrease is often associated with age-related hearing loss. In this context, speech-in-noise tests (SNTs) have been developed. This study aims at evaluating the classification performance of a newly developed SNT in the detection of mild or higher degree of hearing loss, according to the World Health Organization (WHO) criteria for hearing impairment. In particular, seven different supervised machine leaning approaches were trained on different sets of features extracted from the experimental procedure, including the score of the ‘Hearing Handicap Inventory for the Elderly Screening Version’ (HHIE-S) questionnaire, the age of the participant and other parameters directly related to the test execution. All the considered models achieved a moderate level of accuracy in the detection of hearing loss, with Support Vector Machines (SVMs) and logistic regression performing slightly better with respect to the others; comparable metrics were obtained with different sets of features, demonstrating that the exclusion of those features that were less informative, did not substantially change the overall classification performance. The results obtained match those of some of the most popular SNTs currently available, however further research is needed to validate the speech-in-noise test as an adult hearing screening test, on a much larger population involving a higher number of subjects with hearing loss, also with higher degrees of impairment.
II Summary
Introduction: hearing loss, with almost half a billion people affected worldwide, is one of the major health concerns in ageing societies, causing communication problems, limiting social participation, and influencing the quality of life. Despite its high prevalence and strong social and emotional consequences, hearing loss is often an underrated disability, in fact hearing test are usually not included in routine healthcare screenings.
As a result, hearing loss in most cases remains undiagnosed, especially in older adults, as they perceive hearing loss as a natural consequence of ageing and, for this reason, they do not consider it as a handicap. Besides, recreational and occupational noise exposure is a major concern in the wide diffusion of hearing loss also among young individuals. However, most of the people wait until their hearing abilities deteriorate in a severe way before seeking for help, when an early diagnosis could have significantly limited the functional limitations generated by hearing loss. In order to promote awareness and early identification, hearing screening procedures should be widely accessible through the organization of appropriate campaigns (i.e. at school, in the workplace) or provided remotely.
Pure Tone Audiometry (PTA) is the gold standard for audiological clinical tests; however, it relies on the presence of trained healthcare operators, on the use of calibrated audiologic equipment, and it has to be performed in quiet environments. In addition, pure-tone hearing thresholds represent only a partial picture of hearing functionality as they do not capture the complex picture of hearing and communication, particularly speech communication. These limitations prevent PTA from being used on large-scale hearing screening initiatives. Over the last few decades, a variety of speech-in-noise tests (SNTs) has been developed and validated as screening tools allowing to obtain a quick, costless, and self-administered hearing evaluation delivered via smartphone or online and therefore overcoming the limitations of audiometry.
A deterioration in speech recognition in noise is one of the consequences of both age-related hearing loss (presbycusis) and noise induced hearing loss (NIHL), which are among the most widespread types of hearing loss. All SNTs measure speech recognition in noise, however they differ a lot in terms of speech material (digits, CVC, VCV, words…), added background noise and testing procedure. Indeed, depending on the type of stimuli used, these tests may result more or less language-dependent.
III
Recently, a new automated speech-in-noise test based on a three-alternative forced-choice (3AFC) recognition task of meaningless Vowel-Consonant-Vowel (VCV) was developed from a collaboration between Politecnico di Milano and CNR, Consiglio Nazionale delle Ricerche. The test demonstrated high accuracy and test-retest repeatability, with no significant learning effects. Listening to the selected speech material (meaningless VCVs) does not involve substantial cognitive process and allows to obtain results only marginally influenced by the user’s language and educational level, thus demonstrating that a potential mobile app based on this SNT may be used for widespread hearing screening.
The objective of the study was to assess the accuracy and the viability of the implemented procedure as an adult hearing screening tool, i.e. to promote a quick assessment of hearing conditions in people who would normally not seek any assistance.
Nowadays, machine learning approaches have been applied to a variety of applications, including audiology. In the present study, seven different supervised machine learning techniques were investigated, to compare their ability to detect hearing loss of mild or higher degree, as defined according to the World Health Organization (WHO) criteria based on the average PTA thresholds.
Materials and methods: 148 adults of different native languages and varying degrees of hearing loss were tested in non-clinical settings both in the laboratory and in several initiatives of local hearing screening. A subset of participants (8 out of 148) was tested in both ears whereas the remaining participants were tested in one ear, for a total of 156 ears tested.
The binary variable representing the screening results (pass/fail) was obtained based on the WHO criteria for hearing impairment, specifically based on the average pure-tone hearing threshold computed on the four central frequencies (0.5,1,2, and 4 kHz).
Due to the nature of hearing screening as a tool for early identification, mild-to-moderate degrees of hearing loss were considered in this study to address the ability of the test to identify earlier hearing difficulties. The target variable was set to 1 (‘fail’) if the WHO criterion for mild or moderate hearing impairment was satisfied (PTA> 25 dB HL for mild hearing impairment, referred to as criterion 1, and PTA> 40 dB HL for moderate hearing impairment, referred to as criterion 2) or 0 (‘pass’) otherwise.
IV
The dataset used for classification includes 156 records, corresponding to the different ears tested, and 11 columns, including the following features: the speech reception threshold (‘SRT’), the raw score of the Hearing Handicap Inventory for the Elderly Screening Version (HHIE-S) questionnaire (‘Score’), the age (‘Age’), the number of trials (‘#Trials’), the number of correct responses (‘#Correct’), the percentage of correct responses achieved (‘%Correct’), the average reaction time (‘Avg_reaction_time’), the total test duration (‘Total_test_time’), the volume level (‘Volume’), the classification into three classes of hearing impairment according to the HHIE-S questionnaire raw score (‘Score_classes’) and the target variable previously introduced.
These variables represent a set of features extracted from the information gathered during the three phases of the experimental procedure: PTA assessment, personal information and HHIE-S questionnaire compilation and test execution. The SRT, defined as the signal-to-noise ratio (SNR) at a certain intelligibility level, gives a clue about the ability to recognize speech in noise, thus it is the usual main outcome of speech-in-noise tests. However, the addition of other features to implement a multivariate classification model may lead to better performances in discriminating the presence of hearing impairment.
The Spearman’s correlation coefficients were analyzed to evaluate the strength and the direction of the relationship between couples of attributes and also between attributes and target variable, in order to obtain a first hint about the presence of multicollinearity.
Then, scatterplots were analyzed in the pass/fail classes to visualize which couples of variables were more able to discriminate between the two classes and which ones were not. The performance of SRT as predictor of mild and moderate hearing loss was assessed by analyzing ROC curves to evaluate the discrimination capabilities as a function of the cut-off SRT value.
Next, generalized linear models (GLMs) were implemented for each single attribute, in order to evaluate the contributions of the various features in discriminating the screening result and to identify the most meaningful variables and those that might be disregarded in a classification task. Afterwards, GLMs were addressed by adding SRT as a second predictor and the resulting interaction term.
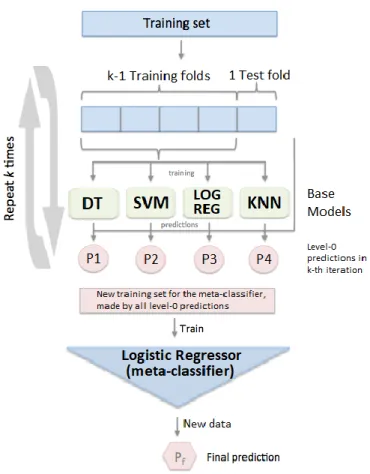
As a last step, seven different classifiers, including four of the most widespread and consolidated approaches (Decision Trees (DT), Support Vector Machines (SVM), logistic regression, K-Nearest-Neighbors) and three ensemble methods (ensemble logistic
V
regression, Random forests and Gradient boosting) were compared in terms of performance in detecting hearing loss based on the WHO criterion for mild hearing impairment (criterion 1). Their classification performance was evaluated by means of a variety of metrics including the proportion of records correctly classified as ‘pass’ or ‘fail’ (training and test accuracy), the proportion of subjects with no hearing loss (‘pass’) correctly classified (specificity) and the proportion of subjects with hearing impairment (‘fail’) correctly classified (sensitivity).
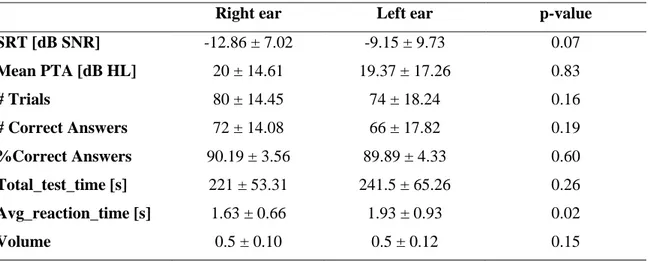
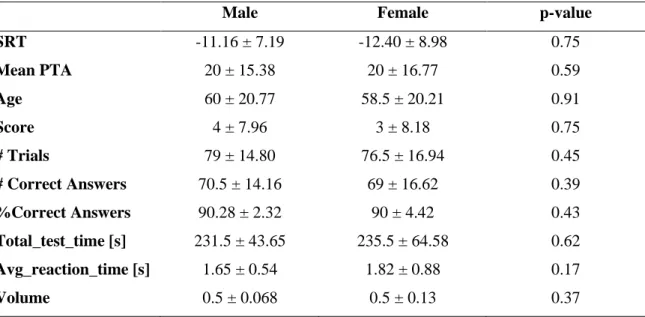
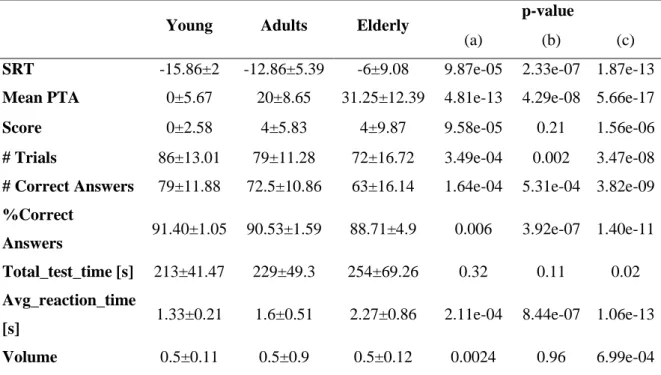
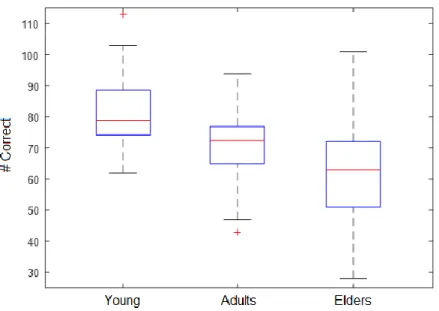
Results: analysis of the possible influence of sex, ear tested (left/right), and age on the on the collected data revealed no significant effect of sex and ear and a significant effect of age, with higher age associated in worse test outcomes.
Three age-related groups were considered, namely ‘Young’ (i.e., age: 20 - 25 years), ‘Adults’ (i.e., age: 25 - 60 years), and ‘Elderly’ (i.e., age ≥ 60 years).
As a result, speech recognition abilities in noise worsen, as reported by SRT that from a mean value of -15.86 dB SNR in the Young group increases to -12.86 dB SNR in the adults and finally increases again to -6 dB SNR in elderly. In addition, also the average pure-tone hearing threshold passes from an average value of 0 dB HL in young subjects to a value of about 20 dB HL in adults and finally to a much higher value, of about 31 dB HL, in elders. The duration of the test, instead, seems to remain pretty constant regardless of age as younger users require an higher number of stimuli before finishing the test, but they respond faster to each VCV proposal, whereas older subjects may respond to fewer stimuli, as they are likely to perform worse in the test and thus reach the stop criterion (i.e. 12 reversals) earlier, but each time they will spend more time selecting the single response.
Regarding multicollinearity among classification attributes, the chosen test volume showed no significant correlation with the other variables, except for a weak negative correlation with the average reaction time. SRT instead showed a moderate correlation with almost all the other variables, and a strong correlation (r=0.83) was observed only with the percentage of correct responses.
The correlation between SRT and the binary result of the PTA is moderate (r=0.66) and in line with the values reported in the literature for similar online SNTs such as Earcheck and Occupational Earcheck.
GLMs evaluating SRT against the binary PTA showed a significant contribution of SRT for both mild and moderate hearing impairment detection. Indeed, SRT is one of the best
VI
candidates for discriminating the presence of hearing loss as defined from pure-tone hearing thresholds.
The variable most strongly correlated with the target is the age (r=0.76), however also other features such as the number of correct answers and the average reaction time are quite correlated with the screening result (r= -0.62 and 0.53, respectively), suggesting that they also may be useful attributes for classification purposes.
The scatterplots of paired variables have been evaluated against the capability to separate ‘pass’ and ‘fail’ records. Features like the SRT, age, the number of correct answers and the average response time allow to have a fairly well defined separation between the two classes for both criterion 1 and criterion 2, as pass instances are gathered in correspondence of lower (i.e. better) SRTs, older age, higher number of correct responses, lower single response reaction time and so on.
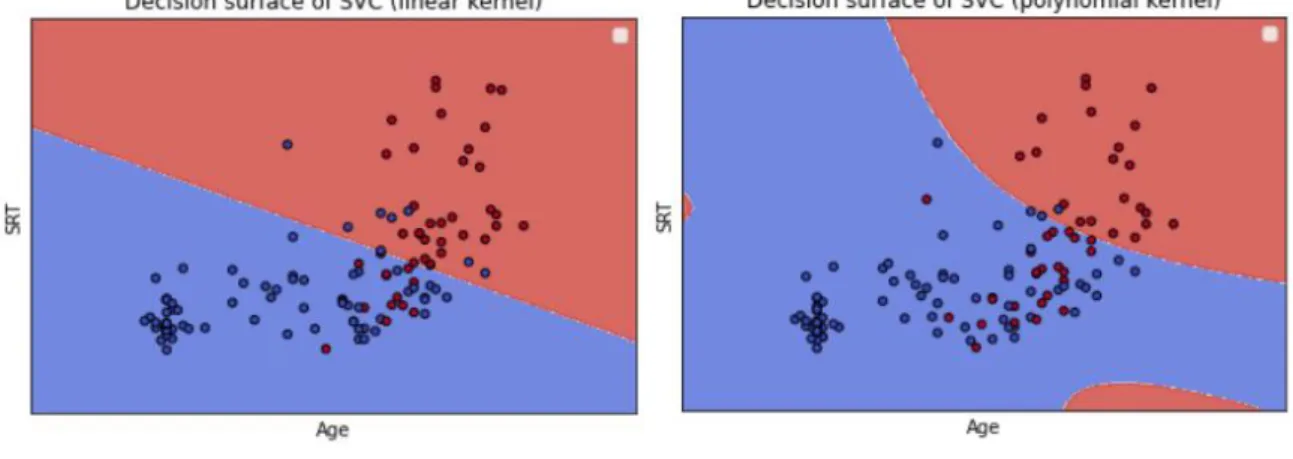
Conversely, other parameters such as test total execution time and volume have shown less ability to separate the two categories, since the distribution of records in the two classes is much wider and without obvious relationship with the couple of variables considered. ROC curves were built progressively varying the discrimination SRT and by selecting the cut-off SRT as the value closest to the ideal point (i.e. top left angle of the curve). As far as it concerns criterion 1, an SRT discrimination threshold of -8.875 dB SNR yielded an AUC equal to 0.83, a specificity of 0.84, a sensitivity of 0.76, and a test accuracy of 0.81. Considering criterion 2, a cut-off SRT of -6 dB SNR yielded better values in terms of AUC (0.89), sensitivity (0.89), and accuracy (0.83), but slightly lower specificity (0.81).
GLMs evaluating the other attributes against the binary PTA showed that, besides the volume and the total test duration, all the other variables contributed significantly to the prediction for the two WHO criteria for hearing impairment here considered. However, the amount of variance of the dependent variable explained by the single predictor was quite low, as a maximum value of 0.40 was observed (predictor: age; criterion: 1). An improved goodness-of-fit of the GLM was achieved by using models that included the SRT and each one of the other features as predictors, reaching the maximum value of adjusted R2 equal to 0.44 (predictors: age, SRT; criterion: 1). The interactions between the attributes and SRT were in general not significant, and even when they were significant, they did not bring tangible improvements to the model, suggesting limited or no influence of the interaction terms on the predicted variable.
VII
Based on the results of features characterization and GLMs described above, 7 different sets of features were considered and fed to 7 different supervised machine leaning approaches (Decision Trees (DT), Support Vector Machines (SVM), logistic regression, K-Nearest-Neighbors, ensemble logistic regression, Random forests and Gradient boosting).
In this preliminary evaluation, logistic regression and Support Vector Machines obtained the best results in terms of classification performance, with an AUC of 0.91, an accuracy on the test set equal to 0.82, a specificity of 0.82, and a sensitivity of about 0.8.
Random forest and Gradient boosting techniques were promising classifiers too as they showed the same specificity as the previously mentioned methods (i.e., 0.82) and slightly lower AUC (0.87) and accuracy on the test set (0.79 and 0.78, respectively). However, their ability to detect hearing impaired subjects, represented by sensitivity, appears to be too low (0.73 and 0.7).
KNN presented an AUC equal to 0.85 and a specificity of 0.77 which resulted to be lower than that of the previous methods. However, it yielded a test accuracy comparable to the one found for Gradient boosting (i.e., 0.77) and a better sensitivity (0.77) with respect to Random Forest and Gradient boosting.
Unfortunately, the ensemble logistic regressor underwent overfitting, as can be seen from the big difference between training (0.95) and test (0.78) accuracy, and for this reason it was not feasible for this preliminary assessment because it may be prone to significant prediction errors on new instances.
Regarding DTs, they have the advantages of being the fastest approach and giving more interpretable results. However, the classification performance of DTs in this preliminary study seemed to be the lowest, especially in terms of AUC (0.74). The AUC obtained with DTs using a reduced set of 4 features is higher (0.82), but still lower compared to other classification algorithms.
Discussion and conclusions: significant worsening of the test parameters has been observed with increasing age considering the three groups (Young, Adults and Elderly). Indeed, young subjects (i.e., age: 20 - 25 years) showed excellent speech recognition abilities in noise; in the Adults group (i.e., age: 25 - 60 years) the performance was moderate, and in considering Elderly (i.e., age ≥ 60 years) the performance had a consistent worsening.
VIII
In fact, features like SRT, the average pure-tone thresholds, the HHIE-S questionnaire score and the average reaction time tend to increase whereas the number of trials, the number of correct responses and consequently the percentage of correct responses tend to diminish as age increases, showing an overall decrease in the test outcomes and therefore poorer capabilities to recognize speech in a background noise. Indeed, increased hearing thresholds and decreased speech recognition ability, particularly in noise, are among the first symptoms of age-related hearing impairment.
The discrimination capabilities for criterion 1, considering classification of ears based on the measured SRT, were fully comparable to the previous findings on a smaller population (i.e., 98 subjects), using cut-off values of -8 dB SNR and -10 dB SNR.
Comparing the observed performance for criterion 1 and criterion 2, the latter showed better values in terms of AUC, sensitivity, and accuracy and slightly lower specificity. The classification performance for criterion 2 matches the measures obtained for the Speech Understanding in Noise (SUN) test, another SNT based on the same speech material and recognition task (three-alternatives forced choice) and a fixed-levels (i.e., non-adaptive) testing procedure. However, it should be noted that the number of records belonging to the ‘fail’ class for criterion 2 includes only a few subjects in the tested population (i.e., 18), therefore these outcomes need further demonstration after a higher number of subject with moderate hearing impairment is tested in future studies.
Regarding the analysis of the full set of variables, evaluations of the correlation matrix and of matrices of scatterplots of paired features suggested that features like volume and test duration might not bring important contributions to classification of hearing impairment. These considerations were further confirmed by the analysis of single-predictor GLMs on these features and multiple-predictor GLMs (i.e., including SRT and each of these features). The volume may be disregarded from the set of features in this preliminary assessment as it is less informative, perhaps also related to the fact that few participants decided to adjust the volume, whereas the majority maintained the default value as they considered it suitable for test execution.
The test duration also seems to be a negligible feature for classification purposes as it does not substantially change with varying hearing thresholds in the tested population. This is related to a compensatory action as people who perform well in the test have to go through more trials (i.e., to reach a lower SRT) before reaching the end of the test, but they tend to
IX
respond more quickly at each trial because they are less hesitant in VCV recognition. On the other hand, individuals with worse speech recognition performance have to go through fewer trials, but they could take on average the same total time as good performers, because of their longer response time due to a higher hesitation in giving their answers. As a result, subjects tend to take more or less the same time to perform the test, almost independently on test outcomes.
On the other hand, due to the above considerations, the average time needed to reply to the proposed stimulus may be a more interesting parameter to discriminate the screening result, as it may indirectly reflect the subject’s ability to recognize the stimuli. In addition to the features previously considered, the removal of the HHIE-S questionnaire outcomes can accelerate the experimental procedure and reduce the presence of possible bias that is frequently observed in questionnaires and might also be related to a reduced self-perception of the presence of hearing problems, mostly observed in the elderly.
Comparable performance was obtained with different sets of features , demonstrating that the exclusion of those features that were less informative, or those that showed high correlation with other features, did not substantially change the overall classification performance, therefore exclusion of unnecessary features may be helpful, for example to speed up the training of the algorithm and to reduce overfitting. Among the different methods here considered, SVM and logistic regression seemed to be the more promising approaches. They performed better in terms of sensitivity and AUC as compared to the classification based on SRT only.
The performance observed with Support Vector Machine and logistic regression algorithms reached a moderate level of accuracy, in line with the findings obtained for other well-known automated speech-in-noise tests. However, the sensitivity needs to be further improved because about one fifth of the examined subjects with hearing loss are erroneously classified as normal hearing.
Moreover, the selection of training and test partitions in small datasets like the one here considered, may introduce variability in the classification. In this study, to address the potential variance due to changes in the underlying data, the average performance across 1000 iterations of the model was considered. Results demonstrated that the average performance of the models was similar, both considering different classification algorithms and different sets of features; the standard deviations were relatively low (i.e., smaller than
X
0.1) for parameters like the accuracies and AUC, reached values around 0.1 for F-measure and specificity and slightly higher values for FNR, precision, and sensitivity (e.g. 0.17, 0.12 and 0.17 considering gradient boosting). Because of this intrinsic variability, the performance of a single optimized model may differ consistently from the average classification performance. Additional studies on larger samples may therefore allow to minimize this variability, by reducing the data-dependency, as each partition tends to be more equally representative of the original dataset when the sample size is substantially increased. Subsequently, optimized model definition and finer hyperparameter tuning could be achieved and this could further help towards the development of a smartphone application for adult hearing screening.
In general, further research is needed to validate the speech-in-noise test and the classification methods for both criterion 1 and criterion 2, on a much larger population involving a higher number of subjects with hearing impairment, also with higher degrees of hearing loss.
Keywords: hearing loss; hearing screening; pure-tone audiometry; speech-in-noise test; speech reception threshold; supervised learning; classification; machine learning; generalized linear models
XI Abstract
La perdita dell'udito è la quarta causa di disabilità al mondo, con quasi mezzo miliardo di persone colpite; tuttavia, essa è spesso sottovalutata e raramente viene considerata un handicap, soprattutto tra gli anziani che tendono a cercare assistenza troppo tardi. Lo sviluppo di app dedicate può consentire una vasta diffusione degli screening audiologici, in modo da promuovere una rapida valutazione delle condizioni dell'udito.
L'audiometria tonale è il gold standard nei test audiologici, tuttavia, una serie di limitazioni ne impedisce l'uso su larga scala. Inoltre, essa non è in grado di valutare le capacità di riconoscimento del parlato nel rumore, il cui peggioramento è spesso associato alla perdita dell'udito legata all’età. In questo contesto, sono stati sviluppati diversi test di speech-in-noise (SNT). Questo studio mira a valutare la performance di classificazione di un SNT recentemente sviluppato, nella rilevazione di perdite uditive, definite secondo i criteri dell'Organizzazione Mondiale della Sanità (OMS). Sette diversi approcci di apprendimento supervisionato sono stati addestrati utilizzando una serie di caratteristiche estratte dalla procedura sperimentale, tra cui il punteggio del questionario "Hearing Handicap Inventory for the Elderly Screening Version" (HHIE-S), l'età del partecipante e altri parametri collegati all'esecuzione del test. Tutti i modelli considerati hanno raggiunto un buon livello di accuratezza nella rilevazione delle perdite dell'udito, con risultati migliori associati a Support Vector Machines (SVM) e regressione logistica. Utilizzando diversi set di caratteristiche sono state ottenute metriche comparabili, a dimostrazione del fatto che l'esclusione delle variabili meno informative non modifica la performance complessiva della classificazione. I risultati ottenuti corrispondono a quelli di alcuni tra i più popolari SNT attualmente disponibili, tuttavia ulteriori ricerche sono necessarie per convalidare il test come strumento di screening dell'udito per adulti, su una popolazione molto più ampia che coinvolga un numero maggiore di soggetti con perdite uditive, anche con gradi di compromissione più elevati.
XII Sommario
Introduzione: la perdita dell'udito, con quasi mezzo miliardo di persone colpite in tutto il mondo, è una delle maggiori preoccupazioni sanitarie nelle società in cui l’aspettativa di vita sta aumentando, ed è causa di problemi di comunicazione, limiti alla partecipazione sociale e riduzione della qualità della vita. Nonostante la sua elevata diffusione e le forti conseguenze sociali ed emotive, la perdita dell'udito è spesso una disabilità sottovalutata, infatti i test dell'udito non sono solitamente inclusi nelle visite mediche di routine.
Di conseguenza, nella maggior parte dei casi, la perdita dell'udito non viene diagnosticata, soprattutto negli adulti più anziani, in quanto essi la percepiscono come una conseguenza naturale dell'invecchiamento e per questo motivo non la considerano un handicap.
Inoltre, l'esposizione al rumore a scopo ricreativo e professionale è una delle principali cause nell'ampia diffusione della perdita dell'udito anche tra i giovani. Tuttavia, la maggior parte delle persone attende che le loro capacità uditive si deteriorino in modo grave prima di cercare aiuto, quando una diagnosi precoce avrebbe potuto limitare in modo significativo la limitazione funzionale causata dalla perdita uditiva. Al fine di promuovere la sensibilizzazione e l'identificazione precoce, le procedure di screening dell'udito dovrebbero essere ampiamente accessibili attraverso l'organizzazione di apposite campagne (ad es. a scuola, sul posto di lavoro…) o proposte in modalità da remoto.
L'Audiometria Tonale (PTA) è considerata il test clinico audiologico standard; tuttavia, essa si basa sulla presenza di operatori sanitari preparati, sull'uso di apparecchiature audiologiche calibrate e necessita di essere eseguita in ambienti silenziosi. Inoltre, le soglie uditive dei toni puri non sono in grado di rappresentare le funzionalità uditive nella loro totalità, poichè non colgono il complesso scenario dell’udito e della comunicazione, in particolare la comunicazione verbale. Queste limitazioni impediscono l'utilizzo della PTA in iniziative di screening uditivo su larga scala. Negli ultimi decenni, una serie di test di speech-in-noise (SNT) (“parlato nel rumore”) sono stati sviluppati e validati come strumenti di screening in grado di ottenere una valutazione dell'udito rapida, economica e autosomministrata tramite smartphone oppure online, superando i limiti dell'audiometria.
Il deterioramento del riconoscimento del parlato nel rumore è una delle conseguenze sia della perdita dell'udito dovuta all'età (presbiacusia) che della perdita dell'udito indotta da una prolungata esposizione al rumore, tra i tipi di perdita uditiva più diffusi.
XIII
Tutti gli SNT misurano il riconoscimento vocale nel rumore, tuttavia differiscono molto in termini di materiale vocale (cifre, CVC, VCV, parole...), rumore di fondo aggiunto e procedura di test. Per questo, a seconda degli stimoli utilizzati, questi test possono risultare più o meno dipendenti dalla lingua.
Recentemente, un nuovo test automatizzato di speech-in-noise basato sul riconoscimento, a partire da tre alternative (3AFC), di sequenze vocale-consonante-vocale (VCV) prive di significato, è stato sviluppato da una collaborazione tra il Politecnico di Milano e il Consiglio Nazionale delle Ricerche (CNR). Il test ha dimostrato un'elevata accuratezza e ripetibilità, con effetti di apprendimento non significativi. L’ascolto del materiale vocale selezionato (VCV privi di significato) non comporta alcun processo cognitivo concreto e permette di ottenere risultati influenzati solo marginalmente dal linguaggio dell'utente e dal suo livello di istruzione, dimostrando che un'applicazione mobile basata su questo SNT potrebbe essere distribuita e utilizzata per screening uditivi diffusi su larga scala.
L'obiettivo dello studio è quello di valutare l'accuratezza e la fattibilità della procedura implementata come test di screening dell'udito per adulti, per promuovere una rapida valutazione delle condizioni di udito in persone che normalmente non richiederebbero alcuna assistenza.
Al giorno d'oggi, gli approcci di machine learning sono stati applicati a una varietà di discipline, inclusa l'audiologia. Nel presente studio sono state considerate sette diverse tecniche di machine learning, allo scopo di confrontare la loro abilità nel rilevare perdite uditive lievi oppure più severe, definite secondo i criteri dell'Organizzazione Mondiale della Sanità (OMS) sulla base delle soglie uditive medie.
Materiali e metodi: un gruppo di 148 adulti di diversa lingua nativa e con diverso grado di perdita dell'udito è stato testato in contesti non clinici, sia in laboratorio che in diverse iniziative di screening uditivo a livello locale. Alcuni partecipanti (8 su 148) sono stati testati su entrambi le orecchie, mentre i rimanenti sono stati testati su un orecchio solo, per un totale di 156 orecchie testate.
La variabile binaria, rappresentante il risultato dello screening (pass / fail), è stata ottenuta a partire dai criteri dell'OMS per l'ipoacusia, definiti utilizzando la soglia media uditiva dei toni puri sulle quattro frequenze centrali (0.5, 1, 2, e 4 kHz). A causa della natura dello screening dell'udito come strumento per l'identificazione precoce, solo perdite uditive meno
XIV
gravi (da lievi a moderate) sono state considerate in questo studio, per valutare l’abilità del test di riscontrare delle perdite uditive ai primi stadi.
La variabile target è stata impostata a 1 ("fail") nel caso in cui il criterio dell'OMS per perdite di udito lievi o moderate fosse soddisfatto (PTA> 25 dB HL per perdite uditive lievi, denominate criterio 1 e PTA> 40 dB HL per perdite uditive moderate, definite come criterio 2) o 0 ("pass") altrimenti.
Il set di dati raccolto è costituito da 156 righe, corrispondenti alle diverse osservazioni, e 11 colonne, che includono le seguenti variabili: la speech reception threshold (‘SRT’), il punteggio del questionario ‘Hearing Handicap Inventory for the Elderly Screening Version’ (HHIE-S) (‘Score’), l’età (‘Age’), il numero di trials (‘#Trials’), il numero di risposte corrette (‘#Correct’), la percentuale di risposte corrette (‘%Correct’), il tempo medio di reazione (‘Avg_reaction_time’), la durata totale del test (‘Total_test_time’), il livello del volume (‘Volume’), la suddivisione in tre gradi di perdita uditiva a seconda del punteggio ottenuto nel questionario HHIE-S (‘Score_classes’) ed infine la variabile target precedentemente introdotta.
Queste variabili rappresentano un insieme di caratteristiche estratte dalle informazioni raccolte durante le tre fasi della procedura sperimentale: valutazione audiometrica, compilazione di informazioni personali e del questionario HHIE-S ed esecuzione del test. L’SRT, definito come il rapporto segnale-rumore ad un certo livello di intelligibilità, offre un indizio sulla capacità di riconoscere il parlato nel rumore, quindi è il risultato principale comunemente fornito nei test di speech-in-noise. Tuttavia, l'aggiunta di altri attributi per implementare un modello di classificazione multivariata può portare a migliori prestazioni nella discriminazione della presenza di deficit uditivo.
I coefficienti di correlazione di Spearman sono stati analizzati per valutare la presenza e l’entità delle relazioni tra le coppie di attributi e anche tra attributi e variabile target, al fine di ottenere un primo indizio sulla presenza di multicollinearità.
Successivamente, gli scatterplot in funzione delle classi “pass” e “fail” sono stati analizzati per visualizzare quali coppie di variabili fossero maggiormente in grado di discriminare tra le due classi e quali no.
XV
La performance dell’SRT come predittore di perdite uditive lievi e moderate è stata in seguito valutata analizzando delle curve ROC allo scopo di valutare le capacità di discriminazione in funzione del valore della SRT.
Modelli Lineari Generalizzati (GLM) sono stati implementati per ogni singolo attributo al fine di valutare il contributo delle varie caratteristiche nella discriminazione del risultato dello screening e identificare quali fossero le variabili più significative e quali variabili potessero essere ignorate in un task di classificazione. Successivamente, ulteriori GLM sono stati analizzati, aggiungendo SRT come secondo predittore ed infine anche il relativo termine di interazione.
Come ultimo passo, sette diversi classificatori, tra cui quattro dei più diffusi e consolidati approcci (alberi decisionali, Support Vector Machines, regressione logistica, K-Nearest-Neighbors) e tre metodi ensemble (regressione logistica ensemble, Random forests e Gradient Boosting) sono stati confrontati in termini di performance nell’identificare le perdite uditive sulla base del criterio dell’OMS per i problemi di udito lievi (criterio 1). La loro prestazione nella classificazione è stata valutata attraverso una serie di metriche, tra cui la percentuale di record correttamente classificati, sia "pass" che "fail", nelle partizioni del dataset (accuratezza dell'addestramento e del test), la quota di soggetti senza ipoacusia (“pass”) correttamente classificati (specificità) e la quota di soggetti con ipoacusia (“fail”) correttamente classificati (sensibilità).
Risultati: l’analisi della possibile influenza del sesso, dell'orecchio testato (destro/sinistro) e dell'età sui dati raccolti ha rivelato che nessun effetto significativo è presente per quanto riguarda il sesso dell'utente né l'orecchio testato, mentre un effetto significativo è presente per quanto riguarda l’età, in quanto l’aumento dell’età è associato ad un peggioramento nei risultati del test.
Sono stati considerati tre gruppi: ‘Giovani’ (i.e., età: 20 - 25 anni), ‘Adulti’ (i.e., età: 25 - 60 anni) e ‘Anziani’ (i.e., età ≥ 60 anni).
Le capacità di riconoscimento vocale nel rumore peggiorano, come riportato dall’SRT, che da un valore medio di -15,86 dB SNR nel gruppo dei giovani aumenta a -12,86 dB SNR negli adulti e infine aumenta di nuovo a -6 dB SNR negli anziani. Inoltre, anche la soglia uditiva media dei toni puri passa da un valore medio di 0 dB HL nei soggetti giovani ad un
XVI
valore di circa 20 dB HL negli adulti ed infine ad un valore molto più alto, di circa 31 dB HL, negli anziani.
La durata del test, invece, sembra rimanere piuttosto costante, indipendentemente dall'età, in quanto gli utenti più giovani richiedono un numero maggiore di stimoli prima di finire il test, ma rispondono più velocemente ad ogni proposta di VCV, mentre i soggetti più anziani in genere rispondono a meno stimoli in quanto forniscono in media prestazioni peggiori nel test e quindi raggiungono il criterio di stop (cioè 12 inversioni) prima, ma ogni volta impiegheranno più tempo a selezionare la singola risposta.
Per quanto riguarda la multicollinearità tra gli attributi di classificazione, il volume di test selezionato non ha mostrato alcuna correlazione significativa con le altre variabili, ad eccezione di una debole correlazione negativa con il tempo di reazione medio.
L’SRT ha mostrato invece una correlazione moderata con quasi tutte le altre variabili, e una forte correlazione (r=0.83) è stata osservata solo con la percentuale di risposte corrette. La correlazione tra SRT e il risultato binario della PTA è moderata (r=0.66) e in linea con i valori riportati in letteratura per altri SNT online simili, quali Earcheck e Occupational Earcheck.
I modelli lineari generalizzati implementati per valutare l'SRT rispetto alla PTA binaria hanno mostrato un contributo significativo dell'SRT sia per la rilevazione di deficit uditivo lieve che moderato. Per questo, l’SRT è uno dei migliori candidati per discriminare la presenza di ipoacusia come definita dall’OMS a partire dalle soglie uditive dei toni puri. La variabile più fortemente correlata con il target è l'età (r=0.76), tuttavia anche altri attributi, come il numero di risposte corrette e il tempo medio di reazione, sono abbastanza correlate con il risultato dello screening (r= -0.62 e 0.53, rispettivamente), suggerendo che anch’esse possano essere variabili utili ai fini della classificazione.
Gli scatterplot di variabili accoppiate sono stati valutati rispetto alla capacità di separare i record "pass" e "fail". Caratteristiche come l'SRT, l'età, il numero di risposte corrette e il tempo di risposta medio consentono di avere una separazione abbastanza definita tra le due classi, sia per il criterio 1 che per il criterio 2, in quanto le istanze “pass”, ad esempio, sono raccolte in corrispondenza di valori di SRT bassi (cioè migliori), età più avanzata, numero più alto di risposte corrette, tempo di reazione di una singola risposta più basso...
Al contrario, altri parametri quali il tempo di esecuzione totale del test e il volume hanno mostrato una minore capacità di separare le due categorie, poiché la distribuzione delle
XVII
osservazioni nelle due classi è molto più ampia e senza evidenti relazioni con la coppia di variabili considerate.
Le curve ROC sono state costruite variando progressivamente la SRT e selezionando la SRT soglia come il valore più vicino al classificatore ideale (cioè l'angolo in alto a sinistra della curva ROC). Per quanto riguarda il criterio 1, una SRTcut-off di -8.75 dB SNR ha prodotto un AUC pari a 0.83, una specificità di 0.84, una sensibilità del 0.76 e una accuratezza di 0.81. Considerando il criterio 2, una SRTcut-off di -6 dB SNR ha prodotto valori migliori in termini di AUC (0.89), sensibilità (0.89) e accuratezza (0.83), ma una specificità leggermente inferiore (0.81).
I GLM che valutano gli altri attributi rispetto alla PTA binaria hanno mostrato che, ad eccezione del volume e della durata totale del test, tutte le altre variabili contribuiscono significativamente alla predizione dei danni uditivi, per quanto riguarda i due criteri OMS per i deficit uditivi qui considerati. Tuttavia, l'entità della varianza della variabile dipendente spiegata dal singolo predittore è risultata essere piuttosto bassa, con un valore massimo osservato pari a 0.40 (predittore: età; criterio: 1). Un miglioramento della bontà del GLM è stato ottenuto utilizzando modelli che includevano la SRT e ciascuna delle altre variabili come predittori, raggiungendo un valore massimo di R2 aggiustato, pari a 0.44 (predittori: età, SRT; criterio: 1).
Le interazioni tra gli attributi e SRT non sono risultate in generale significative e anche nei casi in cui lo erano, non hanno portano miglioramenti tangibili al modello, suggerendo una influenza limitata, oppure nulla, dei termini di interazione nei confronti della variabile predetta. Sulla base dei risultati della caratterizzazione degli attributi e dei GLM precedentemente descritti, 7 diversi set di attributi e 7 diversi approcci di apprendimento supervisionato (Alberi decisionali (DT), Support Vector Machines (SVM), regressione logistica, K-Nearest-Neighbor, regressione logistica ensemble, Random forests and Gradient boosting) sono stati considerati.
In questa valutazione preliminare, la regressione logistica e le Support Vector Machines sembrano ottenere i migliori risultati in termini di prestazioni di classificazione, con un AUC di 0.91, una accuratezza sul test set pari a 0.82, una specificità di 0.82 e una sensibilità intorno a 0.8.
Anche le tecniche Random forest e Gradient boosting hanno dimostrato di essere classificatori promettenti, avendo ottenuto la stessa specificità dei metodi precedenti (i.e.,
XVIII
0.82) e valori leggermente minori in termini di AUC (0.87) e accuratezza sulla partizione di test (rispettivamente di 0.79 e 0.78). Tuttavia, la loro capacità di rilevare i soggetti con perdite uditive, rappresentata dalla sensibilità, è risultata essere troppo bassa (0.73 e 0.7). KNN ha prodotto un AUC pari a 0.85 e una specificità di 0.77, che risultano essere inferiori rispetto alle tecniche precedenti. Tuttavia, ha fornito una accuratezza di test pari a quella riscontrata per il Gradient boosting (i.e., 0.77) e una migliore sensibilità (0.77) rispetto a Random forest e a Gradient boosting.
Purtroppo, il metodo di regressione logistica ensemble è andato incontro ad overfitting, come si può notare dalla grande differenza tra l’accuratezza di training (0.95) e quella di test (0.78) e per questo motivo non è risultato essere praticabile in questa valutazione preliminare, poiché potrebbe portare a errori di predizione significativi sui nuovi record.
Per quanto riguarda gli alberi decisionali, essi possiedono il vantaggio di essere l’approccio più veloce e di fornire i risultati maggiormente interpretabili. Tuttavia, la performance di classificazione dei DT, in questo studio preliminare, è risultata essere la peggiore, soprattutto in termini di AUC (0.74). L'AUC ottenuta con alberi decisionali basati su un set di sole 4 caratteristiche è più alta (0.82), ma ancora minore rispetto a quella ottenuta per altri algoritmi di classificazione.
Discussione e conclusioni: è stato osservato un significativo peggioramento dei parametri del test all'aumentare dell’età, considerando tre gruppi (Giovani, Adulti e Anziani).
I soggetti giovani (i.e., età: 20-25 anni) hanno mostrato eccellenti capacità di riconoscimento del parlato nel rumore; nel gruppo Adulti (i.e., età: 25-60 anni) le prestazioni risultano moderate e nel considerare gli Anziani (i.e., età ≥ 60 anni) le prestazioni hanno un consistente peggioramento. Infatti, caratteristiche come l'SRT, le soglie medie dei toni puri, il punteggio del questionario HHIE-S e il tempo di reazione medio tendono ad aumentare mentre il numero di prove, il numero di risposte corrette e di conseguenza la percentuale di risposte corrette tende a diminuire all'aumentare dell'età, mostrando un peggioramento generale nei risultati del test e di conseguenza capacità più povere nel riconoscere il parlato nel rumore. Invero, l’aumento delle soglie uditive e una diminuzione nelle capacità di riconoscimento verbale, specialmente nel rumore, sono tra i primi sintomi dei deficit uditivi legati all'età. Le capacità di discriminazione ottenute per il criterio 1, considerando la classificazione degli individui sulla base della SRT misurata, sono pienamente paragonabili a risultati ottenuti in
XIX
precedenza considerando un campione ridotto di soggetti (i.e., 98 soggetti) e ottenendo valori di cut-off simili (i.e., -8 dB SNR e -10dB SNR).
Confrontando le performance osservate per il criterio 1 e il criterio 2, per quest’ultimo sono stati riscontrati valori migliori in termini di AUC, sensibilità e accuratezza e valori leggermente inferiori di specificità. Le prestazioni di classificazione dell'SRT per il criterio 2 corrispondono alle misure ottenute per il test Speech Understanding in Noise, un altro SNT basato sullo stesso materiale vocale e lo stesso task di riconoscimento (scelta forzata a tre alternative) e una procedura di test a livelli fissi, ovvero non adattativa. Tuttavia, è necessario notare che il numero di record della popolazione testata, appartenenti alla classe "fail" per il criterio 2 comprende solamente pochi soggetti (i.e., 18), pertanto questi risultati necessitano di essere ulteriormente dimostrati dopo che un numero più elevato di soggetti con problemi di udito moderato sarà testato in studi futuri.
Per quanto concerne l’analisi dell’intero set di variabili, la valutazione della matrice di correlazione e delle matrici di scatterplot ha suggerito che il volume e la durata totale del test non portano alcun contributo importante nella classificazione delle ipoacusie.
Queste considerazioni sono state ulteriormente confermate dall’analisi dei GLM a singolo predittore, su queste features e dai GLM a più predittori (i.e., che includevano la SRT e ciascuna di queste features).
In queste analisi preliminari il volume può essere escluso dall'insieme degli attributi, in quanto risulta essere meno informativo, probabilmente poiché solo alcuni partecipanti hanno deciso di aggiustarne il valore in base alle proprie esigenze, mentre la maggioranza ha mantenuto il valore di default in quanto lo ha ritenuto adatto per l’esecuzione del test. Anche la durata totale del test sembra essere una feature trascurabile ai fini della classificazione, poiché non varia in maniera sostanziale al variare delle soglie uditive, nella popolazione testata. Ciò è legato ad un'azione di compensazione, dovuta al fatto che le persone che ottengono buoni risultati nel test devono compiere un numero maggiore di prove prima di giungere alla fine del test, ma rispondono in modo più rapido a ciascuna prova, in quanto sono meno esitanti nell’identificare i VCV. D'altra parte, gli individui con prestazioni di riconoscimento verbale peggiori, eseguono meno prove, ma possono impiegare in media lo stesso tempo totale di test di coloro che hanno prestazioni migliori, poiché hanno tempi di risposta maggiori per via della loro maggiore esitazione nel dare le risposte. Di
XX
conseguenza, i soggetti tendono ad impiegare più o meno lo stesso tempo per eseguire il test, quasi indipendentemente dai risultati ottenuti nel test.
Al contrario, per via delle considerazioni fatte qui sopra, la selezione del tempo medio necessario per rispondere ad uno stimolo può essere un parametro interessante per discriminare il risultato dello screening, in quanto può indirettamente riflettere la capacità del soggetto di riconoscere gli stimoli.
Oltre alle caratteristiche precedentemente considerate, la rimozione del risultato del questionario HHIE-S può accelerare la procedura sperimentale e ridurre la presenza di possibili distorsioni che sono frequentemente osservate nei questionari e potrebbero essere dovute a una ridotta auto-percezione della presenza di problemi uditivi, maggiormente osservata negli anziani.
Prestazioni comparabili sono state ottenute con diversi set di attributi, dimostrando che l'esclusione delle caratteristiche meno informative o di quelle che mostravano una maggiore correlazione con altre caratteristiche, non ha influenzato le prestazioni complessive della classificazione, ma può al contrario essere utile, ad esempio, per accelerare l'addestramento dell'algoritmo e per ridurre l'overfitting.
Tra i diversi approcci qui considerati, SVM e la regressione logistica sembravano essere gli approcci più promettenti. Essi hanno inoltre ottenuto risultati migliori in termini di sensibilità e AUC rispetto alla classificazione basata sulla sola SRT.
La performance osservata con algoritmi di Support Vector Machine e regressione logistica ha raggiunto un livello di accuratezza moderato, in linea con i risultati ottenuti per altri tra i più diffusi test di speech-in-noise automatici. Tuttavia, la sensibilità necessita di essere ulteriormente migliorata, poiché circa un quinto dei soggetti esaminati che presenta una perdita uditiva è erroneamente classificato come normo udente.
Inoltre, la selezione delle partizioni di training e di test in dataset di piccole dimensioni, come quello qui considerato, può introdurre delle variabilità nella classificazione. In questo studio, la potenziale varianza dovuta a cambiamenti nei dati è stata trattata considerando la performance media su 1000 iterazioni del modello. I risultati hanno evidenziato performance medie simili sia considerando diversi algoritmi di classificazione che diversi set di attributi. Le deviazioni standard ottenute sono relativamente basse (minori di 0.1) per parametri come accuratezza e AUC, hanno raggiunto valori intorno a 0.1 per la F-measure e la specificità e valori leggermente maggiori per quanto riguarda FNR, precisione e sensibilità (ad es: 0.17,
XXI
0.12 e 0.17 per quanto riguarda Gradient boosting). Per via di questa variabilità intrinseca, la performance di classificazione del singolo modello ottimizzato può essere sostanzialmente differente dalla performance media. Ulteriori studi su un campione più esteso potrebbero permettere di minimizzare questa variabilità, riducendo la dipendenza dai dati, in quanto ogni partizione tende a essere ugualmente rappresentativa del dataset originale quando la dimensione del campione viene notevolmente aumentata. In seguito, si potrebbero definire dei modelli ottimizzati, e si potrebbe ottenere una regolazione più fine degli iper-parametri in modo da avvicinarsi ulteriormente allo sviluppo di un’applicazione smartphone di screening uditivo per adulti.
Sono necessarie ulteriori ricerche per validare il test di speech-in-noise e il metodo di classificazione sia per il criterio 1 che per il criterio 2, su una popolazione molto più ampia che coinvolga un numero maggiore di soggetti ipoacusici, anche con gradi di ipoacusia più severi.
Keywords: perdita uditiva; screening uditivo; audiometria tonale; test speech-in-noise; apprendimento supervisionato; classificazione; machine learning; modelli lineari generalizzati
1
Contents
1. Introduction ... 1 1.1 The auditory system ... 1 1.2 Hearing loss ... 2 1.3 Hearing tests ... 5 1.4 Speech-in-noise tests ... 7 1.5 Machine learning for medical applications ... 9 1.6 Thesis objectives ... 11 2. Background ... 13 2.1 Test design and implementation ... 13 2.2 Test stimuli ... 15 2.3 Experimental procedure ... 16 3. Materials and methods... 21 3.1 Participants ... 21 3.2 Features extracted ... 22 3.3 Correlation Matrix ... 23 3.4 Generalized Linear Models ... 24 3.5 ROC curves ... 25 3.6 Classification ... 26 3.6.1 Data Preparation ... 26 3.6.2 Decision Trees ... 28 3.6.3 Support Vector Machines ... 29 3.6.4 Logistic Regression ... 30 3.6.5 K-Nearest-Neighbor ... 31 3.6.6 Ensemble Logistic Regression ... 33 3.6.7 Randoms Forests ... 34 3.6.8 Gradient Boosting ... 35 3.6.9 Metrics to evaluate the performance of a classifier ... 37 4. Results ... 40 4.1 Statistical characterization of test variables ... 40
2
4.1.1 Statistical characterization of test variables: left vs right ear ... 40 4.1.2 Statistical characterization of test variables: male vs. female ... 41 4.1.3 Statistical characterization of test variables as a function of age ... 41 4.2 Correlation between test variables (features) and outcome statistical feature characterization ... 43 4.3 Statistical characterization of features as predictors of hearing loss ... 50 4.3.1 Evaluation of SRT and age as predictors of PTA outcome ... 50 4.3.2 ROC curves ... 50 4.3.3 Evaluation of other test variables as predictor of PTA outcome ... 51 4.4 Classification ... 55 4.4.1 Decision Trees ... 56 4.4.2 Support vector machines ... 61 4.4.3 Logistic regression ... 62 4.4.4 K-Nearest Neighbor ... 63 4.4.5 Ensemble logistic regression ... 64 4.4.6 Random Forests ... 65 4.4.7 Gradient Boosting ... 67 4.4.8 Comparison between classification algorithms ... 69 5. Discussion and conclusions ... 77
5.1 Distribution of variables according to ear tested, gender and age of the
participants ... 77 5.2 Correlation between test variables ... 79 5.3 Relationship between SRT and WHO criteria ... 80 5.4 Relationship between other test variables and WHO criteria ... 82 5.5 Feature selection ... 83 5.6 Evaluation of classification outcomes ... 85 5.7 Innovations ... 90 5.8 Limitations and further research ... 91 5.9 Conclusions ... 92 References………...94
3
List of Figures
Figure 1. Main components of the auditory system and the sound transmission chain. ... 1 Figure 2. Main leading causes of sensorineural, conductive, and mixed hearing loss. ... 4 Figure 3. Example of an audiogram, showing the hearing thresholds at the tested
frequencies (250-8000 Hz), for both ears. ... 5 Figure 4. Hearing Handicap Inventory for the Elderly Screening Version (HHIE-S)
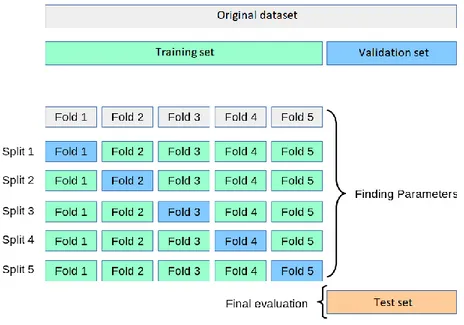
questionnaire, including 10 questions aimed at the self-perception of social and emotional consequence of hearing loss. ... 18 Figure 5. Sample screenshot of test outcomes. A summary of the main information
extracted is displayed. At the bottom, a graphical representation of the cross-cluster staircase is shown. Correct trials correspond to green arrows whereas incorrect trials are represented as red arrows. The black point stands for the SRT value, computed along an Average Psychometric Function. ... 20 Figure 6. K-fold cross-validation procedure. The training set is partitioned into k subset. At each iteration k-1 folds are used as training set and the remaining one is used as validation set ... 27 Figure 7. Decision surfaces for Support Vector Machine classifiers implementing different kind of kernels. ... 30 Figure 8. Standard logistic function curve, presenting a s-shape, ranging from 0 to 1... 31 Figure 9. KNN classification example showing the influence of the number of neighbors k in the prediction output. Considering k=3 the new observation will be associated to class 0 whereas considering k=5 the observation will be associated to class 1. ... 32 Figure 10. Summary scheme of an ensemble logistic regressor implementing stacking approach... 34 Figure 11. Random forest scheme. ... 35 Figure 12. Panel a represents an example of overfitting: the model is very good at fitting past data (accuracy on the training set is 100%) but it has very poor generalization capabilities (great error on the test set, i.e. low accuracy on the test set). Panel b shows instead a good model that is able to guarantee a trade-off between explanation of past data and generalization of future data (Vercellis, 2009)….. ... 39
4
Figure 13. Distributions of the number of correct responses considering a partition of the dataset into three groups, by age. ... 43 Figure 14. Correlation matrix between the features extracted from the dataset. The
corresponding correlation coefficient is reported in each cell, while the strength of the relationships is represented by the color of the cell. Cells colored in red are positively correlated whereas blue cells represent features negatively correlated. ... 45 Figure 15. Scatter plots of paired features referred to criterion 1. Along the main diagonal the distribution of each single feature in the two classes is represented. Green marks: tested ears with PTA ≤ 25 dB HL. Red marks: tested ears with PTA > 25 dB HL. ... 47 Figure 16. Scatter plots of paired features referred to criterion 2. Along the main diagonal the distribution of each single feature in the two classes is represented. Green marks: tested ears with PTA ≤ 40 dB HL. Red marks: tested ears with PTA > 40 dB HL. ... 48 Figure 17. Scatterplots of SRT combined with Age for criterion 1 (left panel) and criterion 2 (right panel)………...49 Figure 18. Scatterplots of the average reaction time combined with the number of correct responses for criterion 1 (left panel) and criterion 2 (right panel)...………49 Figure 19. Scatterplots of the total test duration combined with the volume for criterion 1 (left panel) and criterion 2 (right panel)………...49 Figure 20. ROC curves. The left panel is related to criterion 1 and the right one to criterion 2. The cross on each graph represents the point associated to the candidate SRT cut-off. . 51 Figure 21. Optimal DT model for classification of ears into ‘pass’ and ‘fail’ using the full set of features as input variables and the WHO definition of normal hearing /mild hearing loss as output variable. No constraints on the maximum depth have been defined. ... 57 Figure 22. Optimal DT model for classification of ears into ‘pass’ and ‘fail’ using only four features as input variables (‘SRT’, ’Age’, ’#Correct’ and ‘Avg_reaction_time’) and the WHO definition of normal hearing /mild hearing loss as output variable. No constraints on the maximum depth have been defined. ... 59 Figure 23. Optimal DT model for classification of ears into ‘pass’ and ‘fail’ using only four features as input variables (‘SRT’, ’Age’, ’#correct’ and ‘Avg_reaction_time’) and the WHO definition of normal hearing /mild hearing loss as output variable. Maximum depth has been set equal to 3. ... 61
5
Figure 24. Relative importance scores for each input feature of the model, respectively for the forest considering all the features (left panel) and the one considering only 4 features (right panel). ... 67 Figure 25. Training accuracies for the seven different machine learning approaches, considering the whole set of features or a subset of four features. ... 69 Figure 26. Test accuracies for the seven different machine learning approaches,
considering the whole set of features or a subset of four features. ... 69 Figure 27. Area under the ROC curve (AUC) for the seven different machine learning approaches, considering the whole set of features or a subset of four features. ... 70 Figure 28. Specificities for the seven different machine learning approaches, considering the whole set of features or a subset of four features. ... 70 Figure 29. Sensitivities for the seven different machine learning approaches, considering the whole set of features or a subset of four features. ... 71 Figure 30. True positives for the seven different machine learning approaches, considering the whole set of features or a subset of four features. ... 71 Figure 31. False negatives for the seven different machine learning approaches,
considering the whole set of features or a subset of four features. ... 72 Figure 32. False negative rates for the seven different machine learning approaches, considering the whole set of features or a subset of four features. ... 72 Figure 33. Precisions for the seven different machine learning approaches, considering the whole set of features or a subset of four features. ... 73 Figure 34. F-scores for the seven different machine learning approaches, considering the whole set of features or a subset of four features. ... 73
6
List of Tables
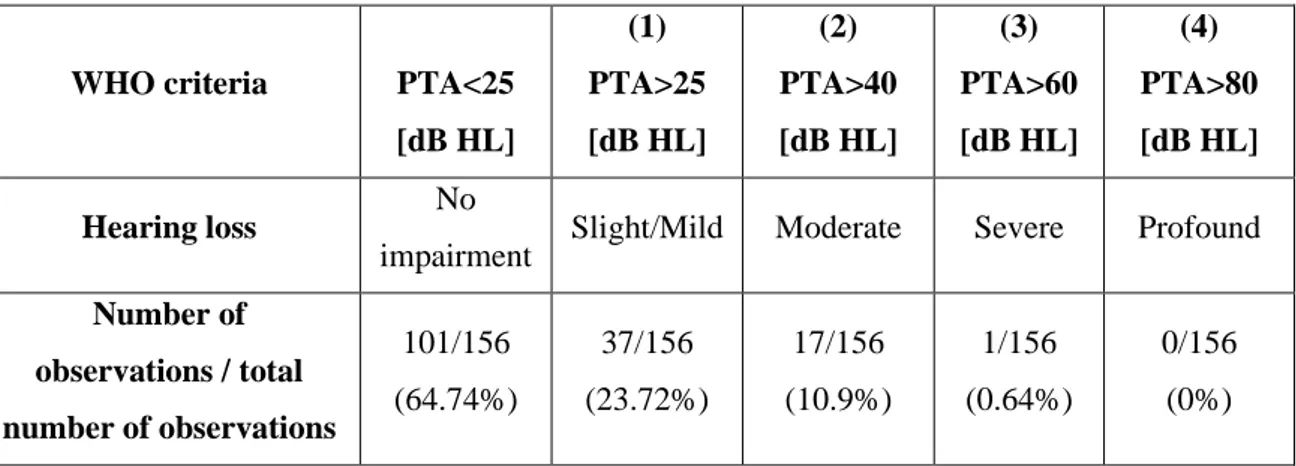
Table 1. Sample subdivision according to WHO criteria for hearing impairment. First row: WHO classification in relation to the mean value of the PTA, obtained for the four central frequencies tested (0.5, 1, 2, and 4 kHz) Second row: degrees of hearing impairment. Third row: number of observations fulfilling each criterion, with respect to the total number of observations and relative percentage. ... 21 Table 2. Distribution of the dataset observations according to the ear tested. The column on the far right shows the p-value of Wilcoxon rank sum test between the features’
populations related to the right ears and the one related to the left ears... 40 Table 3. Distribution of the dataset observations according to gender of the tested person. The column on the far right shows the p-value of Wilcoxon rank sum test between the features’ populations related to male and the one related to female. ... 41 Table 4. Distribution of the dataset observations according to age of the tested person. The column on the far right shows the p-value of Wilcoxon rank sum test between Young ad Adults (a), Adults and Elderly (b) and Young and Elderly (c)... 42 Table 5. Values of SRT cut-off, AUC, sensitivity, specificity and accuracy for the two WHO criteria. ... 51 Table 6. R squared adjusted and p-value of each predictor for 3 different kind of GLM, selecting as response class the binary vector ("pass"/"fail") related to criterion 1. ... 52 Table 7. R squared adjusted and p-value of each predictor for 3 different kind of GLM, selecting as response class the binary vector ("pass"/"fail") related to criterion 2. ... 53 Table 8. Classification performance and variability of performance of the DT models with different input features... 58 Table 9. Classification performance and variability of performance of the DT models with three different limitations on the maximum depth achievable by the tree. ... 60 Table 10. Classification performance and variability of performance of the SVM models with different input features. ... 62 Table 11. Classification performance and variability of performance of the logistic
7
Table 12. Classification performance and variability of performance of the KNN models with different input features. ... 64 Table 13. Classification performance and variability of performance of the ensemble logistic regression models with different input features. ... 65 Table 14. Classification performance and variability of performance of the optimal DT models with all (left) and with four (right) input features. Results for forests with 10, 50 and 100 are reported. The execution time is approximated as multiple of the time required for the training of a decision tree (k). ... 66 Table 15. Classification performance and variability of performance of Gradient Boosting models with all and with only four input features. Results for attempts without and with optimization are reported. The execution time is approximated as multiple of the time required for the training of a decision tree (k). ... 68
1
1.
Introduction
1.1 The auditory system
The auditory system consists of three main components: the outer, the middle, and the inner ear, allowing sounds to be transferred from the external environment to the high processing centers in the brain.
A sound is defined as a mechanical vibration (i.e., alternation of rarefaction and compression of the molecules) propagating through an elastic medium.
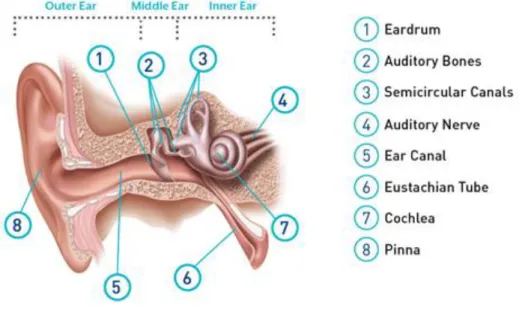
The general structure of the auditory system is represented in Figure 1.
Figure 1. Main components of the auditory system and the sound transmission chain.
The outer ear comprises the pinna, also called auricle, which is the external cartilaginous structure that collects sounds and funnels them inward and the ear canal, located in the temporal bone, that acts as a resonator with a peak at 3kHz and allows sounds to travel toward the eardrum.
The middle ear includes the eardrum, or tympanic membrane, which is a thin layer of tissue that vibrates when a pressure wave hits it and the ossicular chain, formed by 3 small bones called malleus, incus and stapes, that amplifies the signal received from the eardrum and transfers energy to the inner ear that, in turn, allows the motion of the cochlear fluid. Since the impedance of the air is much lower with respect to the one of the internal fluids, the middle ear act as a transformer, ensuring impedance matching.
2
Finally, the inner ear is composed by the cochlea, which is the hearing sensory organ and the vestibular system that controls equilibrium and balance of the human body.
The cochlea is a snail-shaped structure that comprises three chambers filled with fluids (Scala vestibuli, Scala tympani and Scala media) and contains the basilar membrane and the Organ of Corti. The basilar membrane works as a bank oscillator and exploits the concept of frequency coding, separating sounds according to their frequency. Indeed, each section of the basilar membrane presents a maximum oscillation at a certain frequency. The basal portion of the basilar membrane encodes high frequencies whereas the apex encodes lower frequencies.
The Organ of Corti is characterized by the presence of ciliated cells, called hair cells, arranged in rows along the basilar membrane. Hair cells are the sensory cells that convert the vibration of the membrane into a ‘code’ understandable at neural level. These cells have bundles of stereocilia on their apical surface and are divided into inner and outer hair cells, exploiting different functions, along with different structures. Inner hair cells act as transducers of a sound in the audible range in an afferent nervous impulse. In particular, the oscillation of the basilar membrane causes a deflection of the stereocilia which put the cross link under tension and in turn causes the opening of ionic channels in the cellular membrane. The incoming external sound is therefore converted into pulses delivered to the auditory nerve (VIII cranial nerve). The pulses are then carried to the brainstem and finally processed in the nuclei of the temporal lobes.
Alteration and damages, as well as pathologies, can afflict the different blocks of the auditory chain causing a loss of the subject’s hearing ability.
1.2 Hearing loss
As stated by the World Health Organization, it is estimated that over 6.1% of the world’s population suffers from hearing loss, making it the fourth leading cause of disability worldwide (World Health Organization, 2018). Almost half a billion people are affected by this disability, of which 93% are adults and 7% children, and this number is expected to double by 2050.
A normal hearing person is defined as having hearing thresholds of 25 dB or better (i.e., lower) in both ears. People with worse hearing abilities than these have a disabling hearing
3
loss. Hearing loss can have different degree of severity (i.e., mild, moderate, severe, or profound) and may affect only one ear or both.
Mild to severe hearing loss is referred to as ‘Hard of hearing’ and leads to the need of assistive devices such as hearing aids or cochlear implants. People belonging to these hearing loss categories can communicate with spoken language and do not need to use sign language, which is instead a necessity for people with profound hearing loss, referred to as deaf people. Hearing loss can be due to different causes, which are grouped into two main families: congenital or acquired. Congenital causes are related to hearing loss already present at birth or manifested slightly after and may be due to genetic factors, both hereditary and non-hereditary, complications during pregnancy (infections, inappropriate use of particular drugs..) or immediately after birth (i.e., low weight, asphyxia…). Acquired causes, instead, can occur at any age and some examples are meningitis and other infections, otitis media (fluid accumulates in the ear, quite commonly among children), head injuries, excessive noise (i.e., occupational noise or prolonged exposure to loud sounds for entertaining purposes).
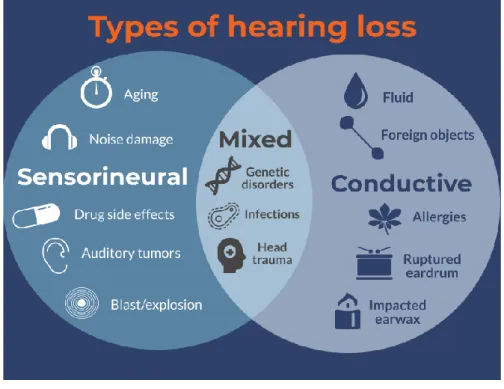
According to the section of the auditory system affected, 3 kinds of hearing loss can be distinguished: conductive hearing loss, sensorineural hearing loss and mixed hearing loss. Conductive hearing loss is due to damages or obstructions within the outer or middle ear, that prevent sounds from reaching the inner ear properly. This kind of hearing loss, which has no frequency dependency, results in a flat audiogram.
Sensorineural hearing loss, instead, is more common than the previous one and it is due to damages to the inner ear nerves and cells, which prevent sound from being projected at higher levels. In this type of hearing loss, some frequencies are usually more involved than others (typically LF in babies and HF in older people). This disease hugely affects hearing and, in most cases, cannot be resolved by surgical procedures, however the use of hearing aids can be helpful.
Lastly, when the damage involves both the outer and inner ear or the auditory nerve, so there is a combination of conductive and sensorineural hearing impairment, this refers to a mixed hearing loss. Figure 2 shows the main causes leading to different types of hearing loss.