POLITECNICO DI MILANO
School of Industrial and Information Engineering
Master’s Degree Course in Materials Engineering and Nanotechnology
Department of Mechanical Engineering
3D-PRINTED BIOMIMETIC COMPOSITE
STRUCTURES OF THE HUMAN CORTICAL BONE
Supervisor: Prof. Laura Maria VERGANI
Co-Supervisor: Prof. Chiara COLOMBO
Prof. Flavia LIBONATI
Prof. Mohammad Mirzaali MAZANDARANI
PhD Cand. Federica BUCCINO
Master Thesis’ Candidate:
Gino Tonarelli
Matr. 899631
Abstract
In the last decades, there is an increasing interest in materials that are able to overcome the limitations of traditional ones, especially regarding their low versatility.
The scientists start to look to the natural world, that is considered a source of inspiration. This insatiable curiosity has given rise to the science of biomimetics, whose key concept concerns the inspiration from nature, so as to mimic its morphologies, bringing out innovative solutions to scientific problems.
Among the existing materials, the study of the human bone structure has found fertile ground and, in particular, the cortical bone has often been taken as model since it shows noteworthy mechanical properties, comparable with the ones of the engineering materials like ceramics and metal alloys. This is due to its internal structure, arranged in hierarchically organised components. It is proved that this tissue presents considerable fracture resistance, especially if subjected to torsion, due to its fundamental functional unit, the osteons.
In this project, the purpose lies in the design of a 3D bioinspired composite structure, a macroscopic cylindrical specimen, characterized by a matrix made of a polymeric stiff material (VeroCyanTM,
E≈735 MPa), inside which a soft rubber is embedded (Agilus30TM, E≈0.8 MPa), capable of providing
adequate resistance to the applied load. The stiff matrix imitates the mineralized lamellae which surround the osteons, while the soft inclusions mimic the osteons themselves.
Focusing on this and considering the torsional load, analytical, numerical and experimental methods are developed and various geometrical features are analysed like the cortex thickness, which is a sort of circumferential lamellar cover that coats the set of osteons, the b/a ratio and the inclination angle, seeking in them the possible reasons for these remarkable characteristics. For all the studied structures, some parameters are maintained constant such as the osteon volume fraction, fixed to 50%, and the osteon area, set to ≈7.07 mm2 with an osteon diameter of 3 mm.
In order to replicate and test the small-scale geometries of the structures, the additive manufacturing process of 3D-printing is exploited, printing three samples for each selected structure. For these reasons, the laboratories of Industrial Design (IDE) and Biomechanical Engineering (BMechE) at TU
Delft University offered the computational and experimental instruments to deepen the topic of the
project, contributing to identify the mechanical behaviours and their variability.
At the end of the analyses, increasing the cortex thickness and decreasing the b/a ratio, so going from more spindle-shaped structures to cylindrical ones, the mechanical response increases consequently and the shape of osteon influences structure’ properties. The inclination angle seems not to make any remarkable contribution. The best structures in terms of reached stress and deformations are the ones with concentric circular layer, Conc Lay, and with cylindrical osteons, Cyl. Furthermore, it is noticed that, in terms of the stiffness k parameter and shear modulus G, the analytical and numerical results are quite reliable within the fixed linearity range of 20°. Some mismatches arise between the computational and experimental ones due to plastic behaviour at the borders of structures. In this region, the results are well predicted just within low deformations. To overcome this problem, a preliminarycalibration of the VeroCyanTM is performed, in order to predict accurately the linear range and a first post-yield part.
Sommario
Nelle ultime decadi, si è verificato un interesse crescente nei materiali che sono in grado di superare i limiti dei materiali tradizionali, specialmente per quanto riguarda la loro versatilità.
Gli scienziati hanno rivolto il loro sguardo al mondo naturale che, fin dai tempi antichi, è stato considerato come una fonte di ispirazione. Questa insaziabile curiosità ha dato vita alla scienza della
biomimetica, il cui perno è l’ispirazione alla natura, imitandone le sue morfologie, per apportare
soluzioni innovative ai problemi scientifici.
Tra i materiali esistenti, lo studio della struttura dell’osso umano è risultato di particolare interesse ed in particolare l’osso corticale è stato preso spesso come modello poiché mostra proprietà meccaniche sorprendenti, comparabili a quelle dei materiali ceramici o delle leghe metalliche. Ciò è dovuto ad una struttura interna, disposta in componenti organizzati gerarchicamente. Soggetto a differenti carichi, è stato dimostrato che questo tessuto presenta una considerevole resistenza alla frattura, specialmente se sottoposto a torsione, a causa della sua unità funzionale fondamentale: gli osteoni. In questo progetto, lo scopo è progettare una struttura bioinspirata a materiali compositi: si tratta di, un provino cilindrico, caratterizzato da una matrice costituita da un materiale polimerico rigido (VeroCyanTM, E≈735 MPa), dentro cui è integrata una gomma morbida (Agilus30TM, E≈0.8 MPa), capace di fornire un’adeguata resistenza al carico applicato. Il materiale più rigido dovrebbe imitare le lamelle mineralizzate che circondano gli osteoni, mentre l’altro polimero gli osteoni stessi.
Focalizzandosi su ciò e considerando il carico a torsione, sono stati sviluppati metodi analitici, numerici e sperimentali. Sono inoltre stati analizzati vari parametri geometrici, come lo spessore della
corteccia, che è uno strato che riveste l’insieme di osteoni, il rapporto tra assi b/a per l’ellisse e l’angolo di inclinazione, ricercando in essi le possibili ragioni per queste elevate proprietà
meccaniche a torsione dell’osso corticale. Per tutte le strutture studiate, alcuni parametri sono stati mantenuti costanti come la frazione di volume dell’osteone, fissata al 50% tra materiale rigido e soft, e l’area dell’osteone, stabilita a 7.07 mm2 con un diametro di 3 mm.
Per replicare e testare la geometria delle strutture ad una scala ridotta, si sfrutta il processo di stampa mediante additive manufacturing, producendo tre campioni per ogni struttura scelta. Per queste ragioni, i laboratori di Industrial Design (IDE) e Biomechanical Engineering (BMechE) alla TU Delft
University hanno dato la possibilità di usufruire delle loro attrezzature per analisi ed esperimenti,
contribuendo ad identificare i comportamenti meccanici delle strutture considerate.
Alla fine delle analisi, tra i parametri geometrici sopracitati, incrementando lo spessore della
corteccia e diminuendo il rapporto b/a, andando dunque da una forma più affusolata ad una cilindrica,
la risposta meccanica aumenta di conseguenza. Di conseguenza, la forma dell’osteone influenza le proprietà della struttura. L’angolo di inclinazione, invece, sembra non portare alcun contributo degno di nota. Le migliori strutture in termini di sollecitazioni e deformazioni raggiunte sono quelle con strato circolare concentrico, Conc Lay, e con osteoni cilindrici, Cyl. Inoltre, si nota che, in termini di parametri di rigidezza k e modulo di taglio G, utilizzati per misurare la risposta meccanica, i risultati analitici e numerici sono abbastanza affidabili entro l'intervallo di linearità fissato di 20 °. Alcune discrepanze sorgono tra i risultati computazionali e sperimentali a causa degli elevati effetti plastici ai bordi delle strutture, che sono considerabili solo a basse deformazioni. Per ovviare a questo problema, viene eseguita una calibrazione preliminare del VeroCyanTM, riuscendo a prevedere tutto
verso strutture composite a tre materiali, imitando la struttura del canale Haversiano nell’osteone e la linea cementizia, in modo tale da sopportare carichi maggiori ed ottimizzare le proprietà a torsione.
Index
Summary
1.1 STATE OF THE ART ... 1
1.1.1 Bioinspired materials ... 1
1.1.2 Bone-inspired structures ... 6
1.1.3 Torsional behaviour of biomimetic structures ... 14
1.2 OBJECTIVES ... 18
2.1 MATERIALS ... 19
2.2 SPECIMENS AND STRUCTURES’ DESIGN ... 22
2.2.1 Specimens’ design ... 22 2.2.2 Structures’ design ... 24 2.2.2.1 Homogeneous structures ... 24 2.2.2.2 Heterogeneous structures ... 25 2.3 METHODS ... 33 2.3.1 Analytical method... 33 2.3.2 Numerical method ... 37 2.3.3 Experimental method ... 39 3.1 Analytical results ... 42 3.2 Numerical results ... 43 3.2.1 Homogeneous structures ... 43 3.2.2 Heterogeneous structures ... 44 3.3 Experimental results ... 49
4.1 Comparison between analytical, FE and experimental results ... 57
4.2 Structures’ calibration ... 62
5.1 Conclusion of the thesis project ... 66
5.2 Future Insights ... 68
A.1 Finite element results for the heterogeneous structures ... 73
List
of
figures
Figure 1.1: (a) SEM image of the structure of velcro, with tiny hooks and loops, (b) SEM image of
shark skin, (c) Example of gecko foot ... 1
Figure 1.2: Ashby material-property plot of the specific values of strength and stiffness normalized by density for both natural and synthetic materials. Many engineering materials, particularly high-performance ceramics and metallic alloys, have values of strength and toughness that are much higher than those of the best natural materials but in some cases these last ones show a much more performing behaviour with respect to the engineering ones ... 2
Figure 1.3: SEM image showing the composite microstructure of nacre ... 3
Figure 1.4: Hierarchical structure of bamboo ... 3
Figure 1.5: Projections of fracture toughness and Young’s modulus for natural and synthetic materials. It is highlighted the comparison between the rule of mixture between the separated component (empty circle) and the actual behaviour of nacre and bone (the natural composites) (full circle), with respect to the synthetic ceramic material created mimicking natural architecture of the first one ... 4
Figure 1.6: The exemplification of the different strategies for materials choice and development (under the arrow) of biological and engineering materials governed by a very different choice of base elements and by a different fabrication modality ... 5
Figure 1.7: Bone structure ... 6
Figure 1.8: Hierarchical structure of bone ... 7
Figure 1.9: Bone microstructure, zooming on osteonal area ... 7
Figure 1.10: Hierarchical structure of the cortical bone ... 8
Figure 1.11: (a) Cylindrical twist, (b) Orthogonal plywood structure in an osteon ... 9
Figure 1.12: Illustration of the cortical bone microstructure with detailed of the osteon structure and remodelling region of interstitial lamellae and the possible cement line ... 10
Figure 1.13: Schematic illustration of the structure of the biomimetic composites with different fiber angles where the fibers are made of stiff and the matrix of soft material ... 11
Figure 1.14: (a) internal structure of the bio-inspired composite. Scanning electron microscopy images from backscattered electrons showing a cross-section of a sample of bio-inspired material, (b) the image (magnitude 40×) shows the region where the main crack propagates; the crack region is highlighted with a red dashed line circle, (c) the imagine (magnitude 100x) shows the crack deviation, from the intra-region to the inter region; the crack path is highlighted with a red dashed line ... 12
Figure 1.15: (a) Haversian structure from bovine femur (image from optical microscope), (b) design of bio-inspired structure, (c) cross section of the manufactured bio-inspired structure ... 12
Figure 1.16: Types of composite arrangement: (a) stiff circular osteons and soft matrix, (b) soft circular osteons and stiff matrix, (c) stiff elliptical osteons and soft matrix, (d) soft elliptical osteons and stiff matrix. The stiff and soft materials are respectively represented by red and blue colours .. 13 Figure 1.17: Representative images of the profiles and cross-sections of the ZrO2–epoxy composites
freeze cast under a rotating magnetic field of 0.12 T at the varying rotation speeds shown: (a) ZrO2–
epoxy composites composed of ≈40 vol.% ZrO2and ≈60 vol.% epoxy, (b) ZrO2 and ≈40 vol.% epoxy.
The letters ‘‘A’’ and ‘‘B’’ shown on the cross-sections represent the Fe3O4-rich helix-reinforced
regions and Fe3O4-poor non-reinforced regions, respectively. The diameters of all the composites are ≈7.5 mm ... 14 Figure 1.18: Surface shear stress–strain curves illustrating the torsional behaviour of ZrO2–epoxy
(60:40) composites with different angles of helix-reinforcement under clockwise (CW) applied torque ... 15 Figure 1.19: Representative images of the crack path and different failure mechanisms (yellow) due to the torsional loading of ZrO2–epoxy (40:60) composites with different angles of
helix-reinforcement: (i) no magnetic field; (j) 42°; (k) 73°; (l) 84°. Images of the cylindrical composites (left) show the direction of applied torque (red arrows) and magnified regions of interest (black boxes) ... 15 Figure 1.20: Schematics of helicoidal fiber structures: (a) plain; (b) ring and (c) helix. The left ones are the design models; the right ones are the 3D printed polymeric helicoidal fiber cores ... 16 Figure 1.21: Pitches angles and the Von Mises stress distribution ... 16 Figure 2.1: True stress curves for natural rubber as a function of uniaxial stretch predicted by a compressible neo-Hookean material ... 20 Figure 2.2: Results of tensile tests on the homogeneous soft and stiff materials ... 21 Figure 2.3: Standard specimen dimension with the gripper in dark grey and the gauge length in light grey... 22 Figure 2.4: Von Mises distribution for the three specimens’ combination. Fillet radius of: (a) 10 mm, (b) 25 mm, (c) 50 mm ... 23 Figure 2.5: (a) stiff material coloured in red, seen from different views, (b) soft material coloured in blue, seen from different views ... 24 Figure 2.6: Osteon shapes according to b/a ratio: (a) b/a=1, (b) b/a=1,5, (c) b/a=2.a is the minor axis, b is the major axis ... 26 Figure 2.7: Inclination angles of osteons: (a) 45°, (b) 90°, (c) same direction ... 26 Figure 2.8: Structure of the compact bone, highlighting the circumferential lamellae ... 27 Figure 2.9: Cortex increasing for cylindrical osteons: (a) unidirectional raising, (b) 0.1 mm, (c) 0.3 mm, (d) 0.5 mm, (e) 0.7 mm, (f) 1 mm ... 28 Figure 2.10: Designed structures: (a) cylindrical, (b) elliptical, (c) combination, (d) concentric layer ... 31
Figure 2.11: Cylinder in the polar coordinates and an infinitesimal element subjected to pure shear stress ... 33 Figure 2.12: A cylindrical piece subjected to pure shear stress provided by Mt, the applied moment. The principal stress along the normal direction are indicated ... 34 Figure 2.13: STEP imported files in Abaqus of Cylindrical structure with 0.1 cortex: on the left the matrix and on the right of the osteons ... 37 Figure 2.14: (a) reference point at the centre of the cross section, (b) coupling constraint at the RF on the cross section ... 38 Figure 2.15: (a) rotation displacement on RF around z-axis, (b) pinned boundary condition to the bottom surface, (c) the boundary conditions on the structure ... 38 Figure 2.16: (a) the homogeneous specimens where the left one is the soft and the right the stiff, (b) and (c) the temporary indistinguishable heterostructures just printed and ready to be cleaned ... 39 Figure 2.17: (a) example of printed specimen, (b) zooming on the grip to show: (1) b/a ratio, (2) inclination angle, (3) cortex thickness, (4) number of the sample ... 40 Figure 2.18: The Stratasys J720TM Dental 3D printer ... 40 Figure 2.19: (a) The Instron® E10000 Eletctropuls machine, (b) the mobile actuator which applies the displacement, (c) The homogeneous stiff specimen ready for testing ... 41 Figure 3.1: τ-γ trends for (a) hard and (b) soft homogeneous samples ... 42 Figure 3.2: Mt-θ curves of the homogeneous materials, where Hard is the stiff material and Soft the
soft one ... 43 Figure 3.3: Mt trend in function of: (a) the rotational angle θ and (b) cortex thickness (c). From left
to the right, the considered structures with cylindrical (Cyl), elliptical b/a=1.5 and inclination angle=45° (1.5 45), elliptical b/a=1.5 and inclination angle=90° (1.5 90) and elliptical b/a=2 and inclination angle=45° elliptical (2 45) osteons. Each marker corresponds to a cortex level ... 44 Figure 3.4: (a) Mt distribution depending on cortex, (b) studied structures, belonged to group (a) and
(b) of the Fig. 2.10 ... 45 Figure 3.5: (a) stiffness distribution to the increasing of cortex, (b) variation of the stiffness according to the considered heterostructures with 0.7 mm of cortex and (c) comparison of the former stiffness values with the homogeneous materials ones ... 46 Figure 3.6: Von Mises stress distribution of 0.7 mm of cortex of (a) Cyl, (b) 1.5 and (c) 2 90 ... 46 Figure 3.7: (a) the new considered structures which go from “Comb Cyl-1.5 45” to “Conc Lay”, written in the x-axis of the plots, (b) variation of the stiffness according to all the designed heterostructures with 0.7 mm of cortex, (c) comparison between the heterostructures and the homogeneous ones ... 47 Figure 3.8: (a) variation of the stiffness according to all the designed heterostructures with 0.35 and 0.7 mm of cortex, (b) comparison between the heterostructures and the homogenous ones ... 48
Figure 3.10: (a) stiff sample number 2 after torsional test, (b) soft samples number 2 and 3 after torsional test ... 50 Figure 3.11: (a) on the left reaction moment Mt distribution in function of the hetero-structures and on the right the comparison with the homogeneous samples, (b) stiffness k distribution depending on the heterostructures on the left and on the right the comparison with homogeneous samples. Each box plot contains the information of the three samples ... 52 Figure 3.12: Going from the top to the bottom: Mt-θ trend, the studied structures, Cyl, the failed
structures, the top view of the samples where it is possible to see the internal arrangement. On the left there are the structures with 0.35 mm of cortex and to the right the 0.7 mm one ... 53 Figure 3.13: Going from the top to the bottom: Mt-θ trend, the studied structures, 1.5 45, the failed structures, the top view of the samples where it is possible to see the internal arrangement. On the left there are the structures with 0.35 mm of cortex and to the right the 0.7 mm one ... 54 Figure 3.14: Going from the top to the bottom: Mt-θ trend, the studied structures, 2 90, the failed structures, the top view of the samples where it is possible to see the internal arrangement. On the left there are the structures with 0.35 mm of cortex and to the right the 0.7 mm one ... 55 Figure 3.15: Going from the top to the bottom: Mt-θ trend, the studied structures, Conc Lay, the failed structures, the top view of the samples where it is possible to see the internal arrangement. On the left there are the structures with 0.35 mm of cortex and to the right the 0.7 mm one ... 56 Figure 4.1: Comparison between numerical and experimental tests for homogeneous materials. On the left there is the Hard material and, on the right, the Soft one ... 57 Figure 4.2: Comparison between numerical and experimental results for cylindrical osteons, Cyl. On the left there is the structure with 0.35 mm of cortex and, on the right, the 0.7 mm one ... 59 Figure 4.3: Comparison between numerical and experimental results for elliptical osteons with b/a ratio of 1.5 and inclination angle of 45°, 1.5 45. On the left there is the structure with 0.35 mm of cortex and, on the right, the 0.7 mm one ... 59 Figure 4.4:Comparison between numerical and experimental results for elliptical osteons with b/a ratio of 2 and inclination angle of 90°, 2 90. On the left there is the structure with 0.35 mm of cortex and, on the right, the 0.7 mm one... 60 Figure 4.5: Comparison between numerical and experimental results for circular concentric osteons, Conc Lay. On the left there is the structure with 0.35 mm of cortex and, on the right, the 0.7 mm one ... 60 Figure 4.6: Comparison of stiffness values between numerical and experimental results in function of the structures. On the left there are the results for only the heterogeneous structures and, on the right, the previous results compared with homogeneous ones... 61 Figure 4.7: The new linearity range set at 50° ... 62 Figure 4.8: (a) comparison between the only FE results, (b) comparison between the FE and experimental results ... 62 Figure 4.9: (a) comparison between the only FE results and (b) comparison between the FE and
Figure 4.10: (a) comparison between the only FE results and (b) comparison between the FE and
experimental results for 1.5 45 ... 63
Figure 4.11: (a) comparison between the only FE results and (b) comparison between the FE and experimental results for 2 90 ... 63
Figure 4.12: (a) comparison between the only FE results and (b) comparison between the FE and experimental results for Conc Lay, (c) Mt-θ trend for rephased structures, deleting the initial plateau, caused by machine settlement ... 64
Figure 4.13: Stiffness distribution of experimental, numerical and calibrated numerical values depending only on the heterostructures on the left and on the right the comparison with homogeneous samples. Each box plot contains the information of the three samples ... 65
Figure A.1: Mt trends of the first eight structures in function of: (a) rotational angle θ and (b) cortex thickness ... 73
Figure A.2: Von Mises stress distribution of (a) 0.35 mm and (b) 0.7 mm of Cyl ... 74
Figure A.3: Von Mises stress distribution of (a) 0.35 mm and (b) 0.7 mm of 1.5 45 ... 75
Figure A.4: Von Mises stress distribution of (a) 0.35 mm and (b) 0.7 mm of 2 90 ... 75
List
of
tables
Table 2.1: Tensile data of the two homogeneous materials ... 21
Table 2.2: The Neo-Hookean coefficients used in the numerical analysis ... 21
Table 2.3: The dimensions of the specimens ... 23
Table 2.4: List of the structural parameters to be kept constant for all the analyses ... 25
Table 2.5: Values of a, b and aspect ratio ... 26
Table 2.6: Jp values evaluated through SolidWorks/CAD® ... 29
Table 2.7: Values of the maximum cortex, reached for the first two groups of structures. The numbers are referred to Figure 2.10-b ... 31
Table 3.1: Analytical results of the homogeneous materials subjected to torsion ... 42
Table 3.2: Values of the homogeneous materials, evaluated from the numerical analyses ... 43
Table 3.3: Stiffness k values for the heterostructures with 0.35 and 0.7 mm of cortex and for homogeneous ... 48
Table 3.4: Experimental values of k and G for the homogenous structures ... 50
Table 3.5: Values of stiffness k and shear modulus G of the heterostructure samples ... 51
Table 4.1: Stiffness values within the linearity range of 20° of the hard and heterostructures, comprehending the new values after the calibration (FEM CAL) ... 65
CHAPTER 1: INTRODUCTION
1.1 STATE OF THE ART
1.1.1 Bioinspired materials
In the latest decades, there is an increasing interest in the research community in understanding the mechanisms that regulate the behaviour of natural materials, with the scope of resembling them in new synthetic materials. Nature is full of materials and systems that have always fascinated humans, who are still aspiring to emulate them. Since ancient times, nature is considered as a source of inspiration. This originated even in myth where Daedalus was inspired by birds’ fly to make wings of feathers and wax and it was resumed by Leonardo Da Vinci’s design of a flying machine or the Montgolfier brothers’ hot air balloons, pursuing this aspiration [1].
This research field, where the nature is taken as model to imitate, is called biomimetics and it derives from the ancient Greek words βίος (bios, life) and μίμησις (mimesis, imitation) [2]. George de Maestral was inspired from the natural world to design Velcro®, a fastener device inspired by the hooking system of the burdock plant [3]. Other cases are a coating able to indicate the impact damage [4], woven fabrics for swimsuits resembling the shark skin [5, 6] and self-dry adhesives inspired by the hierarchical structure of gecko’s foot [7]. These examples aim at understanding how nature is a mine of ideas, just waiting to be discovered, understood and realized [Figure 1.1]
Nowadays, scientists and engineers are like gold-diggers who are always seeking new inspirations and, in particular, they are fascinated and attracted by the unique qualities of the structure of natural materials and they would replicate them.
(a) (b) (c)
Figure 1.1: (a) SEM image of the structure of velcro, with tiny hooks and loops, (b) SEM image of shark skin, (c) Example of gecko foot
It is interesting to note that these materials often merge stiff and soft components in hierarchical structures, which combine biological, mechanical and other functions, determining bulk higher properties than those of their components [8, 9]. To separate mechanical from biological functions in natural materials, it is possible to derive material-property charts in such a way to examine them and their constituents [Figure 1.2] [10].
The constituents of natural materials are typically arranged in a hierarchical architecture of interwoven or interlocking structures, that is difficult to reproduce synthetically. Those structures are able to repair themselves when damaged, differently from synthetic structures, whose self-healing capability is still limited.
So, this is the idea of hierarchical structure: there is a macroscopic material which characterized by smaller molecular units [11]. It is important to understand how levels of structure and their components interact across levels in order to understand the behaviour of a macroscopic body. Nature often creates these complex structures, which have remarkable mechanical properties and overcome the classical materials design problem in structural fields, like strength and toughness. This concept is developed in several distinct fields like structural biology, polymer science and fractal science.
Figure 1.2: Ashby material-property plot of the specific values of strength and stiffness normalized by density for both natural and synthetic materials. Many engineering materials, particularly high-performance ceramics and metallic alloys, have values of strength and toughness that are much higher than those of the best natural materials but in some cases these last ones show a much
Due to this, natural organisms and the world of Nature provide a rich source of inspiration for innovative ideas and solutions, improved over millions of years of evolution:
nacre, the inner layer of shells, combines remarkably high strength and high toughness in a lightweight fashion, as the brick-and-mortar structure is considered the primary contributor to its marvellous mechanical properties [Figure 1.3] [12];
the highly mineralized natural tissues, mostly ceramic, such as tooth enamel, bone and
seashells, which minimize wear and penetration, provide protection and stiffness thanks to its
unique aspect;
highly porous architectures in materials that combine light weight and stiffness, such as
cancellous bone or bamboo. Although the stiff and porous structures tend to be weak, some
natural materials frequently incorporate nanofibers and intricate architectural gradients that avoid a brittle failure and maintain strength [Figure 1.4] [10];
human bone, a composite of collagen and hydroxyapatite. Bone is considered as a biomineral, due to the high content of calcium-phosphate minerals, which make it hard and stiff. A common characteristic of bone is the incredible toughness, in spite of its brittle mineral components and for this reason the bone is considered as an interesting biomimetic material model [Figure 1.5] [10, 13].
Figure 1.3: SEM image showing the composite microstructure of nacre
Therefore, natural materials, that combine the properties of components, often perform significantly better than the single material or the sum of their parts and this is a crucial advantage in bioinspired material design. As already said, they offer a path for solving the challenge of designing materials that are both strong and tough through the development of mechanisms that interact at multiple length scales.
However, despite modern technologies, mimicking the features of a natural material is not trivial since the world of Engineering and the world of Nature have their own rules and laws. Each of them has its advantages and limitations [Figure 1.6] [9, 10]:
on one hand, Engineering has a great choice of elements such as iron, chromium and nickel, which are very rare in biological tissues and that can well incorporate the mechanical properties of the biomaterials. On the other hand, Nature grows both the material and the whole organism according to biological self-assembly strategies, using polymers or composites of polymers and ceramic particles;
another difference is the strategy in designing a material that can be defined with the two paradigms of “fabrication” and “growth”. In Engineering, we have a high level of handling since the initial design has to satisfy all the needs. A macroscopic machine part can be designed to accommodate any ideas of the designers and a material is selected according to the functional prerequisites, usually considering the possible change, fatigue and lifetime issues during service life. This allows the realization of complex samples and structures. Switching to Nature, the materials grow following a sort of recipe and not an exact design, also providing the possibility to change. This approach is a dynamic strategy and allows flexibility at all levels. This approach permits to change functions during growth according to the incoming issues; it allows the growth of hierarchical materials, permitting a constant renewal of the material, reducing the problems related to fatigue response.
Figure 1.5: Projections of fracture toughness and Young’s modulus for natural and synthetic materials. It is highlighted the comparison between the rule of mixture between the separated component (empty circle) and the actual behaviour of nacre and bone
(the natural composites) (full circle), with respect to the synthetic ceramic material created mimicking natural architecture of the first one
The need of designing these new materials has stimulated the interest in studying the natural ones by applying the same standards and protocols based on classical mechanical theories. However, some methods do not capture the properties and the behaviour of biological tissues, probably because these theories are not suitable to describe the behaviour of a living matter and they are only marginally able to describe the hierarchy-induced effect on their properties. So, mimicking these materials could lead to define new theories and new multi-scale models to describe the scale-dependent properties through numerical and computational implementation, supported also by other engineering branches like the nanotechnology and nanomaterials [14]. Unfortunately, despite of different approaches and efforts, some peculiar natural phenomena, like the biological functions of healing and self-assembling, are practically impossible to imitate.
Hence, to better understand these still unpredictable events, the principal followed strategies consist in extracting key design parameters from the natural motifs at a specific hierarchical level, then translate them to other existing-material combinations, implementing a composite material and the computational model. Recalling the words of Beaucage: “it is important to understand how levels of structure interact across levels, for example how cells group to form a tissue or topologically how particles bond to form an aggregate” [15].
In the end, among those biocomposites, an interesting material is the human bone which shows incredible mechanical properties and extraordinary toughness despite its mineral components, also thanks to its hierarchical organization. A first step to understand it resides in studying its characteristics and the individual aspects which lead to its outstanding mechanical properties, which are related to the microstructure. So, starting from the macroscopic generic structure of human bone, it will go deeper into its structure.
Figure 1.6: The exemplification of the different strategies for materials choice and development (under the arrow) of biological and engineering materials governed by a very different choice of base elements and by a different fabrication modality
1.1.2 Bone-inspired structures
Bone is one of the most intriguing materials found in nature: it is a rigid organ that constitutes part of the vertebrate skeleton in animals and humans, claiming a variety of shapes and sizes and a complex internal and external structure. It has the task to protect the various organs of the body, to produce red and white blood cells, store minerals to provide structure and support for the body and to enable mobility. In bone family it is possible to recognize different types of structures, intended for diverse functions: long bones, such as femur or tibia, provide stability against bending and buckling, whereas short bones, such as vertebrae, support compression loads and the plate-like bone, as those forming the skull, ensures protection for organisms instead. Within bone, it is possible to distinguish cortical and cancellous bone, each with different appearance and characteristics [Figure 1.7].
From an engineering point of view, bone can be considered a ceramic-polymer composite material, consisting of an inorganic mineral phase, in form of hydroxyapatite, the ceramic phase, which provides load-bearing capacity, and an organic one, a collagenous polymeric matrix, with the aim of furnishing elasticity. All of these are intricately organized on different scales, from the sub-nanoscale to the macroscale, allowing a multitude of functions under the various loading conditions, experienced during the daily activities. The study of this hierarchical structure is crucial in order to get a deep understanding of the material behaviour, with the aim of replicating the structure and properties in the design of new biomaterials, or mimicking part of its complex architecture in the design of new bioinspired materials.
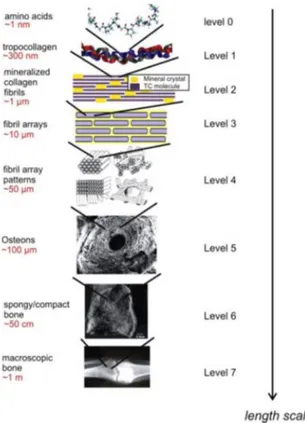
Below, it is provided a description of the hierarchical structure of the bone and its properties, ranging from a nano length scale to macroscopic one, analysing the building blocks and their organisation, optimized to meet specific functions [Figure 1.8] [2, 10, 14, 16, 17, 18, 19, 20, 21]:
At the nano scale, bone is characterized by collagen fibrils and hydroxyapatite crystals. Zooming out, fibrils, held together by a protein phase, are arranged in different patterns to form fibers, e.g. plywood, random, radial and so on, which at a higher scale build the lamellae. Then, at microstructural level, it is found a cylindrical structure with circular-elliptical cross section with a diameter up to 200-300 μm [22], called osteons or Haversian systems, made of a concentric lamellar structure located around an internal vascular canal, the Haversian canal, responsible for the bloody flow [23], and surrounded by the cement line. They are the primary anatomical and functional unit of the subsequent cortical bone [Figure 1.9]. Alternatively, the lamellae can dispose to form trabeculae, that are the are primary anatomical and functional unit of cancellous bone
Figure 1.8: Hierarchical structure of bone
At the macroscale, there is the osseous tissue, differentiated in the trabecular, known as spongy or cancellous and characterized by high porosity, and cortical or compact bone, which is the hard-outer layer and it is denser than the former. The two bone types show different structures and consequently different mechanical properties and functions: the cortical bone gives bone its smooth, white, and solid appearance and it facilitates bone's main functions like supporting the whole body, protecting organs, providing levers for movement and storing and releasing chemical elements, while the latter is the internal tissue of skeletal bone and it is typically found at the ends of long bones. Since it is characterised by cell porous network, it is weaker and more flexible, suitable for metabolic activities. Despite of the attractive properties of the trabecular bone, still examined and used for any kind of foamy materials, the focus will be on the cortical bone, particularly at the microstructural level of hierarchy [Figure 1.10] [10].
The bone behaviour, like mechanical response and the failure mechanisms, greatly varies according to the length scale at which it is assessed, depending on the characteristic structure of the corresponding hierarchical level. For this reason, a multi-scale approach is widely used by many researchers to investigate the mechanical properties of bone at different length scales. So, various techniques are adopted, according the length scale, starting from experimental methods for the large scale to simulation approaches to study the smaller scales, like the mineralized collagen fibrils and lamellae, in order to imitate their shape and structure.
By means of imaging techniques, e.g. computed tomography (CT), scanning and transmission electron microscopy (SEM-TEM) and mechanical testing, failure mechanisms in bone are investigated. Some studies are focused on the specific level of the hierarchical scale. Ritchie et al. are focused on the single collagen fibrils to better understand the crack and defect growth into the bone and in its structural elements and the toughening mechanisms [17, 19, 24, 25]. Alternatively, on a higher scale, Marie-Madeleine Giraud-Guille examines the network of collagen fibrils in osteons lamellae [26]. The purpose of her analyses is to demonstrate that there are mainly two different spatial organizations of collagen fibrils present in human osteons: twisted plywood structure, where on each plane the molecular direction rotates by a small and constant angle from one plane to the next, and
orthogonal or quasi-orthogonal plywood structure, where there are two orthogonal directions of
fibrils [Figure 1.11] [27].
These considerations are improved by Ascensi and co-workers, who examine the anisotropic mechanical properties of single Haversian system, by experimental measurements under different loading conditions, i.e. tension, compression, bending and torsion [28, 29, 30]. They measure the effects of the anisotropy on the elastic moduli and strength, by taking two types of samples smaller than a single osteon, each of them with the longitudinal and alternating lamellae. The results show that osteons with longitudinal lamellae show a better response in tension and torsion, and are stronger in bending, whereas osteons with alternating lamellae are more resistant to compression. As another opinion, there are the works on bovine femur done by Libonati, Vergani and Yamada [21, 31] who test tissue sample in tension, compression and bending load. They observe that the mechanical response of bone is strictly related to the microstructure, which varies depending on the anatomical position. This confirms that the structure of bone is optimized to withstand the different types of loads generally occurring everyday life.
However, some researches notice that this damage tolerant ability seems to come from the osteons, which are considered as weak points and as the cause of the decreasing of the strength of the bone and its failure. Their presence increases the fatigue life, not because they help to prevent microdamage, but they reduce the severity [19, 32, 33]: osteons deflect and twist the crack along their outer boundaries, the cement lines, which are the sites of microcracks nucleation. Indeed, when an orthogonally propagating crack reaches a cement line, it changes direction, increasing the energy required for crack propagation, hence the toughness [25, 34]. Norman et al. demonstrate that cracks are more likely to grow in tension than in shear [Figure 1.12] [35, 36, 37].
(a)
(b)
It is proved that there is more increase of damage accumulation in osteonal bone because the lamellar interface is weaker in shear rather than interstitial bone and this explains the yielding under torsional loads. Therefore, the lamellar interface seems to be the principal site of damage formation. The extensive post-yield deformation of human cortical bone could be attributed in large part to its damage tolerance, seen as the ability of the microstructure to accumulate damage and to continue sustaining load prior to the formation of the fatal crack, delaying microcrack coalescence and postponing the inevitable formation of fatal cracks.
Besides all these studies on the bone tissue, a clear idea of the functionality and the mechanisms that rule its mechanical behaviour is not completely understood yet. However, the aim of this thesis work and the challenge of replicating cortical bone behaviour is taken up by many researchers. Seeking to replicate the cortical bone constituents, they start to design biostructures of mineralized microfibril level, as in the case of Barkaoui [38], developing a 3D finite elements model to study the nanomechanical behaviour of mineralized collagen microfibrils. Other studies are focused on higher length scales, where researchers, like Libonati, Zorzetto et al., undertook to mimic osteon structure. Then, all these structures are subjected to different loads, to verify and prove functionality and reliability of the considered models.
A remarkable analysis is performed by Zorzetto and her collaborators [39], who took inspiration from the osteonal bone which has the mineralized collagen fibrils, organized in an average fibril angle greater than zero with respect to the osteon long axis. She adopts the Nature’s design strategy in the wood cell and prototype composite materials, exploiting the mechanical contribution of the reinforcing plies and fibers arrangement under compression load. The results highlight that the reinforcement fibrils, oriented along the main loading direction, really enhance strength and energy absorption.
Figure 1.12: Illustration of the cortical bone microstructure with detailed of the osteon structure and remodelling region of interstitial lamellae and the possible cement line
On the same line, Zhao and co-workers resemble the previous fibers layer with different helixes’ winding angle from 0° to 45°, tested under uniaxial compression load [Figure 1.13] [40]:
According to them, stiffness of the composite decreases significantly as fibers angle increases, conversely fracture toughness increases. In addition, even though the helical structures with the fiber angle of 50° have the least reinforcement number, the critical stress is apparently higher than the other types of specimens. However, the helicoidal fibers acts as elastic spring, absorbing energy until catastrophic collapse.
Moreover, a lot of studies are done by teams of Politecnico di Milano: they realize an osteon bioinspired composite that, compared to a classic laminate with the same amount of reinforcement, presents higher UTS and stiffness performances in longitudinal direction in all loading conditions. On the contrary, the deformation capability is much lower. Regarding fracture mechanism, it is similar to what happens in bone: crack propagate inside the osteon and it is deviated when reaches the cement line [Figure 1.14] [23].
Figure 1.13: Schematic illustration of the structure of the biomimetic composites with different fiber angles where the fibers are made of stiff and the matrix of soft material
However, this is a huge simplification because the geometry of the continuous fibres is completely different from that of concentric lamellae. The simplified system aims to mimic the structural features involved in the fracture process, neglecting the living part of the bone tissue, and the function of the concentric lamellae to deflect and twist cracks. In addition, the same group of researchers propose a new structure, adding the feature of Haversian canal, to improve the transversal behaviour of the previous model. In this case, in longitudinal direction, the osteon structure does not fail in purely brittle way in spite of its strongly anisotropy and brittle constituents. Moreover, this new design showed remarkable stiffness-toughness trade-off, reaching better performance than the previous one and the common laminated materials [Figure 1.15] [41].
(a)
(b) (c)
Figure 1.14: (a) internal structure of the bio-inspired composite. Scanning electron microscopy images from backscattered electrons showing a cross-section of a sample of bio-inspired material, (b) the image (magnitude 40×) shows the region where the main crack
propagates; the crack region is highlighted with a red dashed line circle, (c) the imagine (magnitude 100x) shows the crack deviation, from the intra-region to the inter region; the crack path is highlighted with a red dashed line
(a) (b) (c)
Figure 1.15: (a) Haversian structure from bovine femur (image from optical microscope), (b) design of bio-inspired structure, (c) cross section of the manufactured bio-inspired structure
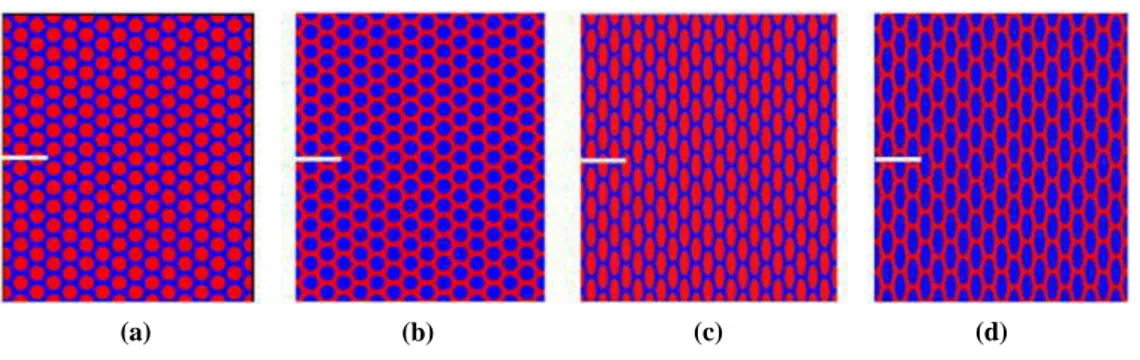
A further example of bone-inspired material is found in the work of Libonati et al. [14, 22]. They produced a simplified version of the bone tissue just using two material, one stiff and the other softer, varying the shape of the osteon section, cylindrical and elliptical. The objective is based on the comparison between four models through tensile test, alternating the two shapes and two materials [Figure 1.16]. The study is focused on the effect of the inclusion geometry and on the fracture criteria. It is shown that on the overall mechanical properties the elliptical soft shape with stiff matrix has the best combination of mechanical properties in terms of strength and toughness in longitudinal direction, and stiffness and strain in transversal direction, compared to the “pure” soft and stiff materials. This reflects the real case since in the real cortical bone the interlamellar tissue is more mineralized with respect to the osteon’s lamellae, and it demonstrates that the amplification in toughness with respect to the basic constituents is a remarkable property of bone. Also, the samples show similar fracture mechanism with respect to the cortical bone.
(a) (b) (c) (d)
Figure 1.16: Types of composite arrangement: (a) stiff circular osteons and soft matrix, (b) soft circular osteons and stiff matrix, (c) stiff elliptical osteons and soft matrix, (d) soft elliptical osteons and stiff matrix. The stiff and soft materials are respectively
1.1.3 Torsional behaviour of biomimetic structures
The present work has the aim to analyse bioinspired structures under load. Since it is demonstrated that the cortical bone has remarkable mechanical properties under torsion, a type of load very poorly studied, and it is due to the presence of osteons. They increase the fatigue life through a reduction of the severity of microdamages [35].
In the following examined works, the common characteristic among the presented morphologies is the helicoidal pattern of fibrils. Indeed, the fibrils may be aligned along the principal stress direction and provide the optimal resistance to torsion.
Porter et al. [42] varied the helix-reinforcement angle and materials composition and compare those structures to investigate the torsional rigidity and stiffness of this composite under pure shear stress [Figure 1.17]:
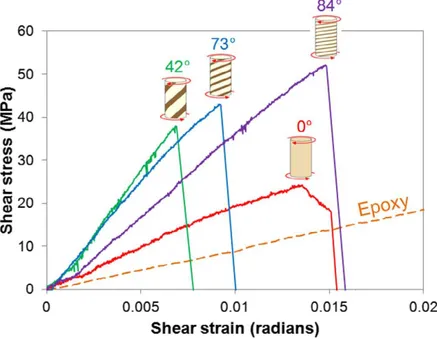
The investigated composite exhibits enhanced torsional properties due their helical architectural organization. In torsion state, the maximum tensile and compressive stresses, induced by a state of pure shear, are oriented at ± 45° to the axis of rotation. As a result, the composites with helix-reinforcement oriented in parallel to the direction of maximum compressive stress at ± 45° shows the highest shear moduli [Figure 1.18].
Figure 1.17: Representative images of the profiles and cross-sections of the ZrO2–epoxy composites freeze cast under a rotating
magnetic field of 0.12 T at the varying rotation speeds shown: (a) ZrO2–epoxy composites composed of ≈40 vol.% ZrO2and ≈60
vol.% epoxy, (b) ZrO2 and ≈40 vol.% epoxy. The letters ‘‘A’’ and ‘‘B’’ shown on the cross-sections represent the Fe3O4-rich
The different curves correspond to the different angles of reinforcement, illustrating that the shear modulus, increases as the volume fraction of the constituent materialand the angle of reinforcement approaches 45°, while the shear strength, maximum stress, increases as the angle of reinforcement approaches 90°. This last phenomenon can be explained by the fact that brittle materials, subjected to torsion, fail in the direction of maximum tension, that is at 45° to the axis of rotation. Most likely, as the angle of the helix-reinforcement increases, which has the higher-density, helix-reinforced region deflects or redirects the tensile stresses that occur along the surface of the cylindrical samples. Accordingly, the composites with 42° helix reinforcement angles have the lowest shear strength because the helical interface between stiff and soft materials is the weakest point of the structure, so they fail by delamination. At high range, the angle of the crack path deviates across each region. This suggests two modes of failure, brittle failure and shear failure, where the last one is typical of the ductile materials and it is caused by interlamellar shearing, acting as crack bridging [Figure 1.19].
Figure 1.18: Surface shear stress–strain curves illustrating the torsional behaviour of ZrO2–epoxy (60:40) composites with different
angles of helix-reinforcement under clockwise (CW) applied torque
Figure 1.19: Representative images of the crack path and different failure mechanisms (yellow) due to the torsional loading of ZrO2–
epoxy (40:60) composites with different angles of helix-reinforcement: (i) no magnetic field; (j) 42°; (k) 73°; (l) 84°. Images of the cylindrical composites (left) show the direction of applied torque (red arrows) and magnified regions of interest (black boxes)
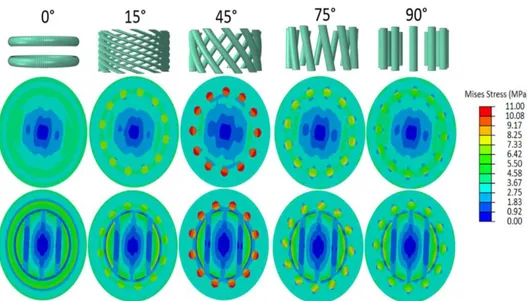
A further study on the helicoidal structures is carried out by Ribbans et al. [43], who study the interlaminar shear resistance at torsion of the bioinspired helix-fiber-reinforced structures, related to different features of the helix. Based on these helicoidal fibrils in nature, he proposes three soft helical fiber structures in a stiff matrix, i.e. the plain, ring and helix helicoidal fiber structure [Figure 1.20]. His research objective is to study the interlaminar shear resistance of the bioinspired helicoidal fiber structures using an integrated experimental and numerical approach, so he decided parameters to check, verify and compare: the fiber architecture and the material properties, the pitch angles of helices, the effect of rotary angles between adjacent helicoids fiber layers and the number of helices reinforcements.
Successively, Ribbans examines the effect of pitch angle on the interlaminar shear resistance. He fixes base parameters like the volume ratio of 0.3 and the number of helixes. He varied the helix pitch angle from 0° to 90°. Under the same torsional load, von Mises stresses in helicoids vary slightly at different pitch angles, while stress and rotation in helix reinforcements changes substantially with a peak at 45° [Figure 1.21]
To sum up, the study of hierarchical materials and bioinspired ones is still at a very premature stage
(a) (b) (c)
Figure 1.20: Schematics of helicoidal fiber structures: (a) plain; (b) ring and (c) helix. The left ones are the design models; the right ones are the 3D printed polymeric helicoidal fiber cores
which is proved to have high mechanical properties and no one has tested it under torsion. So, it turns out being an innovative subject on which it is possible to start an explorative work. However, the results of these previous studies will be considered and some design details of the proposed heterostructures would be directly inspired by them, e.g. the selection of a stiff material for the matrix and a soft one for the inclusions and the shapes of osteon section.
1.2 OBJECTIVES
General objectives of the current master thesis project are the following:
identification and design of a biomimetic composite structure for the optimization of torsion resistant properties;
understanding of the possible morphological features and parameters of the implemented structures that may influence the torsion resistance.
In order to achieve the general goals, specific objectives can be defined:
study of analytical, computational and experimental methods, based on torsion and considered materials and structures;
choice of suitable materials and structures’ design;
identification of the mechanical behaviours and their variability related to the chosen parameters and to different configurations;
validation of the models through 3D-printing so as to compare the physical behaviour of selected designed structures and to understand the performance in the non-linear region.
CHAPTER 2: MATERIAL, SPECIMENS’
DESIGN AND METHODS
In this chapter, the used materials, structures and methods are presented. At first, the materials, used for the design of the specimens, are described, examining the different configurations. Subsequently, analytical, numerical and experimental methods are considered for the study of the chosen structures.
2.1 MATERIALS
The selected materials are the VeroCyanTM (RGD841) and the Agilus30TM (FLX985). Both are
photopolymers and they are combined by means of PolyJet, a 3D printing technology, which permits to have microscopic layers and to reach high accuracy with smooth and detailed prototypes by UV-cures. This technique is ideal for engineering models.
The Vero material follows an elasto-plastic behaviour and gives high strength and stiffness with a brittle low-deformation performance. So, it is selected for the stiff component, while the Agilus30TM is a soft rubber-like polymer, whose characteristic curve could be described by a hyperelastic model. It is selected for the soft elements. At the end, these materials are inkjet printed and cured by Stratasys
J720TM Dental.
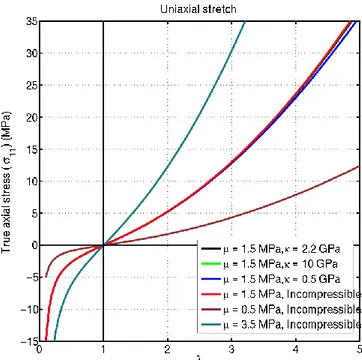
The behaviour of Agilus30TM is described by a hyperelastic model. It is a type of constitutive model for ideally elastic material, for which the stress-strain relationship derives from a strain energy function. Since the traditional linear elastic models do not accurately describe their behaviour, Rivlin and Mooney developed the first hyperelastic models, the Neo-Hookean and Mooney-Rivlin solids. So, the Neo-Hookean model is considered: it manages to predict the nonlinear stress-strain behaviour of a material undergoing very large deformations. The cross-linked elastomers will act in a Neo-Hookean way because initially the polymer chains can move relative to each other when a stress is applied, having thus a linear trend. Then, at a certain point, the polymer chains will be stretched to the maximum point and this will cause a dramatic increase in the elastic modulus of the material. However, this model does not predict that increase in modulus at large strains and is typically accurate only for strains less than 20% [Figure 2.1].
Figure 2.1: True stress curves for natural rubber as a function of uniaxial stretch predicted by a compressible neo-Hookean material
Furthermore, the model is also inadequate for biaxial states of stress. Those issues could be overcome by the Mooney-Rivlin model, that introduces extra computational complexity degrees. However, this first model is chosen since it is possible to numerically describe through only few parameters related to the material, like the Young’s modulus E, the Poisson’s ratio ν and
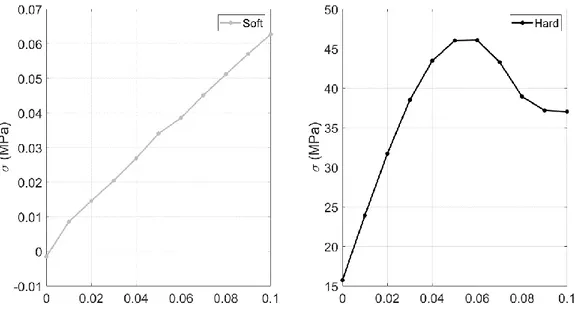
0 10 1 2 2 3 1 2 C D which are the material constants [44], while 𝜇0 and K are respectively the initial shear modulus and the bulk modulus. Further tension tests results are provided to have more precise data, useful for the following numerical analyses [Figure 2.2, Table 2.1-Table 2.2].
Figure 2.2: Results of tensile tests on the homogeneous soft and stiff materials
Material Toughness (MPa) Strength (MPa) Elongation (%) Elastic Modulus
(MPa) Poisson ratio Soft 0.27 ± 0.05 0.58 ± 0.05 1.06 ± 0.06 0.92 ± 0.28 0.45
Stiff 5.12 ± 1.75 41.69 ± 4.52 0.18 ± 0.06 734.98 ± 52.48 0.33
Table 2.1: Tensile data of the two homogeneous materials
Coefficient Value Unit of measurement
C10 0.117733 MPa
D1 0 MPa-1
2.2 SPECIMENS AND STRUCTURES’ DESIGN
2.2.1 Specimens’ design
Despite of using common polymeric materials, it is difficult to find a proper standard to follow, because this material family is largely tested through dynamic analyses instead of static ones. In a similar way, it is not possible to use standards relative to composite materials because they refer to laminated components. The ASTM Standard E143 is taken as inspiration because it deals with a general type of material under static torsional load [45].
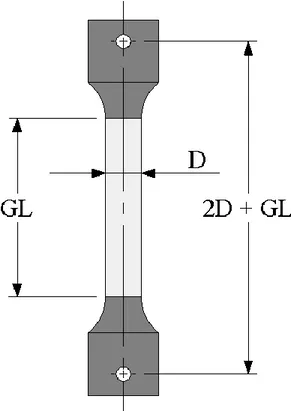
So, ad hoc specimens are designed according to the type of structure, homogeneous and heterogeneous, in order to better fit the testing machine requirements and to avoid material’s waste. An example of a specimen is shown in the Figure 2.3:
Figure 2.3: Standard specimen dimension with the gripper in dark grey and the gauge length in light grey (D = diameter, GL = gauge length)
Since the fillet between the gauge length and the gripper could be a stress concentration site, a study verified the contribution of the fillet radius to check possible stress risers or failure at the boundary between the two materials. The obtained configuration must be able to sustain the force applied by the testing machine [46]. For this inspection, different fillet radii are considered, maintaing the same distance between the gripping points and varying the gauge length.
The grippers are made of the stiff material and the gauge length of the soft one. At the end, three combinations are considered [Table 2.3]:
Specimen Fillet radius (mm) Gauge length (mm)
1 10 120
2 25 100
3 50 80
Table 2.3: The dimensions of the specimens
After designing them by SolidWorks/CAD® and importing in Abaqus/CAE® (2016), finite element
analyses are performed, considering all the materials’ properties, the constrains and the boundary conditions to emulate the real experiment. Imposing a rotation of 90° (≈1.57 rad) and comparing the results, the choice fell on the second design since the stress distribution is not abrupt like in the first case but it is spread and constant along the gauge length and the first region of the fillet [Figure 2.4]. So, the first type results less resistant to the applied load and it is discarded, while the third one is not considered to save more material with comparable results with respect to the second sample. These observations demonstrate that the variation of the length of the radius does not influence the experimental results beyond a certain value.
(a) (b)
(c)
Once the gripper behaviour is verified, the homogeneous and heterogeneous structures are designed. For the numerical analyses only the central part is considered and the gauge length is maintained 100 mm for the homogeneous structures and it is decreased to 70 mm for the heterostructures to avoid material waste.
2.2.2 Structures’ design
2.2.2.1 Homogeneous structures
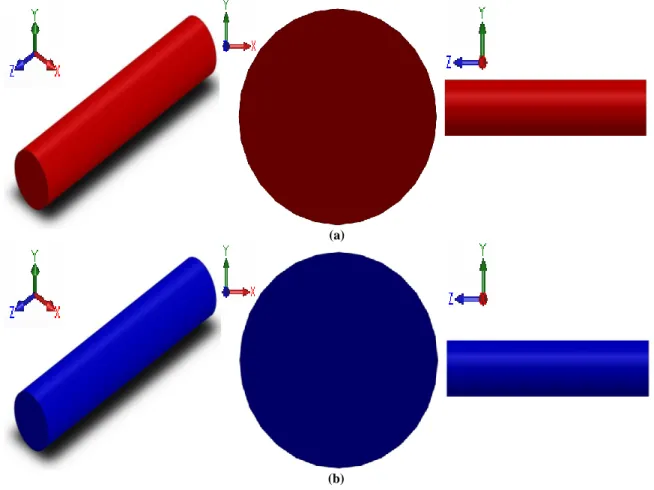
The designed homogeneous structures have a length of 100 mm and they are printed with two different materials: the stiff components are associated to the VeroCyanTM and the soft to Agilus30TM [Figure 2.5]. After the design phase, they are numerically and experimentally analysed.
(a)
(b)
2.2.2.2 Heterogeneous structures
The goal of this project is not to exactly replicate the structure of the cortical bone, but to design simplified versions that mimic osteon’s structure, the reinforcement, embedded into a matrix. This simplification is necessary, because a higher resolution of the printer or an increment in the sample’s dimensions would be needed to replicate a more faithful cortical bone’s structure. In addition to this, the complex arrangement of the bone’s structure at various levels of hierarchy would require a wider range of materials. Hence, the main elements of cortical bone tissue are just taken as a source of inspiration to study different structural arrangement. A special interest is devoted to the geometrical factors and parameters that could influence the mechanical properties of the considered samples. For this purpose, structural parameters are fixed. Since in this study it seeks to understand how the different geometrical factors of the osteons could influence the mechanical behaviour, osteons are simplified as cylinders with cylindrical and elliptical cross section. It is tried to keep the same size of the microstructural features of the real bone [22]: the real diameter is included in the range 100-300 μm and it is increased by one order of magnitude due to the limit of the printer machine. So, the chosen single osteon diameter is 3 mm. Furthermore, considering that an ellipse with a major axis of 3 mm would occupy more space than a cylinder with that diameter, it is thought that an ellipse should have covered the same area of the cylinder in order to have the same quantity of elements embedded into the matrix. So, if a cylinder with 3 mm of diameter has an area of ≈ 7.07 mm2, the ellipse will
have that area and its aspect ratio, which is the ratio between major axis and minor axis, will be fixed. In this way, it is defined the osteon area.
At the end, it is paid attention to keep constant the osteon volume ratio, defined as the ratio between the volume of the osteons and that of the cylindrical structure, and equal to 50%. This value is chosen to compare the two selected materials, how one can influence the other one and to see the effect of the geometry of the constituents.
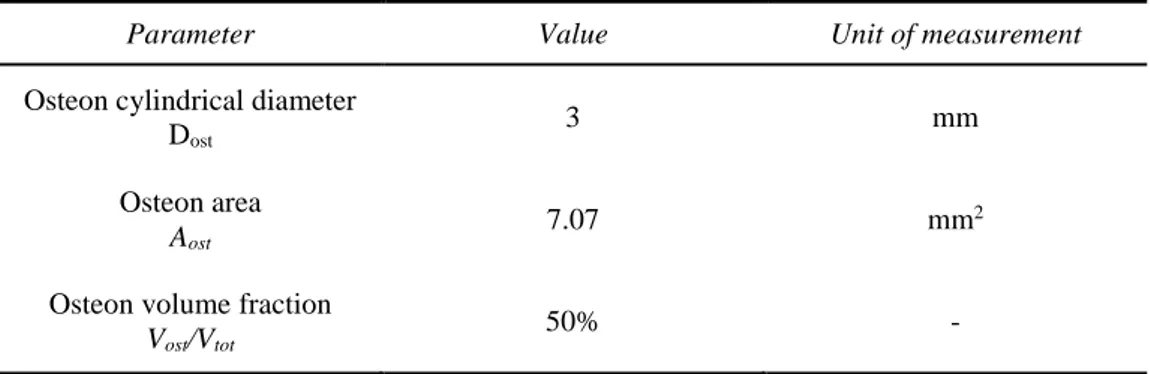
To summarize [Table 2.4]:
Parameter Value Unit of measurement
Osteon cylindrical diameter Dost
3 mm
Osteon area
Aost
7.07 mm2
Osteon volume fraction
Vost/Vtot
50% -
At this point, there are investigated: 1. osteon shape, varying:
aspect ratio; inclination angle; 2. cortex.
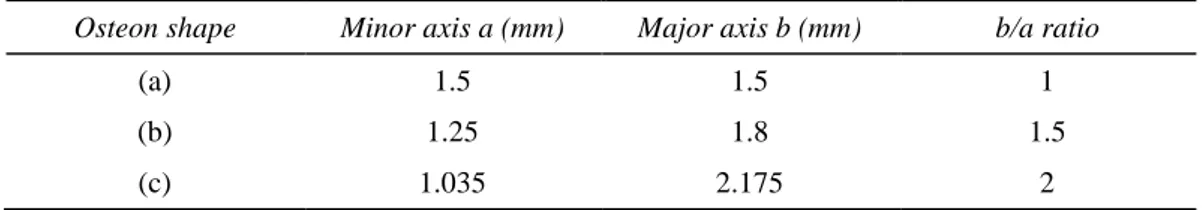
1. the designed structures are directly inspired by the microstructure of cortical bone with completely homogeneous osteons as the weak part of the structure. As in the work of Libonati et al. [14, 22, 46], two different shape of the osteons, circular and elliptical, are tested under torsion. Moreover, 2 different kind of elliptical shape are examined according to the aspect ratio, b/a ratio, where b is major axis and a the minor one. It is started from a b/a ratio of 1, circular cross section, to increase it by 0.5 for other two shapes, obtaining thus a b/a ratio of 1.5 and 2 [Figure 2.6, Table 2.5]:
Osteon shape Minor axis a (mm) Major axis b (mm) b/a ratio
(a) 1.5 1.5 1
(b) 1.25 1.8 1.5
(c) 1.035 2.175 2
Table 2.5: Values of a, b and aspect ratio
These choices can be supported by the literature where, for what concerns elliptical shape, elliptical cross-section of the osteons has an aspect ratio, interpreted as minor axis over major one, included in the range 0.4-0.8 [22], that corresponds to 1.25-2.5. Unfortunately, it is not possible to examine more cases since it would be impossible to respect the structural parameters due to the small size of the diameter of the structure.
In addition, it is analysed the role of the osteon inclination angle with respect to the border of the cylinder and to each other, shown in the Figure 2.7:
(a) (b) (c)
a
a
a
b
b
b
2. Observing the Figure 2.8, near to the surface, layers of lamellae surround and protect the osteons and the rest of the bone. These are arranged parallelly to the surface itself and they are called
circumferential lamellae.
Taking inspiration from them, it is thought to study the effect of this sort of cortex, assuming that it is made of the stiff material, like the interstitial lamellae, since they do not have embedded softer elements that may make less strength the structure, decreasing the mechanical properties, like the Haversian canal. So, it is considered it and the interstitial lamellae as stiff material. Since the thickness of the circumferential lamellae varies according to the age of the subject but it is less thick than the concentric lamellae of the osteon [47], several structures of the same type are designed. Starting from a cortex thickness of 0.1 mm, this width is increased by 0.1 mm for each structure, paying attention to avoid intersections and respecting all the previous structural conditions. This is presented as a unidirectional increasing [Figure 2.9].
Each structure reached a different maximum cortex. From structures’ designing, it is defined a
maximum limit of cortex, which is the maximum thickness reached by most of the structures. Once
stated it, a numerical analysis will be done on all these arrangements to see how the mechanical response varies, while experimental studies will be carried out on structures with 0.7 mm of cortex width and, moreover, with 0.35 mm to verify that with the increasing of cortex there is an increase of mechanical properties as well.
Hence, the aim is to define the highest possible thickness of this layer, how the mechanical behaviour is controlled by the geometry disposition. From the theory [(2.5], the higher is the amount of the material at the edge region, the higher is the reaction torque that would be reached against the applied displacement.
t
M k
Since it is directly proportional to the applied moment which is, in turn, proportional in the same way to the polar inertial moment 𝐽𝑃 [46] [2.3.1 Analytical method]. This latter parameter is in
function of the geometry of the section of structure and it increases with the increase of the thickness at the border. By means of SolidWorks/CAD® software, it is easy to evaluate the polar moment of inertia.
(a) (b) (c)
(d)
(f) (e)
Figure 2.9: Cortex increasing for cylindrical osteons: (a) unidirectional raising, (b) 0.1 mm, (c) 0.3 mm, (d) 0.5 mm, (e) 0.7 mm, (f) 1 mm
In the Table 2.6, some 𝐽𝑃 values are reported: Structures 𝐽𝑃 (mm4) Cyl 0.35 7656.95 Cyl 0.7 8250.47 1.5 45 0.35 7839.32 1.5 45 0.7 8514.85 2 90 0.35 8238.29 2 90 0.7 9085.54
Table 2.6: Jp values evaluated through SolidWorks/CAD®
Indeed, in a cylindrical sample, subjected to torsion, the outermost region experiences the maximum shear stress at the boundary, meanwhile it decreases linearly until a null value at the centre, which is the axis of rotation.
Finally, combining all these elements, multiple different structures are designed and they can be organised into 4 main groups [Figure 2.10, Table 2.7]:
1. cylindrical osteons;
2. elliptical osteons with different b/a ratios and inclination angles;
3. combinations of cylindrical and elliptical osteons with different b/a ratios and inclination angles;
4. concentric circular layers with different thickness.
(a) b/a=1,5 and inclination angle=45° b/a=1,5 and same direction b/a=1,5 and inclination angle=90° b/a=1,5 and same direction b/a=2 and inclination angle=45° b/a=2 and inclination angle=90° b/a=2 and same direction (b)