1
Alma Mater Studiorum - University of Bologna
Faculty of Civil, Chemical, Environmental and Material Engineering
(DICAM)
Master of Science in Environmental Engineering
Evaluation of exploiting coffee
wastes in production of PLA green
composites
Final Thesis
Candidate: Supervisor:
Amir Kia Aghaye Ghazvini Prof. Andrea Saccani
Co Supervisors:
Prof. Laura Sisti
Dr. Grazia Totaro
2
Table of Contents
Introduction ... 3
Renewable Polymers ... 6
PLA ... 7
Cost issues and sustainability of resources ... 11
Agricultural wastes ... 12
Agricultural wastes as fillers in composites ... 15
Coffee SilverSkin ... 16
Experimental work ... 20
Materials ... 20
Matrix ... 20
Filler ... 21
Preparation of composites and samples ... 24
Complementary part ... 28 Tests ... 29 Tensile test ... 29 SEM ... 33 DSC test ... 40 TGA test ... 44
Water absorption test ... 48
Contact angle test ... 52
Discussion of the results ... 56
Conclusion ... 73
3
Introduction
Despite the great advancements in science and technology over the last century, humanity is facing growingly difficult challenges during its life. All the needs of modern society, e.g., food, fuel, energy, and materials, are directly or indirectly highly dependent on using fossil resources.
Upon the emergence of these developments in science and technology, mankind became able to live longer and consume more resources on the planet. However, it is obvious that the resources required to meet all the needs of the increasing population and our modern life style are depleting at a worrying rate. Furthermore, massive waste production due to human activities has grown to become a threat for the natural ecosystem stability and it has been exposing the life conditions of the species on earth to a notable hazard. Matters such as global climate change and the depletion of fossil fuels, that are inevitable outcomes of increased usage of energy, have become an issue of discussion among scientists and politicians worldwide. Henceforth, governments, industries, and academia are becoming vigilant of the situation and trying to come up with sustainable resolutions regarding the ever-growing energy crisis. However, production and application of sustainable materials lacks such an approach in the modern lifestyle.
Moreover, the twenty first century human is obliged to consume in a way more extensive fashion in comparison to his ancestors and this rapid augmentation of material usage has grown to become a new challenge to tackle. A wide variety of materials are to be dealt with in this consumption crisis, however, due to their widespread application in different areas such as food packaging, clothes, shelter, communication, transportation, construction, healthcare and leisure industries, plastics are one of the most inseparable factors of the global consumption culture. At the moment, petrochemical industry is responsible for the majority of the plastic produced and it has proved to be a very financially attractive market and because of the immense global demand especially in developing countries, this trend is expected to maintain in growing direction even more.
4
Despite plastic suggests perks such as surprisingly low production costs and huge versatility, the sustainability of this synthetic material is still a challenge to be considered. Thus, because of the global environment and the growing complications of solid wastes treatment, bio-based or renewable polymeric materials could be the appropriate alternatives for some applications. And also due to the fact that the planet’s fossil fuel capacities are expected to run out in the near future, man is required to lose his dependency to the aforementioned unsustainable resources. Another motive for the development of technologies to produce renewable polymers instead of petro-based materials, is to reduce CO2 emission resulted from fossil fuel consumption, which is the
fundamental reason behind global warming and climate change [11]. Despite the promising characteristics of renewable polymers, they are still expensive in comparison with the petro-based plastics, and lots of work is needed to be done to decrease the costs of biologically derived materials.
As mentioned above, human activities and the ever-increasing population lead to significant growth in waste production and consequently bringing about numerous environmental hazards threatening the life on the earth. To handle the inevitable phenomenon, firstly, it is required to change the general point of view on the definition of waste from an unusable and undesirable material to a material which its potential usage is still unknown, and secondly, a collective effort in order to find ways of adding value to these materials can play an important role in the aforementioned hazard control. Food and agriculture are among the oldest of human practices, but as a source of waste they are no exception comparing to other industrial activities. Coffee is one of the most popular beverages which is widely consumed all around the world. An aftermath of this huge market, is that coffee industry is responsible for generating massive quantities of waste into the environment. One of these waste materials is coffee silverskin (CS), which is a thin tegument of the outer layer of coffee bean obtained as a by-product of the roasting process and it represents about 4.2 %wt of coffee beans. In the last years, coffee silverskin has attracted lots of attention since it is generated in great amounts every year and represents pollution hazard if discharged into the environment. Therefore, developing technologies to reuse coffee silverskin for functional purposes would help to convert this large amount of waste into new resources.
5
This study aims to evaluate the exploitation of coffee silverskin as filler by minimum preparation processes, in production of green composites with PLA as matrix. The purpose of this investigation is to convert the coffee silverskin which was formerly an unusable by-product, to a new resource to decrease the price of PLA, and eventually reduce the environmental hazards regarding the use of petro-based polymers as well as helping waste management.
6
Renewable Polymers
Bio-based or renewable polymers are materials derived from renewable sources. The term “renewable polymer” or “biopolymer” applies not only to naturally occurring polymeric materials but also to natural substances that have been polymerized into high molecular weight materials by chemical and/or biological methods. Therefore, bio-based or renewable polymers include various synthetic polymers derived from renewable resources and CO2. As examples of bio-based polymers, we can name polynucleotides, polyoxoesters, polythioesters, polyamides, polysaccharides, polyanhydrides, polyisoprenoides and polyphenols, their derivatives, and their blends and composites [11].
As we can see in figure 1, based on their origin and production, bio-based polymers could be divided into three main categories:
Modified natural polymers: Polymers directly extracted/removed from biomass. Examples are polysaccharides such as starch and cellulose, chitosan/chitin and proteins like casein and gluten.
Bio-Chemosynthetic polymers: Polymers produced by classical chemical synthesis using renewable bio-based monomers. A prominent example is PLA (polylactide), bio-polyester polymerised from lactic acid monomers and PBS (Poly butylene succinate).
Biosynthetic polymers: Polymers produced by microorganisms or genetically modified bacteria. This group of bio-based polymers consists mainly of the polyhydroxyalkonoates (PHA).
Researchers also have further categorized renewable polymers based on the ability to be biodegradable. It is worthy to mention that while some bio-based materials are biodegradable, not all biodegradable materials are bio-based. Recent technological advances also have allowed renewable polymers to be processed similarly to petroleum-based plastics, whether in sheets, spinning, by extrusion, injection moulding or thermoforming [13].
7
Figure 1. Classification of biopolymers according to origin and production [13].
In this study, among the many different renewable polymers which are bio-based and biodegradable, PLA polymer has been chosen to produce green composite by means of coffee waste. Next section is going to discuss about this renewable polymer.
PLA
PLA or polylactide acid is a biodegradable and bio-based thermoplastic aliphatic polyester derived from renewable resources, such as chips or starch (mostly in Asia), corn starch (in the United States and Canada), cassava roots, or sugarcane (in the rest of the world) [3]. The properties of PLA are appropriate for a wide range of processing methods such as injection molding, extrusion, film forming, spinning, blown-film, blow-molding, and expansion-molding. Due to the high transparency of PLA, it is an excellent material for packaging and containers. The other potential areas of application for this polymer include agricultural and civil engineering materials and composting materials. [11]. PLA is one of the most studied renewable polymers and the reason is mainly because this aliphatic polyester has mechanical properties that resemble those of commodity plastics such as polypropylene (PP), polyethylene (PE), and polystyrene (PS) [14].
8
PLA and its production introduces multiple advantages, such as:
1) PLA can be derived from a renewable agricultural source (e.g. corn, starch, and sugarcane);
2) The production consumes quantities of carbon dioxide; 3) The production is extensively energy efficient;
4) PLA is recyclable and compostable; 5) PLA can help improve farm economies;
6) It is possible to manipulate the physical and mechanical properties of PLA through the polymer architecture [15].
Figure 2 shows a life cycle model for PLA:
9
The basic constitutional unit of PLA, lactic acid, can be produced by carbohydrate fermentation or chemical synthesis. Lactic acid (2-hydroxy propionic acid) is the simplest hydroxyl acid with an asymmetric atom of carbon, which exists in two optically active configurations, the L (+) and D (-) isomers. The L (+) and D (-) isomers are produced in bacterial systems. Mammalian systems produce only the L (+) isomer which is easily assimilated. A large fraction of lactic acid is made by bacterial fermentation of carbohydrates. The fermentation processes which leads to production of lactic acid can be classified according to the type of bacteria used. In the Heterofermentative method less than 1.8 moles of lactic acid per mole of hexose is obtained along with significant levels of other metabolites such as acetic acid, ethanol, glycerol, mannitol and carbon dioxide. In the Homofermentative method an average of 1.8 moles of lactic acid per mole of hexose and minor levels of other metabolites are obtained. Due to greater yields of lactic acid and lower levels of byproducts in homofermentative pathways, they are mostly used in industry. Generally, sources of simple sugars such as glucose and maltose from corn or potato, sucrose from cane or beet sugar and lactose from cheese whey are used in this method. In addition to carbohydrates, other nutrients such as amino acids, B vitamins, and nucleotides are provided by rich corn steep liquor.
Different routes can be used to obtain PLA high molecular weight. The chemical synthesis route can be used to produce large scale quantities of racemic lactic acid but it is not financially feasible. As a result, in its stead the production of L-lactic acid by means of fermentation is becoming way trendier. Mainly, there are three methods to produce high molecular mass PLA of about 100000 Daltons: 1) direct condensation polymerization; 2) azeotropic dehydrative condensation and 3) polymerization through lactide formation.
The properties of high molecular weight PLA can be manipulated by the polymer architecture (i.e. the stereochemical makeup of the backbone) and the molecular mass, which is controlled by the addition of hydroxylic compounds. Ability of controlling the stereochemical architecture allows precise control over the speed of crystallization and
10
finally the degree of crystallinity, the processing temperatures of the material, and the mechanical properties [14].
The degradation behavior of PLA strongly depends on the degree of crystallinity of the samples. PLA can be hydrolyzed with boiling water or steam to lactic acid, which means it can be recycled back to the monomer. This could result in molecular recycling and would permit the recycling of both manufacturing plant materials and post-consumer products [14].
After several months of exposure to moisture, PLA starts to degrade by hydrolysis. Polylactide degradation occurs in two stages. First, random non-enzymatic chain scission of the ester groups leads to a decrease in molecular weight. This step can be accelerated by acids or bases and is affected by both temperature and moisture levels. Embrittlement of the polymers takes place in this step with a reduction of the molecular weight to around 40900 Daltons. In second stage, low molecular weight PLA can diffuse out of the bulk polymer and can be used by microorganisms, yielding carbon dioxide, water and humus [14].
11
Cost issues and sustainability of resources
The starting material to produce PLA is derived from plant materials which are renewable annually. It means that principally, this aliphatic polyester can be produced in a sustainable way. Since this polymer is biodegradable, this bio-based plastic can be converted back to CO2, which is then fixed by plants via photosynthesis. Therefore, the
production of PLA can be regarded as “carbon neutral” or “zero-emission” processes, which the net amount of carbon in the environment remains constant over the extended time and on a global scale. Since there is a decrease in the consumption of fossil resources, the application of bio-based and biodegradable plastics such as PLA is mostly referred to as being ecofriendly and sustainable. However, there are also concerns that the production of these renewable polymers may not necessarily be environmentally friendly. The sustainability of renewable polymers also includes the sustainability of the raw materials required for the production of bio-based polymers such as PLA.
It should be noted that the current technology for producing PLA is confining valuable food supplies for the growing global human population as well as for livestock feed. Moreover, the production of bioethanol currently is using the same raw materials. Therefore, it can be expected that in oncoming future, there will be limits for supplying these raw materials for the production of not only renewable plastics but also bioethanol. [11].
Despite the promising characteristics of renewable polymers, a series of economic and engineering barriers may hinder their introduction to the market. Even if some biopolymers are representing environmental characteristics that are preferable to petro-based polymers, much work needs to be done to bring down the costs of biologically derived materials. Commercially available biopolymers are normally more expensive than synthetic resins. In only a few specialized applications, such as biomedicine, the relatively high costs of biopolymer materials are acceptable in the market. Since most biopolymers are in the early phases of development, it is difficult to estimate whether economy-of-scale manufacturing will be able to decrease their current high production costs. In general, the commercialization difficulties facing biopolymers in many ways
12
resemble the problems confronting other emerging technologies. This study is going to tackle the economic aspect of renewable polymers by formulation of composite materials. The properties and cost of renewable polymers can be modified and improved using natural fillers, which can decrease the cost of a material without modifying the biodegradability. Natural fillers are suitable reinforcement materials for composites because they can combine their good properties with environmental advantages on account of their abundance and biodegradability [16].
Agricultural wastes
Agricultural wastes are described as the residues from the growing and processing of raw agricultural products such as fruits, vegetables, dairy products, meat, poultry, and crops. They are the non-product outputs of production and processing of agricultural products, which may carry material that can be beneficial for human but whose economic values are less than the cost of collection, transportation, and processing for using. Their composition depends on the system and type of agricultural products and they can be in the form of liquids, slurries, or solids. Agricultural waste which also called agro-waste includes animal waste (e.g. manure, animal carcasses), food processing waste, crop waste (e.g. corn stalks, sugarcane bagasse, drops and culls from fruits and vegetables) and hazardous and toxic agricultural waste (e.g. pesticides, insecticides and herbicides). Amount estimation of agricultural waste is not easy, but generally it can be approximated as a significant proportion of the total waste in the developed world. Development of agricultural production has naturally yielded to increase in quantities of livestock waste, agricultural crop residues and agro-industrial by-products.
The ultimate purpose to optimize utilization of waste, while minimizing environmental impacts can reach by concept of ‘3Rs’ which is reducing quantity of wastes, reusing the waste products with simple treatments and recycling the wastes by using it as new resources to produce same or modified products. Some waste products can be consumed as resources for production of different goods or the same product, which means recycling the same resource. When wastes are reused frequently, it compensates harvesting of the similar or same products and this fact helps to maintain main resources exploitation and reduces waste generation. On the whole, the 3Rs
13
actions individually or collectively saves fresh resources exploitation, add value to the already exploited resources or formerly unused materials and importantly minimizes the waste quantity and its hazardous impacts. The concept of reducing waste, reusing and recycling resources and products (3Rs) aims to reduce the waste production by:
Choosing the proper materials which lead to reduce the amount of waste generated.
Repeated use of materials or parts of them which still are usable. The use of waste itself as resources.
Waste minimization efficiency defines better by applying 3Rs in a hierarchical order (Figure 4). The waste hierarchy refers to the "3Rs" i.e. reduce, reuse and recycle, which classify waste management strategies in respect to their desirability. The 3Rs are meant to be a hierarchy, in order of importance. The waste hierarchy has taken many forms through the time, but the basic concept has remained the constant in most waste management strategies. The aim of the 3Rs hierarchy is to obtain the maximum practical benefits from products and by-products and generate the minimum amount of waste [17].
Figure 4. The 3 Rs hierarc hy [5]
The ultimate goal of green productivity and 3Rs concept, could be achieved through zero discharge, zero emission, zero pollution, cost-effective processing, application of clean production technology and reaching to the circular economy. In circular economy,
14
the value of products, materials and resources is maintained in the economy for as long as possible, and the generation of waste is minimized (Figure 5).
Figure 5. Circular economy [ 12].
There is an essential need for changing the global definition of waste from undesirable and unwanted material, to a potentially usable resource. This new definition helps avoiding contamination of air, water, and land resources, and prevent transmission of hazardous materials as well as minimizing depletion of resources. This requires using technology, a change in philosophy and attitudes, and efficient approaches to agricultural waste management. There are number of applications which the agricultural wastes can be used, including: 1) Fertilizer application 2) Anaerobic digestion 3) Adsorbents in elimination of heavy metals 4) Pyrolysis 5) Natural filler in production of composites 6) Direct combustion 7) Animals feed [17].
The latest legislation on waste management, places much emphasis on the valorization of agricultural and food industries waste and the technologies associated with it. Bio-refinery is a novel concept similar to the petroleum Bio-refinery where all components of the raw material are converted into commercially viable products (e.g., biofuel, enzymes,
15
oils, nutraceuticals). However, these different processes sometimes imply complex steps and can produce further wastes and need high cost operations. An alternative way can be found in using agricultural waste without further treatments as natural filler in the formulation of composite materials [18].
Agricultural wastes as fillers in composites
Composites are materials composed of two or more different materials with the properties of the resultant material being superior to the properties of individual material that make up the composites [6]. Polymer composites have been widely used for several years and their market is significantly growing. It is widely known that the use of a petro-based polymer and one (or more) solid fillers allows obtaining several advantages and, in particular, a combination of the main properties of the two (or more) solid phases. Among the fillers used, it is worthy to name calcium carbonate, glass fibers, talc, kaolin, mica, wollastonite, silica, graphite, and synthetic fillers. However, the matrix of these composites are derived from fossil fuels and the two different components make the reuse and recycling completely difficult. Due to this fact, it is often preferred to perform the direct disposal in a dump, or incineration, which is not acceptable due to the high costs of materials and processes, the technical difficulties and the environmental impacts [19]. Therefore, global awareness of environmental issues has resulted in the emergence of ‘”eco-composites” or ‘”green composites” which are renewable resources based, recyclable, and biodegradable. To develop green composite materials, natural fillers, such as hemp, flax, jute, and kenaf, have been used to replace conventional synthetic fillers. In addition, matrix materials in the form of renewable polymers have been derived from starch, vegetable oils, protein and etc., replacing the petro-based polymers. Many plants, fruits, crops and pods from agricultural sources are being regarded as an important source of viable natural fillers for green composite industries [20]. Natural fillers including fibers and particle fillers can be extracted from agricultural wastes with low cost and without complicated processes. They are also less abrasive than inorganic-mineral fillers to processing machinery, less dangerous for the production employees in case of inhalation, easy to be incinerated, they lead to final composites with lower specific weight (in comparison to mineral-filled
16
counterparts) and permit obtaining promising properties in terms of thermal and acoustic insulation [19]. Natural fillers may be obtained either from plants or animals. Plant based fillers such as hemp, kenaf, flax, bamboo and sisal have gained much commercial successes in automotive applications. Fillers obtained from animal sources like silk and wool are also used as reinforcing agents in matrix polymers [13]. Recently, bio-wastes such as hazelnut skin, rice husk, cocoa byproducts, and wood flour or fiber have been used as natural filler for polylactic acid (PLA) [21]. Some of the green composites are now being used commercially, most notably short wood fiber-lignin and short flax fiber-PLA. As a commercial example, Toyota have developed automotive parts from kenaf-PLA composite, including the Toyota Raum spare wheel cover, which is claimed to be the first 100% natural automotive product in the world [7].
To conclude, using agricultural wastes as natural fillers in formulation of green composites with renewable polymers as matrices, in addition to environmental benefits, has magnificent economic advantages. Currently renewable polymers are produced in high cost processes compared to petro-based polymers [18]. By using agricultural wastes as filler, we can decrease the price of renewable polymers in addition to the utilization of the materials derived from wastes while helping circular economy.
Coffee SilverSkin
Coffee is one of the world’s most popular beverage and highly traded commodity. The coffee industry has grown continuously, with global production more than 100 million tons per year [8]. The most important botanical coffee species and varieties are coffee “Arabica” and coffee “Robusta”, which represent about 75 and 24 percent of the global production, respectively [22]. Coffee cherries are the raw fruit of the coffee plant, which are composed of two coffee beans covered by a thin parchment like hull and further surrounded by pulp (Figure 6). When the bear fruit turns red, the cherries will be harvested, usually 5 years after trees plantation. The processing of coffee starts with the conversion of coffee cherries into green coffee beans, and first step is the removal of both the pulp and hull using either a wet or dry method. Depending on the method of coffee cherries processing, the solid residues have different terminologies: pulp or husk, respectively. The roasting of coffee beans, in which the raw green beans will turn into
17
the roasted beans, is the next important step in coffee processing. The specific organoleptic properties such as flavors, aromas, and color are developed in this step which determine the quality and the excellence of coffee beverage as result [23]. Coffee silverskin (CS) and spent coffee grounds can be mentioned as the main coffee industry residues. Figure 7 summarizes CS production in wet process.
Figure 6. Coffee cherr y cr oss section [9].
Coffee silverskin (CS) is a thin tegument of the outer layer of the two beans forming the green coffee seed and constitutes about 4.2% (w/w) of coffee beans and obtained as a by-product of the roasting process [24]. CS consists mainly of polysaccharides, such as in the form of cellulose (24%), hemicellulose (17%) and lignin (29%). These fibers usually have been used as poultry diets and raw materials in the production of paper. Recent studies have focused on the potential use of this by-product with advances in industrial biotechnology. For instance, CS could be considered as a functional ingredient for food due to its antioxidant capacity and high concentration of soluble dietary fibers [25]. This material could also be utilized as substrate for cultivation of microorganisms in order to release phenolic compounds or produce enzymes as well as having the potential to be consumed as a form of raw material to produce fuel ethanol [24].
18
Figure 7. CS production t hrough wet process of coffee cherries [10].
19
Due to the massive consumption and production of coffee all around the world, coffee industries produce huge amount of residue and waste. As mentioned above, limited applications for these residues are under research, but all the studies underway are not functionalized yet and they are currently more of a theoretical effort rather than a practical solution and the potentially beneficial coffee waste is rarely used as livestock feed or fertilizers and mostly disposed of in sanitary landfills. However, coffee waste can cause severe environmental problems if discarded because they contain toxic substances such as caffeine, tannins and polyphenols. As a result, there is a need to develop appropriate and economical methods of using these agro-industrial residues and applying them in industrial fields for sustainable development [25]. The aim of this study is to evaluate of applying agricultural waste in production of green composites and specifically using fraction of coffee silverskin (CS) as natural filler in PLA matrix. Investigating on this subject, in addition to its environmental benefits such as minimalizing the dependency to fossil fuels, is a quite economically viable move since it adds value to the formerly useless coffee by-products as well as reducing renewable polymer prices. Although there are a lot of study which are focused on developing green composites, but CS has not yet been used for this purpose.
20
Experimental work
This section is going to discuss about the following subjects:
The materials were used for preparation of polymer matrix and natural filler. The method were applied to produce the composites and samples.
The tests were performed to study the characteristics of the composites and their results.
Materials
In order to formulate the composite with renewable polymer as matrix and agricultural waste as natural filler, PLA and Coffee SilverSkin were used respectively, as noted before.
Matrix
The matrix for producing the green composites in this study is PLA (polylactide acid) and Ingeo Biopolymer 3100HP NatureWorks has been used. This biopolymer is a medium viscosity product designed for medium flow injection molding applications. Applications include disposables such as cutlery, cups, plates, cosmetic packaging, and durables such as electronics housings and semi-durable building materials. 3100HP offers the possibility of adding nucleating agents, impact modifier or reinforcing agents for compounders, to meet the requirements of their application and therefore, it was an appropriate choice for goals of this study [26].
21
Table 1. Characteristics of Ingeo 3100HP [26].
Property PLA-3100HP ASTM Method
Specific Gravity 1.24 D792
MFR, g/10 min (210˚C, 2,16 Kg)
24 D1238
Heat distortion temperature, 66 psi, (0.455 Mpa)
149˚C E2092
Molded linear shrinkage 1.7-1.8% Melt Temperature (Processing
temperature)
200˚C Glass Transition Temperature 55-60˚C
Filler
The natural filler which was used for making the green composite in this study is Coffee SilverSkin. As it noted before, silverskin is the by-product of coffee roasting process and they were achieved from Caffe’Cagliari spa Company in Modena, Italy. The composition of coffee silverskin can be seen in the table 2.
Table 2. Chemical composition (g/100g) of coffee silverskin. A [27], B [28]. Nd not determined.
Components A B Cellulose(glucose) Nd 17.8 Hemicellulose Nd 13.1 Xylose Nd 4.7 Arabinose Nd 2.0 Galactose Nd 3.8 Mannose Nd 2.6 Protein 18.6 16.2
22 Fat 2.2 Nd Ashes 7.0 4.7 Extractives Nd 15.0 Total fibers 62.4 Nd Soluble 53.7 Nd Insoluble 8.8 Nd
Coffee silverskin were ball milled with Rapid mill instrument produced by MMS Company, for 20 minutes at room temperature (figure 9). The high impact energy produced during the ball milling process were useful for grinding and homogenization of the materials. Hereafter, coffee silverskin will be referred to as CS.
Figure 9. Ball milling machine and balls.
Scanning electron microscopy (SEM) has been used after ball milling process to investigate the size and the morphology of the particles of the coffee silverskin. Figure 10 shows the SEM image.
23
Figure 10. Overall morphology aspect of coffee silverskin.
Particle size distribution analysis were also performed on the coffee silverskin and the results can be seen in figure below.
24
Preparation of composites and samples
PLA and coffee silverskin powders, were vacuum treated for more than 12 hours to eliminate moisture and absorbed gases. Afterward, in order to mix the PLA and CS in different compositions, Plasti-corder apparatus produced by Brabender Company were used (figure 12). By using this apparatus, it is possible to set the appropriate temperature and rotational speed range for the mixing, and the amount of torque depending on rotational speed and materials will be calculated by this instrument.
Figure 12. Brabender apparatus.
In order to produce the composites, the temperature set at 190˚C and the rotational speed set at 60 per minute. Three composites were produced by using this apparatus with 10%, 20% and 30% weight percent. Moreover, the pure PLA also was put in this instrument, with the same temperature and rotational speed range to equalize the conditions with the previous composites and to investigate the effect of Brabender apparatus on the characteristics of the materials.
25
For the sake of making samples out of the composites, and in general, applying different tests on the materials, the composites were needed to be powder. Due to this reason, making powders by using milling machine were performed. The milling apparatus was M 20 Universal mill, produced by IKA Company (figure 13), batch mill machine suitable for dry grinding of hard and brittle substances up to 250 ml with a fixed speed of 20000 rpm [29].
Figure 13. Milling machine.
Due to the hardness and rigidity of materials after compounding process by Brabender apparatus, liquid nitrogen has been used for milling the composites. Liquid nitrogen has extremely low temperature and it is a colorless liquid with density of 0.807 g/ml and boiling temperature of -195.79˚C and it can be stored and transported by vacuum flask in the laboratory. Significantly low temperature of liquid nitrogen made the materials more brittle and easier to grind for milling machine (figure 14).
26
Figure 14. Using liquid nitrogen for milling the materials.
Each of the machines were used to prepare the materials (Brabender apparatus and Milling machine), could have potentially some effects on the results of the tests. In order to have clear understanding about these effects, rather than three composites with different amount of CS which were compounded in Brabender apparatus and milled by the milling machine, three other samples were also prepared from the pure PLA. First, pure PLA without any further processes. Second, pure PLA which were mixed in Brabender apparatus and grinded by milling machine, the same as composites with CS, and third, pure PLA which was only milled in the milling machine.
27
Table 3 summarizes the composition of all the investigated composites which were produced in this step, with the relevant codes hereafter used to define them:
Table 3. Composition of the investigated composites.
Sample code PLA (wt%) CS (wt%) Processes
PLA-3100HP 100 0 Not Compounded, Not Milled
PLA-CS10 90 10 Compounded, Milled
PLA-CS20 80 20 Compounded, Milled
PLA-CS30 70 30 Compounded, Milled
PLA-Br-M 100 0 Compounded, Milled
PLA-Ml 100 0 Not Compounded, Milled
In order to perform tensile and water absorption tests, dog-bone and disk shape samples were needed respectively. For preparing the samples, composites have been sent to Modena city, and by using injection moulding process, samples were produced with dimension of 2mm*5mm*25mm for dog-bone samples and 1mm height and 30 mm diameter for disk shape samples (figure 16 and 17).
28
Figure 17. Disk shape sample.
Complementary part
In order to investigate the effects of compounding process by Brabender machine on mechanical properties of materials, this part was added to this study. In addition to negative effects of Brabender machine on mechanical properties of samples, this process consumes considerable amount of energy which has undesirable environmental impacts. The aim of this part was to produce samples without using compounding machine (to prevent materials from degradation by this process and saving energy) and perform only tensile test on two types of sample including: pure PLA (relevant code: PLA-Am) and PLA with 30%wt CS (relevant code: PLA-Am-CS30).
The PLA which has been used in this part was amorphous PLA, and the coffee silverskin was the same as the previous section. The composite was produced simply by mixing polymer and waste with correct proportions without any further processes. The dog bone samples with the same dimensions and with the same injection moulding process were produced for this part.
29
Tests
Tensile test
Tensile test is a fundamental engineering test to know about the mechanical behavior of materials. This test is made by holding the ends of a standardized test sample (dog-bone specimen) in a tensile test machine, and applying continuously increasing uni-axial load, until the time which failure occurs in the sample. Properties which are directly measured by this test are tensile stress and elongation of the sample at each time, and accordingly tensile strength, elongation at break and tensile stress at break. By means of this test, the tensile stress is recorded as a function of the increase in sample length and consequently, the test provides stress-strain curve, which the y-axis is tensile stress and x-axis is strain (elongation) (figure 18). These two can be defined as below:
Strain:
Where ΔL is the change in sample length, and L0 is the initial length of
sample Stress:
Where Fn is tensile force and A is the cross-sectional area of the sample
When small stresses apply to a solid material, the bonds between atoms are stretched, and after removing the stress, the bonds relax and the solid material returns to its original shape. This reversible deformation is called elastic deformation. For most materials, the initial part of stress-strain curve is linear, and it refers to elastic deformation of the material, and the slope of this linear region is called Elastic modulus or Young’s modulus. However, if the solid material is subjected to higher stresses, planes of atoms will slide over one another. This deformation is not reversible and by removing the stresses, the distortion will not recover and is referred to plastic deformation. Beyond the initial part of stress-strain curve, the graph does not follow linear trend anymore and it is related to plastic behavior of the material [31]. The point on the stress-strain curve that indicates the limit of elastic behavior and beginning of plastic behavior is called Yield point.
30
Figure 18. Stress-strain curve [30].
The specimen which is used for tensile test is called dog-bone sample. It has enlarged ends or shoulders for gripping by the apparatus, and a gage in between, which deformation and failure occur in this section (figure 19).
Figure 19. Geometry of dog-bone specimen.
As mentioned before, in this study, the dog-bone specimen with width equal to 5 mm, length equal to 25mm and height equal to 2mm were used to perform the tensile test. Tensile tests in this study were performed by an INSTRON 5966 series test apparatus (figure 20), without preloading and with speed of 5 mm per minute followed by ISO 527-1, on four samples for each composition. The instrument reported the stress-strain graph for each composition, and the amount of Young’s modulus calculated by means of the slope of linear part of these curves.
31
Figure 20. Tensile test apparatus.
The values of Young’s modulus, tensile strength and elongation at break for all samples of different compositions can be seen in table 4:
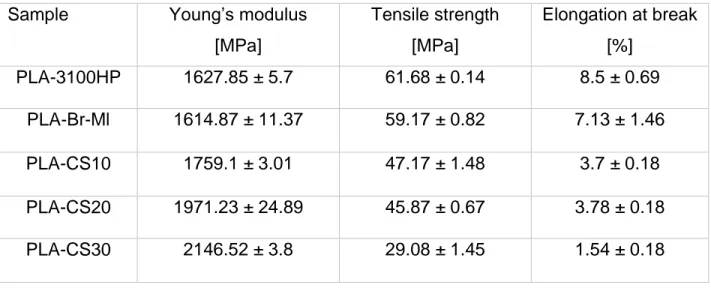
Table 4. Values of Young’s modulus, tensile strength and elongation at break.
Sample Young’s modulus
[MPa] Tensile strength [MPa] Elongation at break [%] PLA-3100HP 1627.85 ± 5.7 61.68 ± 0.14 8.5 ± 0.69 PLA-Br-Ml 1614.87 ± 11.37 59.17 ± 0.82 7.13 ± 1.46 PLA-CS10 1759.1 ± 3.01 47.17 ± 1.48 3.7 ± 0.18 PLA-CS20 1971.23 ± 24.89 45.87 ± 0.67 3.78 ± 0.18 PLA-CS30 2146.52 ± 3.8 29.08 ± 1.45 1.54 ± 0.18
32
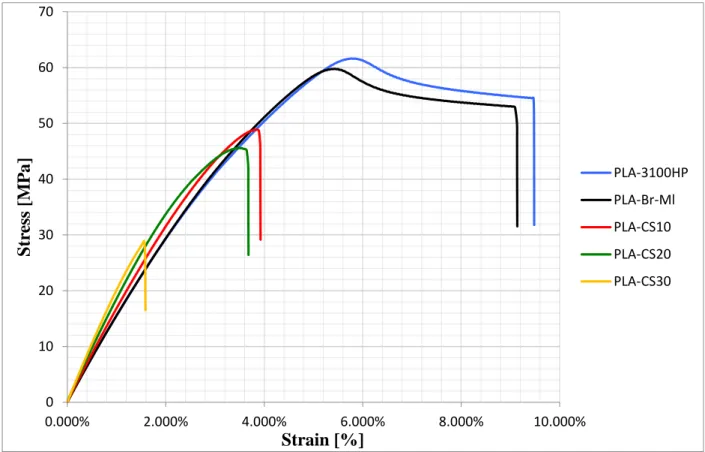
Figure 21 illustrates the stress-strain curves of all different compositions:
Figure 21. Stress-Strain curve for all compositions.
For the complementary part, the same procedure as above were used for two samples. The results can be seen in table below:
Table 5. Values of Young’s modulus, tensile strength and elongation at break.
Sample Young’s modulus
[MPa] Tensile strength [MPa] Elongation at break [%] PLA-Am 1747.14 ± 8.27 59.93 ± 0.35 4.6 ± 0.11 PLA-Am-CS30 2024.26 ± 37.88 46.74 ± 0.58 3.5 ± 0.07 0 10 20 30 40 50 60 70 0.000% 2.000% 4.000% 6.000% 8.000% 10.000% S tr ess [M P a] Strain [%] PLA-3100HP PLA-Br-Ml PLA-CS10 PLA-CS20 PLA-CS30
33
SEM
The scanning electron microscopy (SEM), applies a focused beam of high energy electrons for imaging of a surface of solid specimen, in a similar way that light microscopes use visible light. The signals which derive from electron-sample interactions, reveal important information about the sample including external morphology and texture, chemical composition, crystalline structure, morphology of fractured surface and orientation of materials making up the samples. Since the wavelength of electrons is much smaller than visible light, the resolution of SEM is superior to that of a light microscope. In most cases, data are collected from surface of the sample, and a 2-dimensional image is generated to display spatial variations in the above properties. The surface area of sample ranging from 1 cm to 5 microns in width, can be imaged by SEM with magnification ranging from 20X to approximately 30,000X. Another feature of SEM is ability of performing analyses of selected point locations on the sample. This approach is especially useful in qualitatively or semi-quantitatively determining crystalline structure, matrix-filler interface in composites and crystal orientations [39].
Accelerated electrons in an SEM carry significant amount of kinetic energy, and this energy is dissipated as a variety of signals produced by interacting electrons with the solid sample. These signals include secondary electrons, backscattered electrons, diffracted backscattered electrons, characteristic X-ray, cathodoluminescence and heat. Secondary electrons are most important for illustrating the morphology and topography on samples. Backscattered electrons are most valuable for showing contrasts in composition in multiphase samples and they show high sensitivity to differences in atomic numbers, the higher the atomic number, the brighter the materials appears on the image. X-ray signals are produced by inelastic interaction of SEM beam with electrons in discrete orbitals of atoms in the sample. Exited electrons yield X-ray with a fixed wavelength which is related to each elements, when they return to lower energy states. Therefore, characteristic X-rays are emitted for each elements in a sample that is excited by SEM beam. When the electron beams hit the surface of the sample, depending on the accelerating voltage and the density of the sample, it penetrates the
34
material to a depth of few microns. Many signals are produced as interaction inside the sample [39] (figure 22).
Figure 22. Schematic of electron beam interaction [38].
The main SEM instrument components include source of electron (gun), column which electrons travel down with electromagnetic lenses, detectors for all signals of interest, sample stage and display and data output devices. Electrons are produced by the gun at the top of the column, accelerated down and passed through the different lenses and apertures to become a focused beam of electrons and finally hit the surface of the sample. The entire electron column should be under vacuum to protect it from contamination as well as allow user to acquire a high resolution image. Furthermore, vacuum increases the collection efficiency of signals by the detectors in the electron column [39] (figure 23).
By applying electron beam to nonconductive samples, they collect charge and causes scanning faults and other image artifacts. Thus, In order to perform imaging by SEM, samples should be electrically conductive in the selected area, and electrically grounded to hinder accumulation of electrostatic charge. Nonconductive materials like polymers, usually coated with an ultrathin layer of conductive materials like gold,
35
carbon, aluminum or some other metals. The choice of material for conductive coating depends on the data to be acquired [39].
Figure 23. Schematic of a SEM instrument [38].
After performing tensile test, in order to investigate the morphology of the fractured surface of the specimens, SEM analysis (FEI, XL20 microscope, secondary electrons detector) was carried out after aluminum sputtering on the sample’s surfaces (figure 24).
36
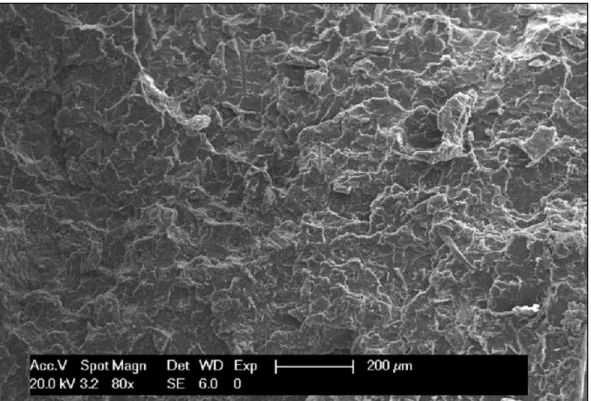
The SEM images for all the samples with 80X and 350X magnification can be seen in below:
Figure 25. The morphology of fractured surface of PLA with 80X magnification.
37
Figure 27. The morphology of fractured surface of PLA-CS10 with 80X magnification.
38
Figure 29. The morphology of fractured surface of PLA-CS20 with 80X magnification.
39
Figure 31. The morphology of fractured surface of PLA-CS30 with 80X magnification.
40
DSC test
Differential scanning calorimetry (DSC) is a powerful thermal analysis technique, for determination of substance properties in dependence on temperature. In this test, while the sample and reference are exposed to a controlled temperature program, the difference in amount of heat flow into or out of them is measured as a function of temperature or time. In this apparatus, the sample is placed in an aluminum pan near an empty reference pan in the DSC chamber. DSC can be divided in two types: Power compensation and Heat flux. First method uses measurement of the electrical energy provided to heaters below the pans to maintain the two pans at the same temperature, however, the second method measures the heat flow as a function of temperature (figure 33).
Figure 33. Two types of DSC instrument [32].
Due to detection of energy changes or heat capacity variations with great sensitivity, this instrument is capable of detailed studying in phase transition such as glass transition, melting or exothermic decompositions. The fundamental principal underlying this technique is the difference of the heat between sample and reference which needs to flow in order to maintain both at the same temperature. If the sample needs more heat flow than the reference, it shows that the process is endothermic, and if the sample needs less heat flow than the reference, it indicates that the process is exothermic. In a melting process, the sample needs more heat flow to increase its temperature at the same rate as the reference, and it is because of the endothermic phase transition from
41
solid to liquid. Or in a crystallization of a material, as this process is exothermic, the sample requires less heat flow than the reference. By observing the difference in heat flow between the sample and the reference, the amount of heat absorbed or released during transition can be calculated.
In polymer science, DSC can be used to identify the glass transition temperature, crystallization temperature, melting temperature and enthalpy of transition as well as degree of crystallization for these materials. The difference between the melting temperature (Tm) obtained from DSC test and literature data, can give information about
the degradation of polymers. As melting point depends on molecular weight, decrease in Tm shows lower grade of polymer.
The output of DSC test is a curve with heat flow in its x-axis and temperature or time in its y-axis. By integrating the peak corresponding to a given transition, it is possible to compute the enthalpy of transition. Figure 34 shows a typical DSC curve with exothermic and endothermic transitions.
Figure 34. Typical DSC curve [33].
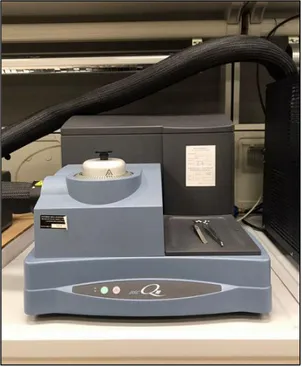
In this study, Q10 DSC apparatus produced by TA instruments was used to analyze five different compositions (figure 35). The temperature program for the DSC test was the same for all the samples and it can be explained as follows: it starts by 8 minutes isothermal at 0˚C, heating with rate of 20˚C/min until the sample reach to 200˚C, 1 minute isothermal at 200˚C, cooling with rate of 10˚C/min until the sample reach to 0˚C,
42
5 minutes isothermal at 0˚C and eventually heating with rate of 20˚C/min until the sample reach to 200˚C (figure 36).
Figure 35. DSC instrument.
Figure 36. Temperature program for DSC tests.
0 50 100 150 200 250 0 2 4 6 8 1 0 1 2 1 4 1 6 1 8 2 0 2 2 2 4 2 6 2 8 3 0 3 2 3 4 3 6 3 8 4 0 4 2 4 4 4 6 4 8 5 0 5 2 5 4 5 6 5 8 TE MPA R A TURE [C] TIME [MIN]
TEMPERATURE PROGRAM
43
The heat flow versus temperature curves for all the samples were obtained by the DSC test and figure 37 shows the second and third ramp, i.e. starting from minute 19 until the end of temperature program, of all the samples. After each test, by means of TA Universal Analysis software, the crystallization and melting temperature and the enthalpy of these transitions (ΔHc and ΔHm) were calculated for each sample. Table 6
summarizes these information.
Table 6. Values of crystallization and melting temperature and enthalpy of these transitions for all samples.
Sample Tc (˚C) ΔHc (J/g) Tm (˚C) ΔHm (J/g) PLA-Br-Ml 117 42.7 175 44.1 PLA-Ml 131.5 16 175.7 35.1 PLA-CS10 95.4 22.28 176 42.8 PLA-CS20 95.8 23.6 174.7 38.7 PLA-CS30 96.5 21.95 173.4 34.9
Figure 37. Heat flow versus temperature curve for all the samples.
-1 -0.5 0 0.5 1 1.5 2 0 50 100 150 200 250 H eat flow [ W/g] Temperature [C]
DSC curve
44
TGA test
Thermal gravimetric analysis or Thermogravimetric analysis (TGA) is a technique of thermal analysis, in which the mass of a substance is measured as a function of temperature or time, as the specimen is subjected to a controlled temperature program in a controlled atmosphere. A thermogravimetric analyzer consists of a sample pan which is supported by a precision balance. The pan is located inside a furnace and is heated during the experience (figure 38). The temperature is increased at a constant rate to incur a thermal reaction, and the mass of the sample is measured continuously. Controlling the atmosphere of the experiment is carried out by means of a purge gas which flows over the sample and exits through the exhaust with a constant flow rate. This purge gas could be air, inert (nitrogen), reactive (oxygen) or corrosive gases, but mostly, TGA experiments use inert gases. Because in this situation, the sample only reacts with temperature during the decomposition.
Figure 38. TGA schematic view [34].
TGA in general can be used to investigate any physical process (such as evaporation), or chemical process (such as thermal degradation) which results in losing volatile gases by the material. This test is a powerful tool to examine the thermal stability of the materials, as well as for compositional information. The temperature range at which weight loss occurs, is important for understanding how a material behaves in high temperatures. Exploiting various atmospheres within the instrument, allows analysis of reactions with air, oxygen or other reactive gases and results in useful information about the composition of the sample [35].
45
The output of TGA test can be explained by a TGA thermal curve, which its y-axis is weight or weight percent, and its x-axis is time or temperature. TGA thermal curve displays from left to right and having descending graph, indicates weight loss during the experiment. By extrapolation of the curve, it is possible to calculate the onset temperature that denotes the temperature at which the weight loss begins. In polymer materials, the onset of weight loss is used to describe the upper temperature limit of thermal stability. In the other word, beyond this point, the material begins to degrade. However, due to chain scission or cross-linking reactions, degradation in many cases has already taken place before onset point and without a detectable weight loss [35]. Additionally, first derivative of the TGA curve can give useful information about the rate of weight loss. The peak of the first derivative indicates the point that maximum rate of weight change occurs.
Due to performing TGA test in this study, sample powders were put in the oven with temperature of 60°C and vacuum situation for 12 hours, in order to eliminate the humidity, oxygen and nitrogen content of the samples (figure 39). TGA 4000 apparatus produced by PerkinElmer was used to examine all the samples (figure 40). The test was performed in nitrogen atmosphere with flow of 40 ml/min and the temperature program for all the samples was the same and it can be explained as follows: it started from 50°C and samples were heated with rate of 10°C/min until they reached to 800°C, and finally 2 minutes isothermal at this temperature.
46
Figure 40. TGA instrument.
In order to know the thermal characteristics of the coffee silverskin and its effects on the samples during the test, pure coffee silverskin also were examined by this test. TGA curves and the first derivatives of the curves can be seen in figure 41 and 42. By means of the TGA instrument’s software, the amount of temperature corresponding to weight loss onset and the final residue of the samples were calculated. Table 7 summarizes these values.
Table 7. Values of temperature corresponding to weight loss onset and final residue of the samples.
Sample Tonset [°C] Residue [%]
PLA-3100HP 340 0.1
PLA-Br-Ml 343 1.2
PLA-CS10 301 3.7
PLA-CS20 288 7.6
47
Figure 41. TGA curve for all the samples and coffee silverskin.
Figure 42. First derivative of TGA curves.
0 20 40 60 80 100 50 250 450 650 850 W eigh t [% ] Temperature [°C]
TGA curve
PLA-3100HP PLA-CS10 PLA-CS20 PLA-CS30 Coffee Silverskin PLA-Br-Ml -25 -20 -15 -10 -5 0 5 50 150 250 350 450 550 650 750 850 950 Wei gh t [% ] Temperature [°C]First derivative of TGA curve
PLA-3100HP PLA-CS10 PLA-CS20 PLA-CS30 Coffee Silverskin PLA-Br-Ml
48
Water absorption test
Water absorption test is used to determine the amount of water absorbed by the material under specified condition. Factors affecting the water absorption include: type of the polymer and filler which are used, volume of the filler, voids, viscosity of the matrix, humidity, temperature and length of exposure.
One of the disadvantages of using natural materials such as agricultural wastes as filler in composites, is having higher moisture absorption than conventional synthetic fillers which brings about dimensional changes and therefore, leading to micro-cracking and poor thermal stability. This phenomenon has several adverse effects on such composites and subsequently on their long-term performance. Water absorption can result in swelling of the filler, forming micro-cracks and voids at the filler-matrix interface region which may effect on mechanical properties and dimensional stability of the composites. Some researches indicate that after absorbing moisture, water molecules can act as a plasticizer agent in composite materials and decrease the mechanical properties of these materials [36].
There are three major mechanism of water absorption in polymer composites which can lead to degradation of these materials. First, diffusion of water molecules inside the micro gaps between the chains of polymers. The second mechanism involves capillary transport of water molecules into gaps at interfaces between filler and matrix, and the third mechanism is the diffusion of water molecules through the micro-cracks in the matrix, as a result of swelling effects [36]. According to these mechanisms, there are three cases of diffusion behavior, including Fickian diffusion model, anomalous or non-Fickian, and an intermediate case between Fickian and non-Fickian [37].
In order to investigate the long-term application of these composites, it is necessary to study the moisture absorption and water uptake of these materials.
For performing water absorption test, standard test method for moisture absorption properties and equilibrium conditioning of polymer matrix composite material, ASTM D5229/D5229M-14, was followed. The specimen were disk shape samples, due to their easy calculation of surface/volume ratio. After primary weight measurement, samples
49
were dried in oven at 60˚C for 24 hours to eliminate all the moisture and determine the initial dry weights (figure 43). Afterward, they were stored at 100% humidity condition in a chamber at room temperature for longer period to reach equilibrium (figure 44). At regular time intervals, the samples were taken out from the chamber and wiped with filter paper to remove the surface water and weighted with digital scale produced by Kern&Sohn Company (figure 45). There were some water drops on the surface of samples, especially on samples with higher percentage of coffee silverskin, which were existed due to hemicellulos of the coffee silverskin. This process continued until the samples reached the saturation limits. The weighting was done in short time, in order to avoid the error due to evaporation.
50
Figure 44. Chamber with 100% humidity.
51
Figure 46 indicates the percentage of weight gain as a function of square root of time for all the samples.
Figure 46. Water absorption behavior of samples.
0 1 2 3 4 5 6 7 8 0 5 10 15 20 25 Wei gh t gain [% ] Time [h0.5] PLA-3100HP PLA-Br-Ml PLA-CS10 PLA-CS20 PLA-CS30
52
Contact angle test
Contact angle test is a common way to measure the wettability of a surface or material. Wettability refers to investigation of how a liquid deposited on a surface of solid or the ability of liquids to form a boundary surfaces with solid states. The contact angle defined as the angle formed by intersection of the liquid-solid interface and the liquid-vapor interface. In the other word, geometrically explained by applying a tangent line from the contact point along the liquid-vapor interface in the droplet profile. Figure 47 shows different situation of the drop liquid on the surface of solid. When the contact angle is less than 90˚, the wetting of the surface is favorable and the liquid will spread over a large area on the solid surface. In the opposite, when the contact angle is more than 90˚, it indicates that the wetting is not favorable and the liquid will minimize its contact with the solid surface and form a compact liquid drop. For example, by having contact angle equal to 0 degree, the droplet turns into a flat puddle and complete wetting will occur. While having a contact angle greater than 150 degrees, shows almost no contact between the liquid drop and the solid surface and indicates a super hydrophobic surface [40].
Figure 47. Illustration of contact angle formed by sessile liquid drop on a solid surface [40].
Factors affect the contact angle include both properties of the solid and the liquid, the interaction and repulsion forces between solid and liquid, and the properties of three phase interfaces (gas, liquid and solid). The interactions can be described as cohesion and adhesion forces which are intermolecular forces. The balance between cohesive forces and adhesive forces will determine the contact angle in the liquid solid interface. Cohesive forces are forces between similar molecules such as between the liquid molecules, like hydrogen bonds and Van der Waals forces, whilst, adhesive forces are
53
forces among dissimilar molecules such as between the liquid and solid molecules, like mechanical and electrostatic forces. For instance, smaller contact angles show that the cohesive forces are weaker than adhesive forces and molecules of liquid tend to interact more with solid molecules than liquid molecules [40].
Moreover, Young’s equation shows that the contact angle of a liquid drop on an ideal solid surface is defined by the mechanical equilibrium of the drop under the action of three interfacial tensions (figure 47):
ƴlv.cos θy = ƴsv - ƴsl
Where ƴlv , ƴsv and ƴsl are liquid-vapor, solid-vapor and solid-liquid interfacial tensions,
respectively, and θy is the contact angle [40].
Among different methods for measuring the contact angle, the most frequently used one is the sessile drop method which was also used in this study. In this method, the sessile drop contact angle is viewed directly by means of a goniometer-telescope. The instrument consists of a micrometer-controlled syringe held in place above a moveable stage where the sample is located. Contact angles are recorded using a goniometer equipped with a camera and using an image capture program software. Contact angles are measured by defining a circle around the drop and recording the tangent angle formed at the substrate surface. Finally, the software will measure the value of the angles for both right and left sides of the drop, and calculate the value of the contact angle by averaging them (figure 48).
54
In order to investigate the value of contact angle for different samples in this study, Drop shape analyzer-DSA30 produced by KRUSS Company were used (figure 49). Before performing the test, samples were left overnight in the oven at 60˚C, under vacuum. Afterward, they were placed on the stage and double-sided tape were used to ensure a flat viewing surface. A 4-µL distilled water drop was measured out from the syringe and dropped on the surface of samples. The drop was allowed to reach equilibrium before measurement was recorded and before evaporation occurs. Once the contact angle for the drop was measured, the sample was moved to allow another drop to be placed on the sample surface. Between four to six drops for each samples were used and the final value of contact angle achieved by averaging the different results (figure 50).
55
Figure 50. Measuring the contact angle by using several drops.
The values of contact angle for different samples can be seen in table below:
Table 8. Values of contact angle for all samples.
Sample Contact angle [˚] Standard deviation
PLA-3100HP 71.2 3.35
PLA-Br-Ml 71.4 4.3
PLA-CS10 79.6 3.77
PLA-CS20 83.8 5.05
56
Discussion of the results
The results of the tests were obtained by performing experimental work in the laboratory, and were showed in previous section. This section is going to discuss the data and investigate the effects of using coffee silverskin as filler in making composites with PLA as matrix.
Tensile test
To understand the effect of filler loading on mechanical properties, tensile test were performed on five different samples, including PLA-3100HP, PLA-Br-Ml and three composites with 10, 20 and 30 weight percentage of coffee silverskin (table 4).
The amount of Young’s modulus for the samples is growing by having increment in the proportion of coffee silverskin. Value of modulus slightly declined for PLA-Br-Ml, and it can be explained as a result of compounding and milling processes. For the composites, it is obvious that filler loading had positive effect on elastic modulus and improves this property in respect to the pure samples. Figure 51 illustrates the values of Young’s modulus for three samples with different amount of CS and PLA-3100HP. For the sample with 30 percentage coffee silverskin, there is approximately 30% improvement in the amount of modulus, and for the composites with 10 and 20 percentage of coffee silverskin, there are 8% and 21% improvements respectively.
Figure 51. Elastic modulus of investigated composites.
0 250 500 750 1000 1250 1500 1750 2000 2250 2500 0 10 20 30 Yo u n g' s Mo d u lu s [MPa] CS amount [wt%]
57
As it can be seen from table 4, the tensile strength values like elastic modulus values, decreased for the PLA-Br-Ml from 61.38 [MPa] to 59.17 [MPa] for PLA-3100HP, and it shows that preparation process had negative effects on the mechanical properties of the samples. It can be noticed from the results that there is a progressive decrease in the values of the tensile strength, by increment in the waste amounts. The tensile strength slightly declined up to the sample with 20%wt CS and afterward it dropped dramatically for the sample with 30%wt CS (figure 52). The difference between the amount of tensile strength for PLA-CS10 and PLA-CS20 is very low and they can be considered as the same, but the steep decrease from PLA-CS20 to PLA-CS30, indicates that loading the matrix with more than 20% of coffee silverskin is not acceptable due to weak mechanical properties and 20%wt of CS might be the maximum amount of filler for having appropriate tensile strength. This reduction in the values of tensile strength, shows that increasing in the amount of filler leads to a poor stress transfer capability and results in easier fracture.
Figure 52. Tensile strength of investigated composites.
Another property which was measured during the tensile test was elongation at break. Effect of compounding and milling processes can be seen by comparing the values of
0 5 10 15 20 25 30 35 40 45 50 55 60 65 0 10 20 30 Te n sile s tren gth [ MPa ] CS amount [%]
![Figure 3 . Chemical structure of PLA and its constituents [15 ].](https://thumb-eu.123doks.com/thumbv2/123dokorg/7392099.97212/10.918.251.673.618.985/figure-chemical-structure-pla-constituents.webp)
![Figure 6. Coffee cherr y cr oss section [9].](https://thumb-eu.123doks.com/thumbv2/123dokorg/7392099.97212/17.918.285.647.303.607/figure-coffee-cherr-y-cr-oss-section.webp)