ALMA MATER STUDIORUM - UNIVERSITÀ DI BOLOGNA
SCHOOL OF ENGINEERING AND ARCHITECTURE
INDUSTRIAL ENGINEERING DEPARTMENT
MASTER’S DEGREE IN ENERGY ENGINEERING
THESIS OF MASTER’S DEGREE
in
Environmental Technical Physics
Ventilated façades and thermal coatings compared:
environmental product declaration and energy certification in a
study case
CANDIDATE: SUPERVISOR:
Francesca Battistini Prof. Massimo Garai
CORRELATOR: Dr. Luca Barbaresi
Academic Year 2018/2019 Session III
ACKNOWLEDGMENT
I would like to express my deep and sincere thanks to my research supervisors Prof. Massimo Garai and Dr. Luca Barbaresi.
I would also like to express my gratitude to Aliva and to both Eng. Ruggiero De Giorgio and Eng. Jacopo Colonna for their support.
INDEX
INTRODUCTION
pg. 51. FRAMEWORK OF THE ENVIRONMENTAL PROBLEM AND
SUSTAINABILITY
pg. 71.1 ENERGY STRATEGIES OF EUROPEAN UNION pg. 7
1.2 LIFE CYCLE ASSESSMENT pg. 9 1.3 ENVIRONMENTAL PRODUCT DECLARATION pg. 11 1.4 DOUBLE SKIN FAÇADES pg. 14
2. ENVIRONMENTAL PRODUCT DECLARATION OF BUILDING
TECHNOLOGIES
pg. 20
2.1 CASE OF STUDY: HOSPITAL OF SAN BEDETTO DEL TRONTO pg. 21
2.2 ANALYSIS AND RESULTS pg. 56
3. ENVIRONMENTAL IMPACT RELATED TO THE ENERGY
MANAGEMENT OF A SEMPLIFIED BUILDING
pg. 67
4. COMPARISON OF THE ENVIRONMENTAL IMPACT RESULTS AND
DISCUSSION
CONCLUSION
pg. 85APPENDIX
PHASE CHANGE MATERIALS AND INTEREST IN BUILDING APPLICATIONS
pg. 87
INTRODUCTION
Since the construction sector is responsible for a large part of environmental pollution all around the world, the current situation is characterized by the need of rethinking the sustainability of existing buildings. My research meets the essence of combining studies of construction technologies from two different angles: the environmental impact of construction materials on one side and the energy consumption for the building management on the other side. This thesis is divided into four chapters. Chapter one discusses in more detail about the framework of the environmental problem in the building sector. Some alternative methods for sustainable redevelopment of buildings are described, such as the use of phase change materials (PCMs) and double skin façades (DSFs). Following the trend towards a more sustainable use of energy resources suggested by the European Union in 2020-2030-2050 Energy Strategies, both the life
cycle assessment (LCA) method and the environmental product declaration (EPD) eco-
label are outlined. LCA must be performed in adherence to ISO 14040 and 14044, while EPD is standardized by ISO 14025. Chapters two and three compare the building renovations from both the environmental and energy performances point of views. The environmental analyse is performed by using the EPD 2008 method (SimaPro 7 software), which provides results allocated in six impact categories: global warming, ozone layer depletion, photochemical oxidation, acidification, eutrophication and non- renewable resources depletion. The quantities of materials used for the restructuring are calculated considering a complex real case: the requalification of the hospital of San
Benedetto Del Tronto using different structures (thermal coatings or ventilated façades
with aluminum or ceramic cladding) and different insulating materials (polyurethane, rock wool or glass wool). Regarding the calculations of energy needs, a simpler and rapid alternative to the hospital building complexity is developed. The simplified but realistic study case is a condominium of four apartments. The amount of CO production
requalification option from the environmental point of view, considering both the environmental impact of the material constituting the external walls and the CO2
production for the managing of the heating system and the production of domestic hot water.
1. FRAMEWORK OF THE ENVIRONMENTAL PROBLEM
AND SUSTAINABILITY
1.1 ENERGY STRATEGIES OF EUROPEAN UNION
As commercial and residential buildings in Europe consume approximately 40% of primary energy and are responsible for 24% of greenhouse emissions [1],[2], improving the energy performance of buildings is a main opportunity to satisfy the energy challenge set by the European Union (EU) for 2020, 2030 and 2050.
2020 Energy Strategy of European Union [3]
• Reduction of greenhouse gas emissions by at least 20%.
• Increase in the share of renewable energy to at least 20% of consumption. • Achieving the 20% or more in energy saving.
• Fulfilment the 10% of share of renewable energy in transport sector by each member of EU.
The aims of these targets are combatting climate change and air pollution, decreasing the dependence of EU on foreign fossil fuels and keeping energy affordable for consumers and businesses. In the interest of meeting the goals regarding the building sector, the 2020 Energy Strategy set out investment into efficient buildings, energy labelling schemes, renovation of public buildings and eco-design requirements for energy intensive products as priorities.
2030 Energy Strategy of European Union [4] (it includes objectives from 2020 to 2030) • A 40% reduction in greenhouse gas emissions compared to 1990 levels.
• Completion of the internal energy market by achieving the existing electricity interconnection target of 10% by 2020, with a view to reaching 15% by 2030. 2030 Energy Strategy represents a moment of transition to the 2050 Energy Strategy and policies for 2030 focus on create a new governance system based on national plans for competitive, secure, and sustainable energy.
2050 Energy Strategy of European Union [5] describes the Energy Roadmap 2050: it
displays the transition of the energy system in ways that would be compatible with the 2050 greenhouse gas reduction target, while also increasing competitiveness and security of supply.
• Reduction of greenhouse gas emissions by 80-95%, when compared to 1990 levels, by 2050.
Routes set out by Energy Roadmap 2050 • Energy efficiency
• Renewable energy • Nuclear Energy
• Carbon capture and storage
PCMs are validated as an effective way to improve building’s energy management. Such materials can store a large amount of energy due to a transition of phase that is most frequently the solid/liquid one. This can enhance the building thermal mass and thus leads to energy efficiency and energy savings meeting European targets. As the low replacement rate of existing buildings with new ones, the energy retrofitting of the existing building stock is of outmost importance to reach the EU objectives and promote energy efficiency and environmental sustainability. To move away from the linear economic model of ‘take, make, and waste’ and towards the circular economy of resource efficiency, EU created a voluntary framework to improve the sustainability of buildings
1.2 LIFE CYCLE ASSESSMENT
Life Cycle Assessment (LCA) is an analytical tool used to quantify and interpret the
environmental flows to and from the environment, over the life cycle of a product or process; for this reason, it is also called “cradle-to-grave” analysis. It must be performed in adherence to the International Organization for Standardization (ISO) 14040 and 14044 series of standards. Overall, LCA is a technique for assessing the potential environmental aspects associated with a product (or service), by [6]:
1. Defining goals and scoping: identifying the LCA's purpose, the expected products of the study and determining the boundaries (what is and is not included in the analysis). The scope depends on the topic under investigation, as well as the planned use of the generated results. The goal and scope definition phase also requires the definition of the system boundaries, the functional unit, the impact categories to be investigated, as well as the relevant scenario to be developed.
2. Specifying Life-cycle inventory: compiling an inventory of inputs and outputs,
quantifying both the energy and raw material inputs and environmental releases associated with each stage of production. This phase involves the collection of all necessary for the calculation of the environmental impact data, which can be retrieved from relevant studies, industrial, governmental and public databases, scientific publications and from established local and global databases of the employed LCA tool.
3. Estimating impact analysis: evaluating the potential environmental impacts (influence on human health included) associated with inputs and outputs quantified in the inventory and mentioned in the previous step. The object of this phase is to provide additional information for the definition and understanding of
4. Outlining improvement analysis: interpreting the results in relation to the objectives of the study and evaluating opportunities to reduce energy, material inputs or environmental impacts at each stage of the product lifecycle. In this phase the results of the analysis are summarized and discussed as a basis of conclusions, recommendations and decision-making in conformity with the initial goal and scope definition phase.
Calculations on Carbon footprint of products (CFPs) are included in the LCA because it assesses the amount of greenhouse gasses (GHG) emitted and removed from cradle to grave.
1.3 ENVIRONMENTAL PRODUCT DECLARATION
Generally, the use of thermal insulation materials in buildings has both economic and ecological consequences because it reduces energy demand for heat in the use phase of the building. As a result, due to the reduced energy consumption, both the environmental load and the cost of heating decrease. However, it is necessary to be aware that the production and the installation of the thermal insulation itself result in certain economic costs which also increase the environmental load. LCA methodologies were in the first instance developed to create decision support tools for distinguishing between products, product systems, or services on environmental grounds. During the development of the methodology, several related applications emerged, including its use as basis to communicate the overall environmental performance of the products to stakeholders. An
Environmental Product Declaration (EPD) is a label standardized by the International Standards Organization (ISO 14025) and LCA-based tool to communicate the
environmental performance of a product. The purpose of an EPD in the construction sector is to provide the basis for assessing buildings which cause less stress to the environment; it also provides information on emissions to indoor air, soil and water during the use stage of the building. Based on EN 15804, there are three types of EPD according to the LCA information they cover:
• “cradle to gate” EPD covers raw material supply, transport, manufacturing and associated processes.
• “cradle to gate with options” EPD covers product stage and selected further life cycle stages.
• “cradle to grave” EPD covers product stage, installation into the building, use and maintenance, replacement, demolition, waste processing for re-use, recovery, recycling and disposal.
As already mentioned, an EPD is a certified Environmental Product Declaration (ISO type III declaration), which reports environmental data over the life cycle of products in accordance with the International Standard ISO 14025. It allows to quantify environmental information on the life cycle of a product and to enable comparisons between products fulfilling the same function (Bovea et al.) [7]. In particular, the European Standard EN 15804 defines EPD related to the construction sector. There are six default impact categories to use in an EPD: global warming, ozone layer depletion, photochemical oxidation, acidification, eutrophication and non-renewable depletion.
• Global Warming Potential (GWP100) [kg CO2 eq.] expresses the contribution to
the greenhouse effect of a greenhouse gas up to a specific time horizon, relative to carbon dioxide (CO2). Therefore, the GWPCO2 is equal to 1. It gives a measure
of how much of a given mass of a chemical substance contributes to global warming over a given period. The formula is as follows:
where TH stands for “time horizon”, ax is the “radiative efficiency” due to a unit increase in atmospheric abundance of the substance, x(t) is the time-dependent decay in abundance of the substance following an instantaneous release of it at t=0; in denominator there are the same quantities relative to CO2. It is calculated
for each different greenhouse gas (GHG) which are: CO2, N2O, CH4 and volatile
organic compounds (VOCs). As already said, GWP is expressed as CO2
equivalent.
• Ozone Depletion Potential (ODP) [kg CFC-11 eq.] indicates the decomposition of ozone (O3) molecules, present in the upper atmosphere and working as a shield
against the UVB emitted by the sun, due to the release of pollutants contained in chemical products. The reference is trichlorofluoromethane (CFC-11); therefore ODPCFC-11 is equal to 1.
and waters; AP classification factors are mostly based on the contributions of SO2,
NOx, HCl, NH3 and HF and expressed as SO2 equivalent.
• Eutrophication Potential (EP) [kg PO43- eq.] indicates the pollution state of
aquatic ecosystems in which the over-fertilization of water and soil has turned into an increased growth of biomass; it is calculated in kg based on a weighted sum of the emission of nitrogen and phosphorus derivatives such as N2, NOx, NH4+,
PO43−, P and chemical oxygen demand. The classification factors for EP are
expressed as phosphate equivalents (PO43-).
• Non-Renewable Depletion Potential or Abiotic Depletion [kg Sb eq.] is obtained for fossil fuels, metals and minerals by dividing the quantity of resource used by the estimated total world reserves of that resource. It is expressed as antimony (Sb) equivalent.
1.4 DOUBLE SKIN FAÇADES
Recently, the interest in double skin façades has increased because of esthetic reasons and for its use as passive system to save energy. The drivers behind the decision to adopt double skin façades technologies, in both new and existing buildings, range from aesthetic reasons to more technical ones like providing thermal comfort through passive cooling/heating, energy saving and reduction of greenhouse gas (GHG) emissions.
Double skin façade (DSF) is a hybrid system of building consisting of an external glazed
skin and the actual building façade, which represents the inner skin. The two layers are separated by an air cavity which has fixed or controllable inlets and outlets through incorporate vents; the ventilation of the cavity can be natural, fan supported or mechanical. The intermediate space may or may not incorporate fixed or controllable shading devices (Pomponi et al) [8].
Key DSFs parameters are (Figure 1) [8]:
• spatial configuration (box windows (BW), corridor (C), shaft box (SB) and multi-
storey (MS)),
• cavity width (a narrow cavity, width up to 40 cm, may significantly influence air flow and air velocity, while a wide cavity, width more of 40 cm, often implies a higher amount of construction materials which increase the embodied energy of DSF),
• ventilation (natural, fan supported, mechanical),
• airflow (supply air (SA), exhaust air (EA), air buffer (AB), external air curtain (EAC), internal air curtain (IAC)).
Building’s parameters are: • orientation,
• Pressure difference caused directly by wind action: when wind hits a building, the windward side is characterized by a positive pressure which pushes the air into or against the building, the leeward side has a negative pressure which results in a suction of the air out or away from the building.
• Pressure difference caused by thermal buoyancy: it happens when the air density changes due to a temperature change; more specifically, hot air rises and cold air sinks.
A specific DSF is a unique combination of several factors, like the portioning of the cavity with its division and obstruction, the solar radiation and the way it is influenced by shading devices and their position within the cavity, the convection regimes and airflow resistance, the frictional resistance of the materials of the inner and the outer skins and the obstructions in the cavity and their correspond heat transfer coefficients, the cavity openings and vertical temperature gradient; hence the difficulty in achieving consistent and agreed figures on DSF energy performance.
1.4.1 EMBODIED ENERGY OF DSFs
Embodied energy is the energy associated with the manufacturing of a product or services in a cradle to grave approach. It includes energy used for extracting and processing of raw materials, manufacturing of construction materials, transportation, distribution, assembly and construction. Pomponi et al. highlight that there are only few attempts addressing embodied energy figures and life cycle impacts in a holistic way [8]: the papers
of Wadel et al. [9] and Gracia et al. [10] are two examples. The former studied the application of the environmental strategies defined in project FB720 for designing a facade leading to a considerable reduction in environmental impacts throughout the life cycle [9]. The latter, Gracia et al. [10], evaluated the life cycle assessment (LCA) of a DSF
1.4.2 OPERATIONAL ENERGY OF DSFs
Operational energy is the energy required during the entire service life of a structure such as lighting, heating, cooling, and ventilating systems, running the equipment and appliances. Heating, cooling, lightening and ventilation are normally influenced by a building façade performance. In the interest of understanding the maximum energy saving potential of the DSF, the results are presented for the “best” case scenario.
Heating
The improvement in building sector have high potential in energy demand reduction and in energy savings. The use of the double skin façades has become more and more popular in the building sector and the most widely mentioned supporting arguments is the reduction of heating loads. The mechanism consists of the solar energy passing through the glass façade and transforming into heat. The heat warms up the air in the cavity and creates convectional airflows patterns (air buffer in Figure 1): this process reduces heat losses through the inner skin of the building [8]. All the heat transfer mechanisms and fluid
dynamic phenomena are shown in Figure 2. If the quality of the air is satisfactory and an internal air curtain is present, the warmer air in the cavity can be supplied in indoor spaces (supply air and internal air curtain visible in Figure 1).
Figure 2. Heat transfer mechanisms and fluid dynamic phenomena in DSF [8].
In 2009, Baldinelli compared a DSF to a fully glazed single skin façade in Italy and observed a 65% reduction in heating loads [11]. Similar results have been achieved in the UK, when comparing a DSF to an advanced single skin [12].
Cooling
Ventilation
supply fresh and good quality air into the occupied spaces through the DSF, paying attention to design, inlet openings, inlet temperatures and other key parameters [8].
In order to properly understand the true environmental benefit, studies about the life cycle
assessment (LCA) of DSFs are urgently needed: having an overall holistic performance
of a DSF is only possible associating the operational energy savings to the related embodied energy figures. Recently, there has been a growing tendency to apply DSF in refurbishment, combining the operational energy savings with the reduction of environmental impacts related to demolition and reconstruction.
2. ENVIRONMENTAL PRODUCT DECLARATION OF
BUILDING TECHNOLOGIES
The aim of the thesis is to take into consideration the environmental impacts of different construction methods to redevelop the envelope of the building under study.
In this project, environmental impact results are obtained by using: • Software: SimaPro 7
• Database: Ecoinvent system and unit processes • Method: EPD (2008)
The environmental profile is divided into six impact categories as follows: global warming, ozone layer depletion, photochemical oxidation, acidification, eutrophication and non-renewable depletion.
2.1 CASE OF STUDY: HOSPITAL OF SAN BENEDETTO DEL
TRONTO
The “Madonna del Soccorso” hospital located in San Benedetto Del Tronto represents the case of study of this thesis. The building’s façades taken into consideration are D1, D2, D3, D4, D5, D6 and D7 as shown in Figures 3 and 4.
Façades’ surfaces excluding windows and other parts not subjected to future redevelopment (Table 1):
façade windows effective façade
area [m2] [m2] [m2] D1 822,19 179,11 643,08 D2 1038,79 215,53 823,26 D3 105,44 0,00 105,44 D4 60,42 14,93 45,49 D5 154,15 29,85 124,30 D6 31,06 0,00 31,06 D7 626,01 114,97 511,04 total 2838,05 554,38 2283,67
Table 1. Façades’ surfaces.
The purpose of this research is to calculate the environmental impact of this building in seven different redevelopment scenarios, regarding two different structures (thermal coating and ventilated façade) and three insulating materials (polyurethane, rock wool and glass wool):
• Case 1-thermal coating-polyurethane (insulation) • Case 1-ventilated façade-polyurethane (insulation) • Case 2-thermal coating-rock wool (insulation) • Case 2-thermal coating-glass wool (insulation) • Case 2-ventilated façade-rock wool (insulation) • Case 2-ventilated façade-glass wool (insulation) • Case 3-ventilated façade-porcelain tiles (cladding)
2.1.1 CASE 1-THERMAL COATING-POLYURETHANE (insulation)
In this case, the facades are covered with a polyurethane thermal coat; specifically, all external surfaces are clad on site using TermoK8 Slim (Ivas) as shown in Figure 5.
The following tables contain the quantities of materials necessary for the thermal coating of the façades and the windows’ outline (Tables 2 and 3).
D1 D2 D3 D4 D5 D6 D7 total
[m2] [m2] [m2] [m2] [m2] [m2] [m2] [m2]
643,08 823,26 105,44 45,49 124,30 31,06 511,04 2283,67
element material [kg/m2] [kg] [kg] [kg] [kg] [kg] [kg] [kg] [kg]
Klebocem adhesive cement 4,50 2893,87 3704,68 474,50 204,71 559,34 139,78 2299,67 10276,54
[kg/m3] thickness [m]
Insulation Stiferite polyurethane 35 0,089 3,12 2003,20 2564,46 328,46 141,70 387,19 96,76 1591,88 7113,65 [kg/el] [el/m2]
EJOT H3 wall anchor PVC 0,01337 6 0,08 51,59 66,04 8,46 3,65 9,97 2,49 41,00 183,20
Klebocem skim coat cement 4,50 2893,87 3704,68 474,50 204,71 559,34 139,78 2299,67 10276,54
[kg/m2] [el/m2]
Armatex C1 mesh glass fiber 0,15 1,1 0,17 106,11 135,84 17,40 7,51 20,51 5,13 84,32 376,81
RivatonePlus finish coat acrylic resin 3,00 1929,25 2469,78 316,33 136,47 372,89 93,19 1533,11 6851,02
Table 2. Façades’ thermal coating.
D1 D2 D2 D2 D3 D4 D5 D6 D7 D7
window height [m] 1,55 1,55 2,19 2,33 0,00 1,55 1,55 0,00 1,55 1,62 window base [m] 1,61 1,61 1,35 1,84 0,00 1,61 1,61 0,00 1,61 0,80 window depth [m] 0,30 0,30 0,30 0,30 0,00 0,30 0,30 0,00 0,30 0,30 window outline surface [m2] 1,89 1,89 2,12 2,50 0,00 1,89 1,89 0,00 1,89 1,45 # windows 72,00 82,00 1,00 2,00 0,00 6,00 12,00 0,00 41,00 10,00 total contour surface [m2] 136,30 155,23 2,12 5,01 0,00 11,36 22,72 0,00 77,61 14,52
element material [kg/m2] [kg] [kg] [kg] [kg] [kg] [kg] [kg] [kg] [kg] [kg] [kg]
Klebocem adhesive cement 5 681,48 776,13 10,62 25,04 0,00 56,79 113,58 0,00 388,07 72,60 1736,25 [kg/m3] thickness [m]
Insulation Stiferite polyurethane 35 0,03 1,05 143,11 162,99 2,23 5,26 0,00 11,93 23,85 0,00 81,49 15,25 196,37 [kg/el] [el/m2]
EJOT H3 wall anchor PVC 0,01337 6 0,08022 10,93 12,45 0,17 0,40 0,00 0,91 1,82 0,00 6,23 1,16 15,00 Klebocem skim coat cement 5 681,48 776,13 10,62 25,04 0,00 56,79 113,58 0,00 388,07 72,60 935,07
[kg/m2] [el/m2]
Armatex C1 mesh glass fiber 0,15 1,1 0,165 22,49 25,61 0,35 0,83 0,00 1,87 3,75 0,00 12,81 2,40 30,86 RivatonePlus finish coat acrylic resin 2,2 299,85 341,50 4,67 11,02 0,00 24,99 49,98 0,00 170,75 31,94 411,43
The total quantities of each material are summarized in Table 4 and graphed in Figure 6.
material total
[kg]
Klebocem cement 23224,39
Insulation Stiferite polyurethane 7310,01
EJOT H3 wall anchor PVC 198,20
Armatex C1 mesh glass fiber 407,66
RivatonePlus finish coat acrylic resin 7262,46
Table 4. Total quantities of each material for case1-thermal coating-polyurethane (insulation).
2.1.2 CASE 1-VENTILATED FAÇADE-POLYURETHANE (insulation)
In this case, the upgrading of the building consists of ventilated façade wall cladding using polyurethane as insulation and sheets of aluminium alloy as cladding. The figures below (Figures 7 and 8) display the Alucovering (Aliva) ventilated façade system and his construction elements.
Figure 7. Alucovering ventilated façade system (Aliva). [16]
The overall data on materials relating to each façade are reported; the material quantities are divided into three groups: structure, cladding and window outline (Tables from 5 to 11).
aluminum alloy steel PVC resin polyurethane
D1 structure [kg] [kg] [kg] [kg] [kg]
L bracket 471,15
anchor rod HIT-V M8 64,73
resin HIT-HY 170 8,53
thermostop 79,15
TL rivet 4,04
T mullion 483,58
D1 cladding
Alucovering cladding profile 6250,74
TL rivet 12,17
retaining clip 157,37
metal profile 42,68
insulating material 3151,09
EJOT H3 wall anchor 23,64
D1 windows
insulating material 143,11
EJOT H3 wall anchor 7,70
sheet metal 1407,47
TL rivet 1,30
anchor rod HIT-V M8 18,18
resin HIT-HY 170 2,40
Total 8830,49 82,91 110,50 10,93 3294,20
aluminum alloy steel PVC resin polyurethane
D2 structure [kg] [kg] [kg] [kg] [kg]
L bracket 621,87
anchor rod HIT-V M8 54,47
resin HIT-HY 170 11,23
thermostop 79,15
TL rivet 4,48
T mullion 638,13
D2 cladding
Alucovering cladding profile 8002,09
TL rivet 13,81
retaining clip 178,56
metal profile 51,49
insulating material 4033,97
EJOT H3 wall anchor 30,27
D2 windows
insulating material 170,48
EJOT H3 wall anchor 9,25
sheet metal 1671,68
TL rivet 1,54
anchor rod HIT-V M8 21,84
resin HIT-HY 170 2,88
Total 11183,64 76,31 118,67 14,11 4204,45
Table 6. Ventilated façade D2.
aluminum alloy steel PVC resin polyurethane
D3 structure [kg] [kg] [kg] [kg] [kg]
L bracket 48,6
anchor rod HIT-V M8 6,81696
resin HIT-HY 170 0,898791
thermostop 8,1648
TL rivet 0,324
T mullion 21,576
D3 cladding
Alucovering cladding profile 1024,8768
TL rivet 0,99
retaining clip 12,804
metal profile 4,6754
insulating material 516,656
EJOT H3 wall anchor 3,87677
aluminum alloy steel PVC resin polyurethane
D4 structure [kg] [kg] [kg] [kg] [kg]
L bracket 61,35
anchor rod HIT-V M8 8,46
resin HIT-HY 170 1,12
thermostop 10,31
TL rivet 0,51
T mullion 64,95
D4 cladding
Alucovering cladding profile 442,16
TL rivet 1,49
retaining clip 19,32
metal profile 2,68
insulating material 222,90
EJOT H3 wall anchor 1,67
D4 windows
insulating material 11,93
EJOT H3 wall anchor 0,64
sheet metal 117,29
TL rivet 0,11
anchor rod HIT-V M8 1,51
resin HIT-HY 170 0,20
Total 709,86 9,97 12,62 1,31 234,83
aluminum alloy steel PVC resin polyurethane
D5 structure [kg] [kg] [kg] [kg] [kg]
L bracket 160,14
anchor rod HIT-V M8 22,22
resin HIT-HY 170 2,93
thermostop 26,90
TL rivet 1,23
T mullion 155,78
D5 cladding
Alucovering cladding profile 1208,20
TL rivet 3,70
retaining clip 47,80
metal profile 6,83
insulating material 609,07
EJOT H3 wall anchor 4,57
D5 windows
insulating material 23,85
EJOT H3 wall anchor 1,28
sheet metal 234,58
TL rivet 0,22
anchor rod HIT-V M8 3,03
resin HIT-HY 170 0,40
Total 1818,47 25,25 32,76 3,33 632,92
Table 9. Ventilated façade D5.
aluminum alloy steel PVC resin polyurethane
D6 structure [kg] [kg] [kg] [kg] [kg]
L bracket 32,40
anchor rod HIT-V M8 4,54
resin HIT-HY 170 0,60
thermostop 5,44
TL rivet 0,22
T mullion 25,89
D6 cladding
Alucovering cladding profile 301,90
TL rivet 0,66
retaining clip 8,54
metal profile 1,38
insulating material 152,19
EJOT H3 wall anchor 1,14
Total 370,98 4,54 6,59 0,60 152,19
aluminum alloy steel PVC resin polyurethane
D7 structure [kg] [kg] [kg] [kg] [kg]
L bracket 578,97
anchor rod HIT-V M8 79,69
resin HIT-HY 170 8,53
thermostop 85,35
TL rivet 4,24
T mullion 621,97
D7 cladding
Alucovering cladding profile 4967,29
TL rivet 15,71
retaining clip 203,23
metal profile 27,92
insulating material 2504,09
EJOT H3 wall anchor 18,79
D7 windows
insulating material 96,74
EJOT H3 wall anchor 5,45
sheet metal 937,71
TL rivet 0,92
anchor rod HIT-V M8 12,88
resin HIT-HY 170 1534,08
Total 7357,97 92,57 109,60 1542,61 2600,83
The total quantities of each material are summarized in Table 12 and graphed in Figure 9.
façade aluminum alloy steel PVC resin polyurethane
D1 8830,49 82,91 110,50 10,93 3294,20 D2 11183,64 76,31 118,67 14,11 4204,45 D3 1113,85 6,82 12,04 0,90 516,66 D4 709,86 9,97 12,62 1,31 234,83 D5 1818,47 25,25 32,76 3,33 632,92 D6 370,98 4,54 6,59 0,60 152,19 D7 7357,97 92,57 109,60 1542,61 2600,83 total 31385,26 298,37 402,78 1573,80 11636,08
Table 12. Total quantities of each material for case1-ventilated façade-polyurethane (insulation).
2.1.3 CASE 2-THERMAL COATING-ROCK WOOL (insulation)
In this case, the facades are covered with a rock wall thermal coat; the thickness of the rock wool insulation is calculated in such a way as to obtain the thermal transmittance U [W/(m2 K)] of case 1-thermal coating-polyurethane (Table 13).
Thermal coating λ [W/(m K)] s [m] U [W/(m2 K)]
polyurethane 0,026 0,089 0,292
rock wool 0,034 0,116 0,292
Table 13. Thermal transmittance of the insulation.
The following tables contain the quantities of materials necessary for the thermal coating of the façades and the windows’ outline (Tables 14 and 15).
D1 D2 D3 D4 D5 D6 D7 total
[m2] [m2] [m2] [m2] [m2] [m2] [m2] [m2]
643,08 823,26 105,44 45,49 124,30 31,06 511,04 2283,67
element material [kg/m2] [kg] [kg] [kg] [kg] [kg] [kg] [kg] [kg]
Klebocem adhesive cement 4,5 2893,87 3704,68 474,50 204,71 559,34 139,78 2299,67 10276,54
[kg/m3] thickness [m]
Insulation rock wool 40 0,116 4,64 2983,90 3819,93 489,26 211,08 576,74 144,13 2371,22 10596,25
[kg/el] [el/m2]
EJOT H3 wall anchor PVC 0,01337 6 0,0802 51,59 66,04 8,46 3,65 9,97 2,49 41,00 183,20
Klebocem skim coat cement 4,5 2893,87 3704,68 474,50 204,71 559,34 139,78 2299,67 10276,54
[kg/m2] [el/m2]
Armatex C1 mesh glass fiber 0,15 1,1 0,165 106,11 135,84 17,40 7,51 20,51 5,13 84,32 376,81
RivatonePlus finish coat acrylic resin 3 1929,25 2469,78 316,33 136,47 372,89 93,19 1533,11 6851,02
D1 D2 D2 D2 D3 D4 D5 D6 D7 D7 window height [m] 1,55 1,55 2,19 2,33 0,00 1,55 1,55 0,00 1,55 1,62 window base [m] 1,61 1,61 1,35 1,84 0,00 1,61 1,61 0,00 1,61 0,80 window depth [m] 0,30 0,30 0,30 0,30 0,00 0,30 0,30 0,00 0,30 0,30 window otline surface [m2] 1,89 1,89 2,12 2,50 0,00 1,89 1,89 0,00 1,89 1,45 # windows 72,00 82,00 1,00 2,00 0,00 6,00 12,00 0,00 41,00 10,00 total contour surface [m2] 136,30 155,23 2,12 5,01 0,00 11,36 22,72 0,00 77,61 14,52 element material [kg/m2] [kg] [kg] [kg] [kg] [kg] [kg] [kg] [kg] [kg] [kg] [kg] Klebocem adhesive cement 5 681,48 776,13 10,62 25,04 0,00 56,79 113,58 0,00 388,07 72,60 1736,25
[kg/m3] thickness [m]
Insulation rock wool 40 0,04 1,6 218,07 248,36 3,40 8,01 0,00 18,17 36,35 0,00 124,18 23,23 299,22 [kg/el] [el/m2]
EJOT H3 wall anchor PVC 0,0134 6 0,08022 10,93 12,45 0,17 0,40 0,00 0,91 1,82 0,00 6,23 1,16 15,00 Klebocem skim coat cement 5 681,48 776,13 10,62 25,04 0,00 56,79 113,58 0,00 388,07 72,60 935,07
[kg/m2] [el/m2]
Armatex C1 mesh glass fiber 0,15 1,1 0,165 22,49 25,61 0,35 0,83 0,00 1,87 3,75 0,00 12,81 2,40 30,86 RivatonePlus finish coat acrylic resin 2,2 299,85 341,50 4,67 11,02 0,00 24,99 49,98 0,00 170,75 31,94 411,43 Table 15. Thermal coating for windows’ outline
The total quantities of each material are summarized in Table 16 and graphed in Figure 10.
.
Table 16. Total quantities of each material for case 2-thermal coating-rock wool (insulation).
Figure 10. Pie chart of the materials used in case 2-themal coating-rock wool (insulation).
material total
[kg]
Klebocem cement 23224,39
Insulation rock wool 10895,47
EJOT H3 wall anchor PVC 198,20
Armatex C1 mesh glass fiber 407,66
2.1.4 CASE 2-THERMAL COATING-GLASS WOOL (insulation)
In this case, the facades are covered with a glass wall thermal coat; the thickness of the glass wool insulation is calculated in such a way as to obtain the thermal transmittance U [W/(m2 K)] of case 1-thermal coating-polyurethane (Table 17).
Thermal coating λ [W/(m K)] s [m] U [W/(m2 K)]
polyurethane 0,026 0,089 0,292
glass wool 0,034 0,116 0,292
Table 17. Thermal transmittance of the insulation.
The following tables contain the quantities of materials necessary for the thermal coating of the façades and the windows’ outline (Tables 18 and 19).
D1 D2 D3 D4 D5 D6 D7 total
[m2] [m2] [m2] [m2] [m2] [m2] [m2] [m2]
643,08 823,26 105,44 45,49 124,30 31,06 511,04 2283,67
element material [kg/m2] [kg] [kg] [kg] [kg] [kg] [kg] [kg] [kg]
Klebocem adhesive cement 4,5 2893,87 3704,68 474,50 204,71 559,34 139,78 2299,67 10276,54
[kg/m3] thickness [m]
Insulation glass wool 16 0,116 1,856 1193,56 1527,97 195,70 84,43 230,70 57,65 948,49 4238,50
[kg/el] [el/m2]
EJOT H3 wall anchor PVC 0,01337 6 0,0802 51,59 66,04 8,46 3,65 9,97 2,49 41,00 183,20
Klebocem skim coat cement 4,5 2893,87 3704,68 474,50 204,71 559,34 139,78 2299,67 10276,54
[kg/m2] [el/m2]
Armatex C1 mesh glass fiber 0,15 1,1 0,165 106,11 135,84 17,40 7,51 20,51 5,13 84,32 376,81
RivatonePlus finish coat acrylic resin 3 1929,25 2469,78 316,33 136,47 372,89 93,19 1533,11 6851,02
D1 D2 D2 D2 D3 D4 D5 D6 D7 D7 window height [m] 1,55 1,55 2,19 2,33 0,00 1,55 1,55 0,00 1,55 1,62 window base [m] 1,61 1,61 1,35 1,84 0,00 1,61 1,61 0,00 1,61 0,80 window depth [m] 0,30 0,30 0,30 0,30 0,00 0,30 0,30 0,00 0,30 0,30 window outline surface [m2] 1,89 1,89 2,12 2,50 0,00 1,89 1,89 0,00 1,89 1,45 # windows 72,00 82,00 1,00 2,00 0,00 6,00 12,00 0,00 41,00 10,00 total contour surface [m2] 136,30 155,23 2,12 5,01 0,00 11,36 22,72 0,00 77,61 14,52 element material [kg/m2] [kg] [kg] [kg] [kg] [kg] [kg] [kg] [kg] [kg] [kg] Klebocem adhesive cement 5 681,48 776,13 10,62 25,04 0,00 56,79 113,58 0,00 388,07 72,60 1736,25
[kg/m3] thickness [m]
Insulation glass wool 16 0,04 0,64 87,23 99,34 1,36 3,21 0,00 7,27 14,54 0,00 49,67 9,29 119,69 [kg/cad] [el/m2]
EJOT H3 wall anchor PVC 0,01337 6 0,08022 10,93 12,45 0,17 0,40 0,00 0,91 1,82 0,00 6,23 1,16 15,00 Klebocem skim coat cement 5 681,48 776,13 10,62 25,04 0,00 56,79 113,58 0,00 388,07 72,60 935,07
[kg/m2] [el/m2]
Armatex C1 mesh glass fiber 0,15 1,1 0,165 22,49 25,61 0,35 0,83 0,00 1,87 3,75 0,00 12,81 2,40 30,86 RivatonePlus finish coat acrylic resin 2,2 299,85 341,50 4,67 11,02 0,00 24,99 49,98 0,00 170,75 31,94 411,43
The total quantities of each material are summarized in Table 20 and graphed in Figure 11.
material total
[kg]
Klebocem cement 23224,39
Insulation glass wool 4358,19
EJOT H3 wall anchor PVC 198,20
Armatex C1 mesh glass fiber 407,66
RivatonePlus finish coat acrylic resin 7262,46
Table 20. Total quantities of each material for case 2-thermal coating-rock wool (insulation).
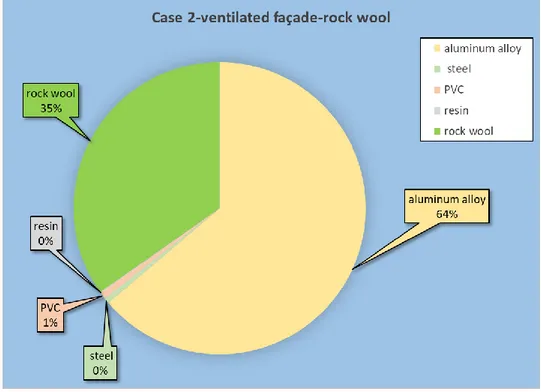
2.1.5 CASE 2-VENTILATED FAÇADE-ROCK WOOL (insulation)
In this case, the redevelopment of the building consists of ventilated façade wall cladding using rock wool as insulation and sheets of aluminium alloy as cladding. The thickness of the rock wool insulation is calculated in such a way as to obtain the thermal
transmittance U [W/(m2 K)] of case 1-ventilated façade-polyurethane (Table 22).
Thermal coating λ [W/(m K)] s [m] U [W/(m2 K)]
polyurethane 0,026 0,14 0,186
rock wool 0,034 0,183 0,186
The overall data on materials relating to each façade are reported; the material quantities are divided into three groups: structure, cladding and window outline (Tables from 23 to 29).
aluminum alloy steel PVC resin rock wool
D1 structure [kg] [kg] [kg] [kg] [kg]
L bracket 607,69
anchor rod HIT-V M8 64,73
resin HIT-HY 170 8,53
thermostop 79,15
TL rivet 4,04
T mullion 483,58
D1 cladding
Alucovering cladding profile 6250,74
TL rivet 12,17
retaining clip 157,37
metal profile 42,68
insulating material 4707,35
EJOT H3 wall anchor 23,64
D1 windows
insulating material 218,07
EJOT H3 wall anchor 7,70
sheet metal 1407,47
TL rivet 1,30
anchor rod HIT-V M8 18,18
resin HIT-HY 170 2,40
Total 8967,03 82,91 110,50 10,93 4925,42
aluminum alloy steel PVC resin rock wool
D2 structure [kg] [kg] [kg] [kg] [kg]
L bracket 802,17
anchor rod HIT-V M8 54,47
resin HIT-HY 170 11,23
thermostop 79,15
TL rivet 4,48
T mullion 638,13
D2 cladding
Alucovering cladding profile 8002,09
TL rivet 13,81
retaining clip 178,56
metal profile 51,49
insulating material 6026,26
EJOT H3 wall anchor 30,27
D2 windows
insulating material 259,78
EJOT H3 wall anchor 9,25
sheet metal 1671,68
TL rivet 1,54
anchor rod HIT-V M8 21,84
resin HIT-HY 170 2,88
Total 11363,94 76,31 118,67 14,11 6286,04
Table 24. Ventilated façade D2.
aluminum alloy steel PVC resin rock wool
D3 structure [kg] [kg] [kg] [kg] [kg]
L bracket 62,64
anchor rod HIT-V M8 6,82
resin HIT-HY 170 0,90
thermostop 8,16
TL rivet 0,32
T mullion 21,58
D3 cladding
Alucovering cladding profile 1024,88
TL rivet 0,99
retaining clip 12,80
metal profile 4,68
insulating material 771,82
aluminum alloy steel PVC resin rock wool
D4 structure [kg] [kg] [kg] [kg] [kg]
L bracket 75,16
anchor rod HIT-V M8 8,46
resin HIT-HY 170 1,12
thermostop 10,31
TL rivet 0,51
T mullion 64,95
D4 cladding
Alucovering cladding profile 442,16
TL rivet 1,49
retaining clip 19,32
metal profile 2,68
insulating material 332,99
EJOT H3 wall anchor 1,67
D4 windows
insulating material 18,17
EJOT H3 wall anchor 0,64
sheet metal 117,29
TL rivet 0,11
anchor rod HIT-V M8 1,51
resin HIT-HY 170 0,20
Total 723,67 9,97 12,62 1,31 351,16
Table 27. Ventilated façade D5.
aluminum alloy steel PVC resin rock wool
D6 structure [kg] [kg] [kg] [kg] [kg]
L bracket 41,76
anchor rod HIT-V M8 4,54
resin HIT-HY 170 0,60
thermostop 5,44
TL rivet 0,22
T mullion 25,89
D6 cladding
Alucovering cladding profile 301,90
TL rivet 0,66
retaining clip 8,54
metal profile 1,38
insulating material 227,36
EJOT H3 wall anchor 1,14
aluminum alloy steel PVC resin rock wool
D7 structure [kg] [kg] [kg] [kg] [kg]
L bracket 746,71
anchor rod HIT-V M8 79,69
resin HIT-HY 170 8,53
thermostop 85,35
TL rivet 4,24
T mullion 621,97
D7 cladding
Alucovering cladding profile 4967,29
TL rivet 15,71
retaining clip 203,23
metal profile 27,92
insulating material 3740,80
EJOT H3 wall anchor 18,79
D7 windows
insulating material 147,41
EJOT H3 wall anchor 5,45
sheet metal 937,71
TL rivet 0,92
anchor rod HIT-V M8 12,88
resin HIT-HY 170 1534,08
Total 7525,71 92,57 109,60 1542,61 3888,21
The total quantities of each material are summarized in Table 30 and graphed in Figure 12.
façade aluminum alloy steel PVC resin rock wool
D1 8967,03 82,91 110,50 10,93 4925,42 D2 11363,94 76,31 118,67 14,11 6286,04 D3 1127,89 6,82 12,04 0,90 771,82 D4 723,67 9,97 12,62 1,31 351,16 D5 1864,81 25,25 32,76 3,33 946,22 D6 380,34 4,54 6,59 0,60 227,36 D7 7525,71 82,91 110,50 10,93 3888,21 total 31953,39 288,71 403,68 42,11 17396,23
Table 30. Total quantities of each material for case 2-ventilated façade-rock wool (insulation).
2.1.6 CASE 2-VENTILATED FAÇADE-GLASS WOOL (insulation)
In this case the upgrading of the building consists of ventilated façade wall cladding using glass wool as insulation and sheets of aluminium alloy as cladding. The thickness of the glass wool insulation is calculated in such a way as to obtain the thermal transmittance U [W/(m2 K)] of case 1-ventilated façade-polyurethane (Table 31).
Thermal coating λ [W/(m K)] s [m] U [W/(m2 K)]
polyurethane 0,026 0,14 0,186
glass wool 0,034 0,183 0,186
The overall data on materials relating to each façade are reported; the material quantities are divided into three groups: structure, cladding and window outline (Tables from 32 to 38).
aluminum alloy steel PVC resin glass wool
D1 structure [kg] [kg] [kg] [kg] [kg]
L bracket 607,69
anchor rod HIT-V M8 64,73
resin HIT-HY 170 8,53
thermostop 79,15
TL rivet 4,04
T mullion 483,58
D1 cladding
Alucovering cladding profile 6250,74
TL rivet 12,17
retaining clip 157,37
metal profile 42,68
insulating material 1882,94
EJOT H3 wall anchor 23,64
D1 windows
insulating material 87,23
EJOT H3 wall anchor 7,70
sheet metal 1407,47
TL rivet 1,30
anchor rod HIT-V M8 18,18
resin HIT-HY 170 2,40
Total 8967,03 82,91 110,50 10,93 1970,17
aluminum alloy steel PVC resin glass wool
D2 structure [kg] [kg] [kg] [kg] [kg]
L bracket 802,17
anchor rod HIT-V M8 54,47
resin HIT-HY 170 11,23
thermostop 79,15
TL rivet 4,48
T mullion 638,13
D2 cladding
Alucovering cladding profile 8002,09
TL rivet 13,81
retaining clip 178,56
metal profile 51,49
insulating material 2410,51
EJOT H3 wall anchor 30,27
D2 windows
insulating material 103,91
EJOT H3 wall anchor 9,25
sheet metal 1671,68
TL rivet 1,54
anchor rod HIT-V M8 21,84
resin HIT-HY 170 2,88
Total 11363,94 76,31 118,67 14,11 2514,42
Table 33. Ventilated façade D2.
aluminum alloy steel PVC resin glass wool
D3 structure [kg] [kg] [kg] [kg] [kg]
L bracket 62,64
anchor rod HIT-V M8 6,82
resin HIT-HY 170 0,90
thermostop 8,16
TL rivet 0,32
T mullion 21,58
D3 cladding
Alucovering cladding profile 1024,88
TL rivet 0,99
retaining clip 12,80
metal profile 4,68
aluminum alloy steel PVC resin glass wool
D4 structure [kg] [kg] [kg] [kg] [kg]
L bracket 75,16
anchor rod HIT-V M8 8,46
resin HIT-HY 170 1,12
thermostop 10,31
TL rivet 0,51
T mullion 64,95
D4 cladding
Alucovering cladding profile 442,16
TL rivet 1,49
retaining clip 19,32
metal profile 2,68
insulating material 133,19
EJOT H3 wall anchor 1,67
D4 windows
insulating material 7,27
EJOT H3 wall anchor 0,64
sheet metal 117,29
TL rivet 0,11
anchor rod HIT-V M8 1,51
resin HIT-HY 170 0,20
Total 723,67 9,97 12,62 1,31 140,46
aluminum alloy steel PVC resin glass wool
D5 structure [kg] [kg] [kg] [kg] [kg]
L bracket 206,48
anchor rod HIT-V M8 22,22
resin HIT-HY 170 2,93
thermostop 26,90
TL rivet 1,23
T mullion 155,78
D5 cladding
Alucovering cladding profile 1208,20
TL rivet 3,70
retaining clip 47,80
metal profile 6,83
insulating material 363,95
EJOT H3 wall anchor 4,57
D5 windows
insulating material 14,54
EJOT H3 wall anchor 1,28
sheet metal 234,58
TL rivet 0,22
anchor rod HIT-V M8 3,03
resin HIT-HY 170 0,40
Total 1864,81 25,25 32,76 3,33 378,49
Table 36. Ventilated façade D5.
aluminum alloy steel PVC resin glass wool
D6 structure [kg] [kg] [kg] [kg] [kg]
L bracket 41,76
anchor rod HIT-V M8 4,54
resin HIT-HY 170 0,60
thermostop 5,44
TL rivet 0,22
T mullion 25,89
D6 cladding
Alucovering cladding profile 301,90
TL rivet 0,66
retaining clip 8,54
metal profile 1,38
insulating material 90,94
aluminum alloy steel PVC resin glass wool
D7 structure [kg] [kg] [kg] [kg] [kg]
L bracket 746,71
anchor rod HIT-V M8 79,69
resin HIT-HY 170 8,53
thermostop 85,35
TL rivet 4,24
T mullion 621,97
D7 cladding
Alucovering cladding profile 4967,29
TL rivet 15,71
retaining clip 203,23
metal profile 27,92
insulating material 1496,32
EJOT H3 wall anchor 18,79
D7 windows
insulating material 58,97
EJOT H3 wall anchor 5,45
sheet metal 937,71
TL rivet 0,92
anchor rod HIT-V M8 12,88
resin HIT-HY 170 1534,08
Total 7525,71 92,57 109,60 1542,61 1555,29
The total quantities of each material are summarized in Table 39 and graphed in Figure 13.
façade aluminum alloy steel PVC resin glass wool
D1 8967,03 82,91 110,50 10,93 1970,17 D2 11363,94 76,31 118,67 14,11 2514,42 D3 1127,89 6,82 12,04 0,90 308,73 D4 723,67 9,97 12,62 1,31 140,46 D5 1864,81 25,25 32,76 3,33 378,49 D6 380,34 4,54 6,59 0,60 90,94 D7 7525,71 82,91 110,50 10,93 1555,29 total 31953,39 288,71 403,68 42,11 6958,49
Table 39. Total quantities of each material for case 2-ventilated façade-glass wool (insulation).
2.1.7 CASE 3-VENTILATED FAÇADE-PORCELAIN TILES (cladding)
In this case, the redevelopment of the building consists of ventilated façade wall cladding using polyurethane as insulation and porcelain tiles as cladding. The figures below (Figures 14 and 15) display the Ali KL (Aliva) ventilated façade system and his construction elements, as well as the substructure system.
The following table (Table 40) contains the data about the construction materials for each façade. Tables about windows’ outline materials are not reported because they are the same as case 1-ventilated façade-polyurethane.
D1 [m2] D2 [m2] D3 [m2] D4 [m2] D5 [m2] D6 [m2] D7 [m2] total [m2] 643,08 823,26 105,44 45,49 124,30 31,06 511,04 2283,67 element material [m3] [kg/m3] [kg] Aref [m2] [kg/m2ref] [kg] [kg] [kg] [kg] [kg] [kg] [kg] total [kg] cladding porcelain 0,0072 2300 16,56 0,9248 17,906574 12451,78 15940,51 2041,66 880,82 2406,73 601,44 9895,05 44217,98 # [kg/el] [kg] Aref [m2] [kg/m2ref] [kg] [kg] [kg] [kg] [kg] [kg] [kg] total [kg] anchor rods HITVM8 steel 3 0,03156 0,095 0,9248 0,1023789 71,19 91,14 11,67 5,04 13,76 3,44 56,57 252,81
# [ml/el] [ml] Aref [m2] [kg/m2ref] [ml] [ml] [ml] [ml] [ml] [ml] [ml] total [ml] resin HIT-HY 170 resin 3 3,76 11,28 0,9248 12,197232 8481,65 10858,03 1390,70 599,98 1639,36 409,67 6740,11 30119,50 # [kg/el] [kg] Aref [m2] [kg/m2ref] [kg] [kg] [kg] [kg] [kg] [kg] [kg] total [kg] L bracket H150 aluminum alloy 1 0,45 0,45 0,9248 0,4865917 338,36 433,17 55,48 23,94 65,40 16,34 268,89 1201,58 L bracket H80 aluminum alloy 1 0,24 0,24 0,9248 0,2595156 180,46 231,02 29,59 12,77 34,88 8,72 143,41 640,84
# lenght [m] [kg/m] Aref [m2] [kg/m2ref] [kg] [kg] [kg] [kg] [kg] [kg] [kg] total [kg] T1 mullion aluminum alloy 1 1,36 0,6 0,9248 0,8823529 613,57 785,47 100,60 43,40 118,59 29,64 487,58 2178,86
# [kg/el] [kg] Aref [m2] [kg/m2ref] [kg] [kg] [kg] [kg] [kg] [kg] [kg] total [kg] rivet aluminum alloy 9 0,0015 0,014 0,9248 0,0145978 10,15 12,99 1,66 0,72 1,96 0,49 8,07 36,05 KL clip steel 2 0,287 0,574 0,9248 0,6206747 431,60 552,53 70,77 30,53 83,42 20,85 342,98 1532,68 KL gasket rubber 4 0,0148 0,059 0,9248 0,0640138 44,51 56,99 7,30 3,15 8,60 2,15 35,37 158,07
thickness [m] [kg/m3] [kg/m2] [kg] [kg] [kg] [kg] [kg] [kg] [kg] total [kg] Insulation Stiferite polyurethane 0,14 35 4,9 3151,10 4033,98 516,67 222,90 609,06 152,20 2504,09 11190,01 [kg/el] [el/m2] [kg/m2] [kg] [kg] [kg] [kg] [kg] [kg] [kg] total [kg] EJOT H3 wall anchor PVC 0,01337 2,75 0,0367675 23,64 30,27 3,88 1,67 4,57 1,14 18,79 83,97
The overall data on materials relating to each façade are reported in Table 41; the material quantities are divided into two groups: porcelain tiles, inclusive of their substructure, and windows’ outline. The whole material amount is graphed in Figure 16.
aluminum alloy steel PVC resin polyurethane porcelain rubber
[kg] [kg] [kg] [kg] [kg] [kg] [kg]
D1 porcelain tiles ALI KL 1142,541103 502,79328 23,6445 9,386385 3151,104823 12451,78 44,51361 D1 windows 1408,762886 18,17856 7,70112 2,396775 143,1108 0 0 D2 porcelain tiles ALI KL 1462,657571 30,269253 23,6445 12,01626 4033,979449 15940,51 56,98541 D2 windows 1673,226739 21,83952 9,25204 2,879459 170,47737 0 0 D3 porcelain tiles ALI KL 187,3373466 82,440761 3,87689 1,539044 516,6725424 2041,663 7,298698
D3 windows 0 0 0 0 0 0 0
D4 porcelain tiles ALI KL 80,82131031 35,566695 1,67257 0,663976 222,9035088 880,8166 3,148813 D4 windows 117,3969072 1,51488 0,64176 0,199731 11,9259 0 0 D5 porcelain tiles ALI KL 220,834533 97,181728 4,5701 1,814235 609,0570924 2406,726 8,603754 D5 windows 234,7938144 3,02976 1,28352 0,399463 23,8518 0 0 D6 porcelain tiles ALI KL 55,18615215 24,285539 1,14206 0,453374 152,2022707 601,4364 2,150063
D6 windows 0 0 0 0 0 0 0
D7 porcelain tiles ALI KL 907,9423853 399,5544 18,7896 7,459072 2504,086394 9895,048 35,3736 D7 windows 938,6319312 12,87648 5,45496 1534,08 96,73965 0 0 total 8430,13268 1229,5309 101,674 1573,288 11636,1116 44217,98 158,074
2.2 ANALYSIS AND RESULTS
Below (Figures from 17 to 23), the scenarios previously described are entered in SimaPro
7 software using Ecoinvent system and unit processes database.
Figure 17. Case 1-thermal coating-polyurethane in SimaPro.
Figure 19. Case 2-thermal coating-rock wool in SimaPro.
Figure 22. Case 2-ventilated façade-glass wool in SimaPro.
The analyse is performed by using EPD (2008) method which provides a set of indicators related to different impact categories describing the environmental performance of the products. This method is applied to the different construction and building materials considered as possible solutions to the redevelopment of the hospital of San Benedetto del Tronto. The graphs below (Figures 24 from to 31) show the results for each study case.
2.2.1 CASE 1-THERMAL COATING-POLYURETHANE (insulation)
The chart (Figure 24) indicates resin as the most responsible for environmental pollution, because it plays the major role in five out of six impact categories such global warming, photochemical oxidation, acidification, euthrophication and non-renewable depletion.
2.2.2 CASE 1-VENTILATED FAÇADE-POLYURETHANE (insulation)
The graph (Figure 25) shows at a glance that aluminium alloy reaches the highest percentages for each environmental impact indicators.
2.2.3 CASE 2-THERMAL COATING-ROCK WOOL (insulation)
The visual representation below (Figure 26) designs resin as the most important material from the environmental point of view, except for the second category; infact, rock wool has got the highest ozone depletion potential.
2.2.4 CASE 2-THERMAL COATING-GLASS WOOL (insulation)
The results provided by this chart (Figure 27) are like the previous ones because glass wool has got the highest ozone depletion potential while resin has got the biggest impact in all the other categories.
2.2.5 CASE 2-VENTILATED FAÇADE-ROCK WOOL (insulation)
As outlined by the diagram above (Figure 28), aluminium alloy approximately represents the 90% of the impact in each category, only followed by rock wool.
Figure 28. Impact categories case 2-ventilated façade-rock wool.
2.2.6 CASE 2-VENTILATED FAÇADE-GLASS WOOL (insulation)
This outline results (Figure 29) are the same to the previous ones; in fact aluminum alloy has got the most elevated impact in each class, followed by the insulating material.
2.2.7 CASE 3-VENTILATED FAÇADE-PORCELAIN TILES (cladding)
The results shown by the graph above (Figure 30) are the most diversified. Aluminum alloy represents the most impactful material for three classes, such global warming, acidification and eutrophication and reaches a potential slightly higher than polyurethane in the non-renewable depletion category. Ceramic has the biggest ozone depletion potential, while polyurethane is first material in photochemical oxidation potential.
2.2.8 COMPARATIVE ANALYSIS OF THE ENVIRONMENTAL IMPACT RESULTS FOR THERMAL COATINGS AND VENTILATED FAÇADES
As can be seen from the graph above (Figure 31), the different building redevelopments considered contribute in the same order to photochemical oxidation, acidification and eutrophication categories; from the most impactful to the least as follow: case 1-ventilated façade-polyurethane, case 2-ventilated façade-rock wool, case 2-ventilated façade-glass wool, case 2-ventilated façade-porcelain tiles, case 1-thermal coating- polyurethane, case 1-thermal coating-rock wool and case 1-thermal coating-glass wool. As for global warming, ozone depletion and non-renewable depletion, while thermal coatings with all kind of insulation materials have the lowest potentials, ventilated façades with porcelain cladding shows intermediate potentials between the other ventilated façades and thermal coatings. Glass wool as insulation in thermal coating seems to be the most sustainable building upgrading: case 2-thermal coating-glass wool has the lowest impact potentials on the environment, exception for ozone depletion category.
Figure 31. Comparative analysis of the environmental impact results for thermal coatings and ventilated façades.
3. ENVIRONMENTAL IMPACT RELATED TO THE
ENERGY MANAGEMENT OF A SEMPLIFIED BUILDING
In this chapter, the energy management of a building is discussed by using: • Software: Edilclima EC700
• Regulations: UNI 11300
The aim is to calculate the amount of CO2 related to the energy consume for the heating
management for each case previously mentioned (polyurethane, rock wool or glass wool thermal coats and ventilated façades with different kind of insulation and cladding). Given the structure complexity of the hospital of San Benedetto Del Tronto, a simpler and realistic building is considered in this section. The building analysed is based on an existing masonry building located in Bologna with four floors and as many apartments. The apartment floor plan is showed in Figure 32 and the 3D model of the condominium is represented in Figure 33.
The following tables (Tables 42 from to 55) describe the walls’ stratigraphy: exterior wall (case1_thermalcoating_polyurethane),
exterior wall (case1_ventilatedfaçade_polyurethane), exterior wall (case2_thermalcoating_rockwool), exterior wall (case2_thermalcoating_glasswool), exterior wall (case2_ventilatedfaçade_rockwool), exterior wall (case2_ventilatedfaçade_glasswool),
exterior wall (case3_ventilatedfaçade_porcelaintiles), interior wall, stair compartment divider, interior floor, ground floor, ceiling (top floor), interior ceiling, exterior roof.
Legend
s depth mm
Cond. thermal conductivity W/(mK)
R thermal resistance (m2K)/W
M.V. density kg/m3
C.T. specific heat capacity kJ/(kgK)
R.V. resistance to vapor diffusion -
N. Description s Cond. R M.V. C.T. R.V.
- Internal surface resistant - - 0,130 - - -
1 Cement and sand plaster 10,00 1,000 0,010 1800 1,00 10
2 Brick masonry external walls (um. 1.5%) 280,00 0,810 0,346 1800 1,00 7
3 Klebocem 4,00 0,470 0,009 1200 1,00 80
4 Rigid gas permeable polyurethane (80 mm < d <=
120 mm) 90,00 0,026 3,462 35 1,40 60
5 Klebocem 4,00 0,470 0,009 1200 1,00 80
N. Description s Cond. R M.V. C.T. R.V.
- Internal surface resistant - - 0,130 - - -
1 Cement and sand plaster 10,00 1,000 - 1800 1,00 10
2 Brick masonry external walls (um. 1.5%) 280,00 0,810 - 1800 1,00 7
3 Rigid gas permeable polyurethane (80 mm < d <=
120 mm) 140,00 0,026 - 35 1,40 60
4 Weakly ventilated interspace Av = 600 mm² / m 60,00 - - - - -
5 Aluminium 0,40 220,000 - 2700 0,88 -
- External surface resistant - - 0,060 - - -
Table 43. Stratigraphy case 1_ventilated façade_polyurethane.
N. Description s Cond. R M.V. C.T. R.V.
- Internal surface resistant - - 0,130 - - -
1 Cement and sand plaster 10,00 1,000 0,010 1800 1,00 10
2 Brick masonry external walls (um. 1.5%) 280,00 0,810 0,346 1800 1,00 7
3 Klebocem 4,00 0,470 0,009 1200 1,00 80
4 Rock wool panel 116,00 0,035 3,314 40 1,03 1
5 Klebocem 4,00 0,470 0,009 1200 1,00 80
- External surface resistant - - 0,060 - - -
Table 44. Stratigraphy case 2_thermal coating_rock wool.
N. Description s Cond. R M.V. C.T. R.V.
- Internal surface resistant - - 0,130 - - -
1 Cement and sand plaster 10,00 1,000 0,010 1800 1,00 10
2 Brick masonry external walls (um. 1.5%) 280,00 0,810 0,346 1800 1,00 7
3 Klebocem 4,00 0,470 0,009 1200 1,00 80
4 Glass wool panel 116,00 0,034 3,412 25 1,03 1
5 Klebocem 4,00 0,470 0,009 1200 1,00 80
- External surface resistant - - 0,060 - - -
N. Description s Cond. R M.V. C.T. R.V.
- Internal surface resistance - - 0,130 - - -
1 Cement and sand plaster 10,00 1,000 - 1800 1,00 10
2 Brick masonry external walls (um. 1.5%) 280,00 0,810 - 1800 1,00 7
3 Rock wool panel 183,00 0,035 - 40 1,03 1
4 Weakly ventilated interspace Av = 600 mm² / m 60,00 - - - - -
5 Aluminium 0,40 220,000 - 2700 0,88 -
- External surface resistance - - 0,060 - - -
Table 46. Stratigraphy case 2_ventilated façade_rock wool.
N. Description s Cond. R M.V. C.T. R.V.
- Internal surface resistance - - 0,130 - - -
1 Cement and sand plaster 10,00 1,000 - 1800 1,00 10
2 Brick masonry external walls (um. 1.5%) 280,00 0,810 - 1800 1,00 7
3 Glass wool panel 183,00 0,034 - 25 1,03 1
4 Weakly ventilated interspace Av = 600 mm² / m 60,00 - - - - -
5 Aluminium 0,40 220,000 - 2700 0,88 -
- External surface resistance - - 0,060 - - -
Table 47. Stratigraphy case 2_ventilated façade_glass wool.
N. Description s Cond. R M.V. C.T. R.V.
- Internal surface resistant - - 0,130 - - -
1 Cement and sand plaster 10,00 1,000 0,010 1800 1,00 10
2 Brick masonry external walls (um. 1.5%) 280,00 0,810 0,346 1800 1,00 7
3 Rigid gas permeable polyurethane (80 mm < d <=
120 mm) 140,00 0,026 5,385 35 1,40 60
4 Strongly ventilated interspace Av> 1500 mm² / m 60,00 - - - - -
5 Porcelain_tiles 0,70 1,460 - 2300 0,77 -
- External surface resistant - - 0,060 - - -
![Figure 2. Heat transfer mechanisms and fluid dynamic phenomena in DSF [8] .](https://thumb-eu.123doks.com/thumbv2/123dokorg/7382352.96619/18.893.127.769.125.630/figure-heat-transfer-mechanisms-fluid-dynamic-phenomena-dsf.webp)
![Figure 3. Façades D1 and D2 of the hospital of San Benedetto del Tronto. [13]](https://thumb-eu.123doks.com/thumbv2/123dokorg/7382352.96619/21.893.137.769.411.706/figure-façades-d-hospital-san-benedetto-del-tronto.webp)