ALMA MATER STUDIORUM - UNIVERSITÀ DI BOLOGNA
SCUOLA DI INGEGNERIA E ARCHITETTURA
DIPARTIMENTO DI INGEGNERIA INDUSTRIALE
CORSO DI LAUREA MAGISTRALE IN INGEGNERIA MECCANICA
TESI DI LAUREA
in
PROPULSORI TERMICI E IBRIDI PER AUTOVEICOLI M C.I.
Development, Testing and Potential Benefits of a Closed-Loop Combustion
Controller on a Turbocharged GDI Engine
CANDIDATO RELATORE
Nicola Silvestri Prof. Nicolò Cavina
CORRELATORI Prof. Davide Moro Prof. Enrico Corti Ing. Andrea Businaro Ing. Lucio Calogero Ing. Ruggero Cevolani Ing. Marco Cappa
Anno Accademico 2015/2016
3
Abstract
La riduzione dei consumi e delle emissioni inquinanti, accompagnata dalla domanda di veicoli sempre più performanti, costituisce una delle principali sfide nello sviluppo di nuovi sistemi di propulsione per l‟industria automobilistica. La soddisfazione di questi requisiti, imposti dalle sempre più stringenti normative e da scelte di marketing, comporta una costante ricerca di soluzioni volte a migliorare l‟efficienza dei motori a combustione interna.
Nei motori ad accensione comandata, la fase della combustione rappresenta uno dei principali parametri che influenzano l‟efficienza di conversione dell‟energia chimica del combustibile in lavoro meccanico.
La scarica elettrica generata dalla candela costituisce l‟attuazione principale per il controllo dell‟inizio del processo di combustione. Accensioni troppo ritardate non consentono di sfruttare l‟intera corsa di espansione del pistone, mentre accensioni troppo anticipate comportano un
aumento di pressione quando il pistone si trova ancora in fase di compressione, causando quindi una perdita di lavoro utile.
L‟istante in cui viene dato il comando di accensione, detto „anticipo‟, viene attualmente controllato in catena aperta per mezzo di mappe salvate nella centralina elettronica di controllo motore. E‟ richiesta quindi una complessa procedura di calibrazione a banco per definire l‟anticipo di accensione ottimo per ogni condizione di funzionamento del motore. La velocità di rotazione, il carico, il rapporto aria/combustibile, la temperatura dell‟aria e dell‟acqua, la fasatura delle valvole di scarico e aspirazione e l‟invecchiamento del motore sono solo alcune delle variabili che
influenzano il processo di combustione e che devono quindi essere considerate in fase di calibrazione delle mappe di anticipo.
Un‟alternativa è costituita da un sistema di controllo dell‟anticipo di accensione in catena chiusa su di una misura reale del processo di combustione, in modo da regolare l‟anticipo per produrre
sempre una corretta fasatura della combustione. Tuttavia, l‟implementazione di un sistema basato su di una misura di pressione all‟interno del cilindro, a causa di costi elevati e problemi di affidabilità dei sensori, non è per il momento perseguibile nell‟ambito di applicazioni industriali. Un‟alternativa al segnale di pressione è costituita dalla misura della corrente di ionizzazione all‟interno del
cilindro, effettuata usando la candela stessa come sensore: tutti i più recenti motori prodotti da Ferrari adottano infatti un‟apposita centralina e bobine di accensione per la misura della corrente di ionizzazione, attualmente impiegata per diagnosticare la presenza di combustioni detonanti.
4
Nell‟ambito di questo lavoro di tesi è stata condotta una campagna di misure sperimentali per quantificare il livello di correlazione tra alcune caratteristiche del segnale di corrente di
ionizzazione e gli indici impiegati per descrivere la fase di combustione derivati dal segnale di pressione.
La fase di implementazione ha portato allo sviluppo e alla sperimentazione di un innovativo controllo in catena chiusa dell‟anticipo di accensione. Il sistema è stato testato tramite un ambiente di simulazione appositamente sviluppato e successivamente implementato e collaudato su di un motore Ferrari sovralimentato, al banco prova ed in vettura. Il risultato principale è quindi un innovativo sistema di controllo dell‟anticipo, cilindro per cilindro, che è in grado di adattare continuamente l‟attuazione sia alla variazione dei parametri interni di funzionamento del motore, sia a quelli esterni.
5
Index
1 Introduction ... 9
2 Internal Combustion Engines for Automotive Applications... 10
2.1 Powertrain Development Trends ... 10
2.1.1 Carbon Dioxide Regulation ... 10
2.1.2 Pollutant Emissions Standards ... 14
2.1.3 Gasoline Direct Injection ... 17
2.1.4 Turbocharging and Downsizing ... 19
2.1.5 48 Volts Hybrid Systems and E-Boosting ... 20
2.2 Ferrari S.p.A. ... 22
2.2.1 Cars Produced ... 22
2.2.2 Engines Produced ... 24
2.3 Combustion in Spark-Ignition Engines ... 26
2.3.1 Physics of the Combustion Process ... 26
2.3.2 Pressure Signal ... 29
2.3.3 Heat Release ... 33
2.3.4 Combustion Phase Indicators ... 36
2.4 Engine Control Unit ... 38
2.4.1 Vehicle Torque Structure ... 38
2.4.2 Sensor and Actuators of a Modern Engine Management System ... 39
2.4.3 Ignition Angle Control Loop... 41
2.5 Ionization Current for Ignition Control ... 43
2.5.1 Ion Generating Process and Measurement ... 43
2.5.2 Ionization Current Feature ... 44
2.5.3 Ionization Current Applications for Ferrari ... 45
3 Correlation Analysis ... 49
3.1 Offline Processing of Raw Signals ... 49
6
3.1.2 Experimental Activity ... 50
3.1.3 Raw Signal Correlation Results ... 51
3.2 Real Time Processing of Ion Signal ... 56
3.2.1 Experimental Activity Requirements ... 56
3.2.2 Dynamic Spark Sweep ... 58
3.2.3 Conversion from Sample Based to Angle Based ... 60
3.2.4 Real Time Algorithm Performance ... 62
3.3 Other Combustion Features from Steady State Tests ... 63
4 Open Loop Combustion Phase Evaluation ... 69
4.1 Combustion Analysis ... 70
4.2 Evaluation of Possible Improvements in Fuel Economy ... 73
5 Closed Loop Combustion Control ... 77
5.1 Controller Structure and Feedback Selection ... 77
5.2 Offline Controller Performance Evaluation ... 80
5.2.1 Engine Simulation Environment ... 80
5.2.2 Offline Simulation Results ... 82
5.3 Real Time Combustion Controller with Pressure Signal Feedback ... 84
5.3.1 Controller Layout ... 84
5.3.2 Controller Algorithm... 85
5.3.3 First Set: Step Response ... 86
5.3.4 Second Set: Steady State Tests ... 88
5.3.5 Third Set: Transient Tests ... 95
5.3.6 Fourth Set: Vehicle Implementation ... 97
5.4 Real Time Combustion Controller with Ion Signal Feedback ... 100
6 Conclusions ... 103
9
1 Introduction
Performance improvement, CO2 reduction and pollutant emission minimization are some of the key challenges facing the development of new powertrains in the automotive industry. The need to meet these requirements drives the development of engines‟ efficiency.
In a Spark Ignition Internal Combustion Engine, one of the most effective factors influencing performance and efficiency is the combustion phasing. The electrical discharge in the spark plug is main actuation to control the beginning of the combustion process. Late ignition timing does not make use of the full stroke of the piston, and less work is produced. Early ignition timing produces a high pressure too early, when the piston is moving up, and work is lost.
This fundamental engine parameter is currently controlled in an open-loop by means of maps stored in the Engine Control Unit memory. A complex calibration procedure on the engine test bench is therefore required to define the optimal spark advance angle for every engine operating condition. Engine speed, load, air to fuel ratio, air/water temperature, valve timing and engine ageing are just some of the variables that influence the combustion process and must be considered when
“mapping” the ignition timing.
A better choice, thanks to the development of electronics, would be a spark advance controller based on a real time measurement of the combustion process, so that the ignition timing could be set to produce always the combustion phasing corresponding to the maximum efficiency. Nevertheless, the implementation of an in-cylinder pressure based controller is connected with high cost and poor pressure sensor reliability for industrial application. An alternative for the pressure signal is the measurement of the ionization current inside the cylinder, using the spark plug itself as sensor: all latest Ferrari production engines are equipped with the necessary hardware, since ionization current is already used to detect knock and misfire. An experimental campaign is performed to define the correlation level between features of the ionization current signal and the pressure based
combustion phase indicators.
The implementation phase led to the development and testing of a closed-loop spark advance controller, through a simulation environment and at the test bench on a Ferrari turbocharged engine. The main result is therefore an individual cylinder spark advance controller that is continuously able to adapt its actuation both to engine internal parameters‟ variations as well as to varying external conditions.
10
2 Internal Combustion Engines for Automotive Applications
Since their introduction, internal combustion engines have continued to improve as the knowledge of engine processes has increased, as new technologies became available, as demand for new types of engine arose, and as environmental constraints on engine use changed. Internal combustion engines, and the manufacturer that develop and produce them, play a dominant role in the fields of automotive industry. Aim of this Chapter is to provide an overview of the actual trends in
powertrain development, starting from the market requirements to latest technical innovations. Particular attention is given to the combustion phenomena in Spark Ignition engines, since the efficiency of the fuel's energy conversion process depends strongly on how combustion takes place and to the latest application of electronics in the engine management. Among the innovations, the ion current system for combustion control is presented, together with its applications on Ferrari‟s engines.
2.1 Powertrain Development Trends
Up to now, the technological development of the powertrain has taken place between two divergent demands. On the one hand, legislators have called for reduced emissions and, on the other,
customers for higher performance, comfort and safety.
In this section a summary of European Union regulations on emissions from light-duty vehicles is presented, focusing on the target for CO2 and pollutant emissions reduction and the need of improving testing procedures: the Worldwide Harmonized Light-duty Vehicles Testing Procedure (WLTP) for measuring CO2 and Real Driving Emissions (RDE) for measuring regulated pollutants under real-life conditions.
The last paragraphs provide a summary of the actual trend in powertrain development. Particular attention is given to the analysis of turbocharged and downsized gasoline engine, together with low-voltage hybrid systems. These measures help improving efficiency and performance of the
powertrain, while satisfying legal requirements for CO2 and pollutant emission standards.
2.1.1 Carbon Dioxide Regulation
Carbon dioxide is one of the main products of hydrocarbon combustion, together with water. It is measured in emission tests and it is strictly correlated with fuel consumption. Carbon dioxide cannot be defined as a pollutant as it is an inert gas and not directly harmful to humans or animals. However, it is the main anthropologic cause of the greenhouse effect that is leading to an increase in average Earth‟s atmospheric temperature and to dramatic climatic changes.
11
Light-duty vehicles are responsible for around 12% of total EU emissions of carbon dioxide: that‟s why EU legislation sets mandatory CO2 emission reduction targets for new cars.
The European legislation defines an individual annual target for each manufacturer, based on the average mass of all its new cars registered in the EU in a given year. From 2015, manufacturers must ensure that 100% of the new cars registered in the EU each year have average emissions that are below their respective targets. Only the fleet average is regulated, so manufacturers are still able to make vehicles with emissions above their indicative targets if these are offset by other vehicles which are below their indicative targets. In case manufacturer's average emission level is above the target set by the limit value curve, it will have to pay an excess emissions premium. The more a manufacturer goes above the target, the higher the premium.
Significant technical advancements have been made in recent years. The figures for Europe clearly illustrate this. Since 2007, CO2 emissions from cars in Europe have sunk by 18% [1], even though performance and vehicle weight have increased over the same period. As shown in Figure 2.1, emission standards are set to become stricter in all the world‟s major automotive markets. Europe leads the way here: Regulation (EC) N°443/2009 sets in 95 grams of CO2 per kilometer the fleet average to be achieved by all new cars in 2020, while the average emissions level of a new car sold in 2015 was already 119.6 grams of CO2per kilometer, significantly below the 2015 target of 130 grams of CO2 per kilometer.
12
Figure 2.1 - Comparison of global CO2 regulations for new passenger cars, normalized to NEDC [2].
Must be noticed that all CO2limits reported above refer to emissions measured on the New
European Driving Cycle (NEDC), in accordance with Regulation (EC) No 715/2007.
With regards to how these emission are measured, in 2014 the European Commission highlighted the need to amend the NEDC driving cycle to ensure its representativeness over real driving conditions and to avoid the underestimation of real CO2 emissions and fuel consumption. Working in this direction, the European Commission proceeded through the development of a Worldwide harmonized Light-vehicles Test Procedure (WLTP) [1].
In March 2016, WLTP was approved and will be implemented in September 2017, coinciding with the adoption of the updated EURO6d (European Emission Standards) regulation. Additionally, as part of the WLTP implementation in the EU, the CO2 targets defined for 2020 based on NEDC testing will need to be translated to WLTP equivalent values.
Table 1 quantifies the main descriptive parameters of the new WLTC (Worldwide Harmonized Light Vehicles Test Cycle) driving cycle compared to the NEDC cycle. The acronym WLTC is
13
used to specifically identify the test cycle only, while WLTP indicates the complete framework of the test procedure.
Table 1 - Descriptive parameters of the driving cycles NEDC (currently used for CO2 emissions measurement)
and WLTC [3]
The key elements that should be considered when evaluating CO2 emissions on WLTC instead of NEDC are a longer and more dynamic driving cycle, including a more flexible gear shift strategy for manual transmissions, a higher vehicle test mass and a lower engine temperature at test start.
Regarding the journey to fully implement WLTP, the phased approach adopted by the European Union can be summarized as follows:
Up to August 2017:
• NEDC testing will remain in place;
• Vehicle manufacturers will prepare for WLTP and in some cases already begin to publish WLTP figures.
September 2017 to December 2019:
14
New vehicles will be tested both using both NEDC and WLTP type approval procedures; The legally binding values for the CO2 monitoring will remain the NEDC based results; WLTP based results can be used for customer information (sales brochures and CO2
labeling);
As further focus is placed on WLTP results by various stakeholders, it is expected that national tax regulations will adapt to utilizing WLTP based CO2 values. Correspondingly vehicle manufacturers will optimize vehicle development for this test rather than NEDC.
From 2020 onwards:
New vehicles will be tested using WLTP type approval procedure only; CO2 emission targets will have to be met in the WLTP;
For this, it is necessary to translate the existing 95 g/km NEDC based target into an equivalent WLTP based target (expected to be about 100 g/km).
The Commission is currently preparing a proposal for future CO2emission targets that will
contribute to meeting the European Union's 2030 climate targets. The future CO2emission
standards will be defined on the basis of the emissions measured on the WLTP, with the expectation that the new test procedure will offer a more robust basis for defining the reductions expected and for ensuring that they will actually be delivered.
2.1.2 Pollutant Emissions Standards
Besides CO2 emission, European Union sets objectives for air pollutant emissions, in order to reduce harmful effects on human health. The main air quality pollutant emissions from internal combustion engines are:
carbon monoxide (CO);
oxides of nitrogen (NO and NO2);
un-burnt hydrocarbons (HC); particulate matter (PM).
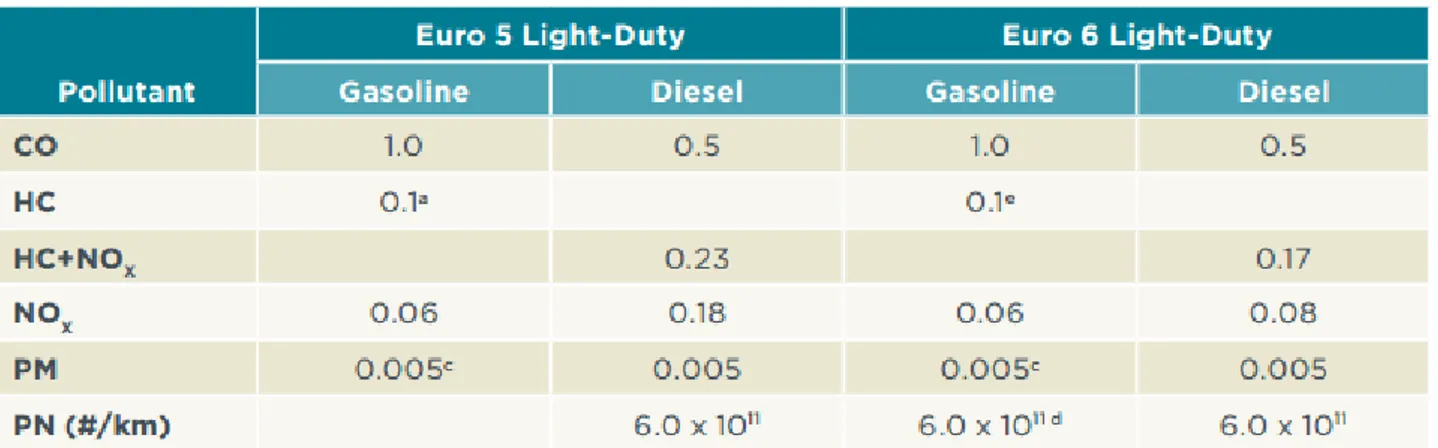
Emissions of these pollutants are regulated since 1991 by the "European Emission Standards". In Table 2, the light-duty vehicles Euro 6 emission standards, introduced in September 2014, are compared with the previous Euro 5 standards. Considering first the standards for diesel vehicles (see Table 2), Euro 6 is a significant advancement over Euro 5 with regard to NOX limits (56% reduction). On the other hand, the recent diffusion of gasoline direct injection (GDI) technology led
15
to the introduction of limits on particle number emissions also for gasoline vehicles (numerically the same as those for diesel cars).
Table 2 - The light-duty Euro 5 and Euro 6 vehicle emission standards on the New European Driving Cycle (NEDC). Pollutant emission are measured in g/km. [4]
The pre-defined light-duty vehicles measurement cycle for all the past Euro emissions standards and for Euro 6 as well, is the already mentioned New European Driving Cycle (NEDC).
Since the agreement of Regulation 715/2007, when Euro 6 limits where first announced, research has shown the NEDC to be a poor representation of real-world driving, with serious implications for emissions, particularly those of NOX from diesel cars.
Different studies ([5],[6]), through the use of a Portable Emissions Measurement Systems (PEMS), revealed how the large majority of passenger cars certified to the Euro 6 standard (in laboratory condition), have NOX emission levels several times above the regulated limit when driven under normal , „real world‟, condition. This problem was highlighted in the recent Volkswagen case. Thanks to the use of PEMS, on September 2015 the US EPA served a notice of violation on Volkswagen Group, alleging that many VW and Audi automobiles sold in the U.S had a "defeat device" in diesel engines that could detect when they were being tested, changing the performance accordingly to improve results. Nevertheless, systematic vehicle testing, for example by the German government (reported in Figure 2.2), confirms that high real-world NOX emissions are an industry-wide problem, not restricted to the confirmed illegal defeat devices present on some Volkswagen models.
16
Figure 2.2 - Overview of laboratory and on-road vehicle emissions test results by the German Ministry for Transport, April 2016 (lower emission level corresponds to NEDC laboratory test, upper level to max. on-road test result) [7].
To reduce this gap, member states meeting in the Technical Committee of Motor Vehicles (TCMV) in October 2015, have approved the use of Real Driving Emissions (RDE) tests to determine
whether a new car model is allowed to be put on the market.
It‟s important to highlight that the RDE procedure complements the current laboratory based procedure, and will be used to check if the vehicle emission levels of nitrogen oxides (NOx), and at a later stage also particle numbers (PN), measured during the laboratory test, are confirmed in real driving conditions.
Under Real Driving Emission, a car will be driven on public roads and over a wide range of different conditions. PEMS installed on the vehicle (Figure 2.3) will collect data to verify NOx emissions are „not to exceed‟ euro emission standards by a certain Conformity Factor.
17
Figure 2.3 – Portable Emission Measurement System (PEMS)
According to the agreed Real Driving Emission test procedure, car manufacturers must reduce the divergence in two steps:
Car manufacturers will have to bring down the discrepancy to a Conformity Factor of maximum 2.1 (110%) for new models by September 2017 (for all new vehicles by September 2019);
This discrepancy will be brought further down to a Factor of 1.5 (50%), taking account of technical margins of error, by January 2020 for all new models (by January 2021 for all new vehicles). As the technology improves, the conformity factor will be reduced further.
A third Real Driving Emission step is currently being prepared by the European Commission.
2.1.3 Gasoline Direct Injection
Among the measure for improving efficiency and performance of a spark ignition engine, Gasoline Direct Injection (GDI) has seen a rapid diffusion over the past years, often accompanied by other engine technologies such as turbocharging, supercharging and variable valve timing (VVT).
Previous fueling systems, from carburetors to throttle body fuel injection to Port Fuel Injection (PFI), all mixed the air and fuel before the mixture entered the cylinder. As shown in Figure 2.4, with Gasoline Direct Injection, fuel is injected directly into the cylinder during the intake phase, so that only air flows through the intake valves.
18
Figure 2.4 - Fuel injection system evolution [8]
Injected fuel evaporation creates a cooling effect, improving volumetric efficiency and reducing compression temperatures and, hence, knock (see Section 2.3). It also allows valve timings that promote scavenging of the cylinder during high-load operation, further reducing charge
temperatures while increasing trapped air mass. With Gasoline Direct Injection, the compression ratio in a turbocharged engine can be higher than with Port Fuel Injection and engine efficiency is improved.
Gasoline Direct Injection also enables stratified charge mode at partial loads: the idea is to deliver a mixture that is sufficiently rich for combustion near the spark plug and a very lean mixture and residual gases in the remainder of the cylinder. This can be made through multiple fuel injections, even during the compression phase. While running on stratified charge mode, the delivered power is no longer controlled by the quantity of admitted air, but by the quantity of gasoline injected, as in a Diesel engine. The engine could be operated un-throttled like the Diesel engine, reducing pumping work and increasing efficiency. The main drawback of lean-burning is that a complex catalytic converter system is required to reduce NOx emissions. Lean-burn engines do not work well with the 3-way catalytic converter, which requires stoichiometric mixtures to promote oxidation and
reduction reactions.
Port Fuel Injection engines do have some limited advantages over GDI engines due to the fact that the intake system acts as a pre-vaporizing chamber. When fuel is injected directly into the engine cylinder, the time available for mixture preparation is reduced significantly. As a result, the atomization of the fuel spray must be fine enough to permit fuel evaporation in the limited time available between injection and ignition. Fuel droplets that are not evaporated are very likely to participate in diffusion burning, or to exit the engine as particulate emissions (PN).
19
To summarize, Gasoline Direct Injection improved performance depends on [9]:
higher compression ratio (charge cooling with injection during induction); higher knock limit (charge cooling with injection during induction);
increased volumetric efficiency (charge cooling with injection during induction); Improved transient response (fuel is injected later)
less pumping loss (un-throttled, stratified mode); less heat losses (un-throttled, stratified mode); while, the critical points of a GDI engine are:
complexity of the control and injection technologies required (i.e. cost);
difficulty in controlling the stratified charge combustion over the required operating range; increased particulate emissions;
high local NOx production under part-load, stratified charge operation;
three-way catalysis cannot be efficiently utilized during stratified charge operation.
2.1.4 Turbocharging and Downsizing
Turbochargers increase engine power by increasing intake charge air density, thus increasing the air mass flow to the engine. This extra air allows introducing additional fuel (to maintain
stoichiometric conditions desirable for modern exhaust after treatment technology). Consequently, the direct impact of turbocharging is to increase engine power and fuel flow for a given engine displacement volume.
Higher output results in higher combustion pressures which increase the temperature of the unburned gases being compressed ahead of the flame front, and this leads to increased knock (see Paragraph 2.3). Historically, manufacturers reduced compression ratios in turbocharged engines to control knock and detonation, leading to efficiency reductions. Thus, until recently, turbochargers were used primarily to increase performance in sport vehicles.
Today, turbochargers are used to reduce fuel consumption indirectly, by enabling engine
downsizing. The increased specific power provided by a turbocharger allows the entire engine to be downsized while maintaining the same level of performance. At a constant vehicle demand for performance, a smaller displacement engine operates at higher loads, resulting in lower throttling losses under normal driving conditions. Smaller engines typically also have lower friction losses due to smaller bearings and cylinders.
20
2.1.5 48 Volts Hybrid Systems and E-Boosting
Perhaps one of the most significant advancement in downsized turbocharged engines comes from the recent trend of powertrain electrification. As shown in Figure 2.5, powertrain electrification comprises a wide spectrum of applications, ranging from micro-hybrids over mild and full hybrids up to pure electric vehicle.
Figure 2.5 – Different electrification levels for light-duty vehicle’s powertrain.
Manufacturers and suppliers are searching for the right level of hybridization with the best payback for the consumer. In the last years, there has been an important trend in developing of 48 Volts Mild Hybrid system: compared to a full-hybrid, they're significantly cheaper thanks to the lack of a large electric motor and battery, and most importantly, they can be added to traditional powertrains relatively easily by manufacturers. They might also be used by some manufacturers as stepping stones to higher-voltage systems, while the costs of all hybrid systems come down.
With a nominal 12V on board grid, the peak power from a motor-generator is limited at about 3kW, due to high current losses, which constrains the maximum torque available and, of equal
importance, any kinetic and thermal energy recovery. With a nominal 48 Volts on-board grid, the industry has access to approximately 12.5 kW electrical power, which makes all the difference to
21
powertrain efficiency and performance, while the DC voltage remains well below the safety critical 60 Volt level.
Unlike more expensive full hybrids, 48 Volts systems are not designed to propel the vehicle, but higher voltage and greater energy storage capacity, compared to 12 Volts systems, allows
regenerative braking energy and permits accessory operation with the engine off. Mild hybrids also enable more robust start-stop systems, in particular start-stop coasting (or sailing): here the engine is shut off at high speed, and the 48 Volts system maintains power to all electronics and electrical devices [10]. Some of the possible advantages in an urban driving cycle through the employment of a mild-hybrid system are summarized in Figure 2.6.
Figure 2.6 - Advanced 48 Volts functionalities and their application in urban driving environment [11].
New concepts using 48 Volts hybrid systems can also be used to provide power for small electric compressor motors within or without a turbocharger. These either directly boost the engine, or spin up the turbocharger to greatly reduce turbo lag. Improved boosting and reduced lag increase the ability to downsize and downspeed the engine. E-Boost allows the use of larger turbines with lower backpressure, for a direct reduction in brake specific fuel consumption in addition to the benefits from engine downspeeding and downsizing.
22
2.2 Ferrari S.p.A.
This work of thesis is based on an activity carried on entirely at the Powertrain Design & Development department of Ferrari S.p.A., the well-known Italian auto manufacturer based in Maranello (MO). This chapter gives a brief introduction to the factory and to the cars produced and highlights the main technological features adopted by latest Ferrari engines.
2.2.1 Cars Produced
Ferrari produces high performance and luxurious sports cars and it is the most successful racing team in Formula One‟s history. Its brand has become over the years the most powerful around the world. It was founded by Enzo Ferrari initially in 1929 in Modena as the Scuderia Ferrari, initially to race cars produced by Alfa Romeo, though by 1947 Ferrari had begun building its own cars. Nowadays, Ferrari produces a family of road cars that share more than 60 years of expertise in engineering and driving performance.
All current Ferrari models are equipped with a gasoline engine, V8 or V12. Models from the V8 line include the 488 GTB, the 488 Spider and the California T. The V12 line includes the latest
GTC4Lusso (which is produced also with the V8 engine), the F12 Berlinetta, its “special” version F12TDF and the limited production hypercar LaFerrari, which is powered by an hybrid powertrain.
23
24
2.2.2 Engines Produced
Ferrari cars are powered either by a V8 engine, either by a V12. All V8‟s adopted by Ferrari nowadays belong to the F154 family (Figure 2.8, on the left), composed by twin-turbocharged, direct injected 90° V8 petrol engines designed and produced by Ferrari since 2013, while the V12 engines belong to the F140 family (Figure 2.8, on the right), composed by naturally aspirated, direct injected 65° V12 petrol engines.
Figure 2.8 – Ferrari F154CB engine (488GTB) and F140FC (F12 Berlinetta).
The top performance V12 engine is the mid-rear mounted F140 in the LaFerrari. With a 6262cc capacity, it produces 800 CV @ 9000 rpm and 700 Nm of torque @ 6,750 rpm, while the top performance V8 is the mid-rear mounted F154CB adopted by the 488 GTB, with a 3902cc capacity and 670 CV @ 8000 rpm and 760 Nm of torque [12].
The main technical feature of the F154 engine, elected International Engine of the Year 2016, comprehend: 200 bar gasoline direct injection, ion current measurement for combustion and ignition control (see Paragraph 2.5), variable displacement oil pump and dry sump lubrication, flat plane crankshaft and continuous variable valve timing system. The turbochargers, produced by IHI, feature a twin-scroll turbine, for more power extraction from exhaust pressure pulses, low-inertia titanium-aluminum turbine wheel and ball bearing to reduce friction, delivering the best engine‟s response in its class (Figure 2.9).
25
26
2.3 Combustion in Spark-Ignition Engines
The combustion process releases the fuel's energy within the engine cylinder for conversion into useful work. What fraction of the fuel's energy is converted depends strongly on how combustion takes place. The Spark Ignition engine combustion processes therefore influence essentially all aspects of engine behavior. This section focuses on the combustion phenomena and on the main engine parameters adopted to evaluate its quality.
2.3.1 Physics of the Combustion Process
In a conventional Spark-Ignition engine, fuel and oxidizer are mixed together prior to their ignition. The combustion process is thus defined "premixed". Under normal operating conditions,
combustion is initiated towards the end of the compression stroke through an electric discharge provided by the spark plug. The corresponding angular position is called “spark advance" and it‟s measured in degrees Before Top Dead Center (°BTDC).
The high-temperature plasma kernel created by the spark develops into a self-sustaining and propagating flame front, a reaction sheet where the exothermic combustion chemical reactions occur (Figure 2.10), so that fresh mixture and burnt products are sharply separated. The reaction zone propagates, since heat is transferred from reaction zone to fresh air mixture, which heats up, thus starting auto ignition.
27
The flame development and subsequent propagation vary cycle by-cycle. This is because flame growth depends on local mixture motion and composition. These quantities vary in successive cycles in any given cylinder and may vary cylinder-to-cylinder. Especially significant are mixture motion and composition in the vicinity of the spark plug at the time of spark discharge, since these govern the early stages of flame development. Cycle-by-cycle and cylinder-to-cylinder variations in combustion are important because the extreme cycles limit the operating regime of the engine.
The process described so far, in which the spark-ignited flame moves steadily across the combustion chamber until the charge is fully consumed, represents a normal combustion event.
However, several factors prevent this normal combustion process from occurring. Knock is the most important abnormal combustion phenomenon. Its name comes from the noise that results from the auto ignition of a portion of the fuel, air, residual gas mixture ahead of the advancing flame. As the flame propagates across the combustion chamber, the unburned mixture ahead of the flame is compressed, causing its pressure, temperature and density to increase. The unburned mixture may then auto ignite before the arrival of the flame front: when this abnormal combustion process takes place, an extremely rapid release of the chemical energy occurs, causing very high local pressures and the propagation of high frequency pressure waves of substantial amplitude across the
combustion chamber, that produce the sharp metallic noise called "knock". Figure 2.11 shows the characteristics of a knocking combustion and how these are changing, from ignition up to the formation of a standing wave.
28
Figure 2.11 - Flame development, auto ignition and pressure wave propagation through the combustion chamber during a knocking combustion event [15].
Following ignition, the propagation of the primary flame front (Figure 2.11a and Figure 2.11b, border line between light and dark cylinder areas) takes place starting from the spark plug. The part of the mixture that remains unburned is called the "end gas zone", within which temperature
gradients may exist and in which spontaneous ignition is liable to occur (Figure 2.11c). In the event of spontaneous ignition, the pressure in the ignition volume may not distribute fast enough over the whole combustion chamber, leading to the formation of a shock wave which propagates at the speed of sound through the surrounding un-burnt and already burnt mixture (Figure 2.11c, 2.11d). This
29
shock wave is reflected off the walls of the combustion chamber and moves around the combustion chamber again in the opposite direction, similar to an echo.
2.3.2 Pressure Signal
Combustion rate information can be obtained from in-cylinder pressure data. Cylinder pressure changes, as function of the crank angle, results from cylinder volume change, combustion process, heat transfer to chamber walls, flow into and out of crevice regions and leakage.
Cylinder pressure is usually measured with piezoelectric pressure transducers. This type of transducer contains a quartz crystal. One end of the crystal is exposed through a diaphragm to the cylinder pressure. As the cylinder pressure increases, the crystal is compressed and generates an electric charge which is proportional to the pressure. The piezoelectric pressure signal is
synchronized to the crank angle position through an incremental encoder.
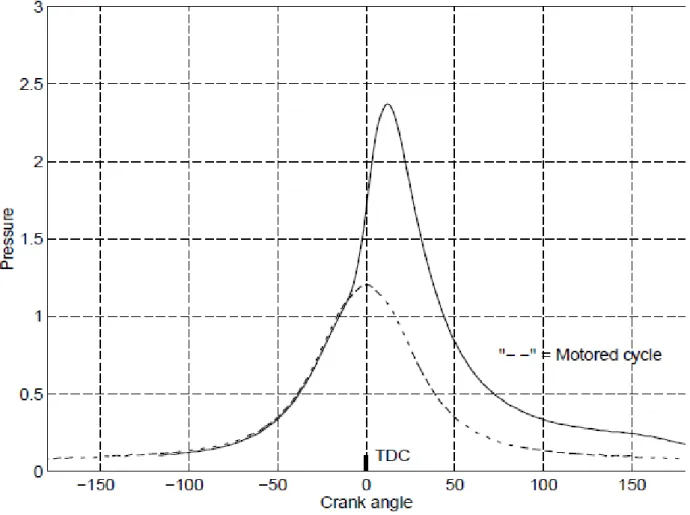
At the end of the compression phase, the spark ignites the gas mixture and the combustion begins. The combustion increases pressure and temperature in the cylinder. A typical pressure profile in the cylinder during the compression and expansion phase is shown in Figure 2.12. The dashed curve shows the pressure in the cylinder when no combustion occurs (motored cycle).
30
Figure 2.12 - Pressure development for a motored cycle and a cycle where combustion occurs. [16]
In case of combustion, before TDC the pressure begins to increase over the background pressure (continuous line in Figure 2.12). After the crank has passed TDC the volume starts to increase, still the pressure increases due to the combustion. At approximately 15°CA after TDC the pressure reaches its maximum. At this point the combustion is almost completed and the volume expands more rapidly, hence the pressure decreases.
The pressure versus crank angle curves shown in Figure 2.13a allow to understand why engine torque (at given engine speed and intake manifold conditions) varies as spark timing is varied. If the start of the combustion process is progressively advanced before top dead center, the compression stroke work transfer (which is from the piston to the cylinder gases) increases. If the end of the combustion process is progressively delayed by retarding the spark timing the peak cylinder
pressure occurs later in the expansion stroke and is reduced in magnitude. These changes reduce the expansion stroke work transfer from the cylinder gases to the piston. The optimum timing which gives the maximum brake torque (called Maximum Brake Torque, or MBT timing) occurs when the magnitudes of these two opposing trends just offset each other. Timing which is advanced or
31
of flame development and propagation, the length of the flame travel path across the combustion chamber and the details of the flame termination process after it reaches the wall. These depend on engine design and operating conditions, and the properties of the fuel, air and burned gas mixture. Figure 2.13b shows the effect of variations in spark timing on brake torque for a typical Spark-Ignition engine. In order to control the combustion phase to produce maximum work, the spark advance must be varied with different working conditions for the engine. The spark advance for an engine depends on many different parameters, as engine speed, engine load, Air/Fuel ratio, fuel composition, air temperature, air humidity and several other factors. Modern engine controllers measure several of these parameters and then compute a spark advance based on these
measurements, as reported in Section 2.4.
Figure 2.13 – (a) Cylinder pressure as function of the crank angle for over advanced spark timing (50°BTDC), maximum brake torque timing (30°BTDC), and retarded timing (10°BTDC). (b) Effect of spark advance on brake torque, normalized to its maximum value corresponding to MBT timing [13].
The in-cylinder pressure signal allows the calculation of certain combustion features, such as IMEP (Indicated Mean Effective Pressure), defined as follows:
∮ ( ) ( ) (2.1)
Where stands for the displacement volume of the single cylinder. IMEP can be also defined as the uniform pressure that would be required throughout the power stroke of the cylinder to
exchange the same amount of work done by the varying pressure that is in fact obtained during the stroke.
32
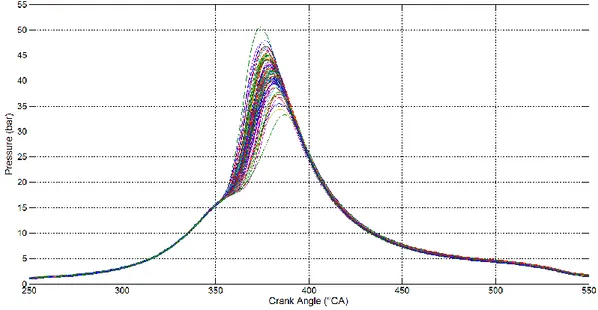
Observation of cylinder pressure for successive operating cycles shows the existence of important cycle-by-cycle variations. Since the pressure development is uniquely related to the combustion process, substantial variations in the combustion process, on a cycle-by-cycle basis, are occurring. These variations are important for two reasons. First, since the optimum spark timing is set for the "average" cycle, faster than average cycles have effectively over advanced spark timing, and slower cycles have retarded timing, resulting in losses in power and efficiency. Second, it is the extremes of the cyclic variations that limit engine operation, since the fastest burning cycles are most likely to knock under high-load conditions. Few cycles are those limiting spark advance from its optimal timing, thus limiting efficiency and performance. Figure 2.14 shows measured cylinder pressure for 100 consecutive engine cycles, on the same cylinder, with fixed engine operating conditions. The dispersion of the pressure curves is index of cycle-by-cycle variations.
Figure 2.14 – An example of cycle-by-cycle variations on cylinder pressure for 100 consecutive engine cycles.
One important measure of cyclic variability, derived from pressure data, is the Coefficient of Variation of the Indicated Mean Effective Pressure. It is the standard deviation in IMEP divided by the mean IMEP, and is usually expressed in percent:
(2.2)
Another important information provided by the in-cylinder pressure is about the knocking
condition. In case of a knocking combustion event, the cylinder pressure signal is overlaid with high frequency pressure oscillations; thereforethe piezoelectric pressure transducer is the most useful monitoring device for knocking for research applications, because it can actually "see" the main
33
consequence of an abnormal combustion. In on-board applications, due to cost and reliability, nonintrusive sensors (accelerometers connected to the engine block) are mainly used.
Figure 2.15 clearly illustrates the effect of knocking combustion on in-cylinder pressure signal. Normal combustion, light knock and heavy knock conditions are respectively reported.
Figure 2.15 - Cylinder pressure versus crank angle traces of cycles with (a) normal combustion, (b) light knock, and (c) heavy knock [13].
Various algorithms are used to determine timing and intensity of knock. Signals generated by both accelerometer and pressure sensor are generally filtered in order to provide high frequency
oscillations. MAPO (Maximum Amplitude Pressure Oscillation) is one of the most used pressure based knock index. It consists in filtering (band pass filter) the pressure curve and determining the maximum amplitude in a particular crank angle window:
(| |) (2.3)
2.3.3 Heat Release
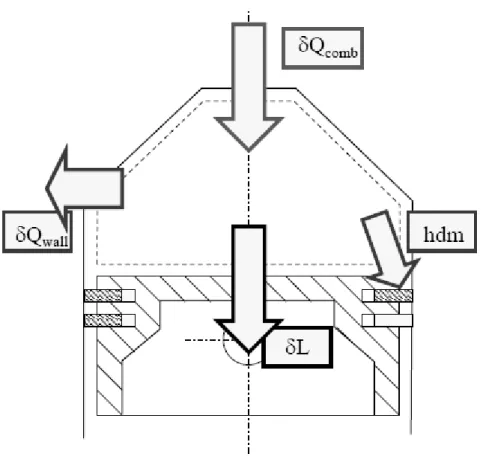
As already mentioned, the main measureable effect of the combustion process is the rise of in-cylinder pressure. By using a heat release approach, based on the first law of thermodynamics, it is possible to relate directly the pressure changes to the amount of chemical energy released by the combustion. Figure 2.16 shows the open-system boundary (dotted line) adopted for the
34
Figure 2.16 - Open system boundary for combustion chamber for heat-release analysis. Exhaust and intake valves are closed during combustion process. [14]
The first law of thermodynamics, applied to the control volume delimited by combustion chamber walls and considered as an open system, can be expressed as follow:
(2.4) Where:
represents the heat released by the combustion process; is the heat exchanged with the chamber walls;
is the variation of system‟s internal energy; is the work done by the gas on the piston;
is the enthalpy variation relative to mass which pass through the control volume surface (blow by)
Assuming the gas in the cylinder to behave like an ideal gas, with constant and uniform temperature T (mass-averaged cylinder temperature during combustion since the molecular weights of the burned and unburned gases are essentially identical [13]), then:
35 Derived:
( ) ( ) (2.6) Where the second term is zero in case of no mass exchange through the contour surface ( ). Substituting the expression of the work done by the gas on the cylinder ( ) in the Eq. (2.4):
(2.7) And indicating with ( ) the losses in mass due to crevice effects, and with their sensible enthalpy:
( ) (2.8) This equation represents the gross heat released during the combustion process. The net heat release can be obtained from Equation (2.8), less heat lost to the walls and crevice effects:
( ) (2.9) By expressing temperature as function of pressure and volume (under the hypothesis of ideal gas):
(2.10)
And considering the mass constant:
( ) (2.11)
Substituting in the expression of Net Heat Release (2.9) and introducing and : ( ) ( ) (2.12)
Expression (2.12) represents the Net Heat Release versus crank angle infinitesimal increment. This quantity is measurable starting from pressure signal and volume function and with a simple model for . "Net" because only the sensible energy change and work transfer to the piston is taken into account. The Gross Heat Release is thus higher, due to heat transfer to the wall and blow by effects.
In Figure 2.17, the Net Heat Release versus crank angle (indicated as ROHR – Rate of Heat Release (J/°CA)) is reported for different spark advance values, together with the corresponding pressure signal. Retarding the ignition results in slower combustion, with lower ROHR peak value.
36
Figure 2.17 – Pressure signal on the left (bar) and corresponding net heat release profile on the right (Joule/°CA), calculated with Eq. (2.9), for different ignition timing versus crank angle [8].
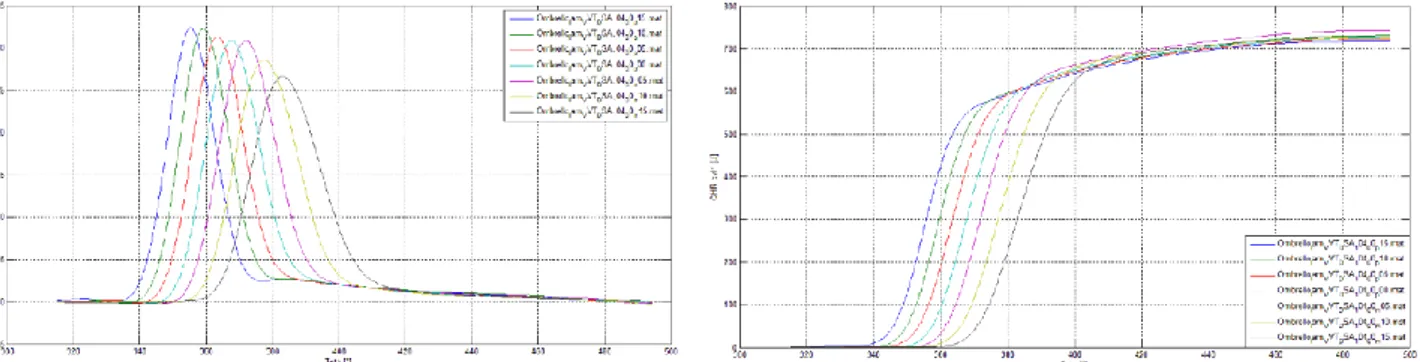
Figure 2.18 shows, for different ignition timing, the Net Heat Release profile (ROHR) and its integration. The Net Heat Release profile obtained from integrating Eq. 2.12), normalized to give unity at its maximum value, is often interpreted as the burned mass fraction (or, more correctly, the energy-release fraction) versus crank angle profile.
Figure 2.18 – On the left, Net heat release (Joule/°CA) versus crank angle and, on the right, its integrating profile, also known as Cumulative Heat Release (CHR), measured in Joule, for different ignition timing [14]
2.3.4 Combustion Phase Indicators
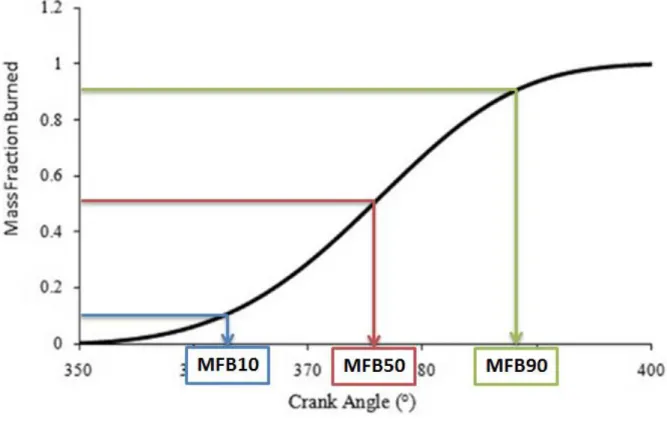
The Mass Fraction Burned profile as a function of crank angle can therefore be assimilated to the Net Heat Release integral curve, normalized to give unity at its maximum value. The rate at which fuel-air mixture burns increases from a low value, immediately following the spark discharge, to a maximum about halfway through the burning process and then decreases to close to zero as the combustion process ends. It is convenient to use these Mass Fraction Burned profiles to characterize different stages of the spark-ignition engine combustion process by their duration and position in crank angles.
37
Figure 2.19 reports the main MFB (Mass Fraction Burned) angles used to describe the combustion process development.
Figure 2.19 – Main Mass Fraction Burned angles.
The flame development process, from the spark discharge which initiates the combustion process to the point where a small but measurable fraction of the charge has burned, it‟s influenced primarily by the mixture state, composition, and motion in the vicinity of the spark plug. The duration of this first combustion stage can be identified by the MFB0-10 interval.
The stage during which the major portion of the charge burns as the flame propagates to the chamber walls is next. The MFB50 angle, corresponding to 50% mass fraction burnt, is the main combustion phase indicator used in this work of thesis. The spark advance well correlates with the MFB50 angle. In the final stage, the remainder of the charge burns to completion.
Another index for combustion phasing is APMAX. It expresses, in crank angle degrees, the position of the pressure signal peak and can be easily evaluated directly from the pressure curve without calculating the heat release function.
38
2.4 Engine Control Unit
In the last years, the development of electronic control systems in the automotive industry has been fundamental for innovation and to meet market‟s demand for low fuel consumption and emission. Engine control itself has taken over numerous additional responsibilities than just ignition and injection control. The main tasks of a modern engine control unit can be summarized as follows:
• control normal engine operations; • reduce fuel consumption;
• reduce pollutant emission and diagnose of all emission related components ; • diagnose malfunctioning;
• improve drivability;
• integrate with other vehicle control system.
In the next paragraphs an overview of a modern vehicle torque structure is given: the main inputs and outputs of a modern engine control unit are presented, along with the ignition angle control loop, important to better understand the main topic of this work of thesis.
2.4.1 Vehicle Torque Structure
All interventions for drivetrain and vehicle control can be converted in torque requests to the engine. Aim of a modern vehicle torque structure is to coordinate these demands and to provide a target torque value for the engine control unit. The engine control unit must then run the engine, through a series of actuators, to provide the desired torque in the most efficient way. Figure 2.20 summarizes the main torque requests from vehicle subsystems.Torque coordination is decentralized at different physical levels and it is engine independent. The interface between vehicle torque request and engine control unit is sharply defined.
39
Figure 2.20 – Vehicle torque structure. All torque reqeusts are coordinated at different physical levels and converted into a single torque request to the engine.
2.4.2 Sensor and Actuators of a Modern Engine Management System
The Engine Control Unit allows achieving, through the use of the calculation power, optimum efficiency, drivability and torque output targets. The idea behind the system is to fully integrate and regulate all engine system parameters, thereby enabling fuel delivery, spark timing and throttle control functions to be controlled by the same unit.
In a modern powertrain, through the extensive use of electrical components and sensors, always fewer are the mechanical connections between driver and engine. All requests are processed by the Engine Control Unit before they are converted into set values for different actuators. Focusing on the engine management system, Figure 2.21 illustrates the main sensors and actuators available to the Engine Control Unit. The layout presented refers to a modern Gasoline Direct Injected and turbocharged unit.
40
Figure 2.21 – Schematic view of a modern Engine Management System by Bosch.
Output torque is the main goal to be persecuted by the engine control unit.In a spark ignition engine, it is mainly influenced by the quantity of air and fuel introduced in the cylinders, which is primarily controlled by throttle (and waste gate, in turbocharged engines) position. Relation (2.13) express effective engine power output, where
is the mass of air that takes part in the
combustion process.
(2.13)
Besides throttle position, there are other variables that influence the delivered torque, such as ignition timing, air to fuel ratio, valve timing, engine temperature and so on. To manage all these variables, various control functions are implemented in the ECU. Among them, four of the main control loops implemented in the engine control unit are [17]:
the fuel-injection feed forward loop; the air/fuel ratio feedback loop; the ignition angle feed forward loop; the knock feedback loop.
41
2.4.3 Ignition Angle Control Loop
One of the most important parameters affecting internal combustion engine efficiency is represented by the combustion phase, which in a Spark Ignition engine is mainly controlled by phasing the spark discharge, or spark advance timing. The Engine Control Unit, hence, performs an open-loop control of the combustion phase on the base of proper spark advance maps predetermined on bench tests and stored in memory.
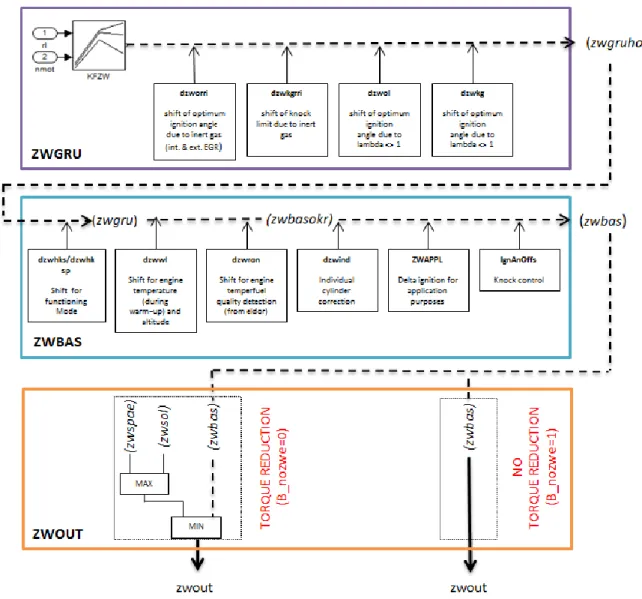
Figure 2.22 provides a simplified overview of the ignition angle control loop. The final result is the ignition angle, or zwout.
Figure 2.22 – Spark advance calculation path
Task of the functions ZWBAS is to provide the earliest possible ignition angle, starting from the base ignition angle provided by the function ZWGRU. Starting from a pilot control map for ignition timing (KFZW), function of relative air charge (rl) and engine speed (nmot), the spark advance value is then modified through a series of corrections. Influence of air/fuel ratio, residual gas,
42
functioning mode, engine temperature, ambient pressure, fuel quality and presence of abnormal combustions is taken into account. If no request for torque reduction via an ignition angle
intervention is present (B_nozwe=1), the spark advance value provided by the function ZWBAS is enabled. Otherwise, the spark advance carried out is provided by the engine torque structure (zwsol). Torque reduction through an ignition angle variation can be applied in the case of catalyst heating, when higher exhaust temperature are requested, anti-jerk intervention or idle torque reserve.
It shall be noticed that this fundamental engine parameter is currently controlled in open-loop by means of lookup tables. With the ionization current system adopted by Ferrari, described in the next paragraph, it is already possible to close the spark advance control loop under abnormal or critical conditions (knocking, misfire, pre-ignition…) with feedback on the combustion process derived from the ion current signal: purpose of this work is to evaluate the feasibility of a closed loop control under normal operating condition.
43
2.5 Ionization Current for Ignition Control
The ionization current signal is strictly related to many parameters of the combustion and among them the pressure, which is an important possible feedback for spark advance control. One advantage with measuring the ionization current, instead of the pressure, is that it makes use of already existing equipment, commercially available in cars, such as the spark plug and electronics [18]. Measuring the ionization current inside the cylinder is thus an alternative to measuring the pressure signal.
Ion current measurement system is currently employed by all production Ferrari engines, and features of the ion signal are made available at every combustion event by a dedicated control unit.
In this Paragraph, a brief literature study is performed and presented to give a background about the ionization current signal. The principle for measuring ion current is described, along with the signal‟s main features. In the last paragraph, the actual applications on Ferrari engines are presented.
2.5.1 Ion Generating Process and Measurement
The ionization process can shortly be described as follows. The heat in the flame front ionizes the gas in the combustion chamber and the gas becomes conductive. An electric field is applied in the combustion chamber and the generated current is measured. The ionization degree depends on the temperature in the cylinder, which is strongly connected to the pressure inside the cylinder. The result is that the ionization current contains information about the pressure and the combustion process.
The measurement system for ion current employed by Ferrari uses the spark plug as a probe for detecting the ionization levels. The spark plug has the advantage that it is already mounted (no extra costs). A potential disadvantage is the spark ignition itself, since no useful ionization signal is retrieved during this phase. When the ignition ends, the spark plug is again available for measurement during the remaining part of the combustion.
The principle for measuring, as described earlier, is to create an electric field in the combustion chamber and measure the current through the spark plug gap. The measuring equipment, shown in Figure 2.23, is positioned at the high voltage side of the ignition coil, which implies that the circuits must be protected from the high voltage pulse that generates the spark through high voltage diodes. As reported in Figure 2.23, during the spark phase, the energy associated to the spark is used to charge a capacitor. Once the ignition process is completed, the energy stored in the capacitor is
44
gradually discharged, due to the generation of the ion current between the spark gap. The signal is measured in voltage through calibrated resistances.
Figure 2.23 - Ionization measurement circuit at the high voltage side of the ignition coil. Electric current flow during spark discharge (left) and during ion current measurement phase (right). The spark plug is the ion current sensor inside the combustion chamber. [19]
2.5.2 Ionization Current Feature
In Figure 2.24, a characteristic ionization signal is reported, together with the corresponding pressure signal measured through a piezoelectric sensor. The ion signal is characterized by three main phases: ignition, chemical and thermal phase.
Figure 2.24 - Ionization current (in blue), with the chemical and thermal phase highlighted, and pressure signal (in black). The Ionization current follows the pressure signal in the thermal phase.
45
In the ignition phase the ion signal is disturbed by the ignition pulse generated by the coil (the spike just before the chemical phase). Immediately following the spark discharge, the ion signal is
characterized by the presence of two main peaks: the first one is associated to chemical ionization, while the latter to thermal ionization.
The first peak, called chemical peak, is caused by ions generated in the flame front. The flame front is only close to the spark plug for a short period, then it propagates through the combustion
chamber, causing the ionization of the gas between the spark plug electrodes to decrease.
The ion current then rises again, leading to the second peak, or thermal peak. Here the ionization is associated with the high temperature resulting from the combustion, due to its effects on the ion concentration. Since temperature and pressure are closely related, ideally , the
ionization signal follows the pressure signal (reported in black) to some degree in this latter phase.
2.5.3 Ionization Current Applications for Ferrari
The ion measurement system is currently adopted on all new Ferrari engines. Ionization current for every cylinder is measured and processed in real-time by a dedicated control unit. Through the analysis of the ion current it‟s possible to obtain important information about the combustion for each cycle and for each cylinder, without the installation of pressure sensors. The main applications for ion current system in Ferrari concern:
Knock detection and control; Misfire detection and control; Mega knock detection and control; Octane rating detection.
As the ion signal is strongly correlated to the temperature and therefore to the pressure in the combustion chamber, information from ion current signals can be used to identify and quantify knocking combustion events.
To prove this correlation, Figure 2.25 reports both the pressure and the ion signal during a knocking combustion. High frequency oscillations, symptoms of abnormal combustion, can be seen on both signals.
46
Figure 2.25 – Effect of a knocking combustion on in-cylinder pressure signal (upper diagram) and ion current signal (lower diagram). High frequency oscillation are visible in both signals.
To detect the knock level, the first step is the definition of a knock index, derived from the ion signal, that well correlates with a reference knock index evaluated from the pressure signal. The most used (and reliable) knock index is the MAPO, which is the Maximum absolute Amplitude of the Pressure Oscillation due to a knock event (see Paragraph 2.3).
Most of the calibration process consists in the determination of the optimal frequency window for the calculation of the ion derived knock index. The choice of these parameters is made through an optimization process, whose target is the maximum correlation with MAPO. Once the knock index from ion current signal is available, it can be used as a feedback for knock control. In case of knocking combustion, the control requires, cylinder by cylinder, individual spark advance corrections, with different strategies depending on the intensity of the event.
A particularly dangerous event, due to the great amount of energy released in a small time interval, is the ignition of the whole mixture charge before the spark discharge. This phenomenon, called pre-ignition or “Mega knock”, can be identified through the measurement of the ion current during
47
the coil charge phase. In fact, an ion current before the ignition spark can be measured only in case of pre-ignition. If a Mega knock is detected, the engine control unit can take different actions to prevent successive Mega knock events, such as mixture enrichment, variable valve timing overlap reduction or load reduction.
Figure 2.26 shows a further application of the ion current signal. In this case, it is used to recognize the so called “misfire”, or missing combustion.
Figure 2.26 - Pressure signal (red) and ion current signal (orange) for normal and misfiring cycle. Chemical and thermal phase are absent, index of missing ionization inside the cylinder (i.e. no combustion).
It is possible to define an index for the mean amplitude of the chemical and thermal signal phase and use the difference between this index and a calibrated threshold to identify a misfiring cycle. In the specific case of Figure 2.26, the ion signal highlights the presence of the spark ignition, while the chemical and thermal phase are absent, since no combustion occurs (as confirmed by the corresponding pressure signal, reported in red).
49
3 Correlation Analysis
The results of an experimental measurement campaign at the engine test bench are presented in this Chapter. Aim of the experimental activity is to quantify the correlation level between combustion features derived respectively from the pressure signal and from the ionization current signal. Since the physical phenomenon to be controlled is the combustion phase, the following indicators are measured and analyzed: the pressure peak location and the Mass Fraction Burned angles, derived from the pressure signal, and the thermal phase peak position evaluated from the ionization current signal. This last index is chosen since a strong correlation is reported by various authors
([20],[21],[22]) with the pressure based phase indicators. The experimental activity is carried on entirely at the test bench on a Ferrari turbocharged engine.
Experimental results from a post-processing correlation analysis, based on the “raw” signals of pressure and ionization current, are presented in Paragraph 3.1.
Paragraph 3.2 focuses on the performance evaluation of a real time algorithm for ion thermal peak detection. The results from the real time analysis are compared with the results from a post
processing analysis based on “raw” ionization current signal. An error in the conversion process from the sample based system of the Ion Control Unit to the angle-based system is identified, together with a possible solution. Further combustion features, that can be found both on the pressure and on the ionization signal, are presented in Paragraph 3.3.
3.1 Offline Processing of Raw Signals
The results from a post-processing analysis of the “raw” pressure and ionization current signals are presented in this Section. The indicators for combustion phasing are evaluated through a specific post-processing script, whose inputs are the high frequency sampled pressure and the ion current signal, measured for every cylinder and every engine cycle. The analysis based on the raw signals helps evaluating the physical correlation between the two sources of information, neglecting the performance of the real-time algorithm for ion current processing (see Paragraph 3.2).
3.1.1 Offline Algorithm
The ion current feature to be extracted from the signal is the location of the thermal phase peak (see Paragraph 2.5). To define the corresponding angle in an efficient way, the ion signal is windowed around the angular position corresponding to the maximum of the pressure signal, “APMAX”, as reported in Figure 3.1. This procedure presumes the availability of the pressure signal, therefore it cannot be used for real-time on-board applications, but just for a preliminary correlation analysis.
50
Figure 3.1 - Thermal phase peak position on ion raw signal (blue). The location algorithm starts from the maximum pressure angle position APMAX.
In case the ion current peak is not found in the window defined around APMAX, the algorithm iteratively shifts the ion observation window on the basis of the ion signal gradient. In case the algorithm does not converge to the thermal peak location, the corresponding engine cycle for the specific cylinder is excluded from the analysis.
3.1.2 Experimental Activity
The pressure and ion signals have been measured during a series of steady state tests conducted for 18 different spark advance values (each test comprises 500 engine cycles at constant spark
advance). The investigated engine operating conditions, reported in Table 3.1, comprehend different loads and temperatures.
Table 3.1 - Engine operating conditions for test bench data collection. The combustion phase is changed by adjusting the applied spark advance (18 different values for each operating condition).
Engine Speed (rev/min) 1000 BM EP (bar) 1 T_H20=75°C 3 T_H20=30°C T_H20=53°C T_H20=75°C 6 T_H20=75°C
51
The raw signals, both ion and pressure, are acquired with a fixed angular resolution of 0.1°CA, which, at 1000 rpm, corresponds to 60 kHz sampling frequency. During the steady state
measurements, all the main actuations of the engine are fixed to the reference calibrated conditions (with no spark advance correction): air to fuel ratio, camshaft position, injection phase and pressure and throttle position. This last actuation is used to regulate the engine to produce the desired BMEP with the reference spark advance value set.
3.1.3 Raw Signal Correlation Results
In this paragraph the correlation results between raw pressure and ion signal are presented. The analyzed indicators are:
APMAX (°CA): angular position of the peak of pressure signal;
MFB50 (°CA): angular position corresponding to 50% Mass Fraction Burned, derived from the pressure signal through the heat release analysis (see Paragraph 2.3);
AThPeak (°CA): ion current thermal phase peak location, evaluated from the raw signal (see 3.1.1).
To measure how well the linear regression line approximates the real data points, the coefficient of determination, denoted R2 , is used:
∑∑ ( ̂) ( ̅)
(3.1) Where are the observed values of the dependent variable, ̅ their mean value, and ̂ are the fitted values.
R2 equal to 1 indicates a perfect fit, while a zero value indicates that there is no correlation beteen the two signals.
Correlation diagrams respectively between MFB50 and AThPeak, and between APMAX and AThPeak, are reported in Figures 3.2 and 3.3. All data refer to Cylinder 2, BMEP 3 bar and 1000 rpm. For each stationary test at fixed spark advance, 500 engine cycles have been measured.
52
Figure 3.2 – MFB50 (from heat release analysis of the pressure signal) and AThPeak (from ion current signal). Only data from Cylinder 2 are shown.
Figure 3.3 – APMAX (from pressure signal) and AThPeak (from ion current signal). Only data from Cylinder 2 are shown.
Results from all 8 cylinders are reported in Figure 3.4, in terms of MFB50 versus AThPeak, while results for different operating conditions are summarized in Table 3.2. Data from all 8 cylinders are considered.
53
Figure 3.4 - MFB50 (from heat release analysis of the pressure signal) and AThPeak (from ion current signal) for all cylinders and 18 different ignition timings.
Table 3.2 – Summary of correlation results for different operating conditions (1000 rpm, IMEP 1-3-6 bar) in terms of MFB50 versus AThPeak.
BMEP (bar) Linear Regression
MFB50(°CA) / AThPeak(°CA) R
2
1 AThPeak = 1.01*MFB50 + 5.21 0.9244
3 AThPeak = 1.08*MFB50 + 4.26 0.9635
6 AThPeak = 1.03*MFB50 + 4.55 0.9712
Since MFB50 and AThPeak show a very high correlation level, even their variation is linked: when the combustion development varies due to cycle-to-cycle variation, a higher dispersion on both MFB50 and AThPeak angles is observed. Figure 3.5 illustrates the correlation diagram between the standard deviation of MFB50 and AThPeak. Every point represents the behavior of a single
cylinder over a steady state measurement of 500 engine cycles. This relation could be deepened with measurements in operating conditions characterized by high cycle-to-cycle variations (for example, cycles with retarded spark advance timing).
![Figure 2.1 - Comparison of global CO 2 regulations for new passenger cars, normalized to NEDC [2]](https://thumb-eu.123doks.com/thumbv2/123dokorg/7427302.99355/12.892.94.779.119.640/figure-comparison-global-regulations-passenger-cars-normalized-nedc.webp)
![Figure 2.6 - Advanced 48 Volts functionalities and their application in urban driving environment [11]](https://thumb-eu.123doks.com/thumbv2/123dokorg/7427302.99355/21.892.93.766.436.844/figure-advanced-volts-functionalities-application-urban-driving-environment.webp)
![Figure 2.11 - Flame development, auto ignition and pressure wave propagation through the combustion chamber during a knocking combustion event [15]](https://thumb-eu.123doks.com/thumbv2/123dokorg/7427302.99355/28.892.178.715.106.850/figure-development-ignition-pressure-propagation-combustion-knocking-combustion.webp)