Activity-dependent expression of
Channelrhodopsin at neuronal synapses
Francesco Gobbo
1,2
, Laura Marchetti
1,2,3
, Ajesh Jacob
1
, Bruno Pinto
1,4
, Noemi Binini
5
,
Federico Pecoraro Bisogni
5
, Claudia Alia
1,6
, Stefano Luin
2
, Matteo Caleo
6
, Tommaso Fellin
5
,
Laura Cancedda
4,7
& Antonino Cattaneo
1
Increasing evidence points to the importance of dendritic spines in the formation and
allocation of memories, and alterations of spine number and physiology are associated to
memory and cognitive disorders. Modi
fications of the activity of subsets of synapses are
believed to be crucial for memory establishment. However, the development of a method to
directly test this hypothesis, by selectively controlling the activity of potentiated spines, is
currently lagging. Here we introduce a hybrid RNA/protein approach to regulate the
expression of a light-sensitive membrane channel at activated synapses, enabling selective
tagging of potentiated spines following the encoding of a novel context in the hippocampus.
This approach can be used to map potentiated synapses in the brain and will make it possible
to re-activate the neuron only at previously activated synapses, extending current
neuron-tagging technologies in the investigation of memory processes.
DOI: 10.1038/s41467-017-01699-7
OPEN
1Bio@SNS, Scuola Normale Superiore, piazza dei Cavalieri 7, 56126 Pisa, Italy.2NEST, Scuola Normale Superiore, piazza San Silvestro 12, 56127 Pisa, Italy. 3Center for Nanotechnology Innovation @NEST, Istituto Italiano di Tecnologia, piazza San Silvestro 12, 56127 Pisa, Italy.4Department of Neuroscience and Brain Technologies, Istituto Italiano di Tecnologia, via Morego 30, 16163 Genoa, Italy.5Optical Approaches to Brain Function Laboratory, Department of Neuroscience and Brain Technologies, Istituto Italiano di Tecnologia, via Morego 30, 16163 Genova, Italy.6Istituto di Neuroscienze, Consiglio Nazionale delle Ricerche, via Moruzzi 1, 56124 Pisa, Italy.7Dulbecco Telethon Institute, via Varese 16b, 00185 Rome, Italy. Correspondence and requests for materials should be addressed to A.C. (email:[email protected])
123456789
U
nderstanding the mnemonic processes is one of the
greatest challenges in neuroscience. Long-lasting changes
in the synaptic connectivity between neurons are
gen-erally accepted to be crucial for the establishment and
main-tenance of memories
1,2. Similarities between synaptic and
memory consolidation suggest shared mechanisms
3–5, and
synaptic modifications have been shown to be critically involved
in memory formation, strengthening, and recall
6,7. Recently, it
has become possible to define sets of neurons involved in specific
memories by activity-dependent tagging
8–10. However, many
details remain to be worked out on the role of the modifications
at the synapse level in the encoding and establishment of
memories
6,11–13.
Whereas much progress in the understanding of neural circuits
has been made using optogenetics
8,9, to date no direct
modulation of specific synapses involved in the formation of
memories has been possible using state-of-the-art optogenetic
tools. Indeed, the current spatial resolution of opsin expression in
activity-dependent tagging is the whole neuron. Cell-wide
exci-tation does not take into account, for instance, the complexity of
different incoming pathways converging onto the same
post-synaptic neuron
14and the synchronous activation of the whole
cell may fail to mimic a physiological condition
14,15. In recent
attempts, subcellular localization of light-sensitive effectors has
taken advantage of trafficking signals inserted into the opsin
aminoacidic sequence
16–18. For example, channelrhodopsin-2
(ChR2) and halorhodopsin were differentially targeted with
protein-targeting signals to the soma and dendrites of retinal
ganglion cells, to recreate antagonistic center-surround receptive
fields
19, and fusion with a MyosinVa-binding domain targeted
ChETA cherry SYN
ChETA cherry cherry ChETA SYN Arc 5’ Arc 5’ Arc 3’ Arc 3’ LS LS palmitoylCherry Arc DTE
EGFP MS2
Cherry EGFP EGFP Cherry
S-Ch S-Ch A-Ch SA-Ch Intensity
a
b
Intensityc
d
Intensity 8 6 4 2 0 1.00 0.75 0.50 0.25 0.00 ATG ATG ATG Stop Stop StopCherry EGFP EGFP Cherry
A-Ch SA-Ch
e
Saline BDNF KCl LTP ** * ** # † #A-Ch SA-Ch S-Ch ChETA
* * * * # # # # KCI Soma Cherry EGFP MS2 Saline 100 μm ChETA A-Ch SA-Ch Enrichment index
ChETA S-Ch ChETA A-Ch SA-Ch S-Ch ChETA A-Ch SA-Ch S-Ch ChETA A-Ch SA-Ch S-Ch
Fraction positive spines Saline Saline BDNF KCI KCI LTP AP5 LTP Saline BDNF KCI LTP AP5 Saline BDNF KCI LTP AP5 Saline BDNF KCI LTP AP5 BDNF/G418
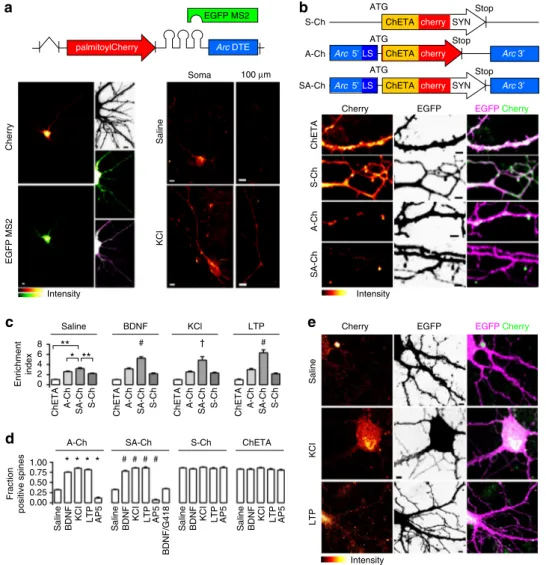
Fig. 1 Activity-dependent SA-Ch expression at spines. a Schematic construct of palmitoyl-Cherry/MS2 reporter. Left, Cherry (top) and EGFP-MS2 (bottom) distribution in living neurons under resting conditions. In the presence of Arc DTE, MS2/RNA signal is granular. Inset, top to bottom, neuron profile, EGFP-MS2, merge (stretched levels). Right, Arc DTE regulates reporter expression in response to neuron activity. Cherry expression in proximal dendrites (“soma”) and 100 μm away from the soma (“100 μm”) after 1 h saline (top) or 10 mM KCl (bottom) treatment. b Schematic S-Ch, A-Ch and SA-Ch constructs. Below, dendritic pattern of SA-ChETA-SA-Cherry expression (left), EGFPfiller (centre) and merge (right) for unmodified ChETA-Cherry and the three constructs above.c Enrichment Index for the three constructs and unmodified ChETA-Cherry under different stimulation conditions (see Methods). *P < 0.01 and **P < 0.001, one-way ANOVA, Bonferroni comparison of means, within group. †P < 0.05 and #P < 0.001 to SA-Ch, saline treated, one-way ANOVA, Bonferroni comparison of means.d Fraction of ChETA-Cherry-expressing spines under different stimulation conditions, grouped for construct. *P < 0.001 to A-Ch saline and #P < 0.001 to SA-Ch saline, one-way ANOVA, Bonferroni comparison of means. Differences within and between S-Ch and ChETA values are not significant at the 0.05 level. e Representative images of SA-Ch-expressing neurons under different treatment conditions. Following KCl or NMDA-dependent LTP, bright ChETA-Cherry puncta are evident along dendrites. Bars are mean± SEM. Data in d and e are reported as boxplots in Supplementary Fig.5. Scale bar (a) 5μm, (b,e) 2 μm. N and replicate numbers for all figures are listed in Supplementary Table1
ChR2 to the somatodendritic compartment of neurons in living
mice
16. These approaches can be useful to refine spatial
stimu-lation specificity and to activate specific subcellular
compart-ments
18. However, tagging different subsets of synapses based on
their activity in order to selectively stimulate them appear
demanding tasks for this protein-based approach, as it is not
straightforward to integrate it with activity-tagging
methodolo-gies. Indeed, synapses are at the same time a subcellular
com-partment of the neuron and the physical site of circuit
connections, enabling them to undergo local modifications in an
autonomous way
6. Single-synapse optogenetics can be achieved
by restricting illumination to single spines
20, but this requires a
priori knowledge of the identity of the synapses involved in the
circuit, in order to test their role in a memory process.
A functionally relevant reactivation of the incoming stimulus
in an unbiased, synapse-specific way would require the tagging of
activated synapses by locally expressing opsins. Towards this aim,
here we describe a novel strategy, named SynActive (SA), for the
expression of proteins at synapses in an input-specific,
activity-dependent manner by combining RNA targeting elements and a
short protein tag. The SA-Channelrhodopsin variant presented
here is locally translated at synapses in vitro and in vivo, and the
exploration of a novel context increases the number of
hippo-campal synapses expressing the opsin, revealing a non-random
dist′ribution of the activated synapses along dendrites.
Results
Arc mRNA targeting element regulates translation. We
devel-oped a dual RNA/protein reporter to compare possible RNA
synaptic tags. Transcripts encode membrane-anchored
fast-maturing
fluorescent mCherry
21and bear different dendritic or
axonal targeting elements (DTEs and ATEs, see Supplementary
Methods); MS2-binding sites in the 3′-untranslated region (UTR)
bind EGFP-MS2 protein to visualize RNA
22. Arc is transcribed in
an activity-dependent manner and its messenger RNA localizes
near synapses that experienced recent activity; in resting
condi-tions, it is believed to be translationally repressed within
ribo-nucleoparticle (RNP) granules
23. We found that a minimal DTE
from Arc 3′-UTR
24determined a significantly lower level of
mCherry expression in non-stimulated neurons than strong or
constitutive DTEs from alphaCaMKII or MAP2 (Fig.
1
a and
Supplementary Fig.
1
), whereas a discrete, granule-like Arc/
MS2 signal was detected in the soma and along dendrites (Fig.
1
a). KCl activation of neurons expressing the Arc DTE construct
dramatically increased mCherry
fluorescence in dendrites as far
as 100
μm away from the soma in as little as 1 h (Fig.
1
a),
sig-nificantly increasing mCherry dendritic pool; conversely, the
increase driven by alphaCaMKII DTE was less prominent
(Sup-plementary Fig.
1
).
Synergistic action of RNA and protein. To enrich opsin
expression at synapses, we combined RNA- and protein-targeting
sequences. We cloned fast-spiking ChETA-Cherry
25between Arc
5′- and 3′-UTRs. Although 3′-UTR may contain DTEs, 5′-UTR
and other parts of 3′-UTR generally regulate translation
26. For
instance Arc 5′-UTR has IRES (internal ribosome entry site)-like
activity
27, a process involved in the synaptic translation associated
to long-term potentiation (LTP)
26. As ribosomes typically lie at
the dendrite-spine junction, we reasoned that a protein tag
interacting with postsynaptic components would improve spine
retention and enrichment of the newly synthesized protein. We
therefore fused to the C terminus of ChETA-Cherry a short
bipartite tag (AAAASIESDVAAAAETQV, hereafter SYN tag)
composed of the N-methyl-D-aspartate receptor (NMDAR) C
terminus SIESDV and the PSD95-PDZ-binding consensus
ETQV, which has been previously reported to enrich proteins at
postsynaptic sites
28,29.
To compare the distinct contributions of the protein and RNA
instructive signals, we generated three constructs and expressed
them in primary neurons: (i) Arc 5′-ChETA-Cherry-MS2-Arc
3′-UTR (hereafter A-Ch); (ii) ChETA-Cherry-SYN tag-MS2 (S-Ch),
and (iii) Arc 5′-ChETA-Cherry-SYN tag-MS2-Arc 3′-UTR
(SA-Ch) (Fig.
1
b). Neurons expressing the constructs were
morpho-logically similar to each other or to neurons expressing enhanced
green
fluorescent protein (EGFP) alone; neither the modified
SYN-ChETA nor Arc UTRs determined significant changes in
spine number and morphology (Supplementary Fig.
2
a–c). In
addition, SA-Ch expression did not alter the ratio of surface
NMDAR/AMPAR (Supplementary Fig.
2
d).
Brain-derived neurotrophic factor (BDNF) administration,
which causes a translation-dependent late form of LTP
30, induced
dendritic expression of A-Ch, but not of S-Ch; following BDNF
treatment, A-Ch signal in dendrites was significantly higher than
that of EGFP, which lacks DTEs and is translated in the soma
only (Supplementary Fig.
3
a). Conversely, dendritic S-Ch
distribution was quite similar to that of EGFP. This is consistent
with previous observations that BDNF boosts the translation of
transcripts bearing alphaCaMKII 3′-UTR, increasing the protein
levels along dendrites as compared to the soma
31. In addition,
A-Ch and SA-A-Ch RNA in unstimulated neurons, identified by
RNA-tethered EGFP-MS2, was prevalently granular along dendrites.
Following KCl treatment, the RNA/MS2 signal became much
more diffuse (Supplementary Fig.
4
a, b), indicating RNA exit
from granule, allowing local SA-Ch translation
26.
We then co-expressed the three ChETA-Cherry variants with
EGFP in cortical neurons to compare their subcellular expression
pattern. S-Ch was enriched at spines compared to unmodified
ChETA-Cherry (Fig.
1
b, c), but spines were labelled quite evenly.
Conversely, A-Ch labelled spines in a sparse way (Fig.
1
b). In
many cases the base of the spine, rather than the head, was
labelled most intensely, and Cherry
fluorescence was also
prominent on the dendritic shaft. SA-Ch recapitulated the sparse
expression pattern typical of A-Ch, while more trustfully tagging
spine heads (Fig.
1
b).
A quantitative enrichment index (EI), the ratio of
ChETA-fused Cherry intensity at the synapse to that measured in the
dendritic shaft (1 to 2
μm from the spine junction), demonstrated
effective SA-Ch accumulation at synapses. The EI calculated for
SA-Ch was significantly higher than that for A-Ch or S-Ch, and
all three constructs had higher EI than ChETA-Cherry (Fig.
1
c).
Activity-dependent SA-Ch expression and synapse enrichment.
We next characterized the activity-dependent regulation of
SA-Ch expression at synapses. Treatment of cortical neurons with (i)
BDNF, that induces L-LTP
26,30, (ii) KCl, and (iii) NMDA, under
conditions that promote spine potentiation (NMDA-induced
LTP) (see Methods and Supplementary Fig.
6
) dramatically
increased the number of SA-Ch-positive spines (Fig.
1
d, e).
Conversely, NMDAR inhibition with AP5 drastically reduced the
number of SA-Ch-positive spines. Translation inhibition with
G418 (geneticin) blocked BDNF effect on SA-Ch expression,
demonstrating its dependence on novel protein synthesis. In
terms of expressing spines, SA-Ch response to treatments was
identical to that of A-Ch, whereas neither S-Ch nor
ChETA-Cherry expression was affected by treatments that increased or
decreased neural activity (Fig.
1
d). Importantly, treatments that
activate neurons or induce synaptic LTP significantly increase
SA-Ch EI, relative to saline treatment (Fig.
1
c), and A-Ch EI was
only modestly responsive to treatments. We ascribe this last effect
to the fact that, following translation, A-Ch can diffuse in the
membrane both onto the spine head and along the dendritic
shaft; conversely, the SYN tag helps retention of SA-Ch in the
spine (Fig.
1
c). The observed somatic SA-Ch protein (Fig.
1
e and
Supplementary Fig.
4
) can probably be ascribed to the global level
of the stimulations, which can signal the overexpressed transcript
to be de-repressed also in the soma. In fact, in non-stimulated
neurons somatic expression is much lower (Fig.
1
e,
first row and
Supplementary Fig.
4
a, second row), and can be further reduced
by controlling promoter strength and localizing stimulation (see
section
“In vivo synaptic tagging with SA-Ch”).
To probe the specificity of SA-Ch accumulation at synapses, we
performed double immunofluorescence (IF) against Cherry and
mem Turq2 SEP-GluA1 Cherry Merge Stimulated Untreated Homer1c EGFP Cherry Merge Homer1c EGFP Cherry Merge SA-Ch S-Ch SA-Ch S-Ch r2 = 0.62 r2 = 0.22 Untreated Stimulated PSD95 Cherry Merge A-Ch SA-Ch SA-Ch A-Ch Docked spines NS***
1.0 0.8 0.6 0.4 0.2 0.0 1.0 0.8 0.6 0.4 0.2 0.0 10–1 100 101 102 10–1 10–1 100 10–1 100 101 102 10–1 100 101 102 10–2 10–1 100 101 102 10–1 100 101 102 SEP-GluA1 enrichment SEP-GluA1 enrichment SA-Ch enrichment Homer1c-EGFP 0 0 0 SA-Ch A-Ch ChETA enrichment Expressing spines 1.2 μma
d
f
e
g
b
c
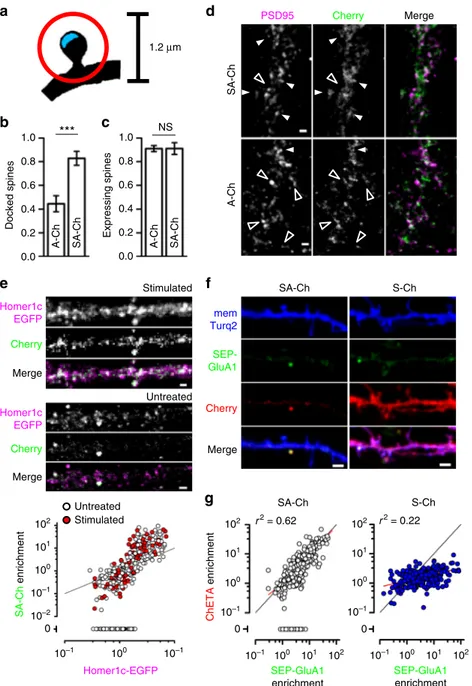
Fig. 2 Synergistic action of RNA and protein regulatory sequences. SYN tag confers synaptic localization of SA-Ch protein (a–d), whereas RNA sequences maps its expression to potentiated spines (e–g). a Schematic drawing for the determination of “docked” vs. positive but non-“docked” spines. Cherry fluorescence peaks within a circle of 1.2 μm diameter (red circle) centered on the postsynaptic density (PSD - blue area) for positive spines, and on the PSD for“docked” spines. Quantification of “docked” b and total positive spines (c following cLTP treatment (see Methods) for A-Ch and SA-Ch. Bars are mean ± SEM. ***P < 0.001 two-tailed Student’s t-test. NS, not significant at the α = 0.05 level. d Representative dendrites of neurons expressing the two constructs. White arrowheads indicate“docked” spines, empty arrowheads positive, non-“docked” spines. Another example is reported in Supplementary Fig.7a.e SA-Ch co-localizes with PSD marker Homer1c-EGFP. In stimulated as well as in unstimulated neurons, SA-Ch was expressed at Homer1c-EGFP puncta (top). SA-Ch correlation with Homer1c-EGFP is supralinear, indicating that SA-Ch is preferentially enriched at spines with larger PSD (bottom graph). Spines that do not express SA-Ch are assigned a value of zero. White dots are spines from unstimulated neurons, red dots from stimulated ones, black line represents the diagonal. Because the plot has double-log scale, any linear correlation has unitary slope and is parallel to this line.f Comparison of SA-Ch and S-Ch expression: SA-Ch is only expressed at SEP-GluA1-tagged spines, whereas S-Ch has no preference for SEP-GluA1-positive spines.g SA-Ch (grey dots) significantly correlates with SEP-GluA1 expression in a linear fashion, whereas S-Ch (blue dots) does not. A proportion of SEP-GluA1-positive spines do not express SA-Ch and those spines are assigned an enrichment value of zero. Red lines indicate the regression lines. Scale bar, 1μm (d, e) and 2μm (f)
PSD95, a major component of the post-synaptic density (PSD),
and compared the localization of A-Ch and SA-Ch, following
NMDAR-dependent LTP. Spines were considered
“docked” if
mCherry signal coincided with that of PSD95, and positive, but
not
“docked”, if it peaked outside the PSD, but within a circle of
0.6
μm radius centered on the PSD (Fig.
2
a). About half of the
spines expressing A-Ch were
“docked” (44 ± 7%), whereas these
constituted the vast majority (83
± 6%) of SA-Ch spines (Fig.
2
b).
The total number of positive spines was the same for both
constructs (Fig.
2
c). Representative images are presented in Fig.
2
d and in Supplementary Fig.
7
a.
Above data demonstrate the strong dependence of SA-Ch
expression on neural activity. This suggests that, in untreated
cultures, positive spines received a sustained stimulation from the
spontaneous activity of the culture, which could amplify basal
NMDAR activation
32. Consistently, blocking NMDAR activity
with AP5 drastically reduces A-Ch and SA-Ch expression
(Fig.
1
d), and SA-Ch localized preferentially to larger PSDs, as
indicated by the supralinear correlation between SA-Ch
enrich-ment at synapses and Homer1c-EGFP content, an excellent
indicator of spine volume and PSD size
33,34(Fig.
2
e). As spine
enlargement strongly correlates with functional potentiation
35,
this suggests SA-Ch expression at potentiated synapses; indeed, a
significant proportion of spines with lower Homer1c content
were devoid of any SA-Ch signal in non stimulated neurons. In
addition, SA-Ch was preferentially expressed at synapses
exposing the AMPAR-subunit 1 fused to supereclyptic-EGFP
(SEP-GluA1), a marker of functional potentiation
36(SA-Ch-positive spines were 63
± 3% of SEP-GluA1-positive spines, and
6
± 2% of SEP-GluA1-negative spines, P < 0.001, χ
2-test). The
relationship between SA-Ch and SEP-GluA1 enrichment was
linear (Fig.
2
f), indicating that SA-Ch is expressed at potentiated
synapses. Notably, some of the spines with lower SEP-GluA1
enrichment did not express SA-Ch, most likely because they
received a weaker stimulation. In fact, AMPAR exocytosis takes
place during E-LTP phase, which has a lower threshold than
translation-dependent L-LTP
3,36. On the contrary, S-Ch
enrich-ment only showed a modest dependence on SEP-GluA1 (Fig.
2
g).
Experiments in hippocampal neuron cultures yield almost
identical results to cortical neurons: SA-Ch co-localized with
Homer1c-EGFP and NMDA-LTP strongly increased the number
of SA-Ch-positive synapses (Supplementary Fig.
7
b, c).
Alto-gether, these data demonstrate the activity dependence of SA-Ch
translation, as well as its preferential localization at postsynaptic
sites.
Synapse-specificity of SA-Ch expression. We demonstrated
synapse specificity of SA-Ch expression by focally stimulating
selected synapses from neurons expressing EGFP and SA-Ch with
two-photon glutamate uncaging in the presence of the protein
kinase A(PKA) activator forskolin
37. Tetrodotoxin (TTX)
pre-vented potentiation from spontaneous activity under these
ele-vated cAMP conditions, as well as synaptic capture. Glutamate
uncaging induced SA-Ch expression at stimulated, but not at
neighbor synapses or at other synapses on the same dendrite (Fig.
3
). When caged glutamate was absent, no significant change in
SA-Ch intensity was observed following focal illumination (Fig.
3
b). Stimulated spines showed a sustained increase in volume
(Fig.
3
d), a structural rearrangement that parallels functional
potentiation
35. The increased Cherry intensity at stimulated
spines observed for S-Ch, which is translated exclusively in the
soma (Supplementary Fig.
3
), is likely due to the PSD expansion
following the volume change, and was significantly lower than
what observed for SA-Ch (Fig.
3
b).
a
b
c
d
EGFP SA-Ch Merge + Anysomicin – MNI-Glu
Stim Near Intensity ±MNI-Glu Fsk/TTX 0Mg2+ 1Mg2+ B27 ± Anysomicin –20 0 +90 Relative change in Cherry intensity at 60 ′ *** SA-Ch S-Ch MNI-Glu/fsk fsk only sn sn sn Before 60 ′ 8 7 4 2 0 8 6 4 2 0 8 7 4 2 0 8 6 4 2 0 8 7 4 2 0 8 6 4 2 0 –20 0 20 40 60 80 100 –20 0 20 40 60 80 100 –20 0 20 40 60 80 100 Δ V /V Δ Ch/Ch
Time (min) Time (min) Time (min)
0 1 2 3 4 5 –1 ###
Fig. 3 Synapse specificity of Ch expression at potentiated synapses. SA-Ch is specifically expressed at potentiated synapses. DIV 8-10 neurons were focally stimulated by uncaging glutamate in close proximity to selected spines.a Neurons were maintained in standard Mg2+-free ACSF in the presence of forskolin and TTX for 20 min before uncaging with or without MNI-caged glutamate. Following two-photon uncaging, medium was changed to 1 mM Mg2+ACSF supplemented with B27.b Local release of glutamate stimulates SA-Ch translation at stimulated (s), but not nearby (n) spines. This effect was specific to glutamate release, as it was absent when MNI-glutamate was not added to the medium. Following stimulation, S-Ch change was much lower and is an effect of spine enlargement. ***P < 0.001, one-way ANOVA, Bonferroni comparison of means. ### P < 0.001 unpaired samples Student’s t-test, two-tailed. Bars are mean± SEM. c Translation inhibition with anysomicin blocked SA-Ch accumulation at stimulated synapses. Representative images of stimulated dendrites in neurons transfected with SA-Ch. Red dots in the EGFP channel indicate the location of two-photon uncaging. Experimental conditions are indicated on top of images. Scale bar, 2μm. d Time course of relative changes in volume (ΔV/V, top graphs, measured by the EGFP intensity) and SA-Ch intensity (ΔCh/Ch, bottom graphs) following uncaging of stimulated (red) and near spines (blue). Stimulation induced a long-lasting volume change, paralleled by a slowly rising accumulation of SA-Ch; in the presence of anysomicin, volume change was transient and no accumulation of SA-Ch was evident. Bold lines represent mean± EM, whereas narrow lines are single traces for depicted data for stimulated (light red) and nonstimulated (light blue) spines.d Corresponding conditions in c above: from left to right, samples with MNI-Glu/forskolin, MNI-Glu/forskolin/ anysomicin, forskolin only/no MNI-Glu. Open circles are corresponding ΔV/V values at 60 min for SA-Ch spines in b
It is unlikely that the increase in SA-Ch at the potentiated
synapse is due to protein mobilization from surrounding regions,
as no significant change in intensity in neighboring spines and in
the dendritic shaft was apparent. The time course of SA-Ch
increase also rules out this possibility, because it shows a slow
rising phase following the stimulation that reaches a plateau
between 30 and 60 min (Fig.
3
d). Most importantly, translation
inhibition with anysomicin blocked SA-Ch accumulation at
stimulated spines (Fig.
3
c, d) and the change in spine volume
observed after stimulation slowly declined to pre-stimulation
levels (Fig.
3
d). Thus, synapse potentiation drives local SA-Ch
expression in a protein-synthesis-dependent, synapse-specific
way.
Optogenetic activation of SA-Ch-tagged synapses. Having
established synapse specificity of SA-Ch expression, we asked
whether the locally synthesized SA-Ch is effective in driving
synaptic currents. Calcium influx is an established indicator of
spine activation, both in vitro and in vivo
38–40. We therefore
co-expressed SA-Ch with the green calcium indicator GCaMP6s
38.
To minimize ChETA activation while imaging GCaMP6s, we
stimulated SA-Ch spines with laser scanning at 488 nm
wave-length and imaged GCaMP6s stimulating at 990 nm with
two-photon excitation
41,42in a region encompassing the base of the
spine and the corresponding dendrite. We observed light-induced
ΔF/F calcium transients in most stimulated spines, but not when
blue light stimulation was omitted; consistently, TTX inhibition
of presynaptic activity did not influence the recording of
light-induced calcium transients (Fig.
4
a). Channelrhodopsins are
weakly permeable to calcium
43, but their stimulation could lead
to the opening of voltage-gated calcium channels (VGCCs).
Accordingly, blue light stimulation performed in the presence of
VGCC inhibitors nifedipine, Ni
2+, and Zn
2+induced a markedly
reduced response (Fig.
4
a). In neurons expressing untargeted
ChETA-Cherry, both the spine and the nearby dendrite could
evoke light-dependent
ΔF/F calcium transients when illuminated,
in accordance with ref.
20; on the contrary, only spines, and not
dendrites, of SA-Ch-expressing neurons were responsive to blue
light stimulation (Fig.
4
b). SA-Ch expression does not appear to
alter the normal synaptic transmission, as spontaneous
ΔF/F
calcium events that could be sometimes recorded from SA-Ch
spines were not significantly different from those recorded from
control neurons expressing palmitoyl-Cherry and GCaMP6s
(Supplementary Fig.
8
).
To see whether the activation of Channelrhodopsin-tagged
synapses would mirror a physiological activation based on
neurotransmitter release, we expressed SA-Ch or unmodified
ChETA-Cherry in hippocampal neurons and determined
CaM-KII phosphorylation by IF 7.5 min after optogenetically
stimulat-ing them with a light pattern similar to
θ burst stimuli used to
induce LTP in the hippocampus (see Methods). In fact, sustained
glutamate release activates synaptic CaMKII and determines its
rapid phosphorylation that lasts for minutes
44. To reduce
background CaMKII phosphorylation, spontaneous activity was
pharmacologically suppressed with TTX and glutamate receptors
inhibitors, for the 3 h preceding light stimulation (Fig.
4
c).
During and after illumination, action potentials were inhibited
with TTX. Light stimulation strongly increased phospho-CaMKII
signal in SA-Ch-expressing neurons compared with neurons that
were maintained in the dark. Light alone had no effect, as
EGFP-only-expressing neurons were not affected by the stimulation and
synaptic levels of phospho-CaMKII were comparable to those in
unstimulated neurons expressing SA-Ch (Fig.
4
c, d). Importantly,
in optically stimulated neurons CaMKII phosphorylation was
specific to SA-Ch-positive spines, as spines from the same neuron
lacking Cherry signal did not differ from non-stimulated neurons.
Indeed, physiologically, CaMKII activation is specific to
stimu-lated spines
44. Cell-wide activation of untargeted ChETA-Cherry
also activated CaMKII, although the synaptic phospho-staining
was lower than for SA-Ch (Fig.
4
c). Interestingly,
phospho-CaMKII staining was evident in the dendritic shaft of illuminated
ChETA-Cherry, but not of SA-Ch neurons (Fig.
4
d). A possible
explanation is that, in ChETA-Cherry-expressing neurons, part of
the CaMKII pool fails to translocate from the shaft into the spine
due to concomitant extrasynaptic depolarization, as also data
presented in Fig.
4
b suggest; conversely, localized SA-Ch
activation could more readily induce CamKII phosphorylation
and mobilization, just as neurotransmitter-mediated synapse
stimulation mobilizes CaMKII from the dendritic shaft and
accumulates it at the spine head
44. We conclude that large-field
optical stimulation of synaptic SA-Ch is able to simulate an
input-specific excitation onto the postsynaptic neuron;
conver-sely, whole-cell activation of ChETA-Cherry has a different
outcome on the neuron response at the subcellular level.
We next asked whether the optical activation of SA-Ch
synapses could also drive global neuronal activation by
illuminating cultured hippocampal neurons with blue light pulses
as above and evaluating c-fos expression, an immediate early gene
that is induced in neurons shortly after strong synaptic
stimulation
45. Light-stimulated neurons expressing SA-Ch and
EGFP displayed evident nuclear c-fos staining 1 h after
optogenetic activation (Supplementary Fig.
9
). Conversely, c-fos
staining was lower in control cells transfected with SA-Ch and
EGFP that were maintained in the dark. Exposure to light alone
had no effect on c-fos expression, as illuminated neurons that
expressed EGFP only had lower levels of nuclear c-fos,
comparable to those in SA-Ch, not stimulated neurons
(Supplementary Fig.
9
). Thus, optogenetic stimulation of
neuronal cultures demonstrates that optical activation of
SA-Ch-expressing synapses by large-field illumination is able to
recapitulate key features of neuron-to-neuron communication.
In vivo synaptic tagging with SA-Ch. Our work in culture
demonstrates that SA-Ch is expressed at potentiated spines in
cortical and hippocampal neurons. We next sought to investigate
SA-Ch behavior in vivo, in order to (i) compare its somatic vs.
synaptic expression and (ii) evaluate its expression following a
natural stimulus such as the exploration of an unfamiliar
envir-onment, a paradigm that rapidly activates c-fos, as well as Arc
expression in the hippocampus of mice and rats
45,46. Blockage of
Arc translation or of general protein synthesis with Arc antisense
oligo-nucleotides or anysomicin inhibits context memory
3,47.
Indeed, a large body of evidence has identified populations of cells
that are activated in the hippocampus when animals are
pre-sented a novel context
8,45. We expressed SA-Ch under the
Tet-responsive TRE promoter
48in the hippocampus by means of
triple-electrode in utero electroporation
49. Mouse embryos were
co-electroporated with constitutive transactivator rtTA and
Tet-responsive EGFP. SA-Ch and EGFP transcription is induced with
intraperitoneal administration of the tetracycline analog
dox-ycycline, allowing us to restrict synapse tagging by SA-Ch to a
defined time window. Control mice that did not receive
dox-ycycline showed no expression. SA-Ch expression in the
hippo-campus in vivo showed a remarkable synaptic selectivity, as it was
detected almost exclusively at spines of electroporated neurons,
whereas somas were largely devoid of Cherry
fluorescence (Fig.
5
a
and Supplementary Fig.
10
). Conversely, untargeted ChR2 labeled
intensely both dendrites in the stratum radiatum and stratum
oriens, and somas in the stratum pyramidale (Supplementary
Fig.
10
c).
To address possible concerns that targeting SA-Ch at the
synapse may alter synaptic physiology, we electroporated mice as
above, with TRE:SA-Ch, constitutive rtTA, and soluble mCherry,
and we induced SA-Ch expression with doxycycline. We recorded
AMPA- and NMDA-EPSCs in CA1 pyramidal neurons, while
stimulating the Schaffer collateral with a bipolar electrode, and
calculated the NMDA/AMPA ratio
50. Importantly, the NMDA/
AMPA ratio was not significantly different in CA1 neurons
expressing the transgene (Cherry-positive cells) and in control
non-electroporated CA1 neurons (Cherry-negative cells,
Supple-mentary Fig.
11
).
Next, electroporated mice with TRE:SA-Ch and TRE:EGFP
were treated for 3 days with doxycycline and on the fourth day,
while still on doxycycline, were exposed to a novel context with
unfamiliar visual cues; control animals remained in the home
cage. The exposure to a novel context significantly increased the
number of SA-Ch spines in the CA1 and in the dentate gyrus
(DG) regions (Fig.
5
b, c). Interestingly, both in CA1 and in the
DG, SA-Ch spines were closer to each other than what we
calculated by randomly shuffling their positions along dendrites
(Fig.
5
d); consistently, the closest non-expressing spine was
located at a greater distance than what would be expected by
chance (Supplementary Fig.
12
a). Not only the
first neighbor
spine, but also the second and third neighbor spines were
significantly more likely to express SA-Ch than what would
happen by chance (Fig.
5
e). This implies the existence of clusters
of SA-Ch-expressing spines and, hence, of potentiated synapses.
We defined a cluster of potentiated synapses as a set of SA-Ch
synapses comprising at least two spines separated by no more
than 2
μm, i.e., two spines belong to the same cluster if their
interdistance is
<2 μm. In home-caged animals, 86% and 85% of
spines in CA1 and DG, respectively, belonged to a cluster and the
exposure to a novel context increased this proportion to 95% and
94%, respectively. As clusters ranged from 2 to 13 spines, context
exploration significantly increased the average dimension of spine
units, i.e. clusters and single spines taken together, both in the
CA1 and in the DG (Fig.
5
f).
SA-Ch spines also appeared to be non-randomly distributed
across different dendrites: some dendrites had a higher density of
potentiated synapses than nearby dendrites. This was more
7.5’ 1,500 1,000 500 0 –500 50% ΔF/F 1 s +VGCC blockers
a
b
3,000 2,000 1,000 0 –1,000Den Spine Den Spine
SA-Ch ChETA VGCC blockers TTX 3 h CNQX AP5 TTX ACSF + TTX *** *** ***
EGFP SA-Ch ChETA Ch+ Ch– Light Dark Synaptic phospho-CaMKII staining (a.u.) 14,000 12,000 10,000 8,000 6,000 4,000 2,000 0 ** ** NS ** EGFPlight SA-Ch light ChETA light
Dark Dark Dark
pCKII Cherry EGFP pCKII Cherry EGFP
d
c
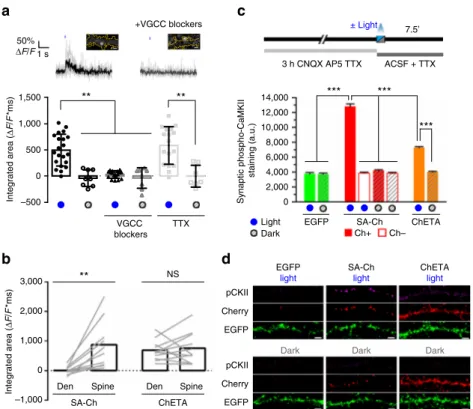
± Light Integrated area ( Δ F /F *ms) Integrated area ( Δ F /F *ms)Fig. 4 Optogenetic activation of SA-Ch in neurons. a Activation of SA-Ch by means of 488 nm laser illumination drives calcium influx in the neuron. GCaMP6s was expressed along with SA-Ch and illuminated at 990 nm. Top, example of GCaMP6sΔF/F time course following 10 ms light stimulation (blue mark above) in ACSF (left, black trace) or in ACSF with voltage-gated calcium channel (VGCC) blockers nifedipine, Ni2+, and Zn2+(right, gray trace). Single traces are in light gray and bold lines are the average. Above images show SA-Chfluorescence in corresponding spines and yellow dotted trace shows neuron profile as inferred from GCaMP6s fluorescence; scale bar, 1 μm. Bottom, integrated area of ΔF/F against time plot after light stimulation for imaged spines with (blue dots below) or without (gray dots) light stimulation. SA-Ch neurons were recorded in standard ACSF (black, circles) or in ACSF in the presence of either VGCC inhibitors (dark gray, triangles) or TTX (light gray, squares); open symbols represent recordings in the same medium as correspondingfilled symbols, without illumination. Data are values for single spines, each represents the average of trains on the same spine, bars are mean± SD. **P < 0.01, Kruskal–Wallis test, Dunn’s post-hoc comparisons. b Illumination of spines in SA-Ch-expressing neurons drives calcium influx, but not when laser illumination is focused on the nearby dendrite. Conversely, ChETA neurons can be excited both by a spine-focused and a dendrite-focused laser beam. **P < 0.01 paired Student’s t-test, two-tailed. NS, not significant at the α = 0.05 level. Lines connect single paired data points, bars are mean.c Outline of time course of the experiment. Cells were pretreated for 3 h with CNQX, AP5, and TTX, to reduce background CaMKII activation. Neurons werefixed 7.5 min after light stimulation and stained for phospho-CaMKII. Spines in SA-Ch-expressing neurons were subgrouped into Cherry-positive (filled bars) and Cherry-negative spines (empty bars). Light stimulation induced a significant increase of phospho-CaMKII staining in SA-Ch-expressing spines ***P < 0.001, one-way ANOVA, Bonferroni comparison of means. Bars are mean ± SEM. d Representative images of data shown in c. Panels show phospho-CaMKII immunofluorescence (p-CKII), anti-Cherry immunofluorescence (Cherry), and EGFP signal. Scale bar, 5μm
2
***
Spine units dimension (n
umber of spines)
SA-Ch rtTA EGFP
CAG-p TRE-p TRE-p
a
c
0.5 0.4 0.3 0.2 0.0 0.1 0.5 0.4 0.3 0.2 0.0 0.1 HC CNT HC CNT CA1 DG F raction of e xpressing spines Cum ulativ e probabilityd
e
1.0 0.0 0.2 0.4 0.6 0.8 1.0 0.0 0.2 0.4 0.6 0.8 2 1 0 2 1 0 1 0 2 1 0***
***
***
Home cage No v el conte xt 1.0 0.0 0.2 0.4 0.6 0.8 1.0 0.0 0.2 0.4 0.6 0.8 0 2 4 6 8 10 0 2 4 6 8 10 10 0 2 4 6 8 10 0 2 4 6 8 Cum ulativ e probability dPP (μm) dPP (μm)*
*
*
*
0 5 10 15 20 0 5 10 15 20 4.0 2.0 1.0 0.5 4.0 2.0 1.0 0.5Spine number Spine number
Increase in probability
Home cage Context
EGFP (Ch positive) EGFP (non Ch)
CA1 DG 0 5 4 3 2 1 HC CNT HC CNT 2 13 2 14 2 10 2 13 95 perc 5 perc
b
f
g
SA-Ch EGFP SA-Ch EGFPHome cage Novel context
CA1 DG
***
***
**
Separ a tion inde x 0.0 0.7 0.6 0.5 0.4 0.3 0.2 0.1 CA1 DG CA1 DG HC CNT 0.0 0.4 0.8 1.2 Separation index 0.4 0.3 0.2 0.0 0.1 F requencyi
h
SA-Ch EGFP SA-Ch EGFP 1 1 1 2 2 2 2 1 s.p. s.r. CA1 DG SA-Ch SA-Ch EGFP***
*
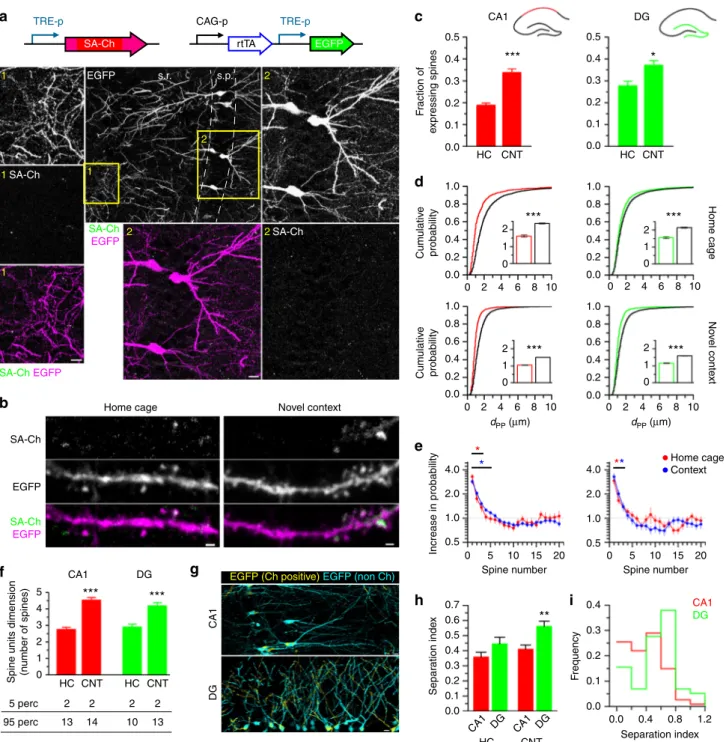
Fig. 5 In vivo synaptic tagging. a Constructs expressed in the hippocampus of electroporated mice. TRE-p is the tetracycline-responsive promoter. Expression of SA-Ch in mouse CA1 after 2d intraperitoneal doxycycline injection. Dendritic (1) and somatic (2) regions (yellow squares in the large-field image) are magnified, showing EGFP, SA-Ch, and merge channels (SA-Ch: green, EGFP: magenta). s.p. stratum pyramidale, s.r. stratum radiatum. b Dendrites expressing SA-Ch in pyramidal neurons in CA1 from animals held in the home cage or exposed to a novel context (see text). c Average fractions of SA-Ch-positive spines in CA1 and DG neurons in home cage (HC) and novel context (CNT) groups. *P < 0.05, ***P < 0.001, Student’s t-test, two-tailed.d Distribution offirst neighbor distance (dPP) for two potentiated spines in CA1 (left) and in the DG (right). Graphs on the top represent data from home-caged animals, bottom graphs from animals exposed to a novel context. Black lines are the corresponding distributions after randomly shuffling positive/negative assignments to the original spine positions. Insets show, with corresponding colors,first neighbor distance mean ± SEM. ***P < 0.001 Kruskal–Wallis test, followed by Dunn’s comparison. e Measured increase in estimated probability to be potentiated themselves for the first 20 neighbors of a potentiated spines in CA1 (left panel) and DG (right panel) neurons. Under the assumption of random distribution of potentiated spines, this value should be 1 uniformly. *P < 0.01, z-test from the reference value of 1. Points are mean ± SEM. f Mean number of spines per unit (cluster and single spines). Bottom table represents the 5th and 95th percentiles of cluster dimension. ***P < 0.001 Kruskal–Wallis test, Dunn’s comparison. Bars are mean ± SEM. g Localization of SA-Ch-positive regions (yellow) and SA-Ch-negative region (cyan). Original images are in Supplementary Fig.12.h Separation index (see text for details). A large separation index value indicates that the number of potentiated spine in the dendrite strongly deviates from the expected value if potentiated spines were equally distributed in neurons from the same slice. **P < 0.01 Kruskal–Wallis test, Dunn’s comparison. i Separation index distribution of dendrites in CA1 and the DG in context-exposed animals. Scale bar, 10μm (a, g) and 1 μm (b)
strikingly observed in the DG granule cells, whereas CA1
pyramidal neurons were more uniform (Fig.
5
g and
Supplemen-tary Fig.
12
b). We calculated the difference between the number
of SA-Ch spines in each dendrite and the number that would be
expected if potentiated spines were uniformly distributed in
dendrites in the same region of the slice (Separation Index, see
Methods). We found that in the new context-exposed mice the
dendrites of DG granule cells had a significantly higher
Separation Index (SI) than CA1 pyramidal neurons (Fig.
5
h). In
addition, the majority of DG neurons had a high SI, implying
that, in the DG, neurons were divided in two populations with
either a high or a low number of potentiated synapses (Fig.
5
i).
Discussion
The current paradigm in memory studies, based on theoretical
and experimental data, points to synaptic ensembles underlying
the generation and storage of new memories
6,12,13. Accordingly,
learning different tasks involves different sets of spines, which
further supports the idea that spines, and not whole neurons, are
the more relevant entities for information storage in the
brain
51,52. At the same time, methods for activity mapping and
causally probing memories heavily rely on promoters from
immediate early genes
9,13.
We propose here the SA approach to refine the investigation
on memory (and other) circuits to map brain activity at the
synaptic scale. pSA plasmids combine activity-dependent
trans-lation at potentiated synapses with Arc mRNA regulatory
sequences and a protein tag to drive synaptic expression of any
desired gene (including, but not limited to, opsins).
Our
findings are consistent with most observations implying a
role for Arc in synapse potentiation
23,53. SA-Ch is preferentially
found at larger spines (Fig.
2
e) and is expressed at focally
sti-mulated spines (Fig.
3
). We tested regulatory sequences and DTEs
from other mRNAs, including BDNF, which is also targeted to
dendrites in an activity-dependent manner
54. However, the
BDNF splice variants that we employed (exons IIa, IIc, and VI),
out of the many BDNF transcripts
54, were much less responsive
to neural activity, either due to high basal translation (IIa and IIc)
or to almost undetectable translation competence (VI form). The
Arc sequences that we tested gave the best results; however, we
envisage that background expression can be further lowered to
increase synaptic enrichment; in any case, the use of less strong or
tunable promoters (as the TRE promoter) can also be helpful, as
our data in vivo suggest. This would also help further reducing
the residual somatic expression.
Current imaging techniques to label synapses, such as
mGRASP, can be modified to restrict synapse mapping to
determinate regions, projections or cellular types with
long-established genetic or tracing technologies
55. On the other hand,
efforts in the implementation of activity sensors have made it
possible to record real-time synapse activity in response to
sen-sory stimulations
40,56. However, activity alone does not imply the
involvement in the storage of a defined status and not all active
synapses become potentiated
39,56. Recently, activity reporter
SEP-GluA1, which labels synapses incorporating
fluorescent AMPA
receptor subunit 1 on the membrane surface, has been proposed
as a marker for synapse potentiation
36,57. AMPA receptors are
rapidly exposed on the surface of spines that undergo sustained
stimulation
57, which is generally accepted to be responsible for
the increased currents following potentiation. However,
poten-tiation comprises dissociable events, and different forms of
potentiation exist
58. Some do not last indefinitely and AMPA
receptors incorporation may be transient
33. Instead, our strategy
can act as reporter of a late-phase, translation-dependent LTP
(L-LTP)
58and can be used to map potentiated synapses across a
population of neurons in memory tasks, thus enabling to identify
candidate
“synaptic engrams.” Indeed, SA-Ch significantly
cor-relates with SEP-GluA1 accumulation on postsynaptic sites;
however, spines with lower SEP-GluA1 enrichment were also in
many cases devoid of SA-Ch (Fig.
2
f), suggesting that SA proteins
would tag the subpopulation of SEP-GluA1-expressing spines
that undergo L-LTP, a likely candidate for memory storage unit
in the brain
13.
Work in acute hippocampal slices identified potentiated spines
in CA1 with the incorporation of
fluorescent phalloidin
59.
Recently, the incorporation of
fluorescently tagged AMPA
receptors has been observed in vivo in the mouse barrel cortex
following whisker stimulation
60, providing the
first observation of
potentiated spines in vivo. Here we demonstrate the usefulness of
the SA approach by labeling synapses that underwent
translational-dependent potentiation in the hippocampus of live
mice exploring a novel context. Exposure to a novel environment
has been linked to an increase in active neurons, as identified by
c-fos staining or catFISH technique
46,47, but no parallel has been
done so far with long-lasting synaptic changes such as
translation-dependent LTP.
Previous work identified functional clusters of synapses in
cortical areas and hippocampal slices (spines with correlated
activity)
36,40,61; clustering has been proposed in models for
cooperative integration of synaptic activity in neuron
computa-tion, sensory integracomputa-tion, and memory formation
62–64. We
identified clusters of potentiated synapses in hippocampal regions
CA1 and DG, which comprised most of the potentiated spines. It
must be noted that the exact number of spines in each cluster is
dependent on the chosen cutoff (2
μm) in our working definition.
However, we consider this choice reasonable, when taking into
account the physical dimensions of a typical mushroom spine.
Indeed, the range (2–13 spines) that we calculated for the cluster
dimension (Fig.
5
f) is in accordance to what reported for
func-tional clusters identified by calcium imaging of synaptic activity
(2–12 synapses)
61.
Our approach enabled us to map potentiated synapses across
different dendrites, highlighting differences in the distribution
between the DG and the CA1 regions (Fig.
5
h, i). Our data
suggest that single dendrites of granule cells function as a highly
homogeneous unit in terms of activity integration and plasticity,
supporting a role of the DG for pattern separation
15,65. According
to this model, DG cells encode highly orthogonal contextual
information, whereas downstream CA3 and CA1 complete and
process this information. Consistently, whole-cell optogenetic
activation of engram cells in the DG, but not in CA1, served as an
effective contextual stimulus in the fear conditioning protocol
9,
despite other experiments clearly advocating a role for CA1 in the
encoding of contextual information
66.
In order to highlight the role of potentiated synapses in a
memory recall framework, it is necessary to envisage an
experi-mental strategy to selectively act on them, but cell-wide neuron
activation also recruits other learning-related mechanisms at the
cellular level
67. Although subcellular optogenetic stimulation can
be achieved by restricting the illumination pattern down to single
spines
20, this requires a priori knowledge of the sites to be
sti-mulated, which are not always known. Moreover, the feasible
number and sparseness of distinct illumination spots heavily
depend on technological aspects. On the other hand, the
biolo-gically achieved spatial restriction of Channelrhodopsin
expres-sion presented here, would allow unbiased excitation of recently
activated synapses with standard experimental setups for
wide-field illumination. In this scenario, light power should be adjusted
so that the effect of the optical stimulation is similar to
physio-logical synaptic events; from our results in culture, we have found
that although blue light reactivation of the locally expressed
SA-Ch is able to elicit calcium transients in a specific manner, these
evoked calcium signals look somewhat smaller than calcium
events occurring in the same spines spontaneously
(Supplemen-tary Fig.
9
). However, it must be noted that ChETA itself does
not have the greatest photocurrents among the opsin family
25,68and a number of ChR2 variants now exists with larger
photo-currents
69. The majority of these variants differ from the parental
ChR2 by a few point mutations
68, so we expect that the
sub-stitution of ChETA complementary DNA to encode an opsin
with a higher photoconductance would replicate the key
expres-sion features of SA-Ch in tagging potentiated synapses. Changing
the
fluorescent proteins attached to SA-Ch could also increase
photocurrents, as Cherry-fused ChR2 have been sometimes
reported to have a reduced trafficking to the plasma membrane
than fusion proteins of the GFP family
70.
SA-Ch application (or any of its relatives) could help clarifying
the role of synaptic potentiation in the formation and recall of
encoded memories. Synapse re-excitation could be performed
more physiologically than what existing technologies used to
tag and reactivate whole neurons can achieve. For instance,
the work presented in this paper lays the ground for the use of
SA-Ch to test the hypothesis of a
“synaptic engram,” parallel
to the identified “population engram”
6,12,13. It is likely to be
that the two activity-tagging approaches (cellular vs. synaptic)
would give similar results where there is large identity overlap
between the unit of plasticity and the single neuron, as in the
DG
15,63,71. On the other hand, CA1 neurons receive multiple
converging inputs whose crosstalk, following activation by
current whole-cell optogenetic protocols, is likely to result in
memory occlusion
9.
Taking advantage of Arc RNA regulatory sequences, we were
able to express a Channelrhodopsin variant at synapses
under-going potentiation, establishing a novel tool to map and reactivate
these sites. Recently, a novel approach towards the development
of
“synaptic optogenetic” strategies was proposed
72; by expressing
a photoactivable form of Rac1 in the motor cortex, Kasai and
colleagues
72demonstrated that the light-induced shrinkage of
recently potentiated spines severely impairs motor learning. That
study emphasizes the necessity of controlling selected inputs,
rather than a selected population of neurons, underscoring the
interest of synaptic optogenetic approaches, such as the one
presented here. However, by dramatically altering actin dynamics,
such approach determined a drastic alteration of the spine
structure; therefore, the interference with the memory trace could
not be reverted. Accordingly, it was not possible to perform a
memory recall task, as the intervention was purely destructive.
Although establishing a
first important step in highlighting, and
interfering with, established engrams at the synaptic level, the
sufficiency of those potentiated synaptic inputs for memory
encoding remains to be addressed. Our approach allows, in
principle, to re-excite those synapses. In addition, it is likely to be
naturally extended to any variant opsin family, thus enabling the
bidirectional interference of the synaptic inputs involved in
cir-cuit traces and memories.
Methods
Constructs. Palmitoyl-Cherry-MS2 was generated by cloning palmitoylation sequence MLCCMRRTKQ from GAP43 to Cherry N-terminal, whereas MS2 sequence was derived from plasmid pSL-MS2 12X (Addgene 27119). Arc DTE comprises nucleotides 2035–2701 of Arc transcript (NCBI NM_019361.1), in accordance to ref.24. EGFP-MS2 coat protein-NLS was constructed and cloned into pcDNA3.1(+) (Invitrogen) from plasmid Cherry-MS2 coat protein-NLS (a gift from A. Marcello, ICGEB Trieste). ChETA-Cherry cDNA was PCR amplified from plasmid pAAV-CaMKII-hChR2 (E123A)-mCherry-WPRE25. ChETA-Cherry-SYN (S-Ch) was generated by cloning 5′-GCCGCCGCTGCTTCAATTGAAAGT-GACGTGGCCGCAGCTGCCGAAACCCAGGTGTAATAA-3′ oligo sequence (IDT Technologies) in frame to ChETA-Cherry using unique site BglII site at 3 ′-end of Cherry cDNA. A-Ch and SA-Ch constructs were generated by inserting Arc
5′- and 3′-UTRs before and after ChETA-Cherry and S-Ch cDNA, respectively. Arc UTRs were amplified from plasmid pCMV-ArcF encompassing whole 5′-UTR andfirst 13 nucleotides of Arc CDS, where start ATG was mutated to ACG, and whole 3′-UTR24. MS2 sequence was inserted downstream STOP codon before 3′-UTR. Constructs were cloned into plasmid pcDNA3.1(+) (Invitrogen) under cytomegalovirus (CMV) promoter. EGFP was expressed from plasmid pN1-EGFP (Clontech). Homer1c-EGFP was kindly provided by D. Choquet, Institut inter-disciplinaire de Neurosciences CNRS, Université Bordeaux 2. Palmitoyl-Turquoise2 is Addgene plasmid 36209. GCaMP6s was expressed from pGP-CMV-GCaMP6s (Addgene 40753). SEP-GluA1 was expressed from Addgene plasmid 64942. For in utero electroporation, SA-Ch was inserted downstream of third-generation TRE promoter48in a plasmid containing the minimal CK0.4 promoter driving the expression of rtTA2S-M2 transactivator amplified from vector TMPrtTA73, yielding pTRE3-SA-CK-rtTA. Parental plasmid was custom synthe-sised by Life Technologies (USA). It was cotransfected with plasmid pCAGGS-rtTA-TRE-EGFP, which was generated by cloning rtTA2S-M2 and TRE-EGFP sequences into plasmid pCAGGS49. TRE-EGFP was amplified by PCR from plasmid pSIN-TRE-EGFP, provided by Dr L. Marchetti. pCAGGS-rtTA-IRES-mCherry was generated analogously and IRES sequence was derived from pCAGGS49.
Cell culture. Primary cortical and hippocampal neurons were extracted from P0 B6129 mice as follows: after surgery and tissue isolation, tissue was triturated in cold calcium-free Hank's balanced salt solution with 100 U ml−1penicillin, 0.1 mg ml−1streptomycin, and digested in 0.1% trypsin, followed by inactivation in 10% fetal bovine serum (FBS) Dulbecco's modified Eagle's medium (Invitrogen) 100 U ml−1DNase. Neurons were seeded on previously poly-D-lysine-coated glass cov-erslips or plasma-treated poly-D-lysine-coated Willco dishes. For initial plating, neurons were maintained in Neurobasal-A medium (Invitrogen) supplemented with 4.5 g l−1D-glucose, 10% FBS, 2% B27 (Invitrogen), 1% Glutamax (Invitrogen), 1 mM pyruvate, 4μM reduced glutathione, and 12.5 μM glutamate. From the fol-lowing day on, neurons were grown in Neurobasal-A medium (Invitrogen) sup-plemented with 2% B27 (Invitrogen), 1% Glutamax (Invitrogen), and 1–10 μg ml−1 gentamicin. Medium was refreshed every 2–4 days. For experiments in Fig.1a and Supplementary Fig. 1, div 12 neurons were used. All other experiments employed div 17–19 neurons. Neurons were transfected with calcium phosphate method the day before experiment. The procedure was approved by the National Council for Research Ethical Committee.
Treatments. Neurons as in Fig.1were treated for 1 h with either KCl to afinal concentration of 10 mM, or with saline, added to bath. Otherwise, treatments are (i) BDNF: hBDNF (Alomone) 100 ng ml−190′; (ii) KCl: KCl 10 mM 90′; (iii) LTP: 20′ in 2 mM CaCl2, 1 mM MgCl2ACSF (artificial cerebrospinal fluid: 136 mM NaCl, 2.5 mM KCl, 10 mM glucose, 2 mM sodium pyruvate, 1 mM ascorbic acid, 0.5 mM myo-inositol, 10 mM HEPES pH 7.3, with 2 mM CaCl2and 1 mM MgCl2unless otherwise indicated) followed by 10′ in 2 mM CaCl2/Mg2+-free ACSF, 5.4 mM KCl, 100μM NMDA (Sigma-Aldrich, Saint Louis, MO), 20 μM glycine (Sigma-Aldrich), and 0.1μM rolipram (Sigma-Aldrich) as described74, followed by 90′ in culture medium; (iv) AP5: 50 μM AP5 (Sigma-Aldrich) from transfection to analysis (17–20 h). See also Supplementary Fig.6for temporal outline of treatments. Stimulated neurons in Fig.2e are treated with 20′ 2 mM CaCl2, 1 mM MgCl2ACSF followed by 5′ in 2 mM CaCl2/Mg2+-free ACSF, 60 mM KCl, 100μM NMDA (Sigma-Aldrich), 20 μM glycine (Sigma-Aldrich), and fixed after 90′ (see below).
Immunofluorescence. Neurons expressing A-Ch or SA-Ch were fixed in 2% formaldehyde 5% sucrose phosphate-buffered saline (PBS) and permeabilized in 0.1% Triton X-100. After PBS washing, samples were blocked in 1% bovine serum albumin (BSA) PBS, and primary antibodies anti-Cherry (GeneTex GTX59788, 1:500) and anti-PSD95 (Abcam ab9909, 1:600) were used in 0.5% BSA PBS. After washing, primary antibodies were detected with anti-rabbit-TRITC (Sigma-Aldrich T6778, 1:200) and anti-mouse-Alexa647 (Thermo Fisher A32728, 1:200) in 0.5% BSA PBS. Coverslips were mounted in Fluoroshield (Sigma-Aldrich) mounting medium. Hippocampal neurons expressing EGFP, ChETA/EGFP, S-Ch/EGFP, or SA-Ch/EGFP for 24 h were processed as above. Primary antibody was 1:2,500 anti-MAP2 (Abcam ab5392) and it was detected with anti-chicken-Alexa647 (Abcam ab150171, 1:250). For surface NMDAR/AMPAR immunostaining, div 9 neurons were transfected with SA-Ch and palmitoyl-Turquoise2, or palmitoyl-Turquoise2 alone; on the third day from transfection, neurons werefixed in 4% formaldehyde, 5% sucrose PBS and washed, blocked in 5% BSA PBS, and stained with 1:500 anti-GluR1-NT (Millipore MAB2263) and 1:500 anti-GluN1 (Alomone AGC-001), and followed by 1:200 mouse-Alexa488 (Thermo Fisher A32723)/1:200 anti-rabbit-Alexa647 (Thermo Fisher A32733) and mounting.
Microscopy. Optical sections (512 × 512 pixels) were acquired with a confocal microscope (Leica TCS SP5 SMD on an inverted DM6000 microscope) using an oil objective HCX PL APO CS 40 × (numerical aperture NA= 1.25), and pinhole was set to 1.47 AU. Digital zoom was adjusted for sampling spines correctly. For whole-cell reconstruction, z-stacks were acquired every 0.5μm. Sequential illumination