La presente tesi è stata prodotta nell’ambito della Scuola di Dottorato in Scienze Biomediche dell’Università degli Studi di Sassari, a.a. 2011/2012 – XXVII ciclo, con il supporto di una borsa di studio finanziata con le risorse del P.O.R. SARDEGNA F.S.E. 2007-2013 - Obiettivo competitività regionale e occupazione, Asse IV Capitale umano, Linea di Attività l.3.1.
UNI VERSI TÀ DEGLI STUDI DI SASSARI
SCUOLA DI DOTTORATO DI RI CERCA I N SCI ENZE BI OM EDI CHE Direttore della Scuola: Prof. Andrea Fausto Piana
I NDI RI ZZO I N ODONTOSTOM ATOLOGI A PREVENTI VA
XXVI I I CI CLO
Prevention, diagnosis and minimally invasive
treatment of dental caries.
Direttore:
Prof. Andrea Fausto Piana Tutor:
Prof. Guglielmo Campus
Tesi di dottorato di: Dott. Gianfranco Lai
ABSTRACT
Aim: Study the news overtures to prevention, diagnosis and therapy of caries
disease.
Methods: We conducted one randomized controlled clinical trial (RCT), one
cross-sectional study and one systematic review with meta-analysis. The RCT evaluated the efficacy of the Carisolv and CeraBur. In the cross-sectional study we evaluated the efficacy of a new device to detect caries lesions: DIAGNOcam. The systematic review of the literature was conducted to evaluate efficacy of polyols in caries prevention.
Results: We found a significantly difference in terms of time taken between control
group and Carisolv (p<0.001). We found no difference in increment cavity size and in anti-microbial effect between techniques.
In the cross-sectional study we found a higher sensibility of the DIAGNOcam device respect to x-rays to diagnose caries in enamel (k=0.24); no statistically significant difference was found in dentin caries (k=1).
In the meta-analysis we found that xylitol gum showed a good antimicrobial effect against the mutans streptococci than control group (p<0.01); low increment of ΔDMFS at 2 and 3 years follow-up (p<0.01), and low AUC pH than sorbitol gum (p<0.01).
Conclusion: The clinical efficacy of Carisolv and CeraBur seems as reliable as the
rotary instruments. The study on DIAGNOcam showed that this new device might be a useful tool in early caries detection. The xylitol gums showed a role in caries prevention.
CONTENTS
Original Papers________________________________ 4
Introduction___________________________________ 5
Aims________________________________________ 8
Material and Methods___________________________ 9
Results_______________________________________ 21
Discussion____________________________________ 50
Conclusions___________________________________ 58
References____________________________________ 59
The Papers____________________________________ 66
ORIGINAL PAPERS
This thesis is based on the following four papers, which will be referred to in the text by their Roman numerals:
I. The use of polyols in caries prevention: a systematic review and meta-analysis.
Lai G, Lara-Capi C, Cocco F, Cagetti MG, Campus G.
Submitted
II. Digital imaging fiber-optic transillumination device versus radiographic
and clinical examination in detection of dental caries.
Lara-Capi C, Lingström P, Lai G, Cagetti MG, Cocco F, Simark-Mattsson C, Campus G.
Submitted
III. Comparison of Carisolv system vs traditional rotating instruments for
caries removal in the primary dentition: A systematic review and meta-analysis.
Lai G, Lara-Capi, Cocco F, Cagetti MG, Lingström P, Almhöjd U, Campus G.
Acta Odontol Scand. 2015; 73: 569-80
IV. Clinical randomized controlled trial of four different techniques of caries
removal in primary dentition.
Lai G, Lingström P, Sale S, Campus G
INTRODUCTION
Dental caries is one of the most prevalent chronic diseases of people worldwide affecting the majority of individuals in all age groups during their lifetime. Dental caries forms through a complex interaction over time between acid-producing bacteria and fermentable carbohydrate, and many host factors including teeth and saliva (Selwitz RH et al., 2007).
Caries prevention: use of polyols
The use of fluoridated toothpastes, other topically applied fluorides, fluoridated municipal water and pit and fissure sealants, along with dietary improvement, remain mainstays of caries management. These modalities, which are based on high-quality evidence, are the first choice for prevention and control of dental caries (Rethman MP et al., 2011).
Globally, many strategies have focused on the avoidance, or at least the reduction, of sugar intake to prevent dental caries. Despite these efforts, world consumption of sugar continues to increase. The increasing demand for sugar, coupled with its potential detrimental effect on systemic health (obesity, type 2 diabetes mellitus) and oral health (dental caries), has led to increasing interest in sugar substitutes. One such class of substitutes known as “polyols” or “sugar alcohols” is non-fermentable sugars (Deshpande A et al., 2008).
Non-fluoride agents may serve as adjunctive therapeutics for preventing, arresting or even reversing dental caries.
The most common polyols are sorbitol and xylitol, and they have been used extensively as sugar substitutes in chewing gum. Experts recognize that regular use of polyol-containing chewing gums could play a role in preventing caries by increasing salivary flow through mastication, reversing decreases in plaque pH and enhancing remineralisation of subsurface enamel lesions. Xylitol also may decrease the amount of dental caries as a result of its unique ability to alter microbial composition by reducing the viability and survival of virulent Streptococcus mutans (Deshpande A et al., 2008; Rethman MP et al., 2011).
Erythritol is a natural sugar alcohol of the tetritol type, which has been recently approved for use in the United States and throughout much of the world. Some studies have shown that erythritol has a similar effect on the risk factors of caries and seems to inhibit the growth of certain mutans streptococci strains as xylitol. Erythritol is considered to be a non-acidogenic substance (Honkala S et al., 2014; Mäkinen KK, 2011).
Diagnosis
The principal methods currently used to diagnose carious lesion are visual and visual/tactile examination matched with radiographic assessments (Bader, JD 2002). Although the clinical examination was well established and universally taught, clinicians and patients did not generally recognised that this method was imperfect. While the clinical examination was mainly used to identify lesions on occlusal surface, the detection of caries in interproximal space was achieved using bitewing radiographs. The combined use of these two methods had an overall sensitivity of 50% and a specificity of 87% (Selwitz RH et al., 2007). In also limitation to reveal the early stage of disease have been reported (Bader JD et al., 2002). In addition, the risk related to radiographic exposure needs to be taken into consideration (Lodlow JB et al., 1997).
Improvement of technology for caries detection is evident. As a complementing aid to visual examination, a Digital Imaging Fiber-Optic Transillumination Device (DIFOTI) was designed with the task to support clinicians in the identification of caries lesion in different stages of the disease (Astvaldsdòttir A et al., 2012; Keem S
et al., 1997; Schneiderman A et al., 1997). By using the specific optical properties of
a carious tissue, trans-illumination of teeth with DIFOTI amplifies the change in scattering and absorption of photons and thereby, makes the lesion appear as a dark shadow (Astvaldsdòttir A et al., 2012). DIFOTI was developed to facilitate in real time detection, localization and quantitative characterization of lesions (Schneiderman A et al., 1997).
Therapy
The modern approach to caries treatment indicated the need to remove only dental tissue to the extent that is strictly necessary for treatment (Lozano-Chourio MA et
al., 2006). Modern restorative dentistry offers alternatives to the traditional tissue
removal using conventional drilling instrument: the possible alternative are the chemo mechanical removal and the new type of bur.
In 1999, a product from MediTeam group called Carisolv® was marketed. This contains sodium hypochlorite and three natural amino acids: lysine, leucine and glutamic acid. When the gel of three amino acids (lysine, leucine and glutamic acid); 53mM and the gel containing 0.27M hypochlorite are mixed, amino acids bind chlorine and form chloramines whit pH of 11. This chlorination affects the secondary and/or quaternary structure of the collagen, by disrupting hydrogen bonding and causing proteolytic reaction. That does not affect healthy dentine because amino acids act as homing devices for active chlorine. The chlorine atom in hypochlorite is transferred to the amino group of each amino acid and in this way that is made less reactive and less aggressive to healthy tissue (Bohari MR et al., 2012). In contrast
with conventional excavators and drills used in the traditional caries removal, in Carisolv technique carious dentine is removed using specially designed instrument, all of supposed to reduce the risk of removing intact dentine.
The first in vitro investigation on the use of Carisolv, in primary and permanent teeth was published in 1998. It was reported that Carisolv had been compared in controlled clinical trials in permanent and in primary dentition to the conventional mechanical method and the removal of caries by hand instruments (Kavvadia K et al., 2004). Numerous clinical study was reported the reliability of Carisolv although this product needs significantly longer working time (Bergmann J et al., 2005; Kavvadia K et al., 2004; Lozano-Chourio MA et al., 2006).
The most conventional method of removing caries involves the use of steel or tungsten carbide burs mounted in a low-speed contra-angle. Although very efficient in term of time spent for caries removal, the decision to stop caries removal using these burs is very subjective, and basically depends on the operator’s background and clinical experience. The recently marketed CeraBur (Komer-Brasseler, Lemgo, Germany) is a self-limiting ceramic bur (alumina-based with stabilized zirconia), which according to the manufacture efficiently cut infected, soft dentin, while hardly acts on hard, sound tissue (Dammaschke T et al., 2008).
Caries detector dyes based on propylene glycol were developed in order to highlight alteration in dentine collagen structure but publications have shown that clinical and laboratory results produced are open to considerable user-interpretation (Neves Ade A et al., 2011).
AIMS
The goal of this thesis was to gain knowledge about difference aspects of caries management. In more details, the aims of this thesis were:
To identify the scientific validation in literature of the role of polyols in caries prevention. (Paper I)
To evaluate the reliability of a Digital Imaging Fiber-Optic Transillumination device (DIFOTI) for the detection of caries lesions vs. clinical or radiographic examinations. In addition, the reliability of DIFOTI method was evaluated in a group of dental professionals. (Paper II)
To evaluate efficacy and reliability of different systems of caries removal versus the traditional method of caries removal. (Paper III and Paper IV)
MATERIAL AND METHODS
Paper I
Focused PICO Question
What is the efficacy in caries prevention, of polyols compared to the sorbitol and/or mannitol and/or maltitol or no intervention group, in terms of ΔDMFS/dmfs, salivary count of Mutans S. and plaque pH?
Eligibility Criteria
The papers included in this systematic review were randomized controlled trials (RCT) assessing the efficacy in caries prevention of chewing gums, tablets, candies and lozenges containing polyols. We selected the studies that involved both children and adults in which gums, tablets, candies or lozenges, contained xylitol, erythritol, maltitol, sorbitol or mannitol, were tested either against control group (sorbitol and/or mannitol and/or maltitol) or versus no intervention group. In addition, we have included studies where experimental agents other than polyols were tested. We considered as primary outcome:
Dental caries increment.
Level of S. Mutans in the saliva. Plaque pH.
We excluded studies where the control group used sucrose in pellets, candies, tablets or lozenges. As well, we excluded studies where subjects had disabilities, wore orthodontics appliances or were pregnant. The studies in which the follow-up was performed under 4 weeks were excluded. For the statistical comparison of incidence of caries the minimum follow-up of 2 years was determined. For the rest of the variables no timing was settled. The length of the experimental period was classified in short-term (between 1 - 5 months), medium-term (between 6 – 11 months) and long-term (more than 12 months). When controls were performed more than one time in the short term, in the medium term or in the long term we have considered the last data performed in the same period. If the polyols were tested in different way with regard to dose and frequency of administration, we choose the data from the group in which the polyols were administer according to the guidelines (Rethman MP et al., 2011). If the follow-ups were longer than the administration period of polyols, we extracted only the data of the three primary outcomes until the last control.
Considering that the dental caries increment could be reported differently in different trials, we decided to include in the meta-analysis only two types of data: decayed-filled-missing tooth (ΔDMFS – Δdmfs) or the data of decayed surface increment. Furthermore, considering that in the studies the clinical examination to determine the presence of caries could have been made according to different methods and the lesions could have been classified in different ways, we established a-priori how to designate the data: data from “combined clinical and radiological examination” were chosen over data from “separated clinical and radiological” and as a second choice we included “only clinical” data when radiological examination was not performed. Data for non-cavitated lesions combined with cavitated lesions was chosen over cavitated-only lesion; when more than one follow-up performed over 2 years was present, we included the data for each follow-up performed.
For the data of S. Mutans count in the saliva we considered for the meta-analysis only the data expressed in CFU/ml. Finally, data of the plaque pH contemplated for the meta-analysis was only from areas under the plaque pH curve for each pH cut-off value presented in the paper. The studies that satisfied the inclusion criteria but data was not serviceable, were included only in the systematic review.
Data Analysis
The outcomes considered in the studies were: the dental caries increment (continuous and dichotomous), salivary S. Mutans count (continuous) and plaque pH (continuous). When the raw data was not present in the text or tables, single authors were contacted to obtain such information. If the authors did not answer the petition, we extracted the information from the graphs. The data comparison of the primary outcome was done separately for the gums, lozenges, tablets and candies. The comparison of DMFS and dmfs index was done separately and if that was not possible we used to comparison the number of new surface or teeth decayed. Within each vector (gum, lozenges, tablets and candies) and for each primary outcome we compared separately data between control group and/or no intervention and experimental polyols group. To compare dichotomous data, a calculation of the Odd Ratio (OR) along with 95% Confidence Intervals (CIs) was used, whereas, for continuous data, the Mean Difference (MD) with the 95% Confidence Intervals (CIs) was calculated. Also, for each comparison the Z-test was used. A Fixed-effect model was applied to reassess all data extracted from the included studies. We compared the data of salivary count of S. Mutans and plaque pH at baseline in the short- medium- and at long term. For the dental caries increment we have compared data only at follow-ups. Data of gums, lozenges, tablets and candies were compared separately. Analysis was performed using Review Manager 5.3 software provided by the Cochrane Collaboration (The Cochrane Collaboration, 2012).
For the identification of studies to be included or considered for the review we developed two search strategies: one was used in two electronic databases
(PUBMED and EMBASE) (tab. 1) and the other was used in SCOPUS (tab. 2). We did not place any restriction on language or date of publication when searching the electronic database.
Search Strategy
We searched the following electronic databases: • MEDLINE via PUBMED (to March 2015) • EMBASE (to March 2015)
• SCOPUS (to March 2015)
A comparison of the different searches was carried out to exclude the repeated studies. Then, two authors, tasked with to evaluating the eligibility of the papers, examined independently all abstracts and titles of the studies found. If the information contained in abstract or in the title was no enough to determinate if the studies met inclusion criteria, the full paper was obtained. All studies that appeared to meet inclusion criteria were obtained in the full text format. The two authors assessed the papers independently to establish whether the studies met the inclusion criteria. Disagreements were resolved by discussion.
#1 randomized clinical trial [pt]
#2 dental caries AND (candies OR chewing gums OR lozenges OR mannitol
OR maltitol OR erythritol OR sorbitol OR xylitol OR sugar alcohols OR polyols OR plaque pH OR streptococcus mutans OR lactobacillus) [tiab]
#3 dmft AND (candies OR chewing gums OR lozenges OR mannitol OR
maltitol OR erythritol OR sorbitol OR xylitol OR sugar alcohols OR polyols) [tiab]
#4 lactobacillus AND (candies OR chewing gums OR lozenges OR mannitol
OR maltitol OR erythritol OR sorbitol OR xylitol OR sugar alcohols OR polyols OR) [tiab]
5# streptococcus mutans AND (candies OR chewing gums OR lozenges OR
mannitol OR maltitol OR erythritol OR sorbitol OR xylitol OR sugar alcohols OR polyols OR) [tiab]
6# plaque pH AND (candies OR chewing gums OR lozenges OR mannitol OR
maltitol OR erythritol OR sorbitol OR xylitol OR sugar alcohols OR polyols OR) [tiab]
#7 #2 OR #3 OR #4 OR #5 OR #6
#1 randomized clinical trial [tiab]
#2 dental caries AND (candies OR chewing gums OR lozenges OR mannitol
OR maltitol OR erythritol OR sorbitol OR xylitol OR sugar alcohols OR polyols OR plaque pH OR streptococcus mutans OR lactobacillus) [tiab]
#3 dmft AND (candies OR chewing gums OR lozenges OR mannitol OR
maltitol OR erythritol OR sorbitol OR xylitol OR sugar alcohols OR polyols) [tiab]
#4 lactobacillus AND (candies OR chewing gums OR lozenges OR mannitol
OR maltitol OR erythritol OR sorbitol OR xylitol OR sugar alcohols OR polyols OR) [tiab]
5# streptococcus mutans AND (candies OR chewing gums OR lozenges OR
mannitol OR maltitol OR erythritol OR sorbitol OR xylitol OR sugar alcohols OR polyols OR) [tiab]
6# plaque pH AND (candies OR chewing gums OR lozenges OR mannitol OR
maltitol OR erythritol OR sorbitol OR xylitol OR sugar alcohols OR polyols OR) [tiab]
#7 #1 OR #2 OR #3 OR #4 OR #5 OR #6
Tab. 2 Search strategy used in SCOPUS database
Paper II
The study was approved by the Ethical Committee at the University of Sassari
(authorization number 389/2013) and it was conducted over 6 weeks from June 9th to
July 15th 2014.
Study design
The study was designed in two different parts: the first one was on the comparison among three detection methods (DIFOTI, bitewing radiographs and clinical examination), the second one was on the reliability among dental professionals using DIFOTI imagines derived by the first part.
Comparison among three detection methods Detection methods
The new KaVo DIAGNOcam 2170 is a camera system that uses the tooth's structure to verify occlusal, approximal and secondary caries lesions when the tooth is trans-illuminated. A digital video camera records the image and displays it on a computer screen.
For the radiographic examination, Planmeca intraoral radiographic equipment (Planmeca, Helsinki, Finland) and Kodak UltraSpeed DF42 films, with settings of 70 kV and 7 mA and an exposure time of 0.25 s, were used for bitewing radiographs.
The radiographs were manually developed via conventional standard conditions and standard processing times, and examined according to O’Mullane criteria (O’Mullane DM et al., 1997).
Clinical examination was performed under standard conditions. Subjects were seated in a dental unit and teeth were examined using a plan mirror (Hahnenkratt, Königsbach, Germany) and the WHO CPITN ballpoint probe (Asa-Dental, Milan, Italy) under optimal light.
Calibration of the examiners
Calibration exercises for all the three methods (visual clinical caries diagnostic system (ICDAS), DIAGNOcam unit and radiographic examination) were carried out by two dentists before the start of the study. One of the authors (GCampus) acted as benchmark, training and calibrating the two examiners. The calibration process was divided for each diagnostic method in four steps:
lectures regarding the disease, the method (i.e. ICDAS, DIAGNOcam, x-ray), for eight hours;
first examination, no discussion was allowed between the examiners and the dental advisors as to the interpretation of the criteria during the calibration sessions;
re-valuation by the examiners after 72 hours for the clinical examination and after one week for the DIAGNOcam and x-ray;
evaluation of the agreement or disagreement and statistical analysis.
Fifty volunteers were clinically examined for caries lesions presence in a dental chair using the ICDAS criteria and re-examined after 72 hours. Intra- and inter-examiner reliability was calculated through per cent agreement and Cohen’s Kappa statistics. Good inter-examiner reliability was found with no significant difference from benchmark values (p=0.15) and a low mean square of error (0.47). The Pearson’s
correlation coefficient between the two examiners was high (r = 0.83, p < 0.01, R2 =
0.71). Intra-examiner reliability was also high, Cohen’s K=0.88.
Forty extracted human teeth (10 premolars and 30 molars), in total 80 approximal and 40 occlusal surfaces, were selected for the calibration of the DIFOTI device and the radiographic examination. The teeth were selected from a pool of extracted teeth from the Department of Oral Surgery of the University of Sassari. After extraction, the teeth were immediately collected in vials containing distilled water first, and then were carefully cleaned of soft tissues and calculus, and frozen at -20° until used. Selection criteria match the line of the first evaluation. Evaluations were carried out at one-week interval; Kappa values for inter- and intra-examiner agreement were high for both methods (0.79 for DIFOTI and 0.83 for x-ray). The Pearson’s
The clinical examiner did not have the opportunity to look at DIAGNOcam (CAMo/a) or BW images for the entire period.
Sample
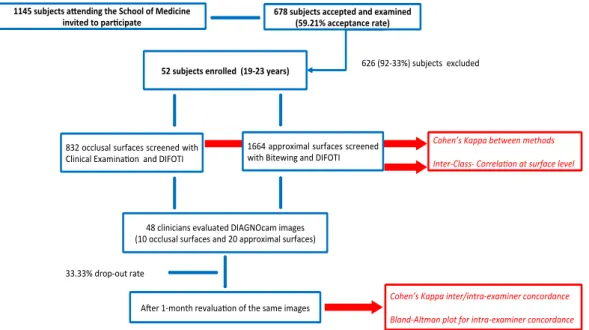
The study population consisted of students of the School of Medicine of the University of Sassari, Italy. To be suitable for enrolment, subjects had to meet these inclusion criteria: no missing teeth, no secondary caries and no fillings in premolars or molars. The exclusion criteria were subjects wearing fixed orthodontic appliances and subjects unable to be exposed to x-rays for medical/specific reasons. All students (n=1145) attending the School of Medicine were invited to participate via email/leaflet where the aim of the study was described in detail. A total of 678 students accepted and were examined (59.2% acceptance rate) and 52 subjects (19-23 years, mean age 21.2±1.2) fulfilled the inclusion/exclusion criteria.
Power analysis (G*Power 3 software) was performed to establish the number of subjects needed to evaluate the estimated difference in caries diagnosis using DIFOTI and/or clinical evaluation and x-ray. Data (Virajsilp V et al., 2005) related to the reliability of a two diagnostic methods were used to calculate the sample size, even if data used were on primary teeth. The standardized effect was set at 0.39 with a sample size of 48 subjects and an upper 95% one- sided confidence limit of 0.52. All subjects (n=52) that fulfilled the inclusion/exclusion criteria were enrolled. Each subject was codified with a number in order to protect his/her identity. The flow chart of the study is displayed in figure 1.
The DIFOTI device was used to assess caries lesions in occlusal surfaces (CAMo) and in approximal surfaces (CAMa). As well, a clinical examination of the occlusal surfaces (CE) and a radiographic examination (BW) for approximal surfaces were performed.
Each tooth were cleaned for 30 seconds with a prophylaxis paste (Clinpro™ Prophy Paste: 3M ESPE Dental Products, USA) and then rinsed by a water spray for 10 seconds. The clinical examination was performed under standardized conditions describe above after drying teeth for 5 seconds. The students were examined and analysed during the same day by both examiners, first attending the clinical and radiographic examination and afterwards they were asked to go to another room where the DIFOTI device was installed with a computer in a dental chair. The International Caries Detection and Assessment System (ICDAS) was recorded for both enamel and dentinal lesions (International Caries Detection and Assessment System Coordinating Committee, 2005; Ismail AI et al., 2007; Honkala E et al., 2011). The radiographs were taken using an 8-inchround cone that was placed in contact with the ring of the film-holding system (RINN XCP, Dentsply, York), which in turn was placed in contact with the patient’s cheek during exposure. Not perfectly clear or overlapping images were taken a second time. Then the DIFOTI device was used according to the manufacturer’s instructions, placing the mouthpiece
over the occlusal surfaces. The image appeared in real time on the computer monitor, and the examiner saved it in the electronic patient record.
The ICDAS scores were performed on the occlusal surface. The DIAGNOcam was used for the detection of occlusal and approximal caries at enamel or dentine. When a defined approximal shadow in the enamel was present, it was scored as 1 and when reaching into the dentine it was scored as 2. Due to the impossibility to measure the lesion vertically all dark occlusal areas were scored as 1.
Radiographs were examined according to O’Mullane criteria (O’Mullane DM et al., 1997) and mesial and distal surfaces were assessed.
Fig. 1 Flowchart of experimental design to collect subject to test DIAGNOcam device
Reliability among dental professionals using DIFOTI
Forty-eight Italian dental professionals with no experience of the DIFOTI device were asked to participate in the second part of the study. The professional experience was at least 7 years. The day of the study they underwent at 60-minute training session describing the DIFOTI technology and the DIAGNOcam by one of the authors (CLC). Immediately after the training session, each participant had to diagnose ten teeth imagines randomly obtained from the first part of the study, analysing 10 occlusal, 10 mesial and 10 distal surfaces. Participants were asked to fill in a form containing two possible answers (1 - presence of caries, 2 - absence of caries) (EVA1). One month later, participants were contacted via email and were asked to revaluate the same images with the same criteria (EVA2). These results were compared with their previous answers.
Statistical Analysis
All data were analysed using STATA 13. For all analysis a p-value<0.05 was considered statistically significant. The general grade of accordance between the different detection methods was evaluated using the Cohen’s Kappa (Cohen J et al., 1960), while the reproducibility for the two methods for each surfaces (occlusal or approximal) was assessed using Intra-Class Correlation coefficients (ICC). ICC values equal to 0 represent agreement equivalent to that expected by chance, while 1 represents full agreement.
The inter-examiner DIFOTI reliability among dental professionals compared to the results derived from DIAGNOcam analysis was evaluated categorizing the kappa value of each professional respect to DIAGNOcam following the criteria described by Landis and Koch (Landis JR et al., 1997), who characterized values < 0 as indicating no concordance and 0-0.20 as slight, 0.21-0.40 as fair, 0.41-0.60 as moderate, 0.61-0.80 as substantial, and 0.81-1 as almost perfect concordance. The method by Bland and Altman (Bland JM et al., 1986) was used to display the variability of the two examinations (EVA1 and EVA2) by each examiner and the plot of EVA1 respect to the DIAGNOcam results, the plot of EVA2 respect to DIAGNOcam and the comparison between EVA1 and EVA2. This method allows to investigate the existence of any systematic difference between the measurements and to identify possible outliers.
Paper III
The systematic review was performed following the guidelines of the Transparent Reporting of Systematic Reviews and Meta-Analyses (Moher D et al., 2009).
Focused PICO question
In primary dentition, what is the efficacy of Carisolv in caries removal rate (clinically appreciated) compared to the traditional drill technique, the clinical efficiency (treatment time) and patient’s comfort (need of anaesthesia)?
Eligibility criteria
The studies included in the present review are Clinical Trials, Randomized Clinical Trials and Controlled Trials assessing the efficacy on the primary dentition of Carisolv compared to traditional mechanical caries removal (control) with drilling instruments. Only studies where total caries removal in each group was completed using Carisolv systems or rotary instruments used without any time limit were considered eligible. The studies including other experimental groups in addition to Carisolv and drilling were also included in this review. Studies assessing the complete caries removal different from clinical criteria (i.e. using a sharp probe) were excluded.
For the identification of studies to evaluate for this review, a unique search strategy to be applied for each database research was developed. The following key words were used: “Carisolv” and “Chemo mechanical Caries Removal”. No Mesh term match was found. The terms were searched following the Boolean term ‘OR’ for a total of three inquiries.
Database research:
. MEDLINE via PUBMED (from 1948 to December 2014); . Web of Science (from 1948 to December 2014); and . SCOPUS (from 1969 to December 2014).
A comparison of the different searches was carried out to delete the repeated studies. Then, two authors (GL and CLC), on charge to evaluate the eligibility of the studies, examined independently all abstracts of the selected papers. If an abstract didn’t supply enough information to determine if the paper met the inclusion criteria, the full report was obtained. All studies, which appeared to meet the inclusion criteria, were obtained in the full text format. The two authors assessed the papers independently, to establish whether or not the studies met the inclusion criteria. Disagreements were resolved by discussion. If not possible, other authors were consulted.
Data analysis
The outcomes considered in the studies were: the caries removal rate clinically appreciated (binary yes/ no), the time required to complete the tissue removal (continuous) and the pain threshold during the procedure, assessed through the need for local anaesthesia by patients (binary yes/no). When raw data was not available in the text, tables or graphs, single authors were contacted to obtain such information. To com- pare dichotomous data, a calculation of the Odd Ratio (OR) along with 95% Confidence Intervals (CIs) was used, whereas, for continuous data, the Mean Difference (MD) with 99% Confidence Intervals (CIs) was calculated. Also, for each comparison the Z-test was used. A random-effect model was applied to reassess all data extracted from the included studies.
Analysis was performed using Review Manager 5.3 software provided by the Cochrane Collaboration (The Cochrane Collaboration, 2012).
Paper IV
This prospective, randomized and controlled clinical trial was performed at the Faculty of Medicine and Surgery, Sassari University between March 2013 and December 2014.
Experimental Design
Before starting the study, there was a preparation period. The training lasted 4 weeks. The operator (GL), who performed the clinical procedures of the study, reached a good clinical in vivo agreement with the benchmark operator (GC) about what constitutes a cavity with complete and incomplete caries removal.
The steps of the study were the following: a preliminary examination, informed consent, randomization of samples, recording of cavity characteristic, collect dentine sample, caries removal, cavity inspection, collect dentine sample and final restoration. The same operator performed both caries treatment and cavity examination.
Inclusion Criteria
Between all the patients who appeared for a regular dental examination, who met the inclusion criteria was invited to enter in the study. To be selected children had to have at least 1 caries lesion interesting either occlusal, interproximal or in cervical surface of first and second primary molars prone to exfoliation. The lesion considered in this study was between a D1 and D3 stage evaluated by radiographic examination. Teeth with pathological processes of dental tissue other than caries, or pulpal disease or with adjacent soft tissue lesion were excluded. The children with systemic disease were excluded.
Clinical Procedure
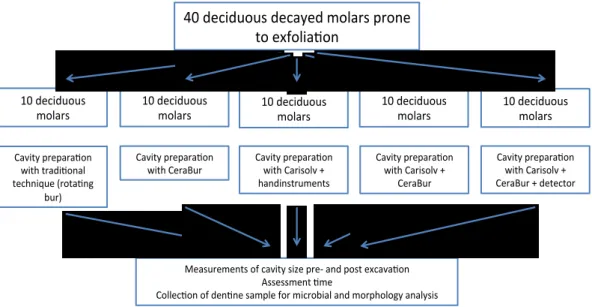
Each tooth treated was distributed among the five groups by computer randomization. The five treatments groups with a total of 50 teeth are (fig. 2):
A. Cavity preparation with traditional technique (control group)
B. Cavity preparation with CeraBur
C. Cavity preparation with Carisolv and hand instruments dedicate
D. Cavity preparation with Carisolv and CeraBur
E. Cavity preparation with Carisolv and CeraBur. Cavity inspection with caries
detector
In all groups was registered information about cavity size. This procedure was performed before and after excavation. Three different measurement were made using a periodontal probe:
1. The outer diameter in buccal – lingual and in mesial – distal sense
Fig. 2 Summary of experimental design to collect primary teeth to test different method of caries removal
To calculate the volume of cavity size before and after excavation we used pyramid as geometric model that could simulate the caries lesion shape. From cavity data we calculated the volume of geometric model that simulated the extension of caries lesions and clean cavity. Difference between post and pre-operative size was used to estimate the increment of cavity size.
Treatment time related to the caries excavation was measured. The clock was started when the first step of excavation or opening of the cavity began and stopped when the caries excavation and cavity preparation was completed. Time was measured in seconds.
In group A (control group) the carious lesions were treated using drills with two types of bur: Komet 880 314 012 to remove enamel and Komet H1SE 204 014 to eliminate tissue decay. In group B the enamel was removed using diamond bur (Komet 880 314 012) and ceramic bur was used to remove dentine decay. In group C Carisolv was used to remove caries: the gel was applied on dentine infected and after 30 seconds the softened tissue was removed using dedicated hand tools. This procedure was repeated until complete caries removal. When necessary enamel was removed using diamonds bur (Komet 880 314 012). In group D caries was removed using Carisolv gel. Finally ceramic bur (Komet Cerabur K1SM 2014 014) was used to finish the walls and the floor of the cavity. The procedure to remove tissue decay was the same in the D and E groups. In group E a caries detector was used for cavity inspection. In groups A, B, C and D the completion of caries removal was judged by standard clinical criteria, i.e. the probe did not stick in the remaining dentine. In the group E the complete caries removal was evaluated with caries detector. The data of
40 deciduous decayed molars prone to exfolia on 10 deciduous molars 10 deciduous molars 10 deciduous molars 10 deciduous molars 10 deciduous molars Cavity prepara on with Carisolv + CeraBur + detector Cavity prepara on with Carisolv + CeraBur Cavity prepara on with Carisolv + handinstruments Cavity prepara on with CeraBur Cavity prepara on
with tradi onal technique (rota ng
bur)
Measurements of cavity size pre- and post excava on Assessment me
complete caries removal was registered. After the cavity check the teeth were restored with ionomer glass cement.
Microbiological Analysis
After drying and isolation with cotton rolls, dentine was sampled from the cavity before and at the end of the cavity preparation using sterile excavator. Each sample was placed in an Eppendorf tube containing 150 μl of sterile TE buffer (10 mM Tris– HCl, 1 mM EDTA, pH 7.6). Then 100 μl of 0.5 M NaOH was added to the dentine sample and the bacterial suspension was stored at -20°C pending further processing (Gellen LSS et al., 2007).
The analysis of bacterial species was performed using the checkerboard DNA-DNA hybridisation method (Wall-Manning GM et al., 2002). Whole genomic probes were prepared from the 15 bacterial strains known to be related to caries as shown in (tab.
1). An evaluation of the bacterial count in the samples was performed by comparing
the obtained signals with the ones generated by the pooled standard samples
containing a count of 106 and 105 of each bacterial species, respectively. The signals
were coded on a scale from 0 to 5 as follows: 0 = no signal; 1 = a signal density
weaker than that of the low standard (<105 bacteria); 2 = a signal density equal to that
of the low standard (=105 bacteria); 3 = a signal density higher than that of the low
standard but lower than that of the high standard (>105 but <106 bacteria); 4 = a
signal density equal to that of the high standard (=106 bacteria) and 5 = a signal
density higher than that of the high standard (>106 bacteria).
Bacterial nomenclature Strain description & source Mutans streptococci
Streptococcus mutans ATCC-25175
Streptococcus sobrinus CCUG-27507
Non-muntans streptococci
Streptococcus sanguinis ATCC-10556D-5
Streptococcus salivarius ATCC-9759D-5
Streptococcus gordonii ATCC-35105D-5
Streptococcus mitis ATCC-49456D-5
Lactobacilli
Lactobacillus casei ATCC-334D-5
Lactobacillus fermentum OMGS-3182
Lactobacillus salivarius CCUG-55845
Actinomycens
Actinomycens odontolyticus NCTC-9935
Actinomucens oris ATCC-12104D-5
Veillonella Parvula ATCC-10709D-5
Rothia Dentocariosa CCUG-17835
Bifidobacterium Dentium OMGS-1956
Parvimonas Migra ATCC-33270
Statistical Analysis
Statistical difference in time taken and cavity size increment were performed using ANOVA analysis, adjusting statistical significance for the multiple comparisons (Bonferroni correction). For the analysis of microbiological data Shapiro-Francia normality test was used to assess the normality distribution of collect variables. Statistical difference in score of bacterial count was performed using the Kruskall-Wallis analysis of post-operative samples. In case of difference between groups comparisons were performed (Bonferroni correction). Statistical differences between pre- and post-operative in bacterial count, in each group and for each bacterial species, were calculated performing Mann-Whitney U test.
RESULTS
Paper I
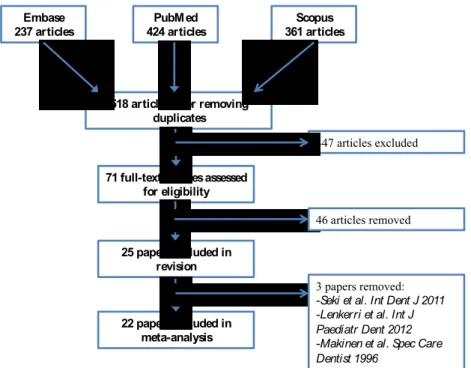
A total of 518 studies published from 1975 to 2015 were found. Forty-eight papers
were analysed and 25 met the eligibility criteria. Three papers (Mäkinen KK et al.,
1996; Seki M et al., 2011; Lenkkeri AM et al., 2012) were not included in the meta-analysis but only in the systematic review because primary outcome data was missing (fig. 3).
Fig. 3 Flowchart of search strategy
The trials admitted in the review involved a total of 5464 patients. From the selected studies, three were conducted in the US (Hildebrandt GH et al., 2000; Milgrom P et
al., 2006; Ly KA et al., 2006), one in Hungary (Szöke J et al., 2001), one in England
(Simons D et al., 2002), four in Estonia (Honkala S et al., 2014; Mäkinen KK et al., 2005; Alanen P et al., 2000; Runnel R et al., 2013), three in Sweden (Oscarson P et
al., 2006; Stecksen-Blicks C et al., 2008; Holgerson PL et al., 2006), one in Puerto
Rico (Beiswanger BB et al., 1998), one in China (Peng B et al., 2004), one in Lithuania (Machiulskiene V et al., 2001), one in Colombia (Martinez-Pabòn MC et
al., 2014), three in Italy (Campus G et al., 2009; Campus G et al., 2011; Campus G et al., 2013) and one in Germany (Splieth CH et al., 2009). One of the studies
Embase 237 articles PubMed 424 articles Scopus 361 articles
518 articles after removing duplicates
71 full-text articles assessed for eligibility 25 papers included in revision 22 papers included in meta-analysis 447 articles excluded 46 articles removed 3 papers removed: -Seki et al. Int Dent J 2011 -Lenkerri et al. Int J Paediatr Dent 2012 -Makinen et al. Spec Care Dentist 1996
included in the meta-analysis (Spieth CH et al., 2009) did not specify the randomization method of the sample. All the other studies had a randomization clinical trial with parallel arms design. Five studies (Honkala S et al., 2014; Mäkinen KK et al., 2005; Alanen P et al., 2000; Peng B et al., 2004; Machiulskiene V et al., 2001) used a cluster-randomized design. Eleven studies (Milgrom P, 2006; Honkala S et al., 2014; Mäkinen KK et al., 2005; Stecksen-Blicks C et al., 2008; Martinez-Pabon MC et al., 2014; Runnel R et al., 2013; Holgerson PL et al., 2006; Campus G
et al., 2013; Campus G et al., 2011; Campus G et al., 2009, Splieth CH et al., 2009)
were double blind and one single blind (Oscarson P et al., 2006). Seven studies were performed in adults (Hildebrandt GH et al., 2000; Milgrom P et al., 2006; Simons D
et al., 2002; Martinez-Pabon MC et al., 2014; Ly KA et al., 2006; Campus G et al.,
2011; Splieth et al., 2009), eleven in patients with mixed dentition, aged between 6 and 13 years old, (Szöke J et al., 2001; Honkala S et al., 2014; Beiswanger BB et al.; 1998; Runnel R et al., 2013; Holgerson PL et al., 2007; Campus G et al., 2013; Campus G et al., 2009; Stecksen-Blicks C et al., 2007; Machiulskiene V et al., 2001; Alanen P et al., 2000; Peng B et al., 2004) and one in children with deciduous dentition (Oscarson P et al., 2006).
Out of fifteen studies (Campus G et al., 2009; Campus G et al., 2011; Campus G et
al., 2013; Holgerson PL et al., 2007; Ly KA et al., 2006; Simons D et al., 2002;
Martinez-Pabon MC et al., 2014; Machiulskiene V et al., 2001; Peng B et al., 2004; Beiswanger BB et al., 1998; Szöke J et al., 2001; Milgrom P et al., 2006; Hildebrandt GH et al., 2000) where gums were used, thirteen tested for xylitol; eight used gums with sorbitol and/or mannitol or maltitol as control; five did not give gums the control group. In two studies (Szöke J et al., 2001; Beiswanger BB et al., 1998) was tested a combination of sorbitol and mannitol was tested versus a control group with no gum. In one study (Hildebrandt GH et al., 1998) as control was present both sorbitol gum and no intervention group. From two studies (Campus G et
al., 2009; Campus G et al., 2011), which tested gums, we could extract two types of
data: salivary count of S. Mutans and plaque pH. From seven studies (Campus G et
al., 2013; Holgerson PL et al., Ly KA et al., 2006; Simons D et al., 2002;
Martinez-Pabon MC et al., 2014; Milgrom P et al., 2006, Hildebrandt GH et al., 2000) we extracted data of S. Mutans count whereas from four studies (Szöke J et al., 2001; Beiswager BB et al., 1998; Machiulskiene V et al., 2001; Peng B et al., 2004) we gained data of dental caries increment. From study of Ly et al. the data of salivary count of S. Mutans at baseline was no present in the text. We contacted the authors to obtain that data but received no reply. The follow-up data were deduced from the graph in the papers. We also extracted data of salivary count of S. Mutans from the graphs in the paper text from Simons et al., 2006 study.
Two studies included in the meta-analysis used lozenges (Splieth CH et al., 2009; Stecksen-Blicks C et al., 2007) and tested xylitol. In the study of Splieth et al., was used as control group lozenges with sorbitol while in Stecksen-Blicks et al. paper in
the control group was not administrated any lozenges. From Splieth et al. study we extracted data of plaque pH while from Stecksen-Blicks et al. paper we gained data of ΔDMFS.
Two studies included in the meta-analysis used tablets (Mäkinen KK et al., 2005; Oscarson P et al., 2006) as vector. The paper of Oscarson et al. was tested xylitol while in the study of Mäkinen et al. the polyols tested were erythritol, xylitol and sorbitol. Both studies in the control group did not administer tablets. From one study (Mäkinen KK et al., 2005) was gained data of salivary count of S. Mutans was gained while from the other study (Oscarson P et al., 2006) we extracted data of Δdmfs.
In two studies included in the meta-analysis were used candies were used (Runnel R
et al., 2013; Honkala S et al., 2014) as vector. Both studies were tested erythritol and
xylitol while the control group were used candies with sorbitol. From one studies (Honkala S et al., 2014) we extracted data of number of decayed surface while in the other we gained data of salivary count of S. Mutans. From the study of Honkala S et al., the data of decayed surface affecting both the primary teeth and permanent teeth. In the study of Alanen P et al., were used both candies and gum. In the study xylitol was tested while in the control group the subject did not received gum or candy. From this study we extracted data of ΔDMFS.
Xylitol gum versus sorbitol gum - MS count
For this comparison we considered seven studies (Campus G et al., 2009; Campus G
et al., 2011, Campus G et al., 2013; Hildebrandt GH et al., 200; Holgerson PL et al.,
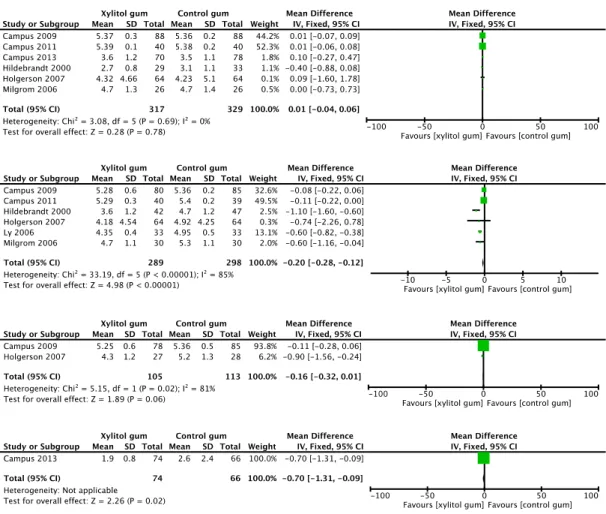
2007; Milgrom P et al., 2006; Ly KA et al., 2006). At baseline and in the short term we found data in six studies, in the medium term we extracted data from two studies and in the long term only one study presented data of MS (Mutans S.) salivary count. At baseline (fig. 4) we found no difference in MS salivary count (mean difference (MD) 0.01, 95% confidence interval (CI) -0.04 to 0.06, P value = 0.78). In the short term (fig. 4) the MS salivary count is significantly lower in the Xylitol group (MD -0.20, 95% CI -0.28 to -0.12, P value = 0.002). In the medium term (fig. 4) we found no difference between gum with xylitol and gum with sorbitol in terms of reduction of MS salivary count (MD -0.16, 95% CI -0.32 to 0.01, P value = 0.26. In the long term (fig. 4) from the analysis of Campus et al., 2013 study, we found that the MS salivary count is smaller in the xylitol gum group than in the control group with sorbitol gum (MD -0.70, 95% CI -1.31 to -0.09, P =0.02).
Fig. 4 Forest plot of comparison: Individual and overall Mean Difference in the comparison of efficacy to control MS salivary count increment of xylitol gum vs. sorbitol gum at short, medium and long term
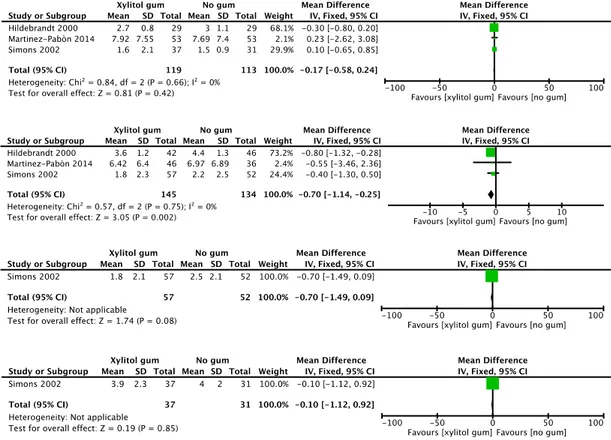
Xylitol gum versus no gum – MS count
For this comparison we had included three studies (Hildebrandt GH et al., 2000; Martinez-Pabon MC et al., 2014; Simons D et al., 2002). At baseline and in the short term we found data in all studies whereas for the comparison in the medium and long terms only one study (Simons D et al., 2002) was used to extract MS salivary count. At baseline (fig. 5) we found no difference in MS salivary count (MD -0.17; 95% CI -0.58 to 0.24, P value = 0.42). In the short term (fig. 5) MS salivary count was significantly lower in the Xylitol group (MD -0.70, 95% CI -1.14 to -0.25, P = 0.002). In the medium and long term (fig. 5) no difference was found in MS salivary count. In the medium term P-value = 0.08 and in the long term P-value = 0.85.
Fig. 5 Forest plot of comparison: Individual and overall Mean Difference in the comparison of efficacy to control MS salivary count increment of xylitol gum vs. no intervention group at short, medium and long term.
Sorbitol gum versus no gum – MS count
For this comparison we had extracted data from one study (Hildebrandt GH et al., 2000). In this study control were present at baseline and in the short term. At baseline there was no difference in terms of MS salivary count (MD 0.10, 95% CI -0.47 to 0.67, P = 0.73) (fig. 6). In the control in the short-term period we found no difference between sorbitol gum and control group without chewing gums (MD 0.30, 95% CI -0.21 to 0.81, P = 0.25) (fig. 6).
Fig. 6 Forest plot of comparison: Individual and overall Mean Difference in the comparison of efficacy to control MS salivary count increment of sorbitol tablet vs. no intervention group at medium term
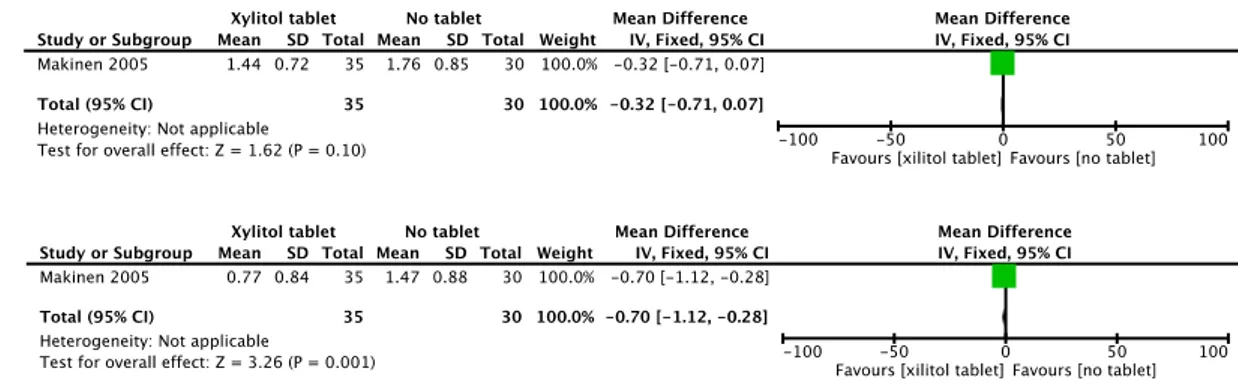
Xylitol tablet versus no tablet – MS count
For this comparison we had included only one study (Mäkinen KK et al., 2005) and we have data at baseline and in the medium term. At baseline there was no difference in MS salivary count (MD 0.32, 95% CI -0.71 to 0.07, P = 0.10) whereas in the medium term (fig. 7) salivary presence of MS was significantly lower in the xylitol group than in the control group (MD -0.70, 95% CI -1-12 to -0.28, P = 0.001) (fig.
7).
Fig. 7 Forest plot of comparison: Individual and overall Mean Difference in the comparison of efficacy to control MS salivary count increment of xylitol tablet vs. no intervention group at medium term
Xylitol tablet versus control tablet – MS count
For this comparison we included only one study (Mäkinen KK et al., 2005) and we had data at baseline and in the medium term. No significant difference was found at baseline in MS salivary count (MD -0.03, 95% CI -0.40 to 0.34, P = 0.87) whereas in the medium term (fig. 8) the MS salivary count appeared higher in xylitol group than in the control group (MD -0.61, 95% CI -1.01 to -0.21, P = 0.003) (fig. 8).
Fig. 8 Forest plot of comparison: Individual and overall Mean Difference in the comparison of efficacy to control MS salivary count increment of xylitol tablet vs. sorbitol tablet at medium term
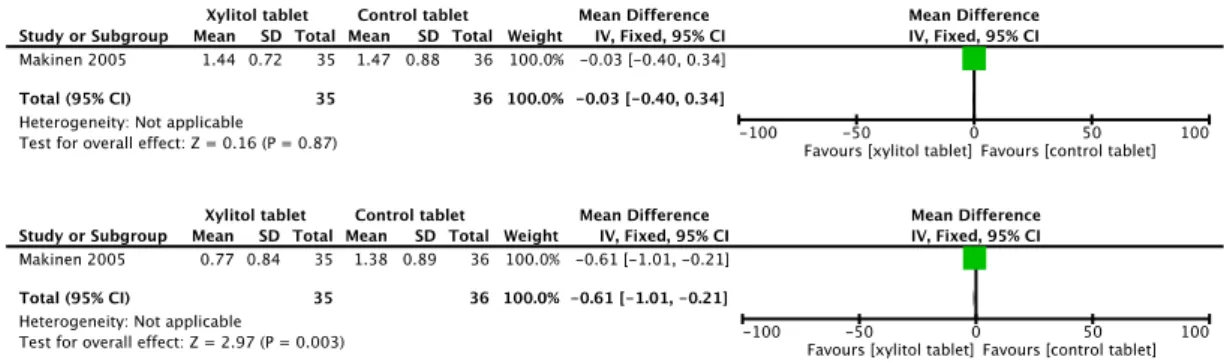
Erythritol tablet versus no tablet – MS count
For this comparison we included only one study (Mäkinen KK et al., 2005) and we had data at baseline and in the medium term. At baseline (fig. 9) there was not difference in MS salivary count (MD -0.04, 95% CI -0.48 to -0.40, P = 0.86) whereas in the medium term (fig. 9) salivary presence of MS is significantly lower in xylitol group than in the control group (MD -0.85, 95% CI -1.26 to -0.44, P < 0.0001).
Fig. 9 Forest plot of comparison: Individual and overall Mean Difference in the comparison of efficacy to control MS salivary count increment of erythritol tablet vs. no intervention group at medium term
Erythritol tablet versus control tablet – MS count
For this comparison we included only one study (Mäkinen KK et al., 2005) and we have data in the baseline and in the medium term. No significant difference was found at baseline in MS salivary count (MD 0.25, 95% CI -0.18, 0.68, P = 0.25) (fig.10) whereas in the medium term the MS salivary count resulted higher in control group than erythritol group (MD -0.76, 95% CI -1.15 to -0.37, P = 0.0001) (fig.10).
Fig. 10 Forest plot of comparison: Individual and overall Mean Difference in the comparison of efficacy to control MS salivary count increment of erythritol tablet vs. no intervention group at medium term
Sorbitol tablet versus no tablet – MS count
For this comparison we included only one study (Mäkinen KK et al., 2005) and we had data at baseline and in the medium term. No significant difference was found at baseline in MS salivary count (MD 0.25, 95% CI -0.18, 0.68, P = 0.25) (fig. 11) whereas in the medium term (tab. 1) the MS salivary count resulted higher in control group than in the erythritol group (MD -0.76, 95% CI -1.15 to -0.37, P = 0.0001) (fig.
11).
Fig. 11 Forest plot of comparison: Individual and overall Mean Difference in the comparison of efficacy to control MS salivary count increment of sorbitol tablet vs. no intervention group at medium term
Xylitol candy versus control candy – MS count
For this comparison we have found one study (Runnel R et al., 2013). In the paper data at baseline and at long term was presented. At baseline (fig. 12) the MS salivary count was significantly higher in xylitol group (MD 0.11, 95% CI 0.09 to 0.13, P < 0.00001) whereas at control in the long term we found the opposite situation: the MS salivary count was lower in the xylitol group (MD -0.18, 95% CI -0.20, -0.16, P < 0.0001) (fig.12).
Fig. 12 Forest plot of comparison: Individual and overall Mean Difference in the comparison of efficacy to control MS salivary count increment of xylitol candy vs. sorbitol candy at long term
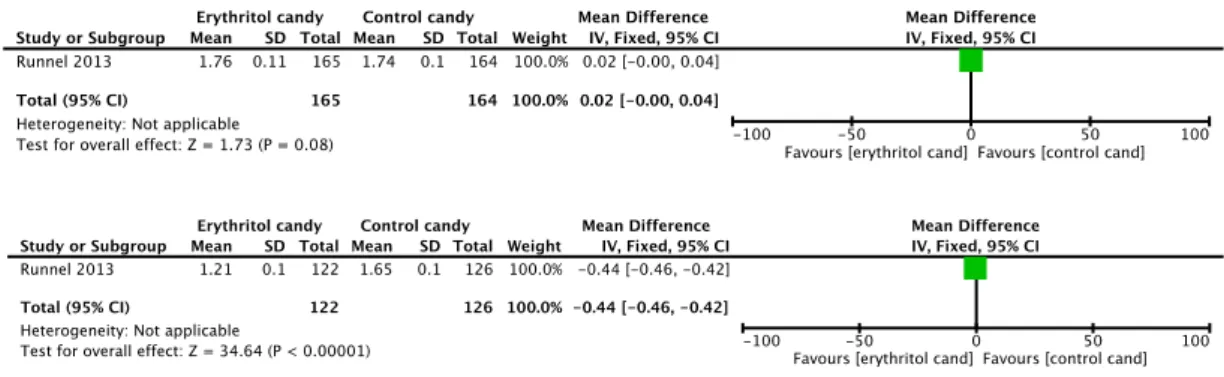
Erythritol candy versus control candy – MS count
For this comparison we included only one study (Runnel R et al., 2013) and we had data at baseline and in the long term. At baseline (fig. 13) there was not difference in MS salivary count (MD 0.02, 95% CI -0.00 to -0.04, P = 0.08) whereas in the medium term salivary presence of MS is significantly lower in xylitol group than in the control group (MD -0.44, 95% CI -0.46 to -0.42, P < 0.0001) (fig. 13).
Fig. 13 Forest plot of comparison: Individual and overall Mean Difference in the comparison of efficacy to control MS salivary count increment of erythritol candy vs. sorbitol candy in the long term
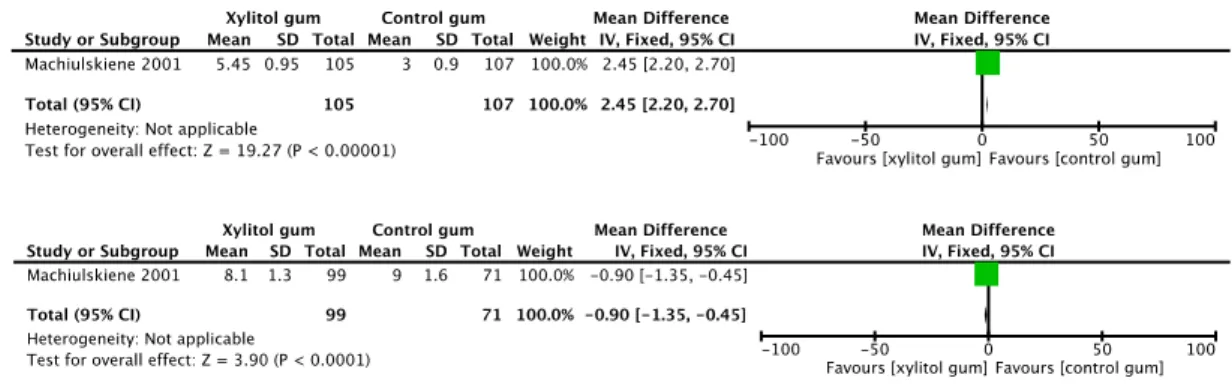
Xylitol gum versus sorbitol gum – DMFS
For this comparison we had included one study (Machiulskiene V et al., 2001) and we had data at 2 years and at 3 years of follow-ups. The data comparison of ΔDMFS at two years (fig. 14) showed, in the control group with sorbitol gum, a significantly smallest increase of decayed surface (MD 2.45, 95% CI 2.20 to 2.70, P < 0.00001. At 3 years (fig. 14) the increment of DMFS is higher in the control group with sorbitol gum (MD -0.90, 95% CI -1.35 to 0.45, P < 0.0001).
Fig. 14 Forest plot of comparison: Individual and overall Mean Difference in the comparison of efficacy to control ΔDMFS increment of xylitol gum vs. sorbitol gum at 2 and 3 years follow-up.
Xylitol gum versus no gum – DMFS
For this comparison we included three studies (Machiulskiene V et al., 2001; Peng B
et al., 2004; Alanen P et al., 2000); from one (Machiulskiene V et al., 2001) we
extracted data at 2 and at 3 years follow-ups whereas from studies of Peng B et al., and Alanen P et al., the follow-ups were performed respectively at 2 and 3 years. At 2 years the increase of DMFS was significantly lower in the xylitol group (MD -0.01, 95% CI -0.17 to -0.02, P = 0.01) (fig. 15). This trend was confirmed at 3 years of follow-ups: the ΔDMFS was smaller in the xylitol than control group (MD -0.69, 95% CI -1.08 to 0.30, P = 0.0005) (fig. 15).
Fig. 15 Forest plot of comparison: Individual and overall Mean Difference in the comparison of efficacy to control ΔDMFS increment of xylitol gum vs. no intervention group at 2 and 3 years follow-up.
Sorbitol gum versus no gum – DMFS
For this comparison we included three studies (Machiulskiene V et al., 2001; Szöke J
et al., 2001; Beiswanger BB et al., 1998); from two studies (Machiulskiene V et al.,
2001, Beiswanger BB et al., 1998) we extracted data at 2 and at 3 years follow-ups whereas from studies of Szöke et al. the follow-ups were performed only at 2 years. At 2 years the increase of DMFS was significantly lower in the xylitol group (MD -0.01, 95% CI -0.17 to -0.02, P = 0.01) (fig. 16). This trend was confirmed at 3 years follow-ups: the ΔDMFS was smaller in the xylitol than control group (MD -0.69, 95% CI -1.08 to 0.30, P = 0.0005) (fig. 16).
Fig. 16 Forest plot of comparison: Individual and overall Mean Difference in the comparison of efficacy to control ΔDMFS increment of sorbitol gum vs. no intervention group at 2 and 3 years follow-up.
Xylitol lozenges versus no lozenges – DMFS
For this comparison we found data in one study (Stecksen-Blick C et al., 2008) and the follow-up was performed at 2 years. We found no difference in terms of ΔDMFS between xylitol lozenges and the group without lozenges (MD 1.00, 95% CI -0.42 to 2.42, P = 0.17) (fig. 17).
Fig. 17 Forest plot of comparison: Individual and overall Mean Difference in the comparison of efficacy to control ΔDMFS increment of xylitol lozenges vs. no intervention group at 3 years follow-up.
Xylitol candy versus no candy – DMFS
For this comparison we found data in one study (Alanen P et al., 2000) and the follow-up was performed at 3 years. At 2 years the increase of DMFS was significantly lower in the xylitol group (MD -1.65, 95% CI -2.67 to -0.63, P = 0.002) (fig. 18).
Fig. 18 Forest plot of comparison: Individual and overall Mean Difference in the comparison of efficacy to control ΔDMFS increment of xylitol candy vs. no intervention group at 3 years follow-up.
Xylitol candy versus no candy – DMFS + dmfs (number of decayed surface/total surface analysed)
For this comparison we have found data in one study (Honkala E et al., 2014) in which the follow-up was performed at 3 years. We have no found difference between the xylitol group and the control group (OR 1.05, 95% CI 0.96 to 1.15, P = 0.26) (fig.
Fig. 19 Forest plot of comparison: Individual and overall Odd Ratio in the comparison of efficacy to control surface decayed of xylitol candy vs. no intervention group at 3 years follow-up.
Erythritol candy versus no candy – DMFS + dmfs (number of decayed surface/total surface analysed)
For this comparison we have found data in one study (Honkala E et al., 2014) in which the follow-up was performed at 3 years. At 3 years the decayed surface in the control group was significantly higher than in the erythritol group (OR 0.83, 95% CI 0.75 to 0.91, P < 0.0001) (fig. 20).
Fig. 20 Forest plot of comparison: Individual and overall Odd Ratio in the comparison of efficacy to reduce surface decayed of erythritol candy vs. no intervention group at 3 years follow-up.
Xylitol tablet versus no tablet – dmfs
For this comparison we found data in one study (Oscarson P et al., 2006) and the follow-up was performed at 2 years. At 2 years we found no difference between the xylitol group and the control group (MD -0.42, 95% CI -1.12 to 0.28, P = 0.24) (fig.
21).
Fig. 21 Forest plot of comparison: Individual and overall Mean Difference in the comparison of efficacy to control Δdmfs increment of xylitol tablet vs. no intervention group at 2 years follow-up.
Xylitol gum versus sorbitol gum – AUC5.7 of plaque pH
For this comparison we had included two studies (Campus G et al., 2009; Campus G
only one study performed (Campus G et al., 2009) the control in the medium term.
At baseline (fig. 22) we found that the AUC5.7 of plaque was significantly bigger in
the xylitol group than in the control group (MD 0.98; 95% CI -0.82 to 1.14, P <
0.00001). In the short terms (fig. 22) the AUC5.7 of plaque pH was smaller in the
xylitol group than in the control group (MD -1.28, 95% CI -1.43 to -1.13, P <
0.00001). Also in the medium terms (fig. 22) we have found the AUC5.7 in xylitol
group was smaller than in the control group (MD -2.50, 95% CI -2.64 to -2.36, P<0.00001).
Fig. 22 Forest plot of comparison: Individual and overall Mean Difference in the comparison of efficacy to control plaque pH in AUC5.7 of xylitol gum vs. sorbitol gum at baseline and in the short
and medium term follow-ups.
Xylitol gum versus sorbitol gum – AUC6.2 of plaque pH
For this comparison we included two studies (Campus G et al., 2009; Campus G et
al., 2011). In both studies we found data at baseline and in the short term whereas
only one study performed (Campus G et al., 2009) the control in the medium term.
At baseline (fig. 23) comparing the data of two studies we found that the AUC6.2 of
plaque pH was significantly greater in the xylitol group (MD 1.28; 95% CI 1.09 to
1.46, P < 0.00001). In the short terms (fig. 23) the AUC6.2 of plaque pH was smaller
in the xylitol group than in the control group (MD -6.22, 95% CI -6.37 to -6.07, P <
0.00001). Also in the medium terms (fig. 23) we found the AUC6.2 of plaque pH in
the xylitol group was smaller than in the control group (MD 5.50, 95% CI 5.67 to -5.33, P<0.00001).
Fig. 24 Forest plot of comparison: Individual and overall Mean Difference in the comparison of efficacy to control plaque pH in AUC6.2 of xylitol gum vs. sorbitol gum at baseline and in the short
and medium term follow-ups.
Xylitol lozenges versus sorbitol lozenges – AUC7.0 of plaque pH
For this comparison we included one study (Splieth CH et al., 2009) in which the controls were performed at baseline and in the short term. At baseline (fig. 25)
comparing the data we found that AUC7.0 of plaque pH was greater in the control
group than in the experimental group with xylitol lozenges (MD -25.80, 95% -44.30 to -7.30). At control in the short term we found no difference between the two groups (MD -4.60, 95% CI -13.04 to 3.84, P =0.29) (fig. 25).
Fig. 25 Forest plot of comparison: Individual and overall Mean Difference in the comparison of efficacy to control plaque pH in AUC7.0 of xylitol lozenges vs. sorbitol gum at baseline and in the medium term follow-up.
Comparison among the three detection methods
A total of 2496 surfaces (832 mesial, occlusal and distal, respectively) were analysed. The occlusal surfaces were analysed using DIAGNOcam (CAMo) and Clinical Examination (CE), while the approximal surfaces were analysed with DIAGNOcam (CAMa) and Bite-Wing radiographs (BW). The total number of occlusal caries lesions detected was similar, 149 using CAMo and 152 with CE with a Cohen’s Kappa of 0.99. The ICC for the occlusal, mesial and distal surfaces of each tooth is reported in fig. 26. The mean ICC for the occlusal surface was 0.93 with a lowest value for maxillary right second molar (ICC=0.78) while a perfect agreement (ICC=1) was observed for several premolars. Approximal caries identified using CAMa were 83 and 70 using BW (Cohen’s Kappa of 0.91). CAMa and BW identified the same number (31) of caries in dentine. The Cohen’s Kappa was 0.24 for enamel lesions with a low agreement, while a complete concordance (Kappa=1) was observed for dentinal lesions (tab. 3). The mean ICC for approximal surfaces was 0.97 for the distal and 0.95 for the mesial surfaces (tab. 4). Regarding enamel lesions, 17 lesions in molars were detected with CAMa, while 16 with the BW method (Cohen’s kappa=0.97); 35 lesions were detected in premolars with CAMa respect to 23 with BW (Cohen’s kappa=0.21). Twenty-nine decayed mesial surfaces were registered with CAMa respect to 23 with BW (Cohen’s kappa=0.39). For the distal surfaces, 23 lesions were recorded with CAMa and 16 with BW (Cohen’s kappa=0.34). A complete concordance was observed for dentinal lesions between the two methods.
Fig. 26 Comparison among the three detection methods. Intraclass Coefficient Correlation between the DIAGNOcam and Clinical Evaluation for the occlusal surfaces (o) and between DIAGNOcam and Bite-wing for the approximal surfaces mesial (m) and distal (d) are reported
o=0.78 d=1 m=1 o=0.84 d=1 m=1 o=1 d=0.95 m=0.92 o=1 d=0.96 m=1 o=1 d=0.92 m=0.79 o=1 d=1 m=0.94 o=0.91 d=1 m=1 o=0.95 d=1 m=1 o=0.92 d=1 m=1 o=0.95 d=1 m=1 o=0.79 d=0.76 m=1 o=1 d=1 m=1 o=0.96 d=1 m=1 o=0.96 d=1 m=0.85 o=0.85 d=0.95 m=0.75 o=1 d=1 m=1 Upper jaw Lower jaw
Tab. 3 Comparison among the three detection methods. Caries lesions (enamel and dentinal lesions) according to the radiographic evaluation (BW) and the DIAGNOcam on approximal surfaces (CAMa). Percentage were calculated based on the total of the surfaces examined (n=1664)
Bitewing (BW) n (%) DIAGNOcam (CAMa) n (%) Cohen’s kappa value (SE) 95% CI Enamel 39 (2.3) 52 (3.1) 0.24 (0.06) 0.12-0.36 Dentine 31 (1.9) 31 (1.9) 1
Lesions for teeth/surfacs Enamel Dentine DIAGNOcam (CAMa) n=52 n (%) Bitewing (BW) n=39 n (%) Cohen’s kappa value (SE) 95% CI DIAGNOcam (CAMa) n=31 n (%) Bitewing (BW) n=31 n (%) Cohen’s kappa value (SE) 95% CI Molars 17 (32.7) 16 (41.03) 0.97 (0.03) 0.91-1.00 13 (41.94) 13 (41.94) 1 Premolars 35 (67.3) 23 (58.97) 0.21 (0.08) 0.05-0.36 18 (58.06) 18 (58.06) 1 Mesial 29 (55.77) 23 (58.97) 0.39 (0.08) 0.23-0.56 11 (35.48) 11 (35.48) 1 Distal 23 (44.23) 16 (41.03) 0.34 (0.10) 0.15-0.54 20 (64.52) 20 (64.52) 1
Tab. 4 Reliability among dental professionals using the DIFOTI technique. Inter and Intra-examiner reliability categorized following the scale of the concordance degree proposed by Landis and Koch (1977) after two examinations (EVA1 and EVA2). n = 33