Dipartimento per la Innovazione nei sistemi Biologici, Agroalimentari e Forestali in convenzione con l’Università degli Studi del Molise
Corso di Dottorato di Ricerca in
Scienze, Tecnologie e Biotecnologie per la Sostenibilità - XXX Ciclo
FRUCTAN AND β-GLUCAN ACCUMULATION IN BARLEY KERNEL AND DEVELOPMENT OF FLOURS ENRICHED IN BIOACTIVE COMPOUNDS
(s.s.d. AGR/15)
Tesi di dottorato di:
Dott. Elisa De Arcangelis
Coordinatore del corso Tutore
Prof. Mauro Moresi Prof. Mauro Moresi
Co-tutore
Prof. Emanuele Marconi
Short abstract
The overall aim of this doctoral thesis was to characterise mature and immature barley (Hordeum vulgare L.) cultivars focusing on bioactive compounds fructan and β-glucan.
Developing barley kernels were studied to evaluate immature barley flour as an innovative functional ingredient. Seven barley cultivars grown in Italy were collected at different days after anthesis (DAA) until completed maturation and analysis were performed in order to assess variation of the content of fructan, β-glucan and total starch. Results indicate that fructan concentration in immature barley grain ranges from 3.3 to 5.5 times higher than at maturation and cultivar Scarlett stands out for the highest content of fructan (9.5 g/100 g flour- fresh weight) among the lines analysed.
Six barley varieties obtained in Sweden differing in starch composition and β-glucan content (normal starch, waxy, high amylose and shrunken endosperm barleys) were studied to evaluate β-glucan molecular features and effects of wheat β-glucanase hydrolysis on the structure correlated to baking process. Sifted flours samples underwent sequential extractions with water and alkali to isolate β-glucan fractions. On three varieties a separate extraction was performed obtaining only water-extractable and water-unextractable β-glucan isolates. These pellets were incubated with wheat flour (Triticum aestivum) extracts. The occurrence of oligosaccharides with DP 3-9 was analysed after lichenase digestion and analysis with high performance anion exchange chromatography coupled with pulsed amperometric detection (HPAEC-PAD). Results showed a higher ratio 3-O-β-cellobiosyl-D-glucose (DP3) to 3-O-β-cellotriosyl-D-glucose (DP4) in fractions of variety SLU 7 (shrunken endosperm barley) suggesting a more packed β-glucan structure compared to the other vareties. Moreover, it can be argued that wheat β-glucanase hydrolizes selectively β-glucan with lower DP3/DP4 ratio and that β-glucan of shrunken endosperm barley SLU 7 is composed of a population with higher DP3/DP4 ratio which may express higher resistance to enzymic action.
In this work, air classification was performed on four waxy and one non-waxy barley cultivars in order to obtain barley flour enriched in β-glucan. Barley varieties were collected in experimental fields in Italy, hammer milled, micronised and air classified to obtain a coarse fraction and a fine fraction respectively enriched and depleted of β-glucan. Proximate composition, β-glucan and dietary fibre content was assessed on each fraction to evaluate efficacy of the process and significant differences among cultivars. A maximum increase in β-glucan content of +84% in the coarse fraction was registered compared to the micronised flour. Cultivar CDC Fibar displayed the highest content of β-glucan in the coarse fraction (13.5% fw) and total dietary fibre enrichment was also achieved in all the coarse fractions.
Taken together the results obtained with this experimental work contribute to the characterization of barley to improve its inclusion in cereal-based functional foods production.
Extended abstract
Aim
The overall aim of this doctoral thesis was to characterise different barley (Hordeum vulgare L.) cultivars focusing on bioactive compounds fructan and β-glucan and contributing to the characterization of this cereal in the perspective of wider employment in cereal-based functional foods production. Experimental procedure
The work is structured in three main experimental activities. E1) Study of fructan, β-glucan and total starch content in developing barley grains; E2) analysis of molecular characteristics of β-glucan in barley flours using lichenase digestion and HPAEC-PAD (High performance anion exchange chromatography-pulsed amperometric detection) and evaluation of the effects of wheat β-glucanase; E3) use of micronization and air classification technology to obtain β-glucan enriched fractions from waxy and non-waxy barley cultivars.
Material and methods
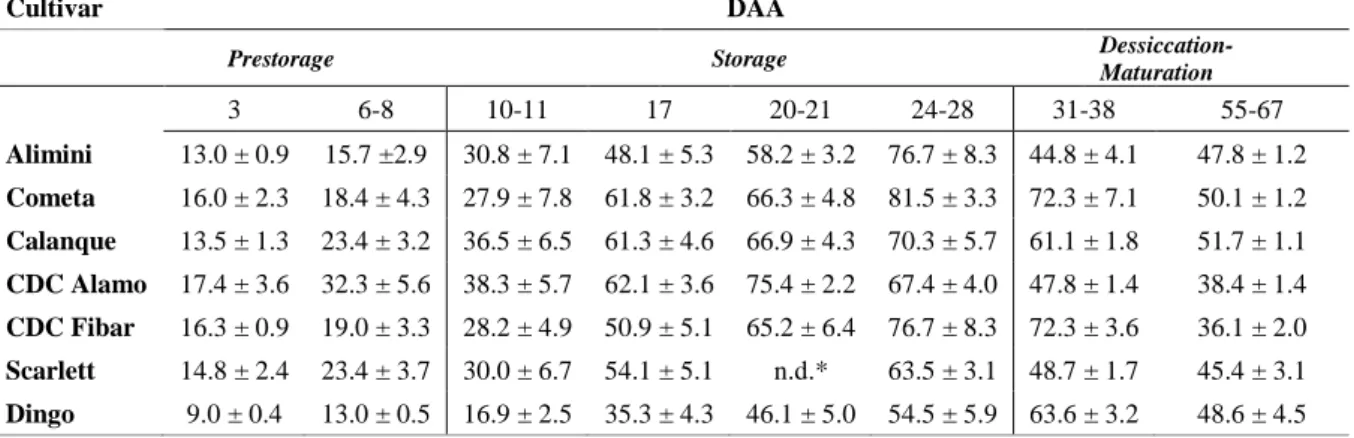
E1) Samples of ears from seven cultivars of waxy and non-waxy barley were collected at different developmental stages (3, 6-9, 10-11, 17, 20-21, 24-28, 31-38 days after anthesis-DAA) and at completed maturation. Kernels from immature ears were dried at 40 °C for 24 hours under vacuum (-660 Torr). Kernels were then ground with laboratory miller and analyzed. Mature barley kernels were also ground with a laboratory miller and analysed. Fructans, β-glucan and total starch content were determined by spectrophotometric methods. Protein content (Nx6.25) was analyzed with Dumas method (Leco FP-528). Average kernel weight (fresh weight) was calculated as the ratio of total weight of kernels to the number of kernels.
E2) Six barley varieties differing in starch and dietary fibre composition (normal starch, waxy, high amylose and shrunken endosperm barleys) were obtained from Lantmännen Lantbruk (Sweden). The kernels were milled using a laboratory mill (Laboratoriums-mahlautomat model MLU 202, Genrunder Bühler Maschinenfabrik, Uzwill, Switzerland). Sifted flour fractions were pooled together and used for the analysis. β-Glucan was sequentially extracted with water and NaOH 50 mM obtaining three fractions: water extractable (WE), alkali-extractable (NaE) and residual (Res). A second extraction on sifted flour of three varieties was performed obtaining water extractable and water unextractable β-glucan. Pellets were incubated with wheat extract obtaining the following samples. WU-WhE-Ins is the insoluble fraction obtained after incubation of water unextractable β-glucan with wheat extract; WE-WhE-Sol is the soluble fraction obtained after incubation of water extractable β-glucan with wheat extract; WU-WhE-Sol is the soluble fraction obtained after incubation of water unextractable β-glucan with wheat extract. Analysis of oligomers released after lichenase digestion of β-glucan on the fractions fractions was performed using HPAEC-PAD (High performance anion exchange chromatography-pulsed amperometric detection). Separation was carried out on a CarbopacTM PA100 (4x250mm)
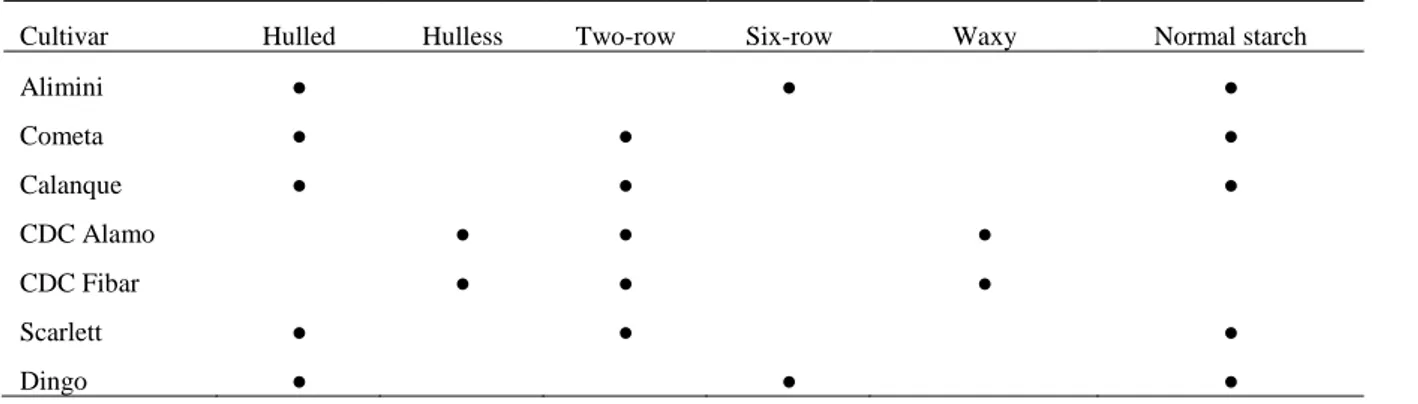
E3) Thirteen barley cultivars from year 2013/14-2014/15 were analysed to evaluate the β-glucan content. A selection of cultivars of waxy and non-waxy mature barley was collected, dehulled, hammer-milled, micronized (Separ microsystem mod. KMX-300) and air classified (Separ microsystem mod. SX/LAB), obtaining a coarse fraction and a fine fraction corresponding to the 40% and 60% of the total weight of the flour. These fractions were analyzed to assess their proximate composition and β-glucan enrichment and reduction respectively.
Results and Discussion
E1) The peak of average kernel fresh weight resulted at 21-28 DAA, while in Dingo at 38 DAA. These findings are in agreement with others work, as the decrease of kernel weight is the consequence of the dehydration process which is not balanced by reserve storage and accumulation. The peak of fructan concentration (g/100 g flour - fresh weight) resulted to be between 6 and 17 DAA. Cultivar Scarlett and Dingo had the highest concentration being 9.5 g/100 g flour and 6.6 g/100 g flour respectively. During the later stages of maturation, fructan content decreases steadily. Starch concentration tends to increase over maturation for all the cultivars analysed. β-Glucan substantially accumulates from 20-28 DAA in five cultivars corroborating previous findings. In Scarlett and Dingo, the content exceeds 1 g/100 g flour at 31-38 DAA and at maturation respectively. Linear accumulation (mg/kernel) of protein occurs coherently with previous works. The role of fructan metabolism in the first stages of maturation of the grain has been extensively studied. The synthesis aims at protecting tissues from oxidative stress and regulating the osmotic excess due to high quantity of sucrose, in order to allow photosynthesis to continue. Moreover, during maturation these polysaccharides help regulating the carbohydrate metabolism. On the other hand, the progressive reduction of fructan content is probably correlated to the accumulation of storage carbohydrate like starch.
E2) The occurrence of oligosaccharides yielded after lichenase hydrolysis on the three fractions (WE, NaE and Res) of β-glucan isolates was analysed. Data on the single fragments were calculated as normalised against the sum DP3+DP4 areas: DPx/(DP3+DP4). Information on the structure of β-glucan can be obtained by analysing DP3/DP4 ratio which was higher in the NaE and Res fractions compared to the WE, in all the barley varieties considered. Barley variety SLU 7 (shrunken endosperm barley, with high β-glucan and fructan content) had higher DP3/DP4 ratios in all the three fractions compared to the other varieties, while NGB 114602 had the lowest ratios. In the WE-WhE-Sol fractions, DP3/DP4 ratio is the highest compared to the other two β-glucan isolates. When looking at the data of fractions WU-Whe-Ins and WU-WhE-Sol, similar ratios values were obtained in these fractions in cultivar SW 28708 and Gustav differently to what observed in SLU 7. It can be speculated that in this variety the wheat β-glucanase released a group of polysaccharides with a different structure. These results can lead us to argue that wheat enzymes display a selective behaviour of hydrolysis towards specific β-glucan population, possibly with lower DP3/DP4 ratio and so with a more accessible structure to enzymic action. Barley varieties SLU 7 results to be different specifically in the insoluble fractions with a lower occurrence of β-glucan available to hydrolysis by wheat enzymes.
E3) The coarse fraction obtained by air classification technology is enriched in β-glucan compared with the starting micronized flour. Enrichment resulted more effective for cultivar Shangrila and CDC Alamo (+84%), but the starting high content in waxy barley resulted in coarse fractions with a marked higher concentration of β-glucan. In fact, the coarse fraction obtained from waxy cultivar CDC Fibar has a notable content of β-glucan (13.5% fw).
Conclusions and Future Perspectives
The aim of this thesis was to characterize barley flours focusing, specifically, on the functional polysaccharides fructan and β-glucan. Previous researches highlighted that fructan concentration is higher in the first stages of cereal maturation compared to mature grain. The evolution of the content of these compounds was evaluated in developing barley grains to study its potential application as innovative functional ingredient. Results showed that fructan concentration in immature barley grain can be from 3.3 to 5.5 folds higher than at maturation. However, at the peak of fructan concentration, β-glucan content is below 1 g/100g flour. It can be concluded that immature barley flour can be potentially employed as a source of fructan but not of β-glucan.
The study of the structure of β-glucan isolates with HPAEC-PAD showed that shrunken endosperm barley variety has a higher DP3/DP4 ratio compared to the other varieties (normal starch, high amylose and waxy). A higher ratio is related to a higher occurrence of (1→3) linkages in the β-glucan chain and a higher number of interchain interactions. Activity of wheat glucanase on water unextractable β-glucan in SLU 7 released polysaccharides with a more marked difference in DP3/DP4 ratio compared to the other analysed cultivars, leading to hypothesize that in this variety the enzyme acted more specifically on a selected β-glucan population probably more accessible to its action. Previous researches also showed that β-glucan in SLU 7 maintained a higher molecular weight (MW) during baking process compared to the other cultivars. A high β-glucan MW is related to greater positive physiological effects than low MW β-glucan. It can be speculated that structural features of these polysaccharides in SLU 7 found in this study may be a possible explanation, as the β-glucan chain may result less accessible to wheat β-glucanases. The results of this study improve knowledge on β-glucan structure in this cultivar which could be related to the feature “shrunken endosperm”. Since barley with shrunken endosperm showed a higher content of fructan and β-glucan, these findings can be of great interest to select barley cultivars with the aim to produce healthier food products.
Air classification of previously micronized flour is widely used to obtained fractions enriched in bioactive compounds. In this study, this technology was applied to waxy and non-waxy barley varieties in order to evaluate enrichment of β-glucan in the coarse fractions. Results clearly show that air classification, specifically of waxy barley varieties, but eventually of varieties with high β-glucan content like high amylose or shrunken endosperm, is valuable strategy to obtain flours with improved nutritional values, as in this study β-glucan content reached the maximum of 13.5% fw in the coarse fractions obtained.
The results obtained with this PhD thesis accentuate the potential role of barley flours as an innovative functional ingredient. In fact, immature barley flour, mature barley flour from selected varieties and
fractions obtained after physical enrichment in bioactive compounds, enhance the choices for inclusion of barley products in the formulations cereal-based foods (e.g. bread, pasta, biscuits and breakfast cereals) enriched in fructan and β-glucan.
Riassunto
Questa tesi di dottorato ha riguardato lo sviluppo e la caratterizzazione di farine d’orzo (Hordeum vulgare L.) arricchite in fruttani e β-glucani. Il lavoro è articolato in tre progetti.
L’evoluzione del contenuto di fruttani, β-glucani e amido totale è stata determinata in cariossidi di orzo ottenute a diversi stadi di maturazione da campi sperimentali in Italia. Il contenuto di fruttani nelle cariossidi immature è risultato da 3 a 5 volte più elevato rispetto alle cariossidi mature con la cultivar Scarlett che mostra il più elevato contenuto (9,5 g/100 g sfarinato-peso fresco). I β-glucani e l’amido totale mostrano un trend di accumulo lineare fino a maturazione completata.
Sei varietà di orzo ottenute in Svezia sono state selezionate per la diversa composizione di amido e fibre ed è stata valutata la struttura dei β-glucani e l’impatto dell’idrolisi da parte delle β-glucanasi del frumento su di essa, correlato al processo di panificazione. I β-glucani dalle farine sono stati estratti con acqua e NaOH ottenendo tre pellet (solubile in acqua, solubile in NaOH e residuo). Su tre varietà una estrazione successiva ha isolato solamente le frazioni di β-glucani solubili e insolubili in acqua, incubando i pellet con estratti di farina di frumento (Triticum aestivum L.) e separando le frazioni ottenute dopo l’idrolisi dei β-glucani. La frequenza di oligosaccaridi con grado di polimerizzazione (DP) 3-9 è stata valutata in tutti i pellet ottenuti dopo idrolisi con lichenasi ed analisi con HPAEC-PAD. I risultati ottenuti mostrano un più elevato rapporto trisaccaridi/tetrasaccaridi nei β-glucani della cultivar SLU 7 (con endosperma shrunken) suggerendo una struttura più compatta. Inoltre, si può ipotizzare che in questa varietà le β-glucanasi del frumento abbiano idrolizzato selettivamente una popolazione con più basso rapporto DP3/DP4 suggerendo la presenza di β-glucani con una maggiore resistenza all’azione idrolitica delle β-glucanasi.
La tecnologia di classificazione ad aria è stata utilizzata per ottenere frazioni arricchite in β-glucani, valutando altresì l’efficacia di questa tecnica. Cinque cultivars di orzo ottenute in Italia sono state macinate con mulino a martelli, micronizzate e sottoposte a classificazione ad aria ottenendo una frazione grossa e una fine rispettivamente arricchita e depauperata in β-glucani. Sulle frazioni ottenute è stata effettuata una analisi della composizione centesimale, del contenuto in β-glucani e in fibra alimentare. I risultati sottolineano un aumento massimo in β-glucani di +84% nella frazione grossa rispetto alla frazione micronizzata. La cultivar CDC Fibar ha riportato il più elevato contenuto in β-glucani nella frazione grossa (13,5%) mentre è risultato anche un aumento del contenuto di fibra alimentare in tutte le frazioni grosse.
I risultati di questo studio contribuiscono ad ampliare le conoscenze necessarie per sviluppare farine d’orzo arricchite in composti bioattivi e produrre alimenti funzionali innovativi.
I
Table of contents
Abbreviations 5
1. State-of-the-art 7
1.1. Barley (Hordeum vulgare L.) 7
1.1.1. Kernel anatomy and development 7
1.1.2. Nutritional composition of barley grain 9
1.1.3. Commercial use and economic data 13
1.2. Non-starch polysaccharides: fructans and β-glucan 14
1.2.1. Fructans 15
1.2.1.1. Molecular structure 15
1.2.1.2. Physiological role in plants and occurrence in cereal grains 16
1.2.1.3. Effects on human health 17
1.2.1.4. Physicochemical properties 20
1.2.1.5. Effects of fructan addition on cereal-based products 20
1.2.1.6. Processing impacts 21
1.2.2. β-Glucan 22
1.2.2.1. Molecular structure 22
1.2.2.2. Occurrence in cereal grain 22
1.2.2.3. Physicochemical properties and process impacts 23
1.2.2.4. Effects on human health 25
1.2.3. Fructans and β-glucan as functional food ingredients 26
1.3. References 28
2. Variation of fructan, β-glucan and total starch content in developing kernels of
different barley cultivars 45
2.1. Introduction 46
2.2. Materials and methods 47
2.3. Results and discussion 48
2.4. Conclusion 54
2.5. References 55
3. Structure analysis of β-glucan in barley and effects of wheat β-glucanase 59
3.1. Introduction 60
II
3.3. Results and discussion 67
3.4. Conclusion 74
3.5. References 75
4. Air classification as a valuable technique to obtain barley flours with a high
nutritional value 81
4.1. Introduction 82
4.2. Materials and methods 83
4.3. Results and discussion 84
4.4. Conclusion 88
4.5. References 89
5. Conclusions and future perspectives 93
Acknowledgements 95
5
Abbreviations
ANOVA Analysis of Variance
β-Glucan Mixed linkage β-glucan
CF Coarse Fraction
DAA Days After Anthesis
DF Dietary Fibre
DP Degree of Polymerization
dw dry weight
EFSA European Food Safety Authority
FDA US Food and Drug Administration
FF Fine Fraction
fw fresh weight
HPAEC-PAD
High Performance Anion Exchange Chromatography-Pulsed Amperometric Detector
IDF Insoluble Dietary Fibre
LDL Low Density Lipoprotein
MW Molecular Weight
NSPs Non-starch Polysaccharides
PCA Principal Component Analysis
SDF Soluble Dietary Fibre
7
1. State-of-the-art
1.1. Barley (Hordeum vulgare L.)
Barley (Hordeum vulgare L.) is a grass plant first domesticated in Fertile Crescent, in 8000 B.C. in the Israel-Jordan area (Badr et al., 2000) firstly with his wild relative Hordeum spontaneum L. The domestication occurred in the Fertile Crescent is responsible for the diversity of European and American cultivars, while a second domestication allowed a diversity from central Asia to Far East (Morrell & Clegg, 2007). The genus “Hordeum” belongs to the Gramineae (Poaceae) family.
Classification of barley occurs according to different parameters. Barley can be classified according to temperature requirements in:
• winter barley, that must be planted during cold exposure (vernalization) to initiate reproduction. • Spring barley which does not require vernalization and can be sown in spring.
Barley can also be classified according to physical dispositions of kernels on the plant. • Six-rowed barley has three kernels formed on each node of the head;
• two-rowed barley, instead, has one single kernel per side of the head.
Winter barley can be both six rowed and two rowed while spring barley only two rowed. Another difference concerns the structure of the kernel (Newman & Newman, 2008).
• In hulled (covered) barley, the hulls firmly adhere to the caryopsis at maturity; • in hulless (naked) barley the caryopsis is harvested free of the hull.
The characteristic “hulled-hulless” in barley is due to the single recessive gene (nud) in chromosome 7H and to a cementing substance causing hull adherence in hulled barley that is secreted by the caryopsis (Newman & Newman, 2005; Fettel et al., 2010).
1.1.1. Kernel anatomy and development
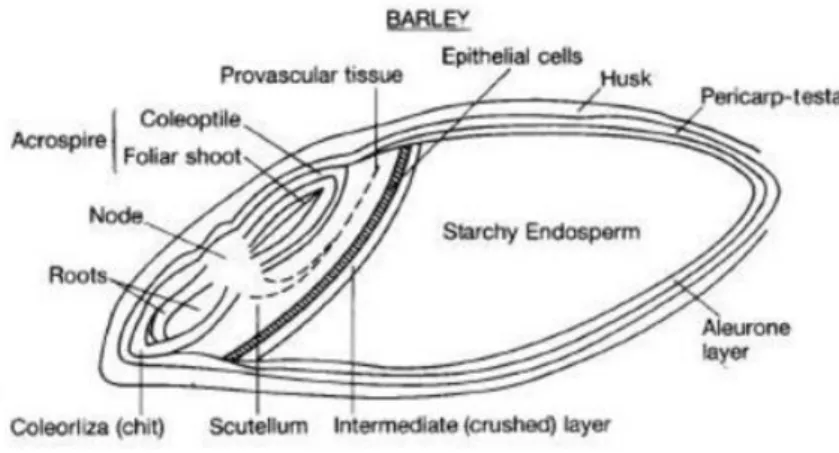
The botanical name of cereal fruit is “caryopsis”, and consists of three main parts: pericarp, endosperm and germ. It is also identified as “grain” or “kernel” which in general consists of the husk, endosperm and embryo (Figure 1.1).
The barley grain has an elongated shape and is divided longitudinally by a crease.
The outer layer of the hulled grain is the husk, composed of the lemma and palea. In barley, the proportion of the husk is about 13% of the grain weight (Evers & Millar, 2002). The pericarp (fruit wall) is the outer layer that covers the caryopsis. It encloses the testa (seed coat) (Freeman & Palmer, 1984). The endosperm consists of the aleurone layer and the starchy endosperm and it is the most important anatomical part in terms of proportion of the grain and food use. The aleurone is found under the testa and nucellus (Newman & Newman, 2008; Evers & Millars, 2002). The cells of the aleurone layer are rich in vitamin, lipid and minerals. The starchy endosperm is the largest proportion of the caryopsis
8
(about 75%) and is made of cells that are packed with starchy grains in a storage protein matrix (Evers & Millar, 2002). It surrounds the embryo and provides nutrients for its germination until the root system is sufficiently developed for photosynthesis. The main constituents of the endosperm cell walls are (1→3)(1→4)-β-glucan (~70% w/w) and arabinoxylan (~25% w/w) (Fincher, 1975).
The embryo arises from the fusion of male and female gametes and contains mostly lipid and lipid-soluble vitamins and is located on the side of the caryopsis attached to the rachis. It is comprised of the embryonic axis and scutellum (Evers & Millar, 2002). The scutellum separates the embryo from the endosperm and is a flat protective tissue.
Figure 1.1. Barley grain anatomy (Roberts T. presentation)
For most cereals anthesis or pollination are often chosen as a starting point to study grain development. Pollination is hard to define as the precise moment when a successful pollen grain lands on stigma is difficult to detect (Evers & Millar, 2002). Anthesis is the time when anthers are first visible outside the floral parts. With this event, pollination takes place followed by fertilization, initiating growth of embryonic seed or kernel.
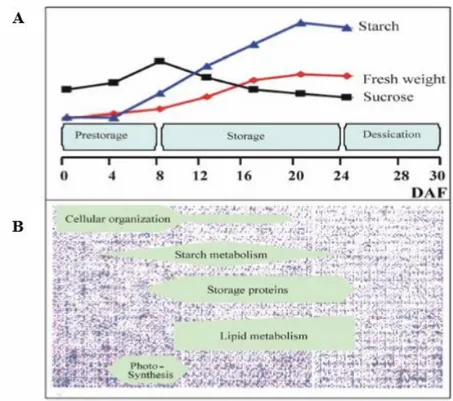
The time length between anthesis and maturity can be divided into three phases, according to growth characteristics and metabolites accumulation: pre-storage (0-8 days after anthesis -DAA), storage (8-24 DAA), desiccation (24-30 DAA) (Wobus et al., 2005; Sreenivasulu et al., 2010) (Figure 1.2; Figure 1.3).
The initial phase of kernel development consists of a progression of cell division and the formation of the seed able to produce a new generation. This stage is particularly important as it will determine the number of cells accumulating starch. Kernels that are crushed in this stage can release a watery substance that then becomes milky. This stage (until 14 DAA) is also called “watery ripe” and then “milky stage”.
In the storage phase genes coding for carbohydrate synthesis are expressed and starch and proteins are accumulated (Figure 1.2). The weight increases and most of the final weight is set in this phase as well as the composition established. Kernels have a semi solid consistency so this phase is also called “soft dough”.
In the desiccation phase the growth of the kernel declines, water content decreases consistently and this phase is also called “hard dough”. This is also when the kernel loses the green color to reach the final
9
weight at maturation. When kernel reaches 30-40% moisture it is at physiological maturity and will not accumulate more dry matter (Anderson et al., 1995).
Figure 1.2. Scheme of barley grain development. A-Biochemical parameters differentiating the developmental stages.
B-Gene expression patterns underlying different developmental stages. DAF= Days after flowering (Wobus et al., 2005).
Figure 1.3. Developmental stages of barley grain, DAP= Days after pollination (Peukert et al., 2014).
1.1.2. Nutritional composition of barley grain
Whole barley grain is composed by 65-72% starch, 10-17% protein, 4-9% β-glucan, 2-3% free lipids and 1.5-2.5% minerals. Total dietary fibre (TDF) ranges from 11-34% and soluble dietary fibre from 3-20% (Holopainen et al., 2014; Baik & Ullrich 2008). Nutritional components of barley can vary according to genotype, agricultural practices and environmental conditions.
10
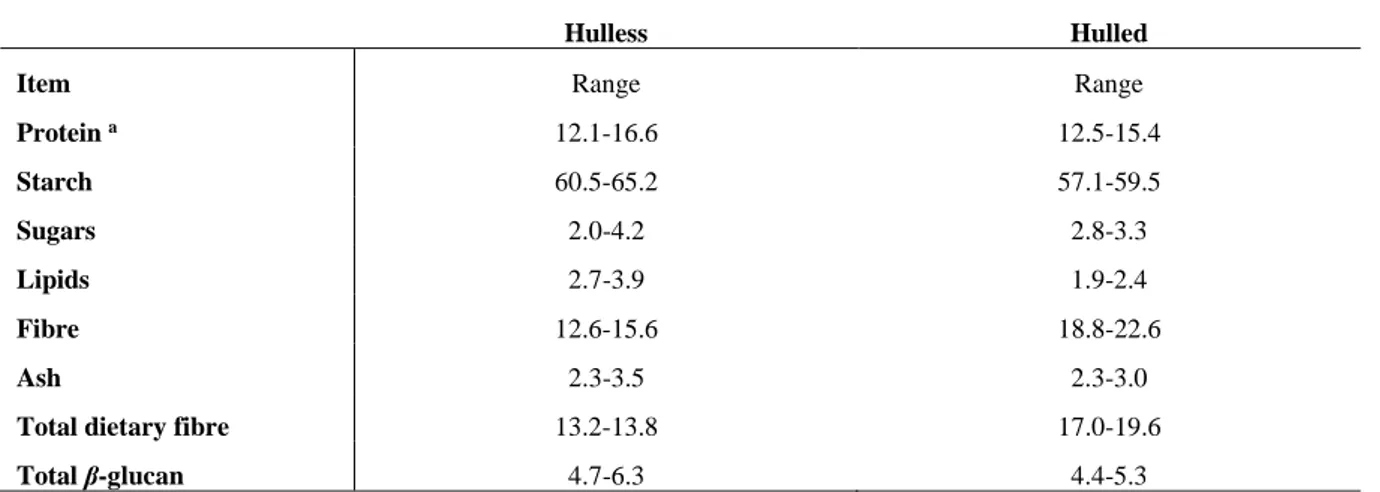
Table 1.1. Composition of barley genotypes (g/100 g dm),
Hulless Hulled
Item Range Range
Protein a 12.1-16.6 12.5-15.4 Starch 60.5-65.2 57.1-59.5 Sugars 2.0-4.2 2.8-3.3 Lipids 2.7-3.9 1.9-2.4 Fibre 12.6-15.6 18.8-22.6 Ash 2.3-3.5 2.3-3.0
Total dietary fibre 13.2-13.8 17.0-19.6
Total β-glucan 4.7-6.3 4.4-5.3
a N x 6.25; (In: Newman and Newman, 2008).
Starch
Starch is the energy reserve of plants and the most abundant biopolymer on earth (Schirmer et al., 2013). Starch consists of two main components, amylose and amylopectin. Amylose is a linear molecule of α-D-glucopyranosyl residues linked 1→4, while amylopectin is highly branched with chains of 1,4-linked α-D-glucose residues connected by 1,6-linkages.
Starch is the main constituent of barley grain followed by non-starch polysaccharides (Holtekjølen et al., 2006). In hull-less species lower TDF and higher starch content were found (Xue et al., 1997). Genotypes of barley can vary according to starch composition and amylose content. Normal starch genotypes have approximately 25% of amylose while waxy genotypes < 15% (2-10%) and high amylose more than 35% (Ajithkumar et al., 2005; Oscarsson et al., 1997). The waxy feature in barley is controlled by a recessive wax gene on chromosome 7HS (Ajithkumar et al., 2005).
Barley starches are a mixture of large lenticular A-type granules (10-25μm) and smaller irregular B- granules (<10 μm) (Schirmer et al., 2013). The small granules account for the 90% of the total number of granules but only for the 10% of the total starch weight (Henry, 1988). Barley A- and B- granules differ for the amylopectin content and structure. Amylose content of small granule is lower than in large granules and the branch-chain length of amylopectin is longer in A-granules than in B-granules (Ao & Jane, 2007; MacGregor & Morgan, 1984; MacGregor & Ballance, 1980; Takeda et al., 1999). Normal barley varieties in general contain a higher amount of starch mainly composed of large granules, whereas genotypes with anomalous starch content contain less starch and smallest granules prevails in high amylose barley (You & Izydorczyk, 2002).
Non-starch polysaccharides
Non-starch polysaccharides (NSPs) in barley are structural elements in the cell walls of hull, aleurone and starchy endosperm tissues, and are mainly composed by arabinoxylans, pentosans, cellulose and β-glucan (Holtekjølen et al., 2006). Hulled varieties have significant higher content of NSPs than do the hulless. Insoluble NSPs content varies from 10.6% to 27.3%. Soluble NSPs is in the range of 4.5-26.9% dw corresponding to 16.4-69.7% of total non-starch polysaccharides.
11
The dominating barley dietary fibre are β-glucans and arabinoxylans (AX) located mainly in the cell walls of the endosperm. Arabinoxylans consist of a linear chain backbone of (1→4)-linked β-D-xylopyranosyl residues to which a α-L-arabinofuranose units are linked as side branches (Izydorczyk & Biliaderis, 1995). The content of AX in barley was found to be 2.89-4.76% (Zhang et al., 2013), while Holtekjølen et al. (2006) found a higher content of AX (7.4-15.7%), compared to other studies. The lowest amount was found among the hulless varieties, consistently with Knutsen & Holtekjølen, (2007), that reported that the hulled varieties had an average content of 6.7% compared to 4.4% in hull-less samples. Arabinose/Xylose ratio (which indicates degree of branching) in barley falls in the range of 0.3-1.1, typical of all cereals (Izydorczyk & Dexter, 2008) but was found to be higher for hulless varieties (Knutsen & Holtekjølen, 2007).
β-Glucans are extensively described in the following chapter.
In barley arabinogalactan content varies from 0.8-1.1% while the cellulose content is in the range 8.0-17.7% (Holtekjølen et al. 2006).
Monosaccharides and oligosaccharides
Glucose and fructose represent less than 10% of the total sugar in barley, being usually < 0.2%. The disaccharides sucrose and maltose have been reported in barley. Sucrose is involved in starch synthesis and accounts for 50% of the sugars in barley ranging 0.34-2% while maltose is < 0.2% (Henry, 1988). Henry & Saini (1989) found that barley had the highest level of sucrose compared to wheat, rye and oats (13.6 mg/g). Waxy gene is related to an increased level of sucrose, due to an altered starch synthesis (Xue et al., 1997). Low amount of raffinose is also detected in barley (Henry, 1988; MacLeod & Preece, 1954).
Protein
Protein content in barley is 10-17% on average. In Holtekolen et al. (2006) the highest amount of protein was found in the high amylose variety, while the normal normal starch hulless variety had higher protein content than the normal hulled varieties. On the other hand, according to Xue et al. (1997), hulless and waxy features do not affect the protein content.
Storage proteins support growing embryo providing nitrogen in case of germination and are disposed in a matrix surrounding endosperm starch granules (Fox et al., 2003). Hordeins are the most important storage proteins in barley. They are evolutionary related to glutenin and gliadin in wheat. Hordeins are classified according to their molecular size and aminoacid composition in B, C, D, γ hordeins (Holopainen et al., 2014). Non-storage proteins can be found in the cell walls and within the protein matrix, but few have been identified and have an impact on the grain quality (Fox et al. 2003). The analysis of composition of barley grains revealed that protein content gradually decreases toward the center of the grain at a pearling rate of 15%.
Proline is the most abundant aminoacid found in wholegrain barley followed by valine. Lower levels of glycine, threonin and arginine were also detected (Sullivan et al., 2010).
12 Lipids
The total lipids include 67-78% of non-polar lipids, 8-13% glycolipids, and 14-21% phospholipids (Morrison, 1993). In barley, the total amount of unsatured fatty acids is 77.09% of the total fatty acids. As for wheat and rye also for barley the major component other total fatty acids is linoleic acid (>50%), followed by palmitic (~20%) oleic (~10%), linolenic and stearic acid (Welch, 1975; Kan, 2015).
Ash
A barley grain contains on average approximately 498 µg of K, P, Mg and Ca combined, with potassium being the mineral present in greater amount, forming nearly 45% of the total content of the four elements of interest followed by phosphorus and magnesium (Kan, 2015; Stewart et al., 1988). Protein bodies of the aleurone layer typically contain Mg, Ca, K, P while Ca is in very low amounts.
Phytochemicals
The role of antioxidants for human health is crucial as they are able to prevent tissues and cellular damages by quenching radicals or preventing their formation. Cereals can be an important source of antioxidant compounds. Barley grain contains much greater amounts of phenolic compounds (0.2-0.4%) than other cereal grains, and they are represented by polyphenols, phenolic acids, proanthocyanidins and catechins that are concentrated in the hull, testa and aleurone (Baik & Ullrich, 2008). Ferulic acid is the most abundant phenolic acid (359-624 μg/g dw) followed by p-coumaric acid (79-260 μg/g) being mainly concentrate in the husk and outer layers (Andersson et al., 2008; Hernanz et al., 2001). Bellido & Βeta, (2009) found that total anthocyanin content in purple and normal barley is 573-210 μg/g. Removal of 10% of the outer layers was a useful strategy to concentrate anthocyanins, as they increased in both purple and normal barley (3533 μg/g- 1587 μg/g). In the samples analyzed in the study, seventeen types of anthocyanin were detected.
The main carotenoids found in cereals are lutein and zeaxanthin. Lutein is abundant in wheat, and is predominant also in oat, barley while zeaxanthin is dominant in maize (Ndolo & Βeta, 2013). In barley, the total carotenoid content was highest in germ fraction (57.3-60.3 mg/kg) and lower in aleurone and endosperm (28.6-28.9 mg/kg) (Masisi et al., 2015; Ndolo & Βeta, 2013). Lutein levels was reported to be 1328 μg/kg in barley germ (while 72-431 μg/kg were reported in wheat and 72-1369 μg/kg in corn) while no trace was found in the endosperm. Zeaxanthin levels is 15139 μg/kg in barley germ while no trace was found in the endosperm, with higher level compared to corn (358-13671 μg/kg) and wheat (7-215 μg/kg) (Masisi et al., 2015).
Alkylresorcinols (AR) are amphiphilic 1,3-dihydroxy-5-alkyl phenolic lipids present in several plant families (Landberg et al., 2014). Alkylresorcinols are located in the outer layer of testa/inner layer of pericarp, mainly in wheat and rye, whereas barley contains a very small amount (Landberg et al., 2014), which can vary between 32 and 103 μg/g dm (Andersson et al., 2008). AR are stable during food processing, therefore they are used as biomarkers to determine the intake of whole grain cereals in the population. The most common AR found in cereal grains are homologue with odd alkyl chains of 17-25 carbon atoms. The source of whole grain can be identified by the relative homologue distribution,
13
specifically the ratio AR C17:0/C21:0, which is generally ~1 for rye, 0.1 for common wheat and 0.01 for durum wheat (Landberg et al., 2014). Alkylresorcinol C25:0 is the most abundant alkylresorcinol found in barley samples. Gómez-Caravaca et al. (2015) found that with air classification total alkylresorcinols increase in barley flour in the range 17.1%-30.2% from whole meal to coarse fraction and decreased from 19.5% to 32.6% in the fine fraction.
Tocols content in barley was found to be 46.2 to 68.8 μg/g dm in wholemeals (Andersson et al., 2008). α-Tocotrienol resulted the most abundant tocopherol, being ≥ 47.7% of total tocols.
1.1.3. Commercial use and economic data
Barley is a staple grown globally. In the year 2014-2015 the world total production was 144.3 million tonnes (International Grains Council1). The Russian federation is the top producer country in the world
with 20 million tonnes, followed by France and Germany with about 11.5 million tonnes and Australia and Ukraine (about 9 million tonnes). In Europe, the total barley production is about 93.5 million tonnes, almost 65% of the world production (Figure 1.4). The total Italian production of barley in year 2014 was 846.142 tonnes (FAOSTAT, year 2014).
Figure 1.4. Barley production share by region (year 2014) (FAOSTAT).
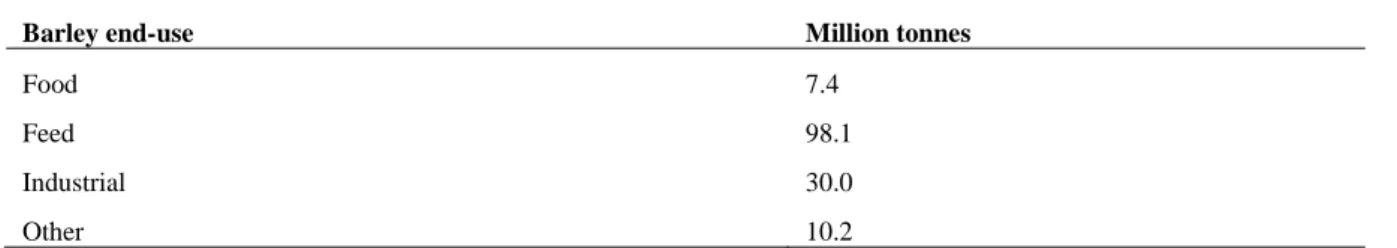
Barley is produced for a wide range of end uses (Table 1.2). The main use is in the feed industry (60% of total barley production), in particular, for cattles, pigs and poultry, where only six-rowed barley is employed. The use of barley directly for human nutrition accounts for 4% of the whole production (International Grains Council, forecast for year 20162). Finally, 20% of barley production is used for
industry, specifically for malt production.
1 http://www.igc.int/en/markets/marketinfo-sd.aspx (2017.04.03, 15.26) 2 http://www.igc.int/en/markets/marketinfo-sd.aspx
14
Table 1.2. End use of world barley production (International Grains Council, forecast year 2016)
Barley end-use Million tonnes
Food 7.4
Feed 98.1
Industrial 30.0
Other 10.2
About 90% of malt is used for beer while the rest is for food substitute (Taner et al., 2004). In year 2015 the European Union (EU) area for malting barley was about 12,200,000 hectars with a production of about 61 million tonnes of barley for malt, with an increase of about 10% compared to 2012. In Europe, Germany and France are the main producers of barley for malting (about 12,000,000 tonnes each), followed by UK, Spain, Denmark, and Poland3.
The EU malting industry accounts for more than 60% of the world malt trade. European malt is exported to all continents: about 804,000 tons is exported to Africa; 650,000 to the America and 840,000 to Asia. About 253,000 tons is exported to European and non-EU countries (2015 data4).
As mentioned before, beer is the main end use of malt. EU is the second largest beer producer in the world after China and the brewing sector contributes to employment in Europe with 2.3 million jobs (Europe Economics 2016).
1.2. Non-starch polysaccharides: fructans and β-glucan
Non-starch polysaccharides (NSPs) include all the plant polysaccharides except for starch, as they differ from starch in the type and number of monomers, the type of linkages and occurrence in the chain. Moreover, starch can be digested by human enzymes as its linkages are hydrolized by pancreatic α-amylase which cleavages only α-1,4-glycosidic bonds, while NSPs cannot be digested and can only be fermented by gut bacteria. NSPs represent the major part of dietary fibre (DF) in grains and it can be considered as NSPs (Englyst, 1989). Many definitions of dietary fibre can be found. The European Union published the definition in the Commission Directive 2008/100/EC, in which dietary fibre means “Carbohydrate polymers with three or more monomeric units, which are neither digested nor absorbed in the human small intestine….”
In 1999 the American Association of Cereal Chemists published the following definition: “Dietary fiber is the edible parts and analogous carbohydrate that are resistant to digestion and absorption in the human small intestine with complete or partial fermentation in the large intestine…” (AACC, 2001). From a structural and nutritional point of view, dietary fibre can be broadly classified as soluble and insoluble. Soluble dietary fibre (SDF) (which includes pectin, gums, mucillagines, β-glucan), delays the
3http://www.euromalt.be/data/14851931551_Spring%20and%20winter%20barley%20from%202012%20to%202
015.pdf (2017.04.03, 15.32).
4http://www.euromalt.be/data/14851984045_Exports%20by%20destination%20from%202009%20to%202015.p
15
postprandial gastric emptying, reducing the absorption of some nutrients in the small intestine, mainly starch and glucose. Insoluble dietary fibre (IDF) which includes cellulose, hemicellulose and lignin, have mainly a bulking effect increasing the fecal mass.
Despite they do not provide energy for human nutrition, NSPs have a wide variety of beneficial effects on human health, starting from the good functioning of human digestive system. In fact, dietary fiber promotes beneficial physiological effects including constipation prevention, blood cholesterol attenuation and reduced risk of the onset of diabetes (Kumar et al., 2012).
1.2.1. Fructans
1.2.1.1. Molecular structure
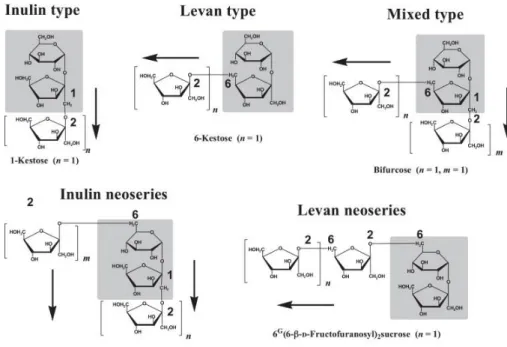
Fructans are linear or branched polysaccharides mainly composed of fructose units linked by β(2-1) or β(2-6) bonds (Livingston et al., 2009). The first part of the molecule can be formed by sucrose, but it is not necessary for the molecule be considered as fructan. In fact, fructans structure can be simplified as GFn (with glucose-fructose units) or Fn (with only fructose units) (Roberfroid, 2005). Fructans can be described by the degree of polymerization (DP). Inulin is a linear fructan with 2-1 linkages with a DP from 2 to 60. Inulin-type fructans include inulin and fructoligosaccharides (FOS) which instead have a DP between 2 and 10 (Niness, 1999). The shortest form is the trisaccharide 1-kestose. Levans are linear fructans with 2-6 linkages. Graminans are branched fructans reported in cereals with both 2-1 and 2-6 linkages. Inulin neoseries has 2-1 linkages but with glucose molecules with fructosyl subunits. Levan neoseries is based on 6G-kestotriose (Figure 1.5).
Fructans synthesis occurs in the vacuole and is achieved by a pool of enzymes named fructosyltransferase (FTs), whose characteristics are the following, despite the model may be more complicated (Livingston et al., 2009).
The enzyme sucrose-sucrose 1-fructosyl transferase (1-SST) forms 1-kestose from sucrose releasing a glucose. The enzyme fructan-fructan 1-fructosyltransferase (1-FFT) elongates the chain by adding fructose units, forming inulin. In cereals, sucrose-fructan 6-fructosyltransferase (6-SFT) transfers a fructose unit from sucrose to 1-kestose producing levan and branched fructans. The enzyme 6G-fructosyltransferase (6G-FFT) causes the elongation of 6G-kestose and produces inulin of neoseries. Fructans hydrolysis, however, is carried out by fructan exohydrolase (FEH). The enzyme 1-FEH hydrolyzes 2-1 linkages, while 6-FEH mainly 2-6 linkages. Graminan-type fructans in cereals require both the enzymes to be hydrolyzed with the 6-kestose exohydrolase (6-KEH) catalyzing the hydrolysis of 6-kestose to sucrose and fructose (Van den Ende et al., 2004).
16
Figure 1.5. Fructan types in plants (Benkeblia, 2013)
1.2.1.2. Physiological role in plants and occurrence in cereal grains
Fructans are reserve carbohydrates, and are synthetized by 15% of higher plants (Hendry, 1993), but their physiological role in plants is wider. For instance, fructan synthesis lowers sucrose concentration in the cell and prevents negative feedback on photosynthesis induced by sucrose (Vijn & Smeekens, 1999).
Fructans are involved in kernel development and in resistance to abiotic stresses like freezing and drought (Livingston et al., 2009) as well as water stress during grain filling (Wardlaw & Willebrink, 2000; Yàñez et al., 2017). In fact, fructans are highly soluble in water, and their synthesis pathway continues also at low temperatures. Fructans are a source of hexose sugars that can lower the water potential of intracellular liquids, allowing the resistance over drought. Cold stress activates FEH to degrade high DP fructans into lower DP fructans as it was demonstrated that in cold acclimatation plants showed increased fructans content (Bravo et al., 2001) and that an accumulation in roots system is a strategy to recover after cold stress (Abeynayake et al., 2015). The role of sugars oligosaccharides and fructans is to replace water during cold exposure and drying and binding phospholipids through hydrogen bonds thus maintaining the fluidity of the membrane (Crowe et al.,1987; Vereyken et al., 2001) with differences according to the type of family and DP (Cacela & Hincha, 2006).
Reactive oxygen species (ROS) are short-lived highly reactive molecules and their generation in the cell is in equilibrium with antioxidants defences such as enzymic and non-enzymic scavengers (Redza-Dutordoir & Averill-Bates, 2016). Recently, it was also demonstrated a role of fructans in hydroxyl radical scavenging in vitro, comparable to phenolic compounds (Peshev et al., 2013) suggesting an important role in quenching ROS species in the cell and contributing to abiotic stress tolerance (Keunen et al., 2013).
17
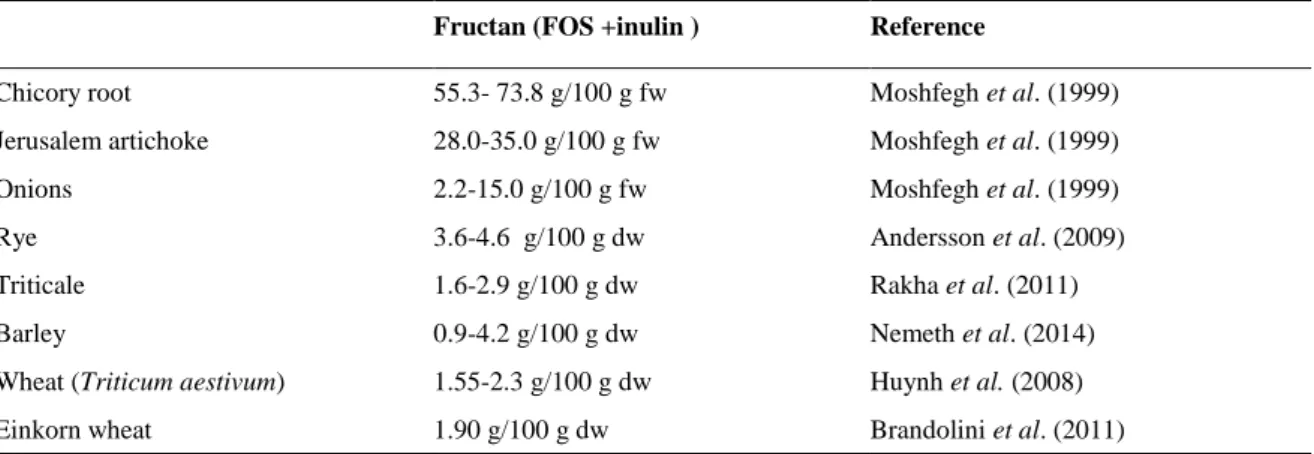
Mature cereal grains are not good source of fructan compared to other edible plants (Table 1.3). Nevertheless, the occurrence of their consumption make them important contributors to fructan intake as, for example, it is reported that wheat provides 70% of fructan intake in the diet of the U.S. population (Moshfegh et al., 1999). Mature wheat kernel contains fructans with both β(2-1) and β(2-6) fructosyl linkages belonging both to graminans and neo-type (Verspreet et al., 2015a; Verspreet et al., 2015b ). In wheat, fructan content is higher in shorts and bran compared to flour and the maximum DP is 19 (Haskå et al., 2008). Fructan content in barley was originally quantified as between traces and 0.8 g/100 g dw (Åman et al., 1985) while more recent studies reported a much higher content. Nemeth et al. (2014) found a value between 0.9 and 4.2% dw, a maximum DP of 19-20 and a higher proportion of fragments DP ≤ 10. Also in Triticale the majority of fragments has a DP 3-9 (Rakha et al., 2010).
Immature cereal kernels contain a much higher quantity of fructan, which declines with maturation. The peak was reported at 9 DAA (days after anthesis) for wheat, rye, barley and triticale with a higher concentration found in barley (39 g/100 g meal at 4% moisture) (Nardi et a.l, 2003). De Gara et al. (2003) studied fructan accumulation in Triticum durum finding a maximum at 17 DAA (mg/kernel). In Triticum aestivum, fructan content is the highest at 16 DAA (2.5 mg/kernel) (Verspreet et al., 2013). All fructan synthetizing enzymes are active during the first two weeks, while fructan degrading enzymes are still active during maturation. The activity of FEH was also recorded at 7 DAA in T. durum kernels (Cimini et al., 2015). The pattern of fructan accumulation/degradation may be explained by their physiological role. The synthesis of fructan starting from sucrose may avoid a negative feedback on photosynthesis during kernel development, and their degradation may suggest a role in regulating the osmotic pressure when the kernel accumulates water (Cimini et al., 2015).
In barley in the pre-storage phase (until 6 DAP- days after pollination), it was reported an abundance of oligosaccharides of DP 4-7 in the pericarp. In total fructan content is 2.4% fw (fresh weight) (Peukert et al., 2014).
Table 1.3. Fructan quantity in some consumed foods (dw= dry weight, fw= fresh weight).
Fructan (FOS +inulin ) Reference
Chicory root 55.3- 73.8 g/100 g fw Moshfegh et al. (1999)
Jerusalem artichoke 28.0-35.0 g/100 g fw Moshfegh et al. (1999)
Onions 2.2-15.0 g/100 g fw Moshfegh et al. (1999)
Rye 3.6-4.6 g/100 g dw Andersson et al. (2009)
Triticale 1.6-2.9 g/100 g dw Rakha et al. (2011)
Barley 0.9-4.2 g/100 g dw Nemeth et al. (2014)
Wheat (Triticum aestivum) 1.55-2.3 g/100 g dw Huynh et al. (2008)
Einkorn wheat 1.90 g/100 g dw Brandolini et al. (2011)
1.2.1.3. Effects on human health
The gastrointestinal tract is the primary endpoint of fructans action, influencing the gut microbiome composition of the colon which is involved in immunological and physiological functions contributing
18
to the homeostasis of the host (Meyer & Stasse-Wolthuis, 2009; Roberfroid, 2007; Schroeder et al., 2009).
Fructans are considered prebiotics (Gibson, 1999; Roberfroid & Delzenne, 1998). A prebiotic is defined as a “selectively fermented ingredients that allows specific changes both in the composition and/or the activity in the gastrointestinal microflora that confers benefits upon host well-being and health” (Roberfroid, 2007a). Inulin-type fructans (ITF) are fermented in the large bowel and produce short chain fatty acids (acetate, propionate and butyrate) and lactic acid which are energy sources for microbic metabolism, for cell division and differentiation, and also reduce the pH of the gut (Roberfroid & Delzenne, 1998)5. Administration of fructan has a bifidogenic effect, modulating the growth of the
beneficial species Bifidobacterium spp in the gut (Bouhnik et al., 2007; Dewulf et al., 2011; Guigoz et al., 2002; Salazar et al., 2015) with larger effects observed for high DP fructan (Van de Wiele et al., 2007). By influencing the colonic microbiome and the gut health, inulin-type fructans can improve the well-being and potentially reduce the risk of onset of different diseases (Guarner, 2005; Meyer & Stasse-Wolthuis, 2009; Roberfroid, 2007b). Fructans from cereals have similar fermentation profiles compared to extracts, so they can be potentially used as an alternative source of FOS (Belobrajdic et al., 2012; Jenkins et al., 2011).
Inulin-type fructans may improve calcium absorption and calcium balance probably due to both a transfer of calcium from the small intestine in the large bowel and an improved calcium availability in the colon as a result of their fermentation (Abrams et al., 2007; Roberfroid & Delzenne, 1998) therefore affecting bone health (Coxam, 2007). Supplementation with 8 g of ITF significantly increased bone mineralization in adolescents (Abrams et al., 2007). Inulin enriched oligofructose (10 g/day) increased calcium absorption in post-menopausal women and short term decrease of markers of bone resorption (Holloway et al., 2007).
The gut associated lymphoid tissue is the largest lymphoid tissue in the body, and one of its key function is the ability to identify harmful bacteria and elicit appropriate response. Colonization with bacteria is the event that allows and adequate development of mucosa immune system. Bacteria and epithelium communicate and this leads to metabolic and immunological reactions by the epithelial cells and its underlying lymphoid cells (Forchielli & Walker, 2005). Administration of fructoligosaccharides can induce immunological response by acting by signaling human immune cells (Vogt et al., 2013; Hosono et al., 2003).
In rats, it has also been proven tumoricidal effects of fructan on colon cancer (Choque et al., 2015). In animal models, fructans and and fructans containing foods cause a reduction of body weight (Belobrajdic et al., 2012; Rendón-Huerta et al., 2012). Total energy intake was significantly lower in rats fed with inulin type fructans with effects mediated by the hormone GLP-1 (glucose-like peptide 1)
5The “prebiotic index” is the increase in bifidobacteria expressed as the absolute number (N) of new cfu/g of faeces divided
by the daily dose (in g) of inulin type fructans ingested in each individual human nutrition trial. The prebiotic index of inulin type fructans is 108 N/g, comparable for the different types of inulin (Roberfroid, 2007b).
19
and the production of butyrate (Cani et al., 2004) also compared to a high fat diet (Cani et al., 2005). Increase of satiety was reported in healthy human subjects (Cani et al., 2006) mediated by hormonal regulation (Cani et al., 2009). In obese and overweight subjects, supplementation with oligofructose reduced body weight significantly (Parnell & Reimer 2009). Effects on body weight may be mediated by the lower caloric content of fructans. In fact, the energy content of fructans is 40-50% of that of a digestible carbohydrate giving a caloric value of 1-2 kcal/g (Kaur & Gupta, 2002; Roberfroid & Delzenne, 1998).
The meta-analysis of Liu et al. (2016) highlighted effects on fructan intake on LDL cholesterol (low density lipoprotein) reduction, while only two studies reported reduction of blood glucose levels. Dehghan et al. (2014) reported that oligofructose enriched inulin caused a decrease of fasting glucose levels in women with type-2 diabetes. Regulation of serum glucose may be explained by a delay of the carbohydrate absorption, or a modulation of hepatic gluconeogenesis (Roberfroid & Delzenne, 1998). Reduction of serum triglycerides is one of the most important goal in order to prevent cardiovascular diseases. Feeding rats with 10% oligofructose significantly decreased serum triacylglycerols, mainly because of a reduction of the VLDL (very low density lipoprotein), with a reduced de novo lipogenesis rather than an increased catabolism (Delzenne & Kok, 2001). Merendino et al. (2006) demonstrated that rats fed with immature wheat kernels displayed a proliferation of lymphocytes and reduction of LDL cholesterol and triglycerides after several weeks of treatment. The meta-analysis reported in Brighenti (2007) over a 10 years period, revealed that the intake of 10 g/day inulin type fructans significantly decreases serum triacylglycerols in humans (-7.5%). It is reported that the effects are mainly mediated by gut fermentation, reduction of hepatic lipogenesis and synthesis of gastrointestinal hormones, rather than by blood glucose regulation. Chicory inulin (20 g/day) significantly reduces triglycerids in hypercholesterolemic men whereas association with cholesterol reduction resulted to be weaker (Causey et al., 2000).
Clinical trials reported that fructan intake may cause gastrointestinal symptoms. In general, the intake of inulin and short oligofructose in quantity lower than 15 g/day resulted to be well tolerated, eventually with mild transient events (Grabitske & Slavin, 2009). However, in a human trial 14 g of oligofructose caused gastrointestinal symptoms in healthy women (Pedernse et al., 1997).
Fructans are considered as “FODMAP”, thus their consumption is reduced in specific diets targeting management of symptoms of the irritable bowel syndrome (abdominal pain, bloating and altered bowel habits) (Mansueto et al., 2015). FODMAP stands for “Fermentable Oligosaccharides, Disaccharides, Monosaccharides And Polyols” and are a group of poorly absorbed short chain carbohydrate including fructoligosaccharides, lactose, fructose, galactan and sorbitol. Barrett et al. (2010) provided evidences that the effects of FODMAP ingestion on irritable bowel syndrome (IBS) symptoms depend on poor absorption, on the increase of fermentable load and volume of liquid delivered to the proximal colon. This may be the mechanism explaining diarrhoea in some individuals (Barrett & Gibson, 2012). Reducing of FODMAP in the diet has been connected to a durable improvement in symptoms affected by IBS and quality life improvement (Gearry et al., 2009; Marsh et al., 2016) with effects on
20
fermentation and gas production, thus minimizing luminal distension and symptoms severity (Barrett & Gibson, 2012). The drawback of low FODMAP diet may be the reduction of intake of fermentable substrates for gut microflora. In fact, low FODMAP diet reduces the population of bifidobacteria after 4 weeks so a combination with probiotics is suggested (Staudacher & Whelan, 2016).
1.2.1.4. Physicochemical properties
Physical and chemical characteristics of inulin make it a food hydrocolloid used as an ingredient for multiple food applications. Hydrocolloids are generally defined as long chain polymers able to form viscous dispersion or gels in water (Milani & Maleki, 2012).
Inulin tends to aggregate in aqueous solutions forming supramolecular structure due to hydrogen bonding and hydrophobic interactions showing a critical aggregation concentration. Viscosity of inulin resulted to be proportional to molecular weight and concentration (Dan et al., 2009). In fact, above 15% concentration, inulin is able to form gel, by a network of small crystallites, showing a fat like texture. Concentration of inulin influences also the effect of temperature on gel formation. Inulin starts forming gels from 60 °C onward till 100% of gel at 70 °C. This is due to the kinetics energy that can allow contact between inulin chains (Kim et al., 2001). Inulin at 25 °C is almost insoluble, at 50 °C its solubility is only 1-2%, but increased temperature increases solubility reaching 34% at 90 °C (Kim et al., 2001). Glibowski (2010) demonstrated that combination of critical temperature and stirring time causes a reduction in viscosities increase due to inulin dissolution. Like other polymers, also inulin exhibits a glassy state which is described by the fundamental parameter of Tg (glass transition
parameter). Basically, for temperature greater than Tg the material is a viscous liquid, whereas below
this temperature, the glass transition itself forms an amorphous solid (Forrest et al., 1996). Glass transition temperature may vary according to moisture content (Zimeri & Kokini, 2002).
1.2.1.5. Effects of fructan addition on cereal-based products
Addition of inulin decreases water absorption of the dough, and increases time for dough development (Morris & Morris, 2012; Peressini & Sensidoni, 2009). Inulin delayed starch gelatinization and reduced water absorption during heating and in general replacement with up to 5% inulin resulted in acceptable characteristics of bread (Peressini & Sensidoni, 2009). In Juszczak et al. (2012) the presence of inulin decreased paste viscosity and increase gelatinization temperature of gluten-free dough.
In Ziobro et al. (2013) the addition of inulin with DP ≤ 10 caused an increase in loaf volume of gluten free breads, proportional to the concentration of inulin. Addition of inulin with DP ≥ 23 however did not affect leaf volume compared to control. The authors explain these data by a fact that mono and oligosaccharides released from low DP inulin compete with starch for unbound water, and at the same oligosaccharides and free sugars are easily used by yeasts.
More recently, Peressini et al. (2015) investigated the effect of inulin addition on extruded snacks, reporting a reduction of dough development due to inulin addition.
21
In pasta samples, Brennan et al. (2004) reported that inulin addition causes an increase in dry matter, a decrease of water absorption and loss of firmness at 10%. Aravind et al. (2012) however reported an increase in water absorption, a decrease of total gluten but not of the gluten index, optimal cooking time also increased with the higher concentration of inulin. Addition of inulin to formulations for spaghetti production had detrimental effects on sensory properties of the final product (Padalino et al., 2017).
1.2.1.6. Processing impacts
Because of their positive effects on human health, the impact of processing on fructan in foods should be evaluated. Bread making process has shown a negative effect on fructan composition probably due to enzymes of plants and microorganisms (Boskov Hansen et al., 2002). Morris et al. (2015) showed that inulin, which has a higher DP, was not degraded while FOS underwent degradation during bread making process. These findings are in agreements with Praznik et al. (2002). Baking process had a minor effect on long DP fructans in bread with substitution 10-12% with Jerusalem artichoke fructan. In the study of Gélinas et al. (2016) concentration of fructan dropped with or without baker’s yeasts, while baking showed no effects on fructan structure. However Knez et al. (2014) reported no statistically significant loss of fructan in yeast free and unleavened wheat and rye bread while leavened bread significantly reduced the fructan content by 30%. Also, flour containing low DP fructan degraded more compared with fructan with a high DP (Andersson et al., 2009). Andersson et al. (2004) showed that air leavened non-fermented crisp bread had a similar amount of fructan as the flour, while yeast-fermented and especially sour dough bread had a reduced content. It is clear that yeasts activity is the primary cause of fructan drop in bread, therefore strategies to minimize fructan degradation mediated by yeast should be evaluated (Verspreet et al., 2013).
Pasta making also affects fructan content in the final product. Little effects of drying were observed, while a great amount of fructan, both FOS and inulin, were lost in boiling water compared with the uncooked samples, probably because of their higher solubility especially at high temperature (Bustos et al., 2011; Casiraghi et al., 2013; Gélinas et al., 2016).
Extrusion process, in particular when performed at high temperature, reduces the FOS levels in the final products, while inulin levels resulted to be more affected by the screw speed (Duar & Hoffman, 2015). These results are in agreement with Peressini et al. (2015) which also reports a loss of prebiotic compounds in extruded snacks.
Temperature and pH conditions during food processing may result in a degradation of fructan. Degradation was shown to occur at high temperature (60-120 °C), with a rate depending on pH (L’Homme et al., 2003; Matusek et al., 2009). FOS resulted to be more sensitive to acidic conditions (Courtin et al., 2009) while inulin has a higher thermostability at low pH (Duar & Hoffman 2015). For identical pH and temperature shortest oligomers are degraded faster (Blecker et al., 2002).
Dry heating of inulin at 165 °C reports an increase in low molecular weight compounds with DP below 13. After heating 30 minutes at 195 °C fructose oligomers tend to disappear (Böhm et al., 2005). Interestingly, dry heated inulin can improve the composition of gut microflora and preventing the growth
22
of harmful bacteria (Böhm et al., 2006). These effects are probably due to the formation of D-fructose dianhydride, a non-digestible and non-absorbable oligosaccharide which has shown positive effects on gut microbiota (Saito & Tomita 2000).
1.2.2. β-Glucan
1.2.2.1. Molecular structure
Mixed linkage β-glucan (hereafter referred to as β-glucan) are linear homopolymers of β-D-glucopyranosyl residues linked by two or three consecutives (1-4) linkages that are separated by a single (1-3) linkage (Figure 1.6) (Izydorczyk & Dexter, 2008). Approximately, the distribution of β-(1→4) and β-(1→3) linkages is 70% and 30% respectively. In barley, the average molecular weight of β-glucan is 1.5-1.8x10⁶ g/mol. β-Glucan is part of the soluble dietary fiber, despite a proportion can be found in the
insoluble fiber, in barley approximately 25% (Johansson et al., 2004). The structural features of β-glucan have been extensively studied through hydrolysis by lichenase. Lichenase is an endohydrolase which breaks specifically β(1-4) bonds which are linked at C-O-3, yielding mainly trisaccharides (3-O-β-D-cellobiosyl-D-glucose) and tetrasaccharides (3-O-β-D-cellotriosyl-D-glucose). The sum of tri and tetrasaccharides (DP3, DP4) after lichenase treatment was reported to be 90% of the total subunits (Cui et al., 2000). The specific ratio is also called DP3/DP4 ratio and it is very variable, depending on the source. In barley, the DP3/DP4 molar ratio is approximately 2-3 (Johansson et al., 2004; Knutsen & Holtekjølen, 2007). This ratio is a structure fingerprint of β-glucan as the occurrence of (1-3) linkages along the chain and their arrangement influences β-glucan tridimensional structure and thus behavior in solutions and functional properties. In fact, higher DP3/DP4 ratio leads to higher probability of interchain aggregation through hydrogen bonds and thus a lower solubility in water and a higher ability to form gels (Izydorczyk et al., 1998).
1.2.2.2. Occurrence in cereal grain
β-Glucans are one of the major non-starch polysaccharides in barley and they are mainly located in the endosperm cell walls where they account for 70% of the total components (Fincher, 1975). In barley the
23
content of β-glucan falls in the range 2-11% (Baik & Ullrich, 2008; Holtekjølen et al., 2006; Izydorczyk et al., 2000) and it is influenced by both genetic and environmental factors. The highest content of β-glucan is normally reported in high amylose and waxy barley followed by zero amylose and normal barley (Andersson et al., 2008; Izydorczyk et al., 2000). Hulless barley contains a higher level of β-glucan compared to hulled barley, due to its localization in the endosperm cell walls (Holtekjølen et al., 2006; Izydorczyk et al., 2000).
β-Glucan are part of the dietary fiber but is the soluble fraction which has effects on glucose and cholesterol levels in blood. Therefore, in the evaluation of β-glucan quantity, the soluble fraction should always be determined (Izydorczyk et al., 2000). Extraction parameters such as temperature, pH and endogenous enzyme activity can greatly influence estimation of β-glucan yields (Åman & Graham, 1987). The water extractable β-glucan is higher in high amylose, and waxy barley than in normal barley (Ajithkumar et al., 2005; Izydorczyk et al., 2000).
Fractioning of the kernel showed that the distribution of β-glucan in the kernel is uneven. When bran, shorts and flour are analysed, the β-glucan result to be more concentrated in the shorts or middlings (Sullivan et al., 2010; Zheng et al., 2011) fractions which are between the bran and the endosperm.
1.2.2.3. Physicochemical properties and process impacts
Viscosity is the quantity that describes the resistance of a liquid to flow. Viscosity is represented by the symbol “η” and is the ratio between the shearing stress and the velocity gradient (shear rate). According to the Newton’s law for an ideal viscous liquid the viscosity η is constant. The polymers that follow such equations are called Newtonian’s fluids, otherwise they are called non-Newtonian’s fluids. When the solution viscosity decreases with increase of shear rate, the solution is said to have a shear thinning flow behavior. On the other hand, if the solution viscosity increases with increasing shear rate, the solution has a shear thickening flow behavior (Bolmstedt, 2000). Specific viscosity describes the fractional increase in viscosity upon addition of polysaccharide. Intrinsic viscosity is defined as dividing the specific viscosity to the polymer concentration, extrapolated to zero concentration (cm3/g, dl/g) and
it is proportional to molecular weight. In a dilute solution, when concentration increases to a critical point (c*), molecules in the solution begin to overlap with each other. When the polymer concentration exceeds c* polymer chains starts to interact with each other forming networks.
Size and structural features of β-glucan are important for viscosity and rheological properties. Viscosity values in β-glucan samples was reported to be between 0.63 and 3.01 dl/g (Vaikousi et al., 2004). The intrinsic viscosity of β-glucan solutions in oat increased with the increase of molecular weight at 20°C (Lazaridou et al., 2003). The estimated coil overlap parameters “c*η” and “c** η” ranged between 0.19-0.56 and 2.12 and 2.86 (Vaikousi et al., 2004).
In mixed linkage β-glucan solutions, the critical concentration and shear thinning properties are influenced mainly by the molecular size of polysaccharides and are less dependent on the structure (Lazaridou et al., 2004). The intrinsic viscosity values for β-glucans ranged between 2.98-3.11 dl/g for the high molecular weight and 1.56-1.86 (Lazaridou et al., 2004) for the low molecular weight.