NOTA: tagliare il blocco di pagine della tesi (stampata fronte-retro)
lungo le due linee qui tracciate prima di effettuare la rilegatura
La terza linea, sulla destra, indica il taglio finale che può essere fatto
prima o dopo la rilegatura (io direi dopo, ma chiedete a chi fa la
rile-gatura).
N
O
T
A
:
an
ch
e
q
u
es
ta
p
ag
in
a
b
ia
n
ca
fa
p
ar
te
d
el
b
lo
cc
o
d
i
p
ag
in
e
d
el
la
t
es
i
Territorial Risks XXX cycle
Francesca Barbagallo
AN OVERDAMPED MULTIMODAL ADAPTIVE
NONLINEAR STATIC PROCEDURE FOR SEISMIC
ASSESSMENT OF RC INFILLED BUILDINGS
Supervisor:
Prof. Edoardo M. Marino
Advisors:
Prof. E. M. Marino Prof. A. Ghersi Prof. M. Nakashima
Introduction ... 7
Chapter 1 ... 13
SEISMIC ASSESSMENT OF EXISTING STRUCTURES ... 13
1. State of the art of nonlinear methods of analysis ... 13
2. The conventional pushover analysis ... 19
3. Nonlinear static methods in seismic codes ... 22
3.1. The equivalent SDOF system according to the N2 method ... 24
3.2. The equivalent SDOF system according to the capacity spectrum method ... 25
4. The multimodal pushover analysis ... 26
4.1. The multimodal pushover analysis by Chopra and Goel ... 28
5. The adaptive pushover analysis ... 35
5.1. The adaptive pushover analysis by Gupta and Kunnath ... 38
5.2. The displacement adaptive pushover analysis by Antoniou and Pinho ... 40
6. The N1 method ... 46
7. The Advanced N1 method by Ghersi et al. ... 48
8. Evaluation of displacement demand of structures ... 51
8.1. Estimation of maximum displacement demand and influence of the equivalent viscous damping ... 51
8.2. Evaluation of the hysteretic damping ... 53
8.3. Formulations for the determination of equivalent viscous damping ... 54
Chapter 2 ... 57
PROPOSAL OF THE OVER-DAMPED DISPLACEMENT ADAPTIVE PROCEDURE ... 57
1. Object ... 57
2. Description of the over-Damped Displacement Adaptive Procedure 58 2.1. Definition, application and scaling of the load vector ... 59
2.2. Association of the displacement demand to the peak ground acceleration ... 63
2.3. Application of the overdamping correction ... 64
3. Influence of the energy dissipation through equivalent damping .... 66
3.1. Definition of the set of accelerograms and evaluation of the parameter η ... 67
3.2. Influence of the equivalent viscous damping on the evaluation of seismic demand ... 72
4. Numerical example of the D-DAP ... 74
Chapter 3 ... 81
DESIGN OF CASE STUDY FRAMES ... 81
1. Object ... 81
2. General description of the case study frames ... 84
3. Design of GL frames ... 88
3.1. Loads, materials and design procedure ... 88
3.2. Geometrical characteristics of GL frames ... 91
4. Design of SR frames ... 93
4.1. Loads, materials and design procedure ... 93
4.2. Geometrical characteristics of SR frames ... 96
Chapter 4 ... 101
CALIBRATION OF THE D-DAP ... 101
1. Object and research methodology ... 101
2. Modelling of reinforced concrete frames ... 103
2.1. Set up of the numerical model ... 103
2.2. Loads and masses ... 104
2.3. Modelling of RC members ... 106
2.4. Modelling of infill panels ... 111
3. Sensitivity analysis of the parameters ruling the D-DAP ... 113
3.2. Evaluation of the displacement step size ... 117
4. Calibration of the equivalent damping law ... 120
Chapter 5 ... 127
VALIDATION OF THE D-DAP ... 127
1. Object ... 127
2. Research methodology ... 128
3. Analysis of the results ... 129
3.1. Global response ... 130
3.2. Local response ... 133
4. Global evaluation of the D-DAP effectiveness ... 141
Chapter 6 ... 149
APPLICATION OF D-DAP IN SEISMIC UPGRADING: AN EXAMPLE 149 1. Object ... 149
2. The base shear capping building: fundamental characteristics and experimental results ... 151
2.1. Basic behaviour of the base shear capping building ... 151
2.2. Experimental studies on the base shear capping system ... 154
3. Seismic assessment and upgrading of an existing RC frame ... 165
3.1. Assessment of the existing RC building ... 166
3.2. Effect of the seismic upgrading of RC building by the base shear capping system ... 168
Conclusions and future developments ... 171
References ... 179 Appendix A ... 189 Appendix B ... 199 Appendix C ... 209 Appendix D ... 229 Appendix E ... 249 Appendix F ... 269
The intense research activity of the previous century has focused main-ly on the development of design processes that could effectivemain-ly control the seismic behaviour of new buildings. Indeed, the large amount of da-ta collected from previous seismic events, together with the develop-ment of sophisticated programs for structural calculations, improved the reliability of the design approaches of new buildings adopted by en-gineers in seismic areas. Furthermore, in order to increase even more the level of structural safety, modern seismic codes have imposed that new seismic resistant constructions fulfil very strict requirements, in terms of limit states to be verified and quality of construction details. As a consequence, today the seismic risk of new buildings should be deeply reduced.
Unfortunately, not every building in earthquake prone regions re-spond to the abovementioned design process. In particular, in the Medi-terranean area, as well as other European countries, less than the 10% of the buildings were designed according to modern seismic approaches. Indeed, the main part of the existing building heritage is the product of the so called “economic boom”, that gave a strong impulse to the build-ing activity in the second half of the XX century. The problem is that the seismic zonation at that time was very different from today, and many regions were not considered seismic areas yet, or were classified as sites with a lower seismic risk than today. Thus, the buildings that were constructed in those years were supposed to sustain gravity loads only, or to resist seismic actions lower than those expected today.
Despite their inadequacy to fulfil the requirements of modern seis-mic codes, those buildings are still fully in function, and are expected to face the earthquakes that will unavoidably occur in future years. How-ever, because of the preservation oriented approach typical of the Medi-terranean culture, and the recent economic crisis that has stopped the construction market, a complete renewal of the existing building herit-age is not possible. Nonetheless, it is clear that the reduction of seismic risk of existing structures is a pressing needing, to avoid inestimable human casualties and economic losses. Because of this, the process of seismic assessment and upgrading of existing structures has gained always more importance in recent years, as it is the most appropriate tool to detect the structural deficiencies and conceive the relevant retro-fit interventions, which in turn reduce the seismic vulnerability. Re-cently, new national laws have been adopted to rule the process of seismic assessment, and to create a culture of seismic prevention even in the “non-technical” population. To this end, the Italian government has introduced in March 2017 a new national decree for the seismic classification of existing structures. According to this, buildings have to be classified into five seismic classes, from E to A. Low seismic classes (such as D or E), include buildings with very weak seismic resistance, while highest classes (up to A) include buildings capable of a better seismic performance. The seismic classification of every building de-pends on the maximum peak ground acceleration they can withstand and the economic losses expected in case of seismic events. If seismic upgrading interventions are introduced, the seismic class of the build-ing can be improved. It is particularly interestbuild-ing that, this classifica-tion is tightly related to the estimaclassifica-tion of the capacity of the structure, and an accurate seismic assessment of the structure is necessary for a reliable evaluation of the seismic class. Based on the frame depicted above, it is clear that the seismic assessment of existing buildings is the fundamental step to (i) estimate the seismic capacity of the initial structure and identify the seismic class of the building, (ii) predict the collapse mechanism and the structural weakness, (iii) select the most appropriate seismic retrofitting technique and determine the seismic class of the upgraded building.
Recently, the scientific research has been devoting increasing ef-forts in developing methods of analysis to predict the seismic behaviour of existing structures. Since the XX century, linear analyses, such as modal response spectrum analysis or linear static analysis, were adopt-ed as simplifiadopt-ed approaches to pradopt-edict the seismic response of struc-tures. However, since real structures cannot keep an elastic behaviour under strong earthquakes, the prediction obtained by linear analysis cannot be accurate. Indeed, a reliable estimation of seismic perfor-mance of existing structures requires the determination of the inelastic deformation experienced by structural members during earthquakes. To this end, the nonlinear dynamic analysis is considered the most reli-able tool, which provides high level of accuracy in the prediction of the structural response. Unfortunately, the main shortcomings of this type of analysis are the high computational effort and the significant time consuming character, that make this analysis not applicable for a daily professional use.
From the needing of a tool that accounts for the inelastic defor-mations of structures subjected to earthquake with the same accuracy of nonlinear dynamic analysis, but with a lower computational burden, the scientific research has developed the nonlinear static methods of analysis. Generally, all nonlinear static methods of analysis develop in-to two steps: firstly, the performance curve of the structure is obtained by a pushover analysis with a monotonically increasing invariant load vector, secondly the displacement demand is associated to a value of peak ground acceleration through an equivalent Single Degree of Free-dom (SDOF) system. Among the approaches available in scientific liter-ature, the Capacity Spectrum Method (CSM), proposed by Freeman et al. [14] and Freeman [15], and the N2 Method, proposed by Fajfar and Gaspersic[16] and Fajfar [17], are the most popular, as they were pio-neering methods in this field and were recommended for the seismic as-sessment of structures by the American and the European seismic code, respectively. Since the use of nonlinear static analysis has been allowed by codes, this method has gained popularity among professional engi-neers, as a simplified tool to assess existing buildings. Although the re-sults obtained by these analyses are generally considered reliable for
plane frames, however they are affected by the assumptions at the base of the methods. Indeed, common nonlinear static analyses do not take into account the contribution of higher modes of vibration to the seismic response, and do not consider the progressive reduction of the structur-al stiffness due to the nonlinear behaviour of the structure. To improve the level of accuracy, advanced nonlinear static methods of analysis were developed. Among others, Paret et al., Sasaki et al., Moghadam and Tso, Chopra and Goel, Sucuoglu and Gunay [18-22] developed non-linear static methods of analysis with multimodal character, while Bracci et al, Gupta and Kunnath, Requena and Ayala, Skaheri et al. proposed an adaptive variant [23-26]. More innovative approaches are the DAP proposed by Antoniou and Pinho [27,28] and Pinho et al.[33], and the Advanced N1 method proposed by Ghersi et al. [34] and Lenza et al.[35]. Despite the innovative character of these methods, however the DAP still requires the approximation to a SDOF system for the evaluation of the displacement demand, whilst the Advanced N1 meth-od neglects the effect of the energy dissipation due to the inelastic haviour of the structure, which increases as the seismic excitation be-comes stronger.
In addition to this, an important aspect is that existing structures are generally endowed with infill panels. Usually, infills are considered nonstructural elements, and because of this their contribution to the seismic response is “conservatively” neglected. However, frames with infill panels have a significantly larger stiffness, and their dissipative capacity and collapse mechanism are deeply influenced by the presence and the mechanical properties of infills. Despite this, neither the non-linear static methods of analysis suggested by codes, nor the advanced nonlinear static methods were conceived to provide an accurate estima-tion of the nonlinear behaviour of infilled frames, which may be “uncon-servative”.
With the background depicted above, the main purpose of this the-sis is the development of a nonlinear static method of analythe-sis that, with acceptable computational costs, can accurately estimate the seis-mic response of RC frames, with and without infill panels. To this end, the thesis proposes a multimodal adaptive procedure named
overDamped Displacement Adaptive Procedure (D-DAP). This method has been developed by combining the approach adopted by Antoniou and Pinho[28] and Pinho et al [33], to update the load vector, and the procedure by Ghersi et al. [34] and Lenza et al. [35] for the association of the peak ground acceleration to the displacement demand without the SDOF approximation. In addition, the D-DAP explicitly considers the increase of the energy dissipation due the cumulated damage in the structure by means of a larger value of equivalent damping. In particu-lar, the value of the equivalent damping is updated at each step, de-pending on the ductility demand of the structure and the elastic fun-damental period, and it is calculated through a law, which has been specifically calibrated in this work on RC framed structures, with and without infills.
The development of the D-DAP followed two steps: first, the pa-rameters ruling the method (i.e. number of modes to be enveloped and size of the incremental step) and the equivalent damping law were cali-brated; second, the efficiency of the calibrated method in predicting the seismic response of RC frames was investigated. To this end, a set of 54 RC frames were designed to be representative of existing RC buildings, suffering from various types and levels of seismic deficiency. The sam-ple of case studies includes frames endowed with infill panels with neg-ligible, medium and large stiffness and strength. The adopted research methodology assumed the response obtained by Incremental nonlinear Dynamic Analysis (IDA) as target. The ruling parameters of the D-DAP and the equivalent damping law were calibrated by choosing the values that led to the minimum difference between the response for each cases study frame obtained by the D-DAP and that obtained by the IDA. The accuracy of the D-DAP in predicting the seismic behaviour of the case study frames was compared to the efficiency of other nonlinear static methods available in literature or suggested by seismic codes. This comparison was conducted considering local and global response pa-rameters, and evaluating the error committed by the D-DAP in predict-ing the response of each case study frame.
In this thesis, the first Chapter is dedicated to the description of the nonlinear static methods drawn from literature and considered in
the preliminary study of the existing background. The second Chapter describes in detail the D-DAP. In the third Chapter the design proce-dure followed to build up the set of case study buildings is explained and the features of the designed frames are presented. The fourth and the fifth Chapter show the calibration and the validation process of the proposed method. Finally, the sixth Chapter is a practical example of seismic assessment, and consequent retrofitting intervention, of one case study frame by means of the D-DAP.
TURES
1. State of the art of nonlinear methods of analysis
Since the beginning of the XX century, some simplified approaches sug-gested the use of linear analyses, such as modal response spectrum analysis or linear static analysis, for the seismic assessment of struc-tures. However, real structures cannot remain elastic under strong earthquakes. For this reason, a behaviour factor q is introduced to roughly estimate the nonlinear structural response and to reduce the reference pseudo-acceleration response spectrum. Several codes suggest the use of a behaviour factor q, such as EC8 [1]. Based on the structural type and the level of global and local ductility expected from the design of the structure, the value of q suggested for new structures may range between 1.5 and 9. However, the nonlinear structural response mainly depends on the collapse mechanism that the structure develops. Since for existing buildings this is not known a priori, the displacement and strain levels that the structure experiences during the seismic event are difficult to be determined. As a consequence, the ductility capacity of the structure, and in turn the behaviour factor q to be used in linear methods of analysis, cannot be accurately estimated. For this reason, seismic codes conservatively suggest q-values in a range between 1.5 and 3. Indeed, this makes the linear methods of analysis too conserva-tive.
This limitation may be overcome if the inelastic deformation expe-rienced by structural members during earthquake can be explicitly de-termined. In order to accurately assess the seismic performance of ex-isting structures, a displacement-based approach is more advisable. Ac-cording to this approach, the displacement capacity of the structure has to be compared to the displacement demand, that is the displacements and plastic deformations the structure can experience before reaching a given limit state have to be compared to the displacements and plastic deformations caused by earthquake. The nonlinear dynamic analysis is considered the most reliable tool to evaluate the inelastic response of structures. In particular, this method of analysis offers the advantages to provide the time-history of inelastic response of the structure sub-jected to a given accelerogram, and to ensure a high level of accuracy in the prediction of the structural response. Unfortunately, for a correct evaluation of the structural response, the nonlinear dynamic analysis requires the definition of several significant aspects. Firstly, the defini-tion of a set of site-specific accelerograms compatible with the seismic spectrum for the considered site is a rather complicate task [2]. Indeed, the current guidelines, provided either by scientific research or by codes, regarding the generation of artificial accelerograms or the selec-tion of natural accelerograms are not necessarily clear and consistent each other [2-5]. Furthermore, especially when incremental dynamic analysis are conducted [6], a big concern is often expressed about the validity of results obtained from records that have been scaled. The is-sue regards the question whether the seismic response of a structure predicted by using scaled accelerograms can estimate accurately the sponse of the same structure obtained from unscaled records. Many re-searchers have worked on this topic and the answers given to that question were not necessarily consistent each other. An additional com-plexity to run nonlinear dynamic analysis is given by the need of a cor-rect modelling of the nonlinear cyclic behaviour of structural elements. In addition to those aspects, the nonlinear dynamic analysis is compu-tationally demanding, especially when fibre models are employed to simulate multi-storey frames. This means that each nonlinear dynamic analysis has a long duration, which makes it difficult to be repeated.
Furthermore, each nonlinear dynamic analysis produces an extreme large amount of data. Thus, a post-processing work is always required to make the results available for physical interpretation. In conclusion, due to all those complex aspects, the nonlinear dynamic analysis can be considered accessible only for experts in seismic engineering, and it is not suitable for every day design use.
The need for a tool that explicitly considers the inelastic defor-mation experienced by the structural members during earthquakes without carrying out complex and computational costly nonlinear dy-namic analysis led researchers to develop the nonlinear static methods of analysis. The main goal of these methods is to predict the seismic re-sponse of structures in a simplified way. Moreover, the use of nonlinear static methods is allowed by most seismic codes, for instance [1,7-13], because it generally provides reasonable results for plane frames. As a consequence, this method has gained popularity in the engineering community as a user friendly tool for seismic assessment of existing buildings.
Basically, the majority of nonlinear static procedures follow two main steps. In the first step the capacity curve of the structure, gener-ally expressed in terms of base shear and top displacements, is evaluat-ed by a pushover analysis. In pushover analysis, a mathematical model of the building is subjected to a monotonically increasing lateral load pattern until a pre-determined target displacement is reached, or the building reaches a collapse mechanism. The lateral load pattern can be assigned in terms of forces or displacement and it should approximate the inertial forces that the building experiences during a ground mo-tion. In the second step, the displacement demand is associated to a value of Peak Ground Acceleration (PGA). Scientific literature offers a variety of approaches for nonlinear static analysis. Among others, the Capacity Spectrum Method (CSM) proposed by Freeman et al.[14] and Freeman [15], and the N2 Method proposed by Fajfar and Gaspersic [16] and Fajfar [17] are considered the two fundamental approaches, and they were adopted by the American seismic code FEMA 440 [11] and ATC 40 [12], and the European seismic codes (EC8) [1], respective-ly.
Since all nonlinear static methods of analyses are quite simplified procedures, their predictions are affected by some assumptions adopted in the two steps. The capacity curve of the structure is determined by the pushover analysis run in the first step. In pushover analysis the static equilibrium equations are solved iteratively and incrementally, to determine the response of the structure undergoing monotonically in-creasing lateral load pattern. At each step of the pushover analysis, the structural resistance is evaluated, and the stiffness matrix is updated. Thus, each step of pushover analysis provides a complete description of the nonlinear state of the structure, both in terms of forces and dis-placements. To this end, one key issue is the selection of the lateral load pattern to be applied. In conventional pushover analysis, the dis-tribution along the height of the lateral load pattern is invariant through the steps of the analysis. The invariant load patterns can be categorized in “semi-empirical” and “theoretical”. The “semi-empirical” load patterns are totally independent from the dynamic features of the frame. Instead, the “theoretical” load patterns are based only on the ini-tial elastic dynamic features of the structure. Invariant load patterns commonly used have a linear distribution or a constant distribution along the height. Those two distributions aim at simulating the inertia forces that the structure develops when it vibrates with a predominant first mode or when it shows a soft storey mechanism, respectively.
However, the invariant load patterns generally neglect some im-portant aspects. Firstly, the influence of higher modes of vibration is not taken into account. To overcome this limitation, a number of mul-timodal analysis have been developed by different researchers, among others Paret et al., Sasaki et al., Moghadam and Tso, Chopra and Goel, Sucuoglu and Gunay [18-22]. Those methods essentially perform a number of conventional pushover analysis equal to the number of sig-nificant modes of vibration. In each pushover, a different load pattern is applied, in order to simulate the effect of the considered mode of vibra-tion. The structural response is estimated by combining the effects of each modal response. Although multimodal pushover analyses provide an important enhancement to traditional pushover analyses, however they are not able to consider the effect of the damage cumulated by the
structure on the structural dynamic properties. Because of this, the adoption of an invariant load pattern is likely to provide accurate pre-dictions only for low to medium-rise framed structures. To overcome this drawback, adaptive pushover analysis have been developed by many researchers [23-26]. Basically, in adaptive approaches the loading pattern is updated at each step of pushover analysis, in order to consid-er the progressive reduction of the structural stiffness due to the non-linear behaviour of the structure. An innovative approach that com-bines the multimodal and the adaptive character has been proposed by Antoniou and Pinho [27, 28]. In a first study, the authors suggested a force-based multimodal adaptive analysis (FAP) [27], based on an in-cremental modal analysis. Later, they developed a displacement-based adaptive pushover (DAP) [28], whereby a set of lateral displacements, rather than forces, is monotonically applied to the structure.
In the second step of the nonlinear static methods of analysis, the displacement demand for a given peak ground acceleration is obtained through the analysis of an equivalent Single Degree Of Freedom (SDOF) system subjected to a seismic input defined by the response spectrum. This step involves the idealization of the Multi Degree Of Freedom system (MDOF) into an equivalent SDOF system. Generally, nonlinear static methods of analyses start from a capacity curve of the MDOF system obtained by a single mode non-adaptive pushover analy-sis. According to the CSM method, the equivalent SDOF system is elas-tic with a reduced stiffness due to the spread of inelaselas-tic deformations. To take into account the beneficial effect of the energy dissipation in reducing the displacement demand, the equivalent SDOF system is as-sumed to have a value of damping ratio ξ higher than the nominal one, and it is related to the ductility demand µ. On the contrary, the N2 method assumes the equivalent SDOF system is elastoplastic, with a nominal value of damping ratio ξ, and it follows the equal displacement rule. An alternative simplified approach has been developed by Bosco et al. [29] and it is titled N1 method. According to this method, the non-linear static analysis can be performed without an explicit reference to a SDOF system. Indeed, the displacement demand may be directly evaluated by the values provided by an elastic analysis (lateral forces or
modal response spectrum analysis), modified to take adequately into account the nonlinear behaviour.
Nevertheless, when the capacity curve of the MDOF system is ob-tained by adaptive pushover analysis, it is unrealistic to assume an equivalent SDOF system whose dynamic properties are only related to an invariant elastic modal shape. In order to consider the change of the structural properties during the analysis, an adaptive version of the CSM method has been recently developed. According to this variant, the displacement and the acceleration of the equivalent SDOF system are functions of the modal participation factor and the modal mass de-termined for a modal shape. The main innovation is that those parame-ters are calculated at each step of the pushover analysis based on the actual deformed pattern at the current step. Ferraioli et al. [30,31] and Pinho and Casarotti [32] proposed the application of such adaptive CSM method for the assessment of steel frames and r.c frames and bridges, respectively. In particular, Ferraioli et al. [30,31] suggested to obtain the inelastic demand response spectra in terms of pseudo-acceleration (Sa) and displacement (Sd) by scaling the 5%-damped elas-tic demand response spectra by means of ductility reduction factor Rµ. On the other side, Pinho et al. [33] adopted an increasing value of damping ratio evaluated as function of the ductility demand µ of the system. In addition to this, a response spectra scaling factor is evaluat-ed as function of the fundamental period and the equivalent viscous damping. An alternative approach has been developed by Ghersi et al. [34] and Lenza et al. [35]. The authors proposed an advanced multi-modal and adaptive version of the N1 method, whereby a dynamic modal response analysis is run incrementally at each step. A displace-ment load, rather than force load, vector is determined at every step from the combination of the modal shapes. An elastic response spectra characteristic of the site considered is used. Differently from the previ-ous methods, the evaluation of the displacement demand for a value of peak ground acceleration does not require neither the preliminary evaluation of the performance curve, nor the approximation to a SDOF. Unfortunately, nonlinear static methods show a lower effectiveness in assessing the seismic behaviour of three-dimensional structures
ir-regular in plan, because they cannot provide a reliable estimate of the deck rotation. In order to overcome this limitation, the nonlinear static approaches suggested by seismic codes for asymmetric structures have been recently improved. For instance, Bhatt and Bento [36] presented an extended version of the Adaptive Capacity Spectrum (ACS) method for plan irregular buildings. In this approach, the ACS method starts from an adaptive displacement pushover and keeps the MDOF-to-SDOF transformation from the original ACS method, as proposed by [32]. The computation of the target displacement is made using the al-gorithm proposed in FEMA 440 for the calculation of the effective peri-od, damping, reduction factor and the new modified acceleration dis-placement response spectrum (MADRS) [37]. The torsional effects are taken into account using the correction factors proposed by Fajfar et al. [38] in the extended N2 method for plan-asymmetric buildings. Alterna-tively, Bosco et al. [39] perform, for each direction of the seismic action, two nonlinear static analysis by applying the lateral forces to two points, which are different from the center of mass. The use of two analyses, rather than one as suggested by EC8, leads to a more accu-rate estimation of the real displacements at both sides of the deck. More references may be found in literature, however the seismic as-sessment of three-dimensional structures is beyond the limit of the pre-sent work and they will not be considered in the following sections.
2. The conventional pushover analysis
The main goal of pushover analysis is to describe the nonlinear behav-iour of structures through the determination of the capacity curve, gen-erally in terms of base shear and top displacement. Pushover analyses can be carried out by using invariant or adaptive load patterns. Invari-ant load patterns do not change within the structural analysis, whilst adaptive load patterns are updated through the analysis in the attempt of following the modification of the stiffness properties caused by the structural damage. Among the load patterns, a further classification, reported in Marino et al. [40], distinguishes the load patterns named semi-empirical from those defined as theoretical load patterns.
Semi-empirical load patterns are not directly connected to the dynamic prop-erties of the structures or seismic events (e.g. constant and inverted triangular load patterns), and they are invariant. Differently, theoreti-cal load patterns are strictly related to the aforementioned properties. When theoretical load patterns are related to the initial elastic dynamic features of the structure, they are considered invariant load patterns. However, theoretical load patterns can become adaptive if they are up-dated during the analysis.
Among the semi-empirical load patterns, it can be found:
• Equivalent static forces Fi proportional to the mass m and to the height of the i-th storey:
b n j j i i V m m F s
∑
= (1)where ns is the number of levels and Vb the design value of base shear.
• Equivalent static forces Fi proportional to the mass m and to the height h of the i-th storey with respect to the base of the structure:
b n j j j i i i V h m h m F s
∑
= (2)If the mass and the storey drifts are the same at each level, then the first load pattern corresponds to the constant distribution, while the second one individuates the inverted triangular distribution.
Among the theoretical load patterns, it can be found:
• Equivalent static forces Fi proportional the eigenvector components of an equivalent mode of vibration [25] evaluated by means of the fol-lowing equation:
(
)
2 1∑
=Γ
φ
=
φ
m n j j ij i (3)being Γj the participation factor and nm the number of modes taken into account for the evaluation of the equivalent mode of vibration. The equivalent static forces may be calculated by means of the expression:
b n K k k i i i
V
m
m
F
s∑
=φ
φ
=
1 (4)• The intensity of forces Fi [15] depends on the dynamic properties of the system and on the spectral pseudo-accelerations Sa of the j-th modes of vibration taken into account for the targeted evaluation:
(
)
∑
= φ Γ = m n j i aj ij j i S m F 1 2 (5)• The equivalent static forces are evaluated as the difference between modal storey shears V of contiguous levels [41]:
1 +
−
=
i i iV
V
F
(6) Where∑
==
n j ij iV
V
1 2is the modal shear force at the i-th level obtained as SRSS combination of the shear forces of the n modes of vibration. • The horizontal forces are obtained as a function of the difference of
the modal storey bending moments M of contiguous levels [40]:
h
M
M
F
i i i 1 +−
=
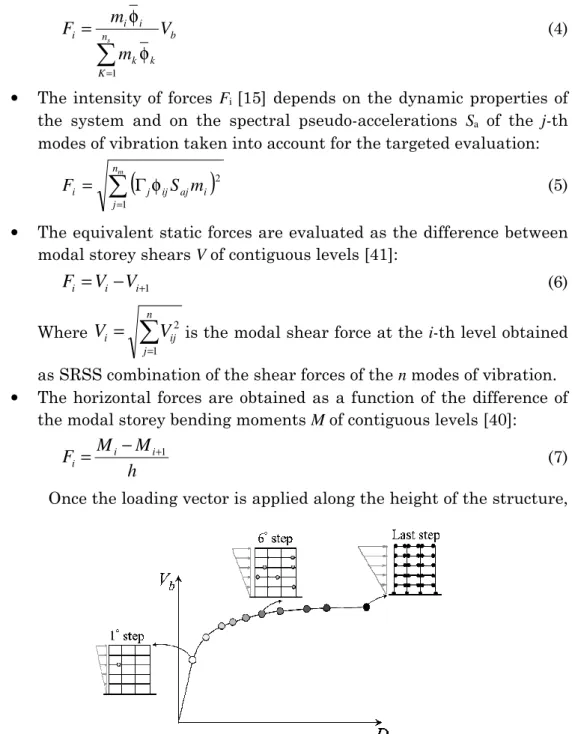
(7)Once the loading vector is applied along the height of the structure,
Figure 1 – Example of construction of the capacity curve by pushover analy-sis, assuming a model with rigid plastic hinges
it is increased progressively until the attainment of a predetermined limit state of the structure. In particular, if a model with rigid plastic hinges is adopted, each step of the pushover analysis ends when a new plastic hinge appears in the structure. Before increasing again the load vector, at the beginning of the following step the structural model is updated to take into consideration the yielding of the sections. At each step of the pushover analysis the seismic response of the structure is determined in terms of different response parameters. In particular, if the base shear and the top displacement corresponding to each single step are plot respectively on y and x axis of a plane, the performance curve of the structure is determined (Figure 1).
3. Nonlinear static methods in seismic codes
The N2 method and the CS method are considered the two main ap-proaches among the existing nonlinear static methods of analysis, and they are suggested by EC8 and ATC40 for seismic assessment of struc-tures. In spite of some important conceptual differences, both CS meth-od and N2 methmeth-od follow these steps:
1) determination of the performance curve
2) approximation of the structure under examination to an equiva-lent SDOF system
3) evaluation of the displacement demand of the equivalent SDOF system
4) evaluation of the displacement demand of the actual MDOF sys-tem.
The performance curve of the structure is obtained by pushover analy-sis. The vertical distribution of the horizontal forces Fi for pushover analysis is obtained by multiplying the floor masses mi by a displace-ment profile Φ. Every reasonable profile Φ can be used. However, it is recommended that the analysis is repeated by two displacement pro-files that bound the actual seismic response of the structure. Generally, seismic codes recommend displacement profiles proportional to the first mode of vibration and constant along the height.
Each point of the performance curve can be related to a value of peak ground acceleration. To do this, the displacement demand is pre-liminary evaluated for a SDOF system equivalent to the MDOF system, by means of elastic response spectra. Once that this relation is deter-mined, given the value of peak ground acceleration, the corresponding top displacement demand of the actual Multi-Degree-Of-Freedom (MDOF) system can be immediately evaluated. If a modal displacement profile Φ is used, the mass m* of the equivalent SDOF system is related to the effective modal mass M* corresponding to the considered mode shape by the equation
Γ
Φ
=
n * *M
m
(8)where Φn is the value of the displacement profile at the top storey, and Γ is evaluated using the following equation:
∑
∑
=
Γ
2 iΦ
Φ
i i im
m
(9) Note that, if a single mode of vibration is considered, Γ is the modal participation factor. The performance curve of the MDOF system is scaled by means of the following equations:Γ Φ = n b * V F (10) Γ Φ = n t * D D (11)
where Vb and Dt are the base shear and the top displacement of the MDOF system.
The performance curve scaled by Equation 10 and 11 is used to de-termine the other features of the equivalent SDOF. The following sec-tions show the determination of these features and the evaluation of the displacement demand *
req
D of the equivalent SDOF system according to N2 and CS method. Finally, the displacement demand of the equiva-lent SDOF system is transformed back to the top displacement demand
* req n
req
D
D
=
Φ
Γ
(12)The seismic response of the MDOF system, in terms of member in-ternal forces, floor displacement, plastic deformations, etc. is then as-sumed as that obtained by pushover analysis at a top displacement equal to Dreq. If any response quantity is larger for a top displacement smaller than Dreq, this maximum value has to be used instead.
3.1. The equivalent SDOF system according to the N2 method
According to Fajfar [17], the equivalent SDOF system is an elasto-plastic system. The force-displacement relationship of this system is ob-tained from the performance curve scaled by Equation 10 and 11 This curve is idealised, within the relevant range of displacements, by a bi-linear relationship characterized by a lateral strength
F
y* and a yield displacementD
*y. Different equivalence conditions have been suggested in literature or by codes. In this work, the post-yield slope is assumed null and the elastic branch of the bilinear curve is obtained by imposing the intersection with the point of the pushover curve corresponding to a value of lateral force equal to the 60% of the maximum lateral force, as suggested by NTC08 [13]. The coordinates of the yielding point are de-termined by equating the areas under the original and the idealised curve. The slope of the elastic branch is equal to the ratio *y*
y
/
D
F
K
1=
and the period of this SDOF system is:
1
2
K
m
T
* *π
=
(13)In N2 method the displacement demand
D
req* of the equivalent SDOF system is related to the displacement of the corresponding elastic structure, which can be obtained as the spectral value Sde( )
T* . In par-ticular, according to Vidic et al. [42], it is possible to assume:µ = µ R when C *
T
T
≥
(14)(
µ−1)
+1 = µ C * T T R when * C T T < (15)where Rµ is the force reduction factor (ratio of the elastic strength de-mand to the actual strength of the bilinear system), µ is the ductility demand and Tc is the transition period that separates the constant ac-celeration branch of the spectrum from the constant velocity branch. Therefore, for structure with large frequency, the displacement
D
req* can be evaluated by amplifying the spectral displacementSde( )
T* by a coefficient depending on the force reduction factor Rµ, according to the following equations:( )
* de * reqS
T
D
=
whenT
*≥
T
C (16)(
)
S (T ) T T R R D * de * C * req − + = µ µ 1 1 1 when C *T
T
<
(17)The spectral displacement Sde
( )
T* may be calculated by the pseu-do-acceleration Sae( )
T* as follows:( )
( )
* ae * * de S T T T S 2 2 4π = (18)3.2. The equivalent SDOF system according to the capacity
spectrum method
Differently from N2 method, the Capacity Spectrum Method [15] con-siders the reduction of the stiffness of the structure due to the for-mation of plastic hinges by an idealised elastic SDOF system with a re-duced stiffness. Freeman assumes that the stiffness of the SDOF sys-tem reduces to an equivalent “global” secant stiffness Kg, which is eval-uated as the slope of the line connecting the points of the performance curve corresponding to the zero-displacement and the peak
displace-ment demand: *
max *
max g F / D
K = . The period of the equivalent SDOF sys-tem is:
g * * K m T =2π (19) Because of the hysteretic behaviour, the actual system is able to dissipate energy during the loading cycles. To take into account the beneficial effect of the energy dissipation in reducing the displacement demand, the equivalent SDOF system is assumed to have a value of damping ratio ξ higher than the nominal one and related to its ductility demand µ. In particular, Freeman provides the values of ξ to be adopted for a set of values of µ [43]. These values are here used to determine the following function, which relates the equivalent damping ratio ξeq to the ductility demand µ:
715
15
4122
17
41
31
984
9
064
1
.
3.
2.
.
.
eq=
µ
−
µ
+
µ
−
<
ξ
(20)This function is obtained by minimizing the standard deviation of the differences between the values provided by the proposed function and those given by Freeman. The same bilinear relationship adopted in N2 method is used to evaluate the ductility demand µ.
The displacement demand
D
*req of the SDOF system is calculated by the pseudo-acceleration Sae( )
T* provided by an elastic response spec-trum with the equivalent damping ratio ξeq:( )
* ae * * req S T T D 2 2 4π = (21)4. The multimodal pushover analysis
The multimodal pushover analyses have been developed in the attempt to improve the performance of nonlinear static analysis by considering the effect of higher modes of vibration on the seismic response. Such methods basically involve multiple pushover analyses, and the load pat-terns of each pushover analysis are related to the significant modes of vibration of the structure. The structural response is estimated combin-ing the effects derived from each of the modal responses.
Sasaki et al. [19] suggested the Multi-Mode Pushover analysis (MMP). The MMP involves several pushover analyses whereby the load vectors represent the various modes deemed to be excited in the dynam-ic response. The load patterns are defined based on n signifdynam-icant modes of vibration, and any number n of modes can be used. However, since the mass participation factors become smaller at higher modes, usually only the first few modes are considered. For each mode of vibration, the load pattern is determined by multiplying the mass of each level by the modal shape amplitude at that level. Each pushover curve is converted into the Acceleration-Displacement Response Spectrum format and the Capacity Spectrum Method is applied to evaluate earthquake demand. This method identifies which mode is more critical and where any dam-age concentration occurs. Nevertheless, it does not provide any results on the overall response of the system since it does not consider any kind of modal combination rule.
A development of the MMP is the Pushover Results Combination (PRC), proposed by Moghadam and Tso [20]. According to this method, the structural response is estimated using the same approach of the MMP analysis, i.e. by combining the results of several pushover anal-yses carried out with load patterns that are related to the main modes of vibration. The overall response is obtained by weighting the results provided by each pushover analysis compared to the modal participa-tion factors.
A Generalized Pushover Analysis (GPA) has been developed by Sucuoglu and Gunay [22]. This procedure conducts a set of pushover analysis with different generalized force vectors, which are applied in-crementally until a prescribed seismic demand is attained for each vec-tor. Each generalized force vector is obtained as a different combination of modal lateral forces and simulates the lateral force distribution act-ing on the system when a given response parameter reaches its maxi-mum value during the dynamic response. To this end, any response pa-rameter can be selected and the authors suggest the maximum inter-storey drift. The target seismic demands for interinter-storey drifts at select-ed stories are calculatselect-ed from the associatselect-ed generalizselect-ed drift expres-sions. The maximum value of any other response parameter is obtained
from the envelope of the results obtained by the GPAs. In case of elastic response, GPA and modal response spectrum analysis provide identical results. From the application to building frames, the authors found that this method is successful in estimating the maximum values of defor-mations and forces of structural elements with reference to the re-sponse history analysis.
Based on the MPA, an alternative procedure named Modal Pusho-ver Analysis (MPA) has been proposed by Chopra and Goel [21]. Since this method has been considered as a term of comparison in the para-metric study of the present work for the validation of the results of the proposed method, the following section will be dedicated to describe it in further details.
4.1. The multimodal pushover analysis by Chopra and Goel
In 2002 Chopra and Goel [21] developed an improved pushover analysis based on structural dynamics theory. The motivation of their research stems from the approximations induced by the assumptions adopted in conventional pushover analysis. Seismic demands of structures are generally computed by nonlinear static analysis of structures subjected to monotonically increasing lateral forces with an invariant height-wise distribution until a predetermined target displacement is reached. Both the force distribution and target displacement are based on the as-sumption that the response is controlled by the fundamental mode and that the mode shape remains unchanged after the structure yields. However, after the structure yields, both assumptions are approximate, and lead to inaccuracies, especially in case of high-rise structures. To overcome these limitations, the authors developed the Modal Pushover Analysis (MPA). Their research was conducted into two steps. As a first step, they demonstrated that the MPA procedure was equivalent to the response spectrum analysis for linearly elastic system. Afterwards, they extended the modal response spectrum analysis to inelastic build-ings and presented the MPA for the estimation of the peak values of the response parameters. The same steps are followed in the current sec-tion of the thesis.
4.1.1. Dynamic and pushover analysis procedures for elastic systems
Considering a multistorey building, the following equation governs the response of the structure subjected to horizontal earthquake ground motion u&&g
( )
t :( )
t u&g & & & & cu ku mi u m + + =− (22)where u is the vector of N lateral floor displacements relative to the ground, m, c and k are the mass, classical damping and lateral stiffness matrices of the system, respectively. Each element of the vector i is equal to unity. The right side of Equation 22 can be interpreted as ef-fective earthquake forces:
( )
t ug( )
teff mi&&
p =− (23)
The vector s=mi defines the distribution of the effective forces over the height of the building, and u&&g
( )
t defines the intensity and time var-iation of the effective forces. This force distribution can be expanded as a summation of modal force distribution sn, and the effective seismic force can be expressed as the summation of N modal contributions:( )
∑
( )
∑
( )
= =−
=
=
N n g n N n n , eff efft
t
u
t
1 1&
&
s
p
p
(24)where each nth mode contribution to s and p
eff (t) are: n n n
=
Γ
m
φ
s
(25)( )
t nug( )
t n ,eff s &&
p =− (26)
The response of the MDOF system to peff,n (t) is entirely due to the nth mode, without any contributions from the other modes. Thus, the re-sponse of the MDOF system in terms of top displacements is expressed as:
( )
t
nq
n( )
t
n
=
φ
u
(27)The modal coordinate
q
n( )
t
is determined as follows:( )
tu q
q
q&&n + ξnωn&n +ωn n = −Γn&&g
2
where ωn and ξn are the natural vibration frequency and the damping ratio of nth mode, respectively. Equation 28 represents the standard modal equation governing
q
n( )
t
.The total seismic response of the elastic structure can be described as the summation of nth different contributions. Each nth contribution represents the response of the structure subjected to a distribution of forces proportional to the nth mode of vibration. Thus, the equation of motion is transformed from the nodal coordinates into the modal coor-dinates qn. The solution to Equation 28 is provided by:
( )
t
D
( )
t
q
n=
Γ
n n (29)The value of Dn(t) is determined from the equation of motion of an equivalent SDOF system with natural frequency ωn and damping ratio ξn equal to those of the nth mode of the MDOF system subjected to
) t ( u&&g :
( )
t u D DD&&n + ξnωn &n +ωn n = −&&g
2
2 (30)
Finally, the top displacement of the MDOF system can be deter-mined from the top displacement of SDOF system:
( )
t
n nD
n( )
t
n
=
Γ
φ
u
(31)Generally, any response quantity r(t) can be expressed as the modal static response
r
nst due to external forces sn, multiplied by the pseudo acceleration response An(t) of the nth mode SDOF system. Therefore, the total response of the system to the total excitation peff(t) is:( )
t
A
r
)
t
(
r
st n n N n∑
==
1 (32) The presented equations represent the classical modal response history analysis. However, they were derived unconventionally from the modal expansion of the spatial distribution of the effective earthquake forces. This approach provides the basis for the development of the MPA.The modal response spectrum analysis allows the evaluation of the peak value rn0 of the nth mode contribution rn(t) as follows:
n st n n
r
A
Where An is the pseudo-acceleration of the nth mode SDOF system, and it is obtained from the pseudo-acceleration response spectrum in corre-spondence of the natural vibration period of the MDOF system. To es-timate the peak value of the total response, the peak modal responses are combined according to the Square Root of Sum of Squares (SRSS) combination.
The same peak value rn0 of the nth mode contribution can be ob-tained by a static analysis that pushes the structure to the roof dis-placement urn0 due to thenth mode, with a lateral force distribution along the height
s
*n= m
φ
n. The peak values of modal responses rn0 are deter-mined by separate modal pushover analysis and can be combined to es-timate the peak of the total response. Indeed, the MPA for elastic sys-tem is equivalent to the response spectrum analysis procedure.4.1.2. Dynamic and pushover analysis procedure for inelastic system
The previous considerations are now extended to the case of inelastic systems. In this case, the relations between lateral forces fs at a generic floor and the lateral displacements u are not single-valued, but depend on the history of the displacements:
f
s=
f
s(
u
,
sign
u
&
)
. The differential equation governing the inelastic systems becomes:(
,sign)
ug( )
ts & && &
&
& cu f u u mi u
m + + =− (34)
Although classical modal analysis is not valid for inelastic systems, it is used to transform the previous equation to the modal coordinates of the corresponding linear system. This elastic system is defined to have the stiffness equal to the initial stiffness of the inelastic system. Both systems have the same mass and damping. Therefore, the natural vibration periods and modes of the corresponding linear system are the same to those of the inelastic system undergoing small oscillations, within the linear range. The displacements of the inelastic system can be expanded in terms of natural vibration modes of the corresponding linear system:
( )
t
nq
n( )
t
N nφ
=
∑
=1u
(35)Combining Equation 34 and 35, the equation of motion of a MDOF system vibrating accordingly to the nth mode is obtained:
( )
t
u
M
F
q
q
n g n sn n n nn
&
&
&
&
&
+ 2
ξ
ω
+
=
−
Γ
(36)The resisting forces Fsn depend on all modal coordinates qn(t), and they imply the coupling of modal coordinates. This means that the equations of motion (36) are coupled for inelastic systems. To overcome this limit, the authors neglected the coupling of N (Equations 36) in modal coordinates and assumed this approximation to develop the Mul-timodal Pushover Analysis (MPA) for systems in the inelastic range. As in the elastic range, the spatial distribution s of the effective forces is expanded into the modal contributions sn. The equations governing the response of the inelastic system to the effective seismic forces peff,n(t) (Equation 26) are the following:
(
,sign)
nug( )
ts & && &
&
& cu f u u s u
m + + =− (37)
The solution of the Equation 37 could not be described by the separate contributions of nth mode of vibration (Equation 27), because in the ine-lastic range the structure does not vibrate accordingly to one nth mode of vibration only, but higher modes contribute to the solution as well. However, because for linear systems qr(t)=0 for all modes other than the
nth mode, it is reasonable to expect that the nth mode should be dominant even for inelastic systems. Based on this assumption, the equation of motion of the MDOF inelastic system in modal coordinates can be ex-pressed with Equation 36, with the important approximation that Fsn now depends only on one modal coordinate qn. The solution to Equa-tion 36 can be expressed as:
( )
t
D
( )
t
q
n=
Γ
n n (38)Where Dn(t) and Fsn are described by:
( )
t
u
L
F
D
D
g n sn n n nn
&
&
&
&
&
+ 2
ξ
ω
+
=
−
(39)(
)
s(
n n)
T n n n sn sn F D ,signD D ,signD F = & =φ f & (40)Equation 39 may be interpreted as the governing equation of the inelastic SDOF system with the vibration properties of the nth mode. This SDOF system has (1) natural vibration frequency ωn and damping ratio ξn equal to those of the nth mode of the corresponding linear MDOF system, and (2) Fsn/Ln–Dn relation between resisting force Fsn/Ln and modal coordinates Dn defined by Equation 39. The introduction of the nth mode inelastic SDOF system allows the extension of the concepts estab-lished for elastic systems to inelastic systems. Indeed, the response of the system to the total excitation peff(t) can be determined by Equation 32. This is the Uncoupled Modal Response History Analysis (UMRHA) and further demonstrations may be found in [21].
The relationship between lateral forces Fs and Dn may be deter-mined by a displacement-controlled non-linear static analysis. Howev-er, for the sake of simplicity a force-controlled, rather than displace-ment-controlled, nonlinear static analysis with an invariant distribu-tion of lateral forces can be conducted. For an inelastic system, no in-variant distribution of forces can produce displacements proportional to ϕn at all displacements or force levels. However, before any part of the structure yields, the only force distribution that produces displace-ments proportional to ϕn is given bys*n = mφn. Therefore, this distribu-tion seems to be acceptable to determine Fsn in Equation 40, even after the structure yields. Such nonlinear static analysis provides the so-called pushover curve, which is different than the Fsn/Ln–Dn curve. The structure is pushed to a predetermined roof displacement using the force distribution s*n = mφn, and the base shear Vbn is plotted against roof displacement urn. Afterwards, the Vbn – urn pushover curve has to be converted into to the Fsn/Ln–Dn relation. Thus, the two sets of forces and displacements are related as follows:
n bn sn
V
F
Γ
=
, rn n rn nu
D
φ
Γ
=
(41)Equation 41 allows the conversion of the pushover curve to the
Fsn/Ln–Dn bilinear relation represented in Figure 2, where the yield val-ues of Fsny/Ln and Dny are:
n n bny n sny L V L F Γ = , rn n rny ny u D φ Γ = (42)
Knowing Fsny/Ln and Dny, the vibration period Tn of the nth mode ine-lastic SDOF system can be evaluated as follows:
sny ny n n F D L T = 2π (43)
The estimation of the peak response rno of the inelastic MDOF sys-tem to effective earthquake forces peff,n(t) can be obtained by increasing the horizontal forces of pushover analysis until the roof displacement is equal to urno. This value of the roof displacement is
u
rno=
Γ
nφ
rnD
n, where Dn is the peak value of Dn(t) and it is now determined by solving Equation 39. At this roof displacement, the pushover analysis estimates the peak value rno of any response rn(t). The response value rno is an es-timate of the peak value of the response of the inelastic system to peff,n(t), and it also represents the exact peak value of the nth mode contri-bution rn(t) to response r(t). Each peak modal responses rno is determined by a separate pushover analysis, and they are combined using an ap-propriate modal combination rule, to obtain an estimate of the peak value ro of the total response.The MPA implies some approximating assumptions. Firstly, this method neglects the coupling of modal coordinates after the yielding of structure. Secondly, although the structure behaves in the inelastic
MDOF system Vbn Vbny urn urny Kn 1 1 αnKn SDOF system Fsn/Ln Vbny/Mn* Dn 1 1 (a) (b)
Figure 2 – Properties of the nth mode inelastic SDOF system from the push-over curve: (a) MDOF system; (b) SDOF equivalent system
range, the superposition of the modal contribution in Equation 32 and the SRSS combination of the peak modal responses are considered ap-plicable to evaluate the structural response. Finally, the equivalent SDOF system properties depend on the estimated displacement de-mand and the SDOF system law is simplified by means of a bilinear curve in UMRHA. Those approximations leads to inaccuracies in the to-tal response in case of inelastic system, while the UMRHA corresponds to the response history analysis for elastic systems.
5. The adaptive pushover analysis
The major drawback of invariant load patterns is that they do not con-sider the change of dynamic properties of the structure, such as period elongation and stiffness degradation, due to structural yielding. This limitation stems from the inability of invariant load patterns to account for the progressive damage cumulation occurring in the full defor-mation range.
To go beyond the aforementioned limits and to follow more closely the time-variant distributions of inertia forces of the structure, several researchers (such as Bracci et al. [23], Gupta and Kunnath [24], Re-quena and Ayala [25], Shakeri et al. [26],) have proposed adaptive ap-proaches to conduct pushover analysis. In adaptive pushover analyses the shape of the applied load vector (force or displacement) is updated at each analysis step, to reflect the dynamic properties of the system at the current step.
Bracci et al. [23] developed a procedure for a quick estimation of the safety margin from collapse of RC frames at a selected seismic de-mand level. In this procedure, the capacity of the structure is deter-mined by means of an adaptive pushover analysis, whereby the force load vector is a function of the storey shear resistance. Any lateral dis-tribution can be assumed as initial load pattern. At each step, the force applied at each storey is calculated from the storey shear resistance of the previous load step: