1
University of Messina
Doctoral course XXX cycle
“Medical and Surgical Biotecnologies”
Coordinator: Prof. Giovanni Raimondo
Scientific Disciplinary Sector: MED 38
RELIABLE MITE-SPECIFIC
MICROARRAY
FOR TESTING
IgE ANTIBODIES
IN NASAL SECRETIONS
Doctoral Thesis of:
Dr. Stefania ARASI
Academic Year 2016/2017
Supervisor:
Prof. Filippo DE LUCA
Co- Supervisor:
3
PREAMBLE
Methods to measure allergen-specific immunoglobulin E (sIgE) at nasal level in patients with allergic rhinitis are currently of great interest for many reasons, such as the evidence for local production of IgE in the nasal mucosa. Nasal secretions are easily collected with various non-invasive procedures and suitable for IgE measurements. Nevertheless, IgE “classic” assays, based on immunoenzymatic methods and allergen extracts, require large volumes and are inefficient in detecting the low amounts of IgE in NasSec. In this study, IgE antibodies to 15 allergen molecules of Dermatophagoides pteronyssinus and
Dermatophagoides farinae were tested with an allergen microarray in nasal
secretions of 30 mite sensitized, allergic rhinitis patients and 29 healthy, not-sensitized controls. Nasal IgE to major allergen molecules (nDer p 1, nDer f 1, rDer p 2, rDer f 2, rDer p 23) identified the mite-allergic patients with 90% sensitivity and 100% specificity. Therefore, testing nasal IgE to allergen molecules by a microarray approach may play a role in the diagnostic work-up of patients with allergic rhinitis.
This study is the result of an international collaboration among the Universities of Charité (Berlin, Germany), Messina (Italy), Gent (Belgium), and Wien (Austria). I spent most of my PhD course at the Charité -Universitätsmedizin (Berlin), in the AG MolekulareAllergologie und
Immunmodulation leaded by Prof. Matricardi. The samples were collected by
the team leaded by Prof. Geveart in the ENT Department of Gent University. In the context of this collaboration, I spent a few days at Gent University, in order to acquire their collection and processing methods. I performed the molecular tests on nasal and serum samples using the customized microarray provided by Thermo Fisher Scientific (Uppsala, Sweden) and the University of Wien. I have been also responsible of the data management and performed most of the statistical analyses.
The fruitful scientific collaboration among the above mentioned parts, started through this study, is carrying on and furtherly developing in order to improve the diagnostic work-up of allergic rhinitis patients.
5
INDEX
1. Background………... 9
2. Materials and methods……….… 13
2.1. Population and study design……….… 13
2.2. Skin Prick Test……….………. 15
2.3. Questionnaires……….………… 15
2.4. Serum collection……….………… 16
2.5. Collection and processing of nasal secretions……… 16
2.6. IgE assays………..… 18
2.7. Statistics……….. 20
3. Results………...……. 22
3.1. Participants………...……. 22
3.2. IgE responses to HDM extract………. 23
3.3. IgE responses to D.pt. and D.fa. allergenic molecules…………. 25
3.3.1. Prevalence of IgE responses……… 25
3.3.2. Prediction of serum IgE responses by testing nasal IgE… 27 3.3.3. Test reproducibility………..………. 29
4. Discussion and conclusions………... 35
7
List of abbreviations
AR allergic rhinitis CI confidence interval
D.fa. Dermatophagoides farinae D.pt. Dermatophagoides pteronyssinus EP ear pack
FD filter disk
FEIA fluorescent enzyme immunoassay HDM house dust mite
IgE Immunoglobulin E
ImmunoCAP Immunoassay capture test ISAC ImmunoCAP solid phase allergen chip ISU ISAC Standardized Units
NasSec nasal secretions SD Standard deviation SP sinus pack
9
1. Background
____________________________________________________________________
Allergic rhinitis is an immunoglobulin E (IgE)-mediated inflammatory
disorder of the nose, induced after allergen exposure. [1,2]It is one of the
most prevalent allergic diseases affecting around one in fifth of the general population of westernized countries. [3-5] It is associated with
considerable loss of productivity and impaired school performance. [6]
Early reports have already provided evidence for local production of IgE in the nasal mucosa [7-10] and there is increased attention to the concept
of “local allergic rhinitis”.[12-15] Moreover, IgE plays an important role
in other nasal diseases, such as nasal polyposis, which is characterized b y increased levels of polyclonal IgE. [16,17]
Therefore, it is of great interest to measure IgE locally at the level of the nasal mucosa. However, this is challenging, as IgE is the least abundant immunoglobulin isotype and thus present at low concentrations. [18] IgE can be measured locally in nasal tissue homogenates, collected during surgery or through nasal biopsy. However, most patients do not undergo surgery, and nasal biopsies are quite invasive, causing discomfort to the patient and hampering serial sampling. Moreover, muc h
10
expertise is required for both sampling and processing of nasal tissue. [19] Nasal secretions (NasSecr) greatly reflect the local inflammatory activity and provide valuable information on pathophysiological aspects of immunological reactions to allergens. [20] Consequently, collection and analysis of NasSecr is considered a good alternative for studying and
monitoring nasal diseases at the level of the nasal mucosa. [20] Current sampling techniques are quite heterogeneous and mainly based on the following principles: collection of spontaneous secretions (e.g. blown secretions [21] and microsuction/aspiration [22]); nasal washings
[23-25]; and the use of different absorption devices such as sponges, [20,26] strips, [27] disks, [28-32] and gauze. [33] Collection of spontaneous secretions is appropriate in subjects with nasal hypersecretion, while in healthy subjects the volume of collected sample is frequently insufficient. [34] Nasal lavage and collection with absorbent material are the best-validated methods. [19,20,34] However, nasal washings are associated with an unpredictable, high dilution of secretions and concentrations of markers often fall below detection limits of the most commo n immunological assays. Therefore, nasal lavage samples are less suitable
for repeated measurement and monitoring [35]. By contrast, absorbent
11
of the degree of dilution, providing the best compromise between sufficient sample amounts and detectability of local inflammatory mediators and immunoglobulin E.
Nevertheless, IgE “classic” assays, based on immunoenzymatic methods and allergen extracts, require large volumes and are inefficient in
detecting the low amounts of IgE in NasSec. Microarray biochips allow simultaneous measurement of IgE against several allergen molecules with excellent sensitivity and specificity. [36, 37] In literature, this technology has not previously been reported for detecting IgE in NasSec
of AR patients by others research groups. To fill this gap, this study tests the performance of a customized microarray containing 15 house dust mite (HDM) allergen molecules based on the ImmunoCAP ISAC technology (Thermo Fisher Scientific, TFS, Uppsala, Sweden) for sIgE detection in NasSec of 30 adult patients with HDM-AR and 29 non-allergic controls.
13
2. Materials and methods
_________________________________________________________________________
2.1 Population and study design
This is an observational longitudinal study conducted on consecutive
patients with HDM-AR and non-allergic controls, recruited via the Department of Otorhinolaryngology in Ghent University Hospital
(Belgium). AR to HDM was defined by a consistent history and a
positive skin prick test (SPT) to Dermatophagoides pteronyssinus and/or
Dermatophagoides farinae. Controls were volunteers without history of
any allergy, and a negative SPT.
Subjects were excluded from the study if suffering from acute bacterial/viral rhinosinusitis at the moment of testing or previously treated with allergen-specific immunotherapy (AIT) or anti-IgE antibodies (omalizumab). Intake of oral antihistamines, nasal decongestants and nasal or systemic corticosteroids was discontinued in the week prior to the study visits.
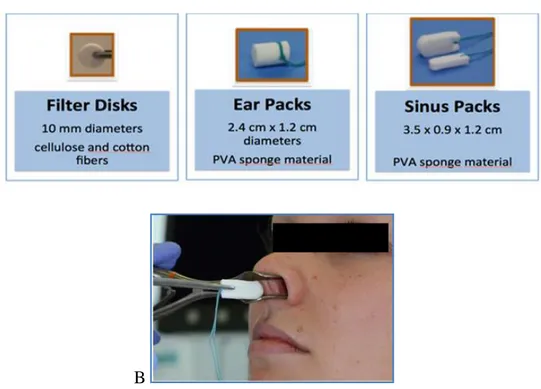
During the first visit, eligible subjects underwent questionnaires on general health and allergy and collection of serum and NasSec. After
14
collection with filter disks (FD) and sinus packs (SP) (Figure 1, A and B),
NasSec were processed and diluted with saline (“fixed dilution
processing”, i.e. FD, 1:20; SP, 1:10).
In a second visit, a subset of AR patients underwent additional collection of serum and NasSec. In this second test, NasSec were collected with
three different absorbent devices: FD, Ear Packs (EP) and SP. NasSec were diluted with a fixed volume of saline (“fixed volume processing”,i.e. FD, 1 ml; SP, 2 ml; EP, 3 ml).
The local ethical committee of Ghent University Hospital approved the
study. All subjects gave written informed consent before inclusion. A
B
Figure 1. Methodology and results of IgE determination in nasal secretions. A, The
15
2.2 Skin Prick Test
SPT were performed with a standard panel of eight locally relevant airborne allergen extracts (grass mix, tree mix, Artemisia vulgaris,
Dermatophagoides pteronyssinus, Dermatophagoides farinae, cat, dog
and Alternaria; ALK Abellò). Histamine 0.1 mg/ml and glycerol solution were the positive and negative controls, respectively. Morrow-Brown needles were used to prick the skin and the dimension of the wheal reactions was measured after 15 min. An average wheal diameter >3 mm
after subtraction of the negative control was regarded as positive. [38]
2.3 Questionnaires
Internationally validated questionnaires were administered to all participants on general health, surgical history, medication use, smoking and drinking habits, history of allergic disease and asthma. Three questionnaires were used to evaluate AR symptoms: a) Visual Analogue
Scales (VAS) for (sino)nasal, ocular and lower airway symptoms and for control of AR [39]; b) Symptom Score [40]; and c) Test for Control of Allergic Rhinitis [41]. The ARIA classification was used to discriminate patients with mild or moderate/severe AR, and intermittent or persistent AR [42].
16
2.4 Serum collection
Sera were collected by standard venepuncture, centrifuged for 10 minutes at 1620 g (3000 RPM) at room temperature, aliquoted and stored at -20°C until analysis.
2.5 Collection and processing of nasal secretions
Three different absorptive devices were used in this study for collection of nasal secretions (NasSec): Filter Disks (FD), Ear Packs (EP) and Sinus Packs (SP). FD are punched out of Shandon filter paper cards (No. 190005; Shandon, Pittsburgh, PA) using a 10mm punch. SP and EP are commercially available sponges, for this study provided by Fabco (Ivalon®; New London, CT): “Post-Op Sinus Packing” (K9, 4000plus, 3.5 cm long x 0.9 cm wide x 1.2 cm high) and “Small Post-Op Ear Packing” (2.4 cm long x 1.2 cm diameter). The FD, SP and EP are sealed in pairs in 15 ml tubes (Falcon, Becton Dickinson Labware, Lincoln Park, NJ) and are preweighed.
Under direct visualization, using a surgical headlight, a speculum and bayonet forceps the FD, SP or EP were placed in the nasal cavity (one per nostril). FD were placed on the anterior third of the nasal septum,
17
whereas SP and EP were inserted on the floor of the cavity between the septum and inferior turbinate. The devices were left in the nose for 5 minutes, than removed, placed back in their respective 15 ml tube, and weighed again. The weight of collected NasSec (WNS) have bee n determined by comparing the weights of the devices in their respective
Falcon tubes before and after collection, using the same balance.
After collection, an amount of physiologic saline (0,9% NaCl) has been added in order to mobilize the NasSec from the device, resulting in diluted samples. For the first test, NasSec were processed with a fixed
dilution: FD samples were diluted 1:20, SP samples 1:10. In order to obtain this fixed dilution, the amount of saline to be added, needed to be calculated for each sample: X (ml)=WNS x (DF-1) (DF: dilution factor, WNS: weight of collected NS, X: volume of saline to be added).
For the second test, NasSec were processed with a fixed volume: 1 ml was added to FD samples, 2 ml to EP and 3 ml to SP samples. Hence, the dilution differed for each sample and needed to be calculated for each sample: DF=(WNS+X (ml))/WNS (DF: dilution factor, WNS: weight of collected NS, X: added volume of saline).
After addition of saline, samples were stored at 4°C for two hours. Subsequently, the devices were placed in the shaft of a 5 ml syringe
18
(Becton-Dickinson S.A.), placed back in their respective tube, and squeezed out with the piston of the syringe. The samples were than centrifuged (1500g, 15 min, 4°C) to extract all fluid. Finally, the supernatants were aliquoted and stored at -20°C until analysis.
2.6 IgE assays
Total IgE and sIgE to HDM extract were measured in sera and NasSec
with ImmunoCAP-FEIA (TFS, Uppsala, Sweden) and the results expressed in kU/L with a detection limit of 0.1 kU/l.
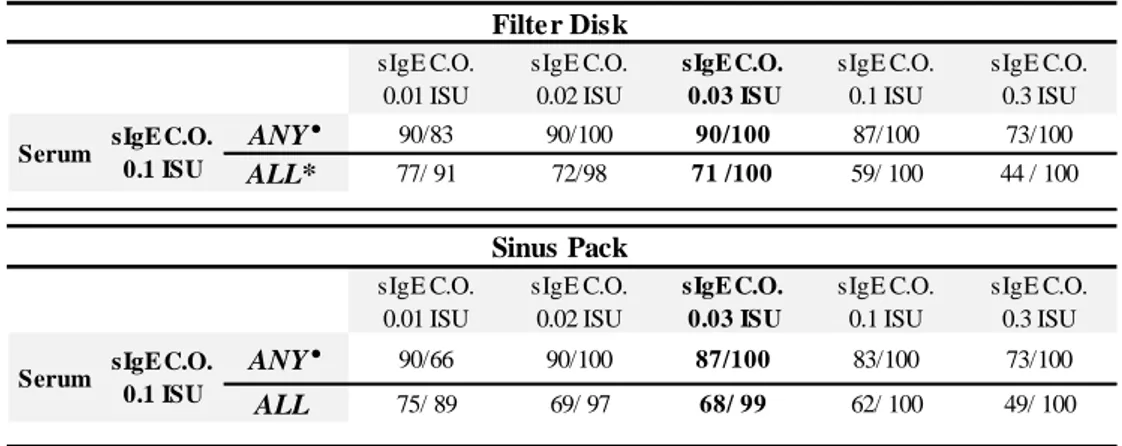
Specific IgE to nDer p 1, rDer p 2, rDer p 4, rDer p 5, rDer p 7, rDer p 10, rDer p 11, rDer p 14, rDer p 15, rDer p 18, rDer p 21, rDer p 23, clone 16 and to nDer f 1 and rDer f 2 were measured with the microarray in serum (cut-off ≥0.10 ISU) and NasSec (cut-off ≥0.03 ISU in diluted NasSec). The latter was selected based on sensitivity and specificity analyses of sIgE tests in NasSec for different cut-off, with IgE tests in serum as reference (Table 1). The best balance of sensitivity and specificity was achieved with a cut-off of ≥0.03 ISU in diluted NasSec for all the 15 molecules and for at least one of the major allergen molecules of groups
19
1 (nDer p 1, nDer f 1), 2 (rDer p 2, rDer f 2) and 23 (rDer p 23) (Table E3). Therefore, this cut-off was selected for further analyses.
As the NasSec samples were diluted during processing, measured levels of total IgE and sIgE needed to be corrected afterwards: levels were multiplied with the corresponding dilution factor in order to estimate the
levels in NasSec samples before they were diluted.
For fixed dilution processing: the cut-off of 0.2 kU/l (ImmunoCAP) in the diluted samples reflects a cut-off in the undiluted samples of 4.0 kU/l for FD and 2.0 kU/l for SP; the cut-off of 0.03 ISU (allergen microarray)
in the diluted samples reflects a cut-off in the undiluted samples of 0.6 ISU for FD and 0.3 ISU for SP. As fixed volume processing results in a different dilution for each sample, the cut-off points of 0.2 kU/l and 0.03 ISU in the diluted samples correspond to different cut-off points in the undiluted samples.
20 sIgE C.O. 0.01 ISU sIgE C.O. 0.02 ISU sIgE C.O. 0.03 ISU sIgE C.O. 0.1 ISU sIgE C.O. 0.3 ISU ANY° 90/83 90/100 90/100 87/100 73/100 ALL* 77/ 91 72/98 71 /100 59/ 100 44 / 100 sIgE C.O. 0.01 ISU sIgE C.O. 0.02 ISU sIgE C.O. 0.03 ISU sIgE C.O. 0.1 ISU sIgE C.O. 0.3 ISU ANY° 90/66 90/100 87/100 83/100 73/100 ALL 75/ 89 69/ 97 68/ 99 62/ 100 49/ 100
Sensitivity/Specificity shown for the respective cut-off levels in nasal secretions. C.O., Cut-off.
Serum sIgE C.O.
0.1 ISU
° outcomes referred to at least one of the major allergenic molecules (nDer p 1, rDer p 2, rDer p 23, nDer f1, rDer f2) * outcomes referred to all 15 molecules, including rDer p 10, rDer p 11, rDer p 14, rDer p 15, Clone 16, rDer p 18, all
characterized by a low positive sample size (n<5)
Table 1. Sensitivity and specificity of the microarray for different cut-offs of sIgE positivity in
nasal secretions, with the results in serum as reference, considering all the 15 and at least one the major allergenic molecules (nDer p 1, rDer p2, rDerp23, nDer f1, rDer f2).
Filter Disk
Serum sIgE C.O.
0.1 ISU
Sinus Pack
2.7 Statistics
Sensitivity and specificity, positive and negative predictive values, accuracy, and positive and negative likelihood ratios of IgE tests in NasSec were calculated with two-by-two tables, using the results of IgE tests in serum as a reference. Intrapatient comparisons of IgE levels were performed with Spearman's rank correlation and a p-value <0.05 was
considered statistically significant. Statistical analyses were performed with R Core Team (2014), version 3.2.3. Graphs were created with Graphpad Prism version 6.00 (La Jolla, CA, USA).
22
Results
_________________________________________________________________________
3.1 Participants
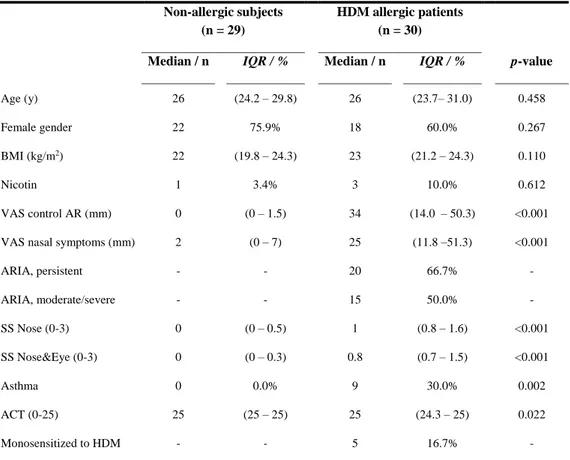
Thirty adult consecutive patients with HDM-AR and twentynine non-allergic controls, comparable in terms of age and gender, were recruited (Table 2).
Table 2. Characteristics of study population
Non-allergic subjects (n = 29)
HDM allergic patients (n = 30)
Median / n IQR / % Median / n IQR / % p-value
Age (y) 26 (24.2 – 29.8) 26 (23.7– 31.0) 0.458 Female gender 22 75.9% 18 60.0% 0.267 BMI (kg/m2) 22 (19.8 – 24.3) 23 (21.2 – 24.3) 0.110 Nicotin 1 3.4% 3 10.0% 0.612 VAS control AR (mm) 0 (0 – 1.5) 34 (14.0 – 50.3) <0.001
VAS nasal symptoms (mm) 2 (0 – 7) 25 (11.8 –51.3) <0.001
ARIA, persistent - - 20 66.7% - ARIA, moderate/severe - - 15 50.0% - SS Nose (0-3) 0 (0 – 0.5) 1 (0.8 – 1.6) <0.001 SS Nose&Eye (0-3) 0 (0 – 0.3) 0.8 (0.7 – 1.5) <0.001 Asthma 0 0.0% 9 30.0% 0.002 ACT (0-25) 25 (25 – 25) 25 (24.3 – 25) 0.022 Monosensitized to HDM - - 5 16.7% -
p-value for difference between non-allergic subjects and HDM allergic patients (Mann-Whitney U test or Fisher’s exact test). ACT, Asthma Control Test; ARIA, Allergic Rhinitis and its Impact on Asthma; BMI, body mass index; HDM, House Dust Mite; IQR, Interquartile range; SS, Symptom Score; VAS, Visual Analogue Scale.
23
All participants completed questionnaires on general health and allergy, SPT and sample collection for the first test between November 2013 and August 2016. Sample collection for the second test was performed in 13 AR patients between January and March 2015, in the 15 patients whose first sample had been taken between November 2013 and March 2014.
3.2 IgE responses to HDM extract
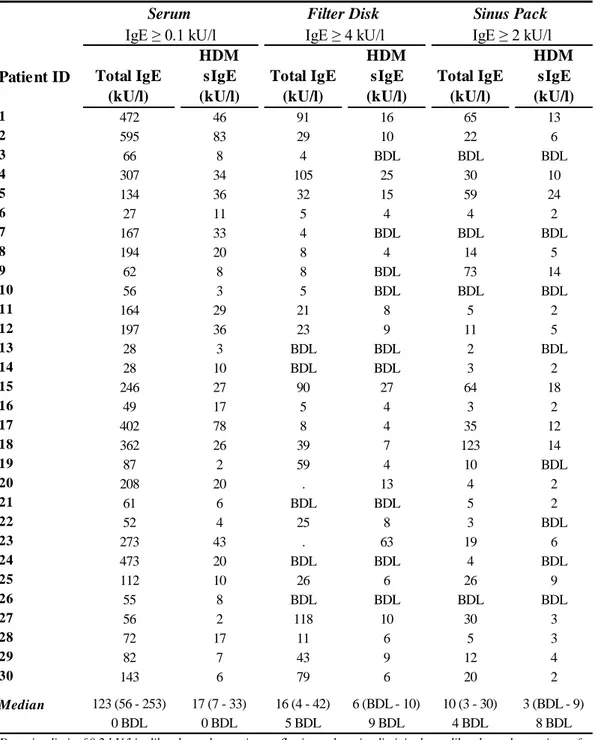
Specific IgE to HDM extract were detected through ImmunoCAP-FEIA in serum of all 30 AR patients, but only in 21 FD and 22 SP samples (Table 3). All controls had undetectable HDM sIgE in both serum and NasSec. Hence, HDM sIgE in NasSec predicted with 100% specificity, but poor sensitivity (FD, 70%; SP, 73%), serum results.
24 Patient ID Total IgE
(kU/l) HDM sIgE (kU/l) Total IgE (kU/l) HDM sIgE (kU/l) Total IgE (kU/l) HDM sIgE (kU/l) 1 472 46 91 16 65 13 2 595 83 29 10 22 6 3 66 8 4 BDL BDL BDL 4 307 34 105 25 30 10 5 134 36 32 15 59 24 6 27 11 5 4 4 2 7 167 33 4 BDL BDL BDL 8 194 20 8 4 14 5 9 62 8 8 BDL 73 14 10 56 3 5 BDL BDL BDL 11 164 29 21 8 5 2 12 197 36 23 9 11 5 13 28 3 BDL BDL 2 BDL 14 28 10 BDL BDL 3 2 15 246 27 90 27 64 18 16 49 17 5 4 3 2 17 402 78 8 4 35 12 18 362 26 39 7 123 14 19 87 2 59 4 10 BDL 20 208 20 . 13 4 2 21 61 6 BDL BDL 5 2 22 52 4 25 8 3 BDL 23 273 43 . 63 19 6 24 473 20 BDL BDL 4 BDL 25 112 10 26 6 26 9 26 55 8 BDL BDL BDL BDL 27 56 2 118 10 30 3 28 72 17 11 6 5 3 29 82 7 43 9 12 4 30 143 6 79 6 20 2 Median 123 (56 - 253) 17 (7 - 33) 16 (4 - 42) 6 (BDL - 10) 10 (3 - 30) 3 (BDL - 9) 0 BDL 0 BDL 5 BDL 9 BDL 4 BDL 8 BDL
Detection limit of 0.2 kU/l in diluted nasal secretions reflecting a detection limit in the undiluted nasal secretions of 4 kU/l for FD (1:20 dilution) and 2 kU/l for SP (1:10 dilution). BDL, Below Detection Limit. IQR, Interquartile range. For patient #20 and patient #23 total IgE was not measured in nasal secretions collected with FD as not enough volume was available.
Table 3. IgE responses detected with ImmunoCAP in 30 patients with allergic rhinitis at the first test.
Serum Filter Disk Sinus Pack
25
3.3 IgE responses to D.pt. and D.fa. allergenic molecules
3.3.1 Prevalence of IgE responses
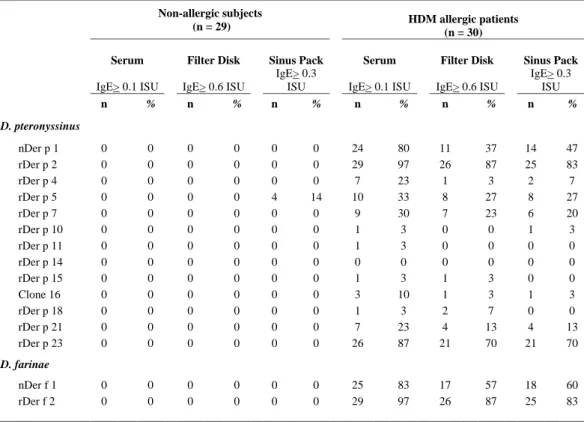
Among the 30 AR patients the prevalence of sIgE to 13 of the 15 examined HDM molecules was similar in serum and NasSec: 83%-97% for group 2 molecules (rDer p 2, rDer f 2); 70%-87% for rDer p 23;
20%-33% (rDer p 5, rDer p 7); and 0%-23% for all others. Conversely, sIgE to group 1 molecules (nDer p 1, nDer f 1) was detected frequently in serum (80%-83%), but less in NasSec (37%-60%).
No IgE antibodies to any of the examined molecules were detected nor in the sera or nasal secretions from all the 29 control subjects, with the exception of rDer p 5, that was recognized by IgE in the NasSec
26
Table 4. Prevalence of detectable IgE antibodies to each of the 15 HDM allergen molecules among the different samples (serum and nasal secretions) collected from 29 non allergic controls and 30 HDM allergic rhinitis patients at the first test.
Non-allergic subjects
(n = 29) HDM allergic patients (n = 30)
Serum Filter Disk Sinus Pack Serum Filter Disk Sinus Pack
IgE> 0.1 ISU IgE> 0.6 ISU
IgE> 0.3
ISU IgE> 0.1 ISU IgE> 0.6 ISU
IgE> 0.3 ISU n % n % n % n % n % n % D. pteronyssinus nDer p 1 0 0 0 0 0 0 24 80 11 37 14 47 rDer p 2 0 0 0 0 0 0 29 97 26 87 25 83 rDer p 4 0 0 0 0 0 0 7 23 1 3 2 7 rDer p 5 0 0 0 0 4 14 10 33 8 27 8 27 rDer p 7 0 0 0 0 0 0 9 30 7 23 6 20 rDer p 10 0 0 0 0 0 0 1 3 0 0 1 3 rDer p 11 0 0 0 0 0 0 1 3 0 0 0 0 rDer p 14 0 0 0 0 0 0 0 0 0 0 0 0 rDer p 15 0 0 0 0 0 0 1 3 1 3 0 0 Clone 16 0 0 0 0 0 0 3 10 1 3 1 3 rDer p 18 0 0 0 0 0 0 1 3 2 7 0 0 rDer p 21 0 0 0 0 0 0 7 23 4 13 4 13 rDer p 23 0 0 0 0 0 0 26 87 21 70 21 70 D. farinae nDer f 1 0 0 0 0 0 0 25 83 17 57 18 60 rDer f 2 0 0 0 0 0 0 29 97 26 87 25 83
Overall, 4/1305 (0.31%) of all microarray tests performed were positive among the 29 controls, while 423/1350 (31.33%) of them resulted positive among the 30 AR patients.
Cut-off in diluted nasal secretions of 0.03 ISU reflecting a cut-off in the undiluted nasal secretions of 0.6 ISU for Filter Disks (1:20 dilution) and 0.3 ISU for Sinus Packs (1:10 dilution).
27
3.3.2 Prediction of serum IgE responses by testing nasal IgE
Detection of IgE to at least one of the major allergen molecules (nDer p 1, nDer f 1, rDer p 2, rDer f 2, rDer p23) in NasSec predicted with high sensitivity and excellent specificity the allergic status of the patient and the outcome of IgE assays in the serum (specificity 100% [95%CI 83-100] for both FD and SP; sensitivity 90% [95%CI 73-98] for FD and 87% [95%CI 69-96] for SP). This accuracy was confirmed by excellent positive and negative predictive values, as well as positive and negativelikelihood ratios (Table 5). The sensitivity of the microarray to identify AR patients was significantly higher than that of the ImmunoCAP, considering FD method (27/30, 90% versus 21/30, 70%, p = 0.05). Overall, the specificity of the IgE assays performed in the NasSec were
invariably 100% for all individual allergenic molecules detected with a higher positive sample size (n>5), with the exception of IgE to Der p 4 (98% for both FD and SP) and Der p 5 (90% only for SP). The overall accuracy of the IgE tests in the NasSec collected with FD and SP method, in predicting the outcome of the corresponding IgE assays in the serum,
28
Table 5. Prediction of house dust mite (HDM) allergy and serum IgE responses by testing IgE in nasal secretions
in 30 HDM allergic patients and 29 healthy controls.
Filter Disk
Sensitivity Specificity PPV NPV Accuracy LR+ LR-
% (95% CI)† % (95% CI)† % (95% CI)† % (95% CI)† %
ANY major molecules ° 90 (73 - 98) 100 (83 - 100) 100 (82 - 100) 91 (75 - 98) 95 ∞ 0.1 nDer p 1 46 (26 -66) 100 (85 - 100) 100 (62 -100) 73 (58 - 85) 78 ∞ 0.5 nDer f 1 68 (46 - 85) 100 (85 - 100) 100 (73 - 100) 81 (66 - 91) 86 ∞ 0.3 rDer p 2 90 (73 - 98) 100 (83 - 100) 100 (81 - 100) 91 (76 - 98) 95 ∞ 0.1 rDer f 2 90 (73 - 98) 100 (83 - 100) 100 (81 - 100) 91 (76 - 98) 95 ∞ 0.1 rDer p 23 81 (61 - 93) 100 (85 - 100) 100 (77 - 100) 87 (72 - 96) 92 ∞ 0.2 OTHER molecules rDer p 4 0 (0 - 53) 98 (90 - 100) 0 (0 - 99) 88 (77 - 95) 86 0.0 1.0 rDer p 5 80 (44 - 97) 100 (89 - 100) 100 (52 - 100) 96 (87 - 100) 97 ∞ 0.2 rDer p 7 78 (40 - 97) 100 (90 - 100) 100 (47 - 100) 96 (87 - 100) 97 ∞ 0.2 rDer p 21 57 (18 - 90) 100 (90 - 100) 100 (28 - 100) 95 (85 - 99) 95 ∞ 0.4 ALL molecules¥ 71 (63 - 77) 100 (99 - 100) 98 (93 - 100) 93 (91 - 95) 94 167.4 0.3 Sinus Pack
Sensitivity Specificity PPV NPV Accuracy LR+ LR-
% (95% CI)† % (95% CI)† % (95% CI)† % (95% CI)† %
ANY major molecules ° 87 (69 - 96) 100 (83 - 100) 100 (81 - 100) 88 (72 - 97) 93 ∞ 0.1 nDer p 1 58 (37 - 78) 100 (85 - 100) 100 (68 - 100) 78 (63 - 89) 83 ∞ 0.4 nDer f 1 48 (28 - 69) 100 (85 - 100) 100 (64 - 100) 72 (57 - 84) 78 ∞ 0.5 rDer p 2 86 (68 - 96) 100 (83 - 100) 100 (80 - 100) 88 (73 - 97) 93 ∞ 0.1 rDer f 2 86 (68 - 96) 100 (83 - 100) 100 (80 - 100) 88 (73 - 97) 93 ∞ 0.1 rDer p 23 81 (61 - 93) 100 (85 - 100) 100 (77 -100) 87 (72 - 96) 92 ∞ 0.2 OTHER molecules rDer p 4 14 (0 - 58) 98 (90 - 100) 50 (1 - 99) 89 (78 - 96) 88 7.4 0.9 rDer p 5 70 (35 - 93) 90 (78 - 97) 58 (28 - 85) 94 (82 - 99) 86 6.9 0.3 rDer p 7 67 (30 - 93) 100 (90 - 100) 100 (42 - 100) 94 (84 - 99) 95 ∞ 0.3 rDer p 21 57 (18 - 90) 100 (90 - 100) 100 (28 - 100) 95 (85 - 99) 95 ∞ 0.4 ALL molecules¥ 68 (60 - 75) 99 (98 - 100) 95 (90 - 98) 93 (91 - 94) 94 80.3 0.3
† exact binomial confidence limits (95 % CI) for test sensitivity, specificity, PPV (positive predictive value); NPV (negative predictive value), LR+ (positive likelihood ratio), LR- (negative likelihood ratio).
° outcomes referred to at least one of the major allergen molecules (nDer p 1, nDer f 1, rDer p 2, rDer f 2, rDer p 23). ¥ including outcomes of rDer p 10, rDer p 11, rDer p 14, rDer p 15, Clone 16, rDer p 18, all characterized by a low positive sample size
29
Levels of IgE to the HDM molecules in NasSec collected with FD and SP were highly related to one another (rs 0.78, p<0.001) and to the
respective levels in serum (FD, rs 0.43, p<0.001; SP, rs 0.45, p<0.001;
Figure 2). 0.1 1 10 100 1000 0.1 1 10 100 1000
Serum IgE levels (ISU)
n a s a l Ig E l e v e ls ( IS U ) F il te r D is k s 0.1 1 10 100 1000 0.1 1 10 100 1000
Serum IgE levels (ISU)
n a s a l Ig E l e v e ls ( IS U ) S in u s P a c k s 0.1 1 10 100 1000 0.1 1 10 100 1000
nasal IgE levels (ISU) Filter Disks n a s a l Ig E l e v e ls ( IS U ) S in u s P a c k s
Figure 2. Relationship between levels (ISU) of detectable IgE to the 15 HDM molecules detected
in NasSec (y-axis), collected with filter disk (FD) and sinus pack (SP), and serum (x-axis) in 30 AR patients (first test). The Spearman's rank correlation coefficients (rs) and the respective
p-values are shown.
3.3.3 Test reproducibility
The results of the first test were generally reproduced in the second test. Moreover, this time, the prevalence of sIgE to group 1 molecules in serum and NasSec was more similar (serum, 77%; NasSec, 62%-77%;
Tables 4 and 6).
In the first test sIgE to group 1 molecules (nDer p 1, nDer f 1) was detected frequently in serum, but less so in NasSec. In the second test the prevalence of sIgE to group 1 molecules in serum and NasSec was more similar. The second sample was collected one year after the first one and
30
the exposure to Der p 1 in the home environment of study’s patients was not measured. Therefore it cannot ascertain whether this variation is due to: a) differences in allergen exposure; b) an i ncreased local (nasal) production of IgE against group 1 molecules; or c) a very specific, although unknown, methodological issue in the first determination.
n % n % n % n % D. pteronyssinus nDer p 1 10 77 9 69 10 77 10 77 rDer p 2 13 100 11 85 12 92 12 92 rDer p 4 1 8 4 31 3 23 4 31 rDer p 5 4 31 4 31 3 23 5 38 rDer p 7 5 38 3 23 3 23 3 23 rDer p 10 1 8 0 0 0 0 0 0 rDer p 11 0 0 0 0 0 0 4 31 rDer p 14 0 0 0 0 0 0 0 0 rDer p 15 1 8 0 0 0 0 0 0 clone 16 1 8 1 8 1 8 0 0 rDer p 18 4 31 3 23 2 15 3 23 rDer p 21 2 15 0 0 0 0 0 0 rDer p 23 10 77 8 62 9 69 8 62 D. farinae nDer f 1 10 77 8 62 9 69 8 62 rDer f 2 13 100 11 85 12 92 12 92 Table 6. Prevalence of detectable IgE antibodies to each of the 15
HDM allergen molecules among the different samples (serum and nasal secretions) collected from 13 AR patients at the second test.
31
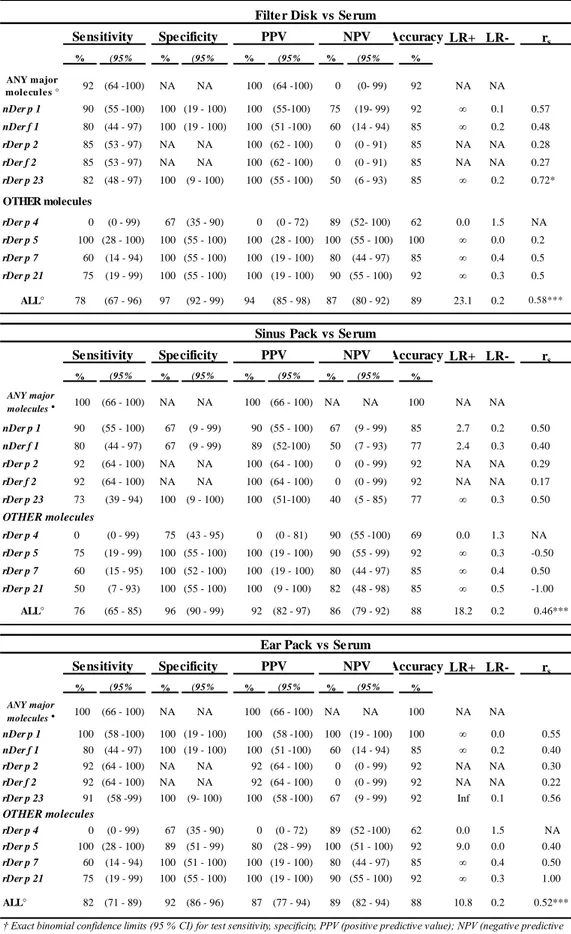
Performance parameters at the first test(Tables 5) were all reproduced or
even improved when the tests were repeated on samples collected with the FD, the SP and the EP methods from 13 AR patients at the second
32 Accuracy LR+ LR- rs % (95% % (95% % (95% % (95% % ANY major mole cule s ° 92 (64 -100) NA NA 100 (64 -100) 0 (0- 99) 92 NA NA nDer p 1 90 (55 -100) 100 (19 - 100) 100 (55-100) 75 (19- 99) 92 ∞ 0.1 0.57 nDer f 1 80 (44 - 97) 100 (19 - 100) 100 (51 -100) 60 (14 - 94) 85 ∞ 0.2 0.48 rDer p 2 85 (53 - 97) NA NA 100 (62 - 100) 0 (0 - 91) 85 NA NA 0.28 rDer f 2 85 (53 - 97) NA NA 100 (62 - 100) 0 (0 - 91) 85 NA NA 0.27 rDer p 23 82 (48 - 97) 100 (9 - 100) 100 (55 - 100) 50 (6 - 93) 85 ∞ 0.2 0.72* OTHER molecules rDer p 4 0 (0 - 99) 67 (35 - 90) 0 (0 - 72) 89 (52- 100) 62 0.0 1.5 NA rDer p 5 100 (28 - 100) 100 (55 - 100) 100 (28 - 100) 100 (55 - 100) 100 ∞ 0.0 0.2 rDer p 7 60 (14 - 94) 100 (55 - 100) 100 (19 - 100) 80 (44 - 97) 85 ∞ 0.4 0.5 rDer p 21 75 (19 - 99) 100 (55 - 100) 100 (19 - 100) 90 (55 - 100) 92 ∞ 0.3 0.5 ALL° 78 (67 - 96) 97 (92 - 99) 94 (85 - 98) 87 (80 - 92) 89 23.1 0.2 0.58*** Accuracy LR+ LR- rs % (95% % (95% % (95% % (95% % ANY major molecules ° 100 (66 - 100) NA NA 100 (66 - 100) NA NA 100 NA NA nDer p 1 90 (55 - 100) 67 (9 - 99) 90 (55 - 100) 67 (9 - 99) 85 2.7 0.2 0.50 nDer f 1 80 (44 - 97) 67 (9 - 99) 89 (52-100) 50 (7 - 93) 77 2.4 0.3 0.40 rDer p 2 92 (64 - 100) NA NA 100 (64 - 100) 0 (0 - 99) 92 NA NA 0.29 rDer f 2 92 (64 - 100) NA NA 100 (64 - 100) 0 (0 - 99) 92 NA NA 0.17 rDer p 23 73 (39 - 94) 100 (9 - 100) 100 (51-100) 40 (5 - 85) 77 ∞ 0.3 0.50 OTHER molecules rDer p 4 0 (0 - 99) 75 (43 - 95) 0 (0 - 81) 90 (55 -100) 69 0.0 1.3 NA rDer p 5 75 (19 - 99) 100 (55 - 100) 100 (19 - 100) 90 (55 - 99) 92 ∞ 0.3 -0.50 rDer p 7 60 (15 - 95) 100 (52 - 100) 100 (19 - 100) 80 (44 - 97) 85 ∞ 0.4 0.50 rDer p 21 50 (7 - 93) 100 (55 - 100) 100 (9 - 100) 82 (48 - 98) 85 ∞ 0.5 -1.00 ALL° 76 (65 - 85) 96 (90 - 99) 92 (82 - 97) 86 (79 - 92) 88 18.2 0.2 0.46*** Accuracy LR+ LR- rs % (95% % (95% % (95% % (95% % ANY major molecules ° 100 (66 - 100) NA NA 100 (66 - 100) NA NA 100 NA NA nDer p 1 100 (58 -100) 100 (19 - 100) 100 (58 -100) 100 (19 - 100) 100 ∞ 0.0 0.55 nDer f 1 80 (44 - 97) 100 (19 - 100) 100 (51 -100) 60 (14 - 94) 85 ∞ 0.2 0.40 rDer p 2 92 (64 - 100) NA NA 92 (64 - 100) 0 (0 - 99) 92 NA NA 0.30 rDer f 2 92 (64 - 100) NA NA 92 (64 - 100) 0 (0 - 99) 92 NA NA 0.22 rDer p 23 91 (58 -99) 100 (9- 100) 100 (58 -100) 67 (9 - 99) 92 Inf 0.1 0.56 OTHER molecules rDer p 4 0 (0 - 99) 67 (35 - 90) 0 (0 - 72) 89 (52 -100) 62 0.0 1.5 NA rDer p 5 100 (28 - 100) 89 (51 - 99) 80 (28 - 99) 100 (51 - 100) 92 9.0 0.0 0.40 rDer p 7 60 (14 - 94) 100 (51 - 100) 100 (19 - 100) 80 (44 - 97) 85 ∞ 0.4 0.50 rDer p 21 75 (19 - 99) 100 (55 - 100) 100 (19 - 100) 90 (55 - 100) 92 ∞ 0.3 1.00 ALL° 82 (71 - 89) 92 (86 - 96) 87 (77 - 94) 89 (82 - 94) 88 10.8 0.2 0.52***
Table 7. Prediction of IgE responses in serum by testing IgE responses in nasal secretions collected with
filter disks and sinus packs in 13 patients with AR at the second test.
Filter Disk vs Serum Sensitivity Specificity PPV NPV
† Exact binomial confidence limits (95 % CI) for test sensitivity, specificity, PPV (positive predictive value); NPV (negative predictive value), LR+ (positive likelihood ratio), LR- (negative likelihood ratio).
rs Spearman's rank correlation coefficient , (*p<0.05, **p<0.01, ***p<0.001)
° including outcomes of rDer p 4, rDer p 21, rDer p 11, rDer p 18, Clone 16, rDer p 10, rDer p 15, rDer p 14, all characterized by a low positive sample size (n<5).
Sinus Pack vs Serum Sensitivity Specificity PPV NPV
Ear Pack vs Serum Sensitivity Specificity PPV NPV
33
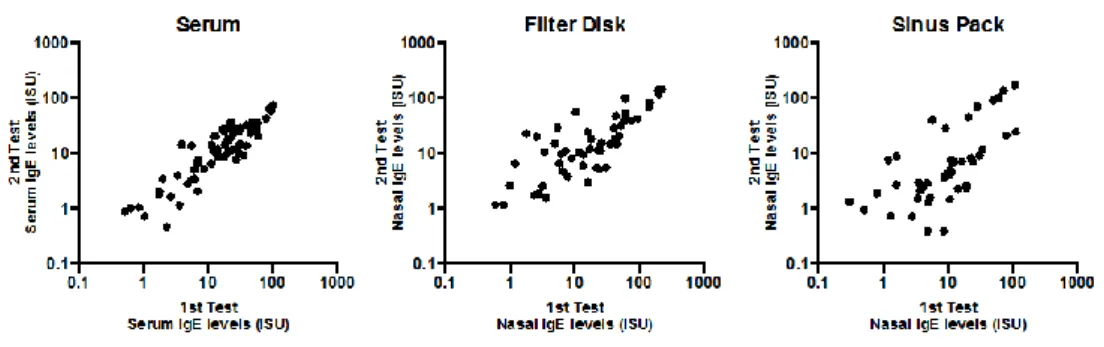
HDM sIgE levels measured in the first and the second test were highly correlated in each sample type [serum, rs 0.86 (p<0.001); FD, rs 0.76 (p<0.001); SP, rs 0.71 (p<0.001); Figure 3].
Figure 3. IgE levels (ISU) to all 15 HDM allergen molecules detected in each AR patient (n=13)
at the two different time-points (Test 1 and Test 2) in the three samples, respectively: serum (A), filter disks (B), and sinus packs (C). The Spearman's rank correlation coefficients (rs) and the
35
Discussion and conclusions
_________________________________________________________________________
To my knowledge, this is the first study that has: (a) explored the use of a micro-array chip for IgE detection in NasSec of patients with allergic
rhinitis; (b) compared three different adsorbent materials (FD, SP and EP) for NasSec collection; and (c) tested a fixed dilution versus a fixed volume approach in processing NasSec samples before testing. Another study has previously shown that a microarray technique (ImmunoCAP
ISACTM, TFS) can detect IgE to multiple molecules of airborne and food
allergens in nasal mucosal brush biopsies of AR patients.[36] The same microarray has been recently used to investigate IgE antibodies in the NasSec of patients with Non Allergic Rhinitis with Eosinophilia Syndrome (NARES).[37]
The main novelty of this study is the observatio n that a customized microarray can detect IgE to HDM molecules in NasSec, which is far less invasive than nasal biopsies, with a good sensitivity, superior to the sensitivity of ImmunoCAP in detecting IgE to HDM extracts in the same samples.
36
Moreover, the microarray results in NasSec were very predictive for serum results. The implications of this observation for the clinical practice are in my opinion convincing. Testing nasal IgE to allergen molecules by a microarray approach may soon become a non-invasive and feasible alternative in the diagnostic work-up of AR patients.
Additionally, these findings may offer new perspectives for research on “Local Allergic Rhinitis”, a hotly debated entity suggested to be a specific subset of rhinitis characterized by a positive allergen-specific nasal provocation test in the absence o f systemic atopy assessed by
conventional diagnostic tests such as prick testing or serum specific IgE for the offending airborne allergen. [12] The identification of IgE in NasSec of “Local Allergic Rhinitis” patients may indeed be a feasible alternative to allergen-specific nasal provocation tests.
The high accuracy of the microarray approach in detecting IgE to HDM allergen molecules in NasSec compared to serum was very robust with all the methods used for NasSec collection (FD, EP, SP) and processing (“fixed volume” and “fixed dilution”). Two methodological aspects are relevant in view of the application of this new diagnostic method in the clinical practice. First, the best performance was obtained by collecting NasSec with FD, which are smaller in size and more acceptable for the
37
patient than EP and SP. Second, in this study NasSec were quite highly diluted during processing: in the first test a fixed dilution of 1:20 for DF and 1:10 for SP, in the second test a varying dilution (ranging from 1:17 for 1:61 in FD; 1:3 to 1:24 for EP; 1:4 and 1:26 for SP). Also in samples that were less diluted (some samples of the second test) a high diagnostic
accuracy was obtained. This observation raises the question whether a lower dilution factor (e.g. 1:4) might be used to further improve the test sensitivity.
However, I recognize a few limitations of the current study, such as the
generally low level of total IgE in the control subjects, and the fac t that the study is focused on one allergen source only. Another limitation of this study is the possibility that IgG4 antibodies –not measured in the samples- may have exerted competitive effects to IgE-binding in the microarray. Also, the selected cut-off (i.e. 0.03 ISU for diluted NasSec) cannot be automatically applied in other settings nor to other customized or commercial microarray chips.microarray chips. Large-scale studies investigating allergen sIgE detection with micro-array techniques in NasSec are therefore needed to confirm these promising findings. The technique should be investigated in more heterogeneous patient
39
References
_________________________________________________________________________
1. Greiner N, Hellings P, Rotiroti G, Scadding GK. Allergic rhinitis.
Lancet 2011; 378: 2112-22.
2. W. O. Eifan and S. R. Durham. Pathogenesis of rhinitis. Clinical
& Experimental Allergy, 2016: 1139–1151.
3. Singh K, Axelrod S, Bielory L. The epidemiology of ocular and
nasal allergy in the United States, 1988– 1994. J Allergy Clin Immunol 2010; 126:778–83.
4. Ait-Khaled N, Pearce N, Anderson HR, Ellwood P, Montefort S,
Shah J. Global map of the prevalence of symptoms of rhinoconjunctivitis in children: The International Study of Asthma and Allergies in Childhood (ISAAC) Phase Three. Allergy 2009; 64: 123-48.
5. Bauchau V, Durham SR. Prevalence and rate of diagnosis of
40
6. Walker S, Khan W, Fletcher M, Cullinan P, Harris J, Sheikh A. Seasonal allergic rhinitis is associated with a detrimental effect on examination performance in United Kingdom teenagers: case-control study. J Allergy Clin Immunol 2007;120:381–387.
7. Coker HA, Durham SR, Gould HJ. Local somatic hypermutation
and class switch recombination in the nasal mucosa of allergic rhinitis patients. J Immunol. 2003;171:5602-10.
8. Takhar P, Smurthwaite L, Coker HA, Fear DJ, Banfield GK, Carr
VA, Durham SR, Gould HJ. Allergen drives class switching to IgE in the nasal mucosa in allergic rhinitis. J Immunol. 2005;174:5024-32.
9. Smurthwaite L, Durham SR. Local IgE synthesis in allergic
rhinitis and asthma. Curr Allergy Asthma Rep. 2002;2:231-8.
10. KleinJan A, Godthelp T, van Toornenenbergen AW, Fokkens WJ. Allergen binding to specific IgE in the nasal mucosa of allergic
patients. J Allergy Clin Immunol. 1997;99:515-21.
11. KleinJan A, Vinke JG, Severijnen LW, Fokkens WJ. Local production and detection of (specific) IgE in nasal B-cells and
41
plasma cells of allergic rhinitis patients. Eur Respir J. 2000;15:491-7.
12. Campo P, Rondón C, Gould HJ, Barrionuevo E, Gevaert P, Blanca M. Local IgE in non-allergic rhinitis. Clin Exp Allergy 2015;45:872-81.
13. Rondón C, Campo P, Galindo L, et al Prevalence and clinical relevance of local allergic rhinitis. Allergy 2012.67: 1282-8.
14. Rondón C, Campo P, Zambonino MA, et al. Follow-up study in local allergic rhinitis shows a consistent entity not evolving to systemic allergic rhinitis. J Allergy Clin Immunol 2014; 133: 1026–1031.
15. Huggins KG, Brostoff J. Local production of specific IgE antibodies in allergic-rhinitis patients with negative skin tests. Lancet. 1975;2:148-50.
16. Baba S, Kondo K, Toma-Hirano M, Kanaya K, Suzukawa K,
Ushio M, Suzukawa M, Ohta K, Yamasoba T. Local increase in IgE and class switch recombination to IgE in nasal polyps in chronic rhinosinusitis. Clin Exp Allergy. 2014;44:701-12.
42
17. Zhang N, Holtappels G, Gevaert P, Patou J, Dhaliwal B, Gould H, Bachert C.Mucosal tissue polyclonal IgE is functional in response to allergen and SEB. Allergy. 2011;66:141-8.
18. Dullaers M, De Bruyne R, Ramadani F, Gould HJ, Gevaert P, Lambrecht BN. The who, where, and when of IgE in allergic
airway disease. J Allergy Clin Immunol. 2012;129:635-45.
19. Howarth PH, Persson CG, Meltzer EO, Jacobson MR, Durha m SR, Silkoff PE. Objective monitoring of nasal airway inflammation in rhinitis. J Allergy Clin Immunol. 2005;115 (3 Suppl 1):S414-41.
20. Watelet JB, Gevaert P, Holtappels G, Van Cauwenberge P, Bachert C. Collection of nasal secretions for immunological analysis. Eur Arch Otorhinolaryngol. 2004;26:242-6.
21. Scadding G, Hellings P, Alobid I, Bachert C, Fokkens W, van Wijk RG, Gevaert P, Guilemany J, Kalogjera L, Lund V, Mullol
J, Passalacqua G, Toskala E, van Drunen C. Diagnostic tools in Rhinology EAACI position paper. Clin Transl Allergy. 2011;1:2.
43
22. Sakaida H, Masuda S, Takeuchi K. Measurement of Japanese cedar pollen-specific IgE in nasal secretions. Allergol Int. 2014;63:467-73.
23. Baron-Bodo V, Horiot S, Lautrette A, Chabre H, Drucbert AS, Danzé PM, Sénéchal H, Peltre G, Galvain S, Zeldin RK, Horak
F, Moingeon P. Heterogeneity of antibody responses among
clinical responders during grass pollen sublingual
immunotherapy. Clin Exp Allergy. 2013;43:1362-73.
24. Rondón C, Romero JJ, López S, Antúnez C, Martín-Casañez E, Torres MJ, Mayorga C, R-Pena R, Blanca M. Local IgE production and positive nasal provocation test in patients with persistent nonallergic rhinitis. J Allergy Clin Immunol. 2007;119:899-905.
25. Johansson S, Keen C, Ståhl A, Wennergren G, Benson M. Low levels of CC16 in nasal fluid of children with birch pollen-induced rhinitis. Allergy. 2005;60:638-42.
26. Gevaert P, Van Bruaene N, Cattaert T, Van Steen K, Van Zele T, Acke F, De Ruyck N, Blomme K, Sousa AR, Marshall RP, Bachert C. Mepolizumab, a humanized anti-IL-5 mAb, as a
44
treatment option for severe nasal polyposis. J Allergy Clin Immunol. 2011;128:989-95.
27. Knowles GK, Townsend P, Turner-Warwick M. A standardized filter paper technique for assessing nasal secretory activity. Clin Allergy. 1981;11:287-92.
28. Kristiansen, B.E., Collection of mucosal secretion by synthetic discs for quantitation of secretory IgA and bacteria. J Immunol Methods, 1984;73:251-7.
29. Wagenmann M, Schumacher L, Bachert C. The time course of the bilateral release of cytokines and mediators after unilateral nasal allergen challenge. Allergy. 2005;60:1132–1138.
30. Naclerio RM, Baroody FM. Response of nasal mucosa to histamine or methacholine challenge: use of a quantitative method to examine the modulatory effects of atropine and ipratropium bromide. J Allergy Clin Immunol. 1992;90:1051-4.
31. Verhaeghe B, Gevaert P, Holtappels G, Lukat KF, Lange B, Va n Cauwenberge P, Bachert C. Up-regulation of IL-18 in allergic rhinitis. Allergy. 2002;57:825-30.
45
32. Gevaert P, Calus L, Van Zele T, Blomme K, De Ruyck N, Bauters W, Hellings P, Brusselle G, De Bacquer D, van Cauwenberge P, Bachert C. Omalizumab is effective in allergic and nonallergic patients with nasal polyps and asthma. J Allergy Clin Immunol. 2013;131:110-6.e1.
33. Walsh EE, Falsey AR. A simple and reproducible method for collecting nasal secretions in frail elderly adults, for
measurement of virus-specific IgA. J Infect Dis.
1999;179:1268-73.
34. Klimek, L. and G. Rasp, Norm values for eosinophil cationic protein in nasal secretions: influence of specimen collection. Clin Exp Allergy, 1999. 29:367-74.
35. Heikkinen T, Shenoy M, Goldblum RM, Chonmaitree T. Quantification of cytokines and inflammatory mediators in samples of nasopharyngeal secretions with unknown dilution. Pediatr Res. 1999;45:230-4.
36. Reisacher WR. Detecting local immunoglobulin E from mucosal brush biopsy of the inferior turbinates using microarray analysis. Int Forum Allergy Rhinol. 2013;3:399-403.
46
37. Lupinek C, Wollmann E, Baar A, Banerjee S, Breiteneder H, Broecker BM, et al. Advances in allergen-microarray technology for diagnosis and monitoring of allergy: The MeDALL allergen-chip. Methods. 2014;66:106-19.
38. Bousquet J, Heinzerling L, Bachert C, Papadopoulos NG,
Bousquet PJ, Burney PG, et al. Practical guide to skin prick tests in allergy to aeroallergens. Allergy 2012;67:18-24.
39. Hellings PW, Muraro A, Fokkens W, Mullol J, Bachert C, Canonica GW, Price D, Papadopoulos N, Scadding G, Rasp G, Demoly P, Murray R, Bousquet J. A common language to assess allergic rhinitis control: results from a survey conducted during EAACI 2013 Congress. Clin Transl Allergy. 2015;5:36.
40. Calderon MA, Bernstein DI, Blaiss M, Andersen JS, Nolte H. A comparative analysis of symptom and medication scoring methods used in clinical trials of sublingual immunotherapy for seasonal allergic rhinitis. Clin Exp Allergy. 2014;44:1228-39.
41. Demoly P, Jankowski R, Chassany O, Bessah Y, Allaert FA. Validation of a self-questionnaire for assessing the control of allergic rhinitis. Clin Exp Allergy. 2011;41:860-8.
47
42. Bousquet J, Khaltaev N, Cruz AA, Denburg J, Fokkens WJ, Togias A, Zuberbier T, Baena-Cagnani CE, Canonica GW, va n Weel C, Agache I, Aït-Khaled N, Bachert C, Blaiss MS, Bonini S, Boulet LP, Bousquet PJ, Camargos P, Carlsen KH, Chen Y, Custovic A, Dahl R, Demoly P, Douagui H, Durham SR, van
Wijk RG, Kalayci O, Kaliner MA, Kim YY, Kowalski ML, Kuna P, Le LT, Lemiere C, Li J, Lockey RF, Mavale-Manuel S, Meltzer EO, Mohammad Y, Mullol J, Naclerio R, O'Hehir RE, Ohta K, Ouedraogo S, Palkonen S, Papadopoulos N,
Passalacqua G, Pawankar R, Popov TA, Rabe KF, Rosado-Pinto J, Scadding GK, Simons FE, Toskala E, Valovirta E, va n Cauwenberge P, Wang DY, Wickman M, Yawn BP, Yorgancioglu A, Yusuf OM, Zar H, Annesi-Maesano I, Bateman ED, Ben Kheder A, Boakye DA, Bouchard J, Burne y P, Busse WW, Chan-Yeung M, Chavannes NH, Chuchalin A, Dolen WK, Emuzyte R, Grouse L, Humbert M, Jackson C, Johnston SL, Keith PK, Kemp JP, Klossek JM, Larenas-Linnemann D, Lipworth B, Malo JL, Marshall GD, Naspitz C, Nekam K, Niggemann B, Nizankowska-Mogilnicka E, Okamoto Y, Orru MP, Potter P, Price D, Stoloff SW,
48
Vandenplas O, Viegi G, Williams D; World Health Organization; GA(2)LEN; AllerGen. Allergic Rhinitis and its Impact on Asthma (ARIA) 2008 update (in collaboration with the World Health Organization, GA(2)LEN and AllerGen). Allergy. 2008;63 Suppl 86:8-160.
50
Acknowledgements
I would like to thank all those contributed to the realization of the thesis.
I thank Prof. Filippo De Luca for having accompanying me with great professionalism throughout the years of study.
I wish to express my gratitude to Prof. Giovanni Pajno for having
encorauged me to perform my experience abroad and strengthened me during the hardest moment of work.
I wish to thank Charité-Universitätsmedizin (Berlin) for the hospitality and Prof. Paolo Matricardi for having dedicated to me his valuable time and experience.
I thank Dr. Margot Berings and Prof. Philippe Gevaert from the University of Gent (Belgium) for having collected and provided the
samples, and Prof. Rudolf Valenta (University of Wien) for supplyingthe
molecules used for the customized microarray provided by Thermo Fisher Scientific (Uppsala, Sweden).