UNIVERSITY OF MACERATA
DEPARTMENT OF ECONOMICS AND LAW
PHD COURSE IN
Quantitative Methods for Economic Policy
CYCLE XXII
DISSERTATION TITLE
The role of information efficiency in exchange rate forecasts: evidence from survey data
SUPERVISOR PhD STUDENT
Chiar.ma Prof.ssa Cristiana Mammana Dott. Gianluca Valeri
PhD COORDINATOR
Chiar.mo Prof. Luca De Benedictis
TABLE OF CONTENTS
LIST OF TABLES ... VI LIST OF FIGURES... VII LIST OF APPENDICES ... VIII ABSTRACT OF DISSERTATION PRESENTED TO THE GRADUATE SCHOOL ...IX
INTRODUCTION ... 2
CHAPTER I ...11
THE EFFICIENCY MARKET HYPOTHESIS. ...11
CHAPTER II ...29
QUANTITATIVE ANALYSIS OF THE FIRST PREDICTIONS: BETTER, WORSE OR EQUAL REVISIONS? ...29
2.1 Literature Review and hypotheses development ... 29
2.2 Sample and data description ... 37
2.3 Methodology: A descriptive approach to the analysis of forecasting revisions ... 39
2.4 Results and comment ... 41
Appendix A. 1 - Number of worse forecasts issued by each predictor in the horizon considered... 50
Appendix A. 2 - List of banks used in the dataset ... 52
CHAPTER III ...55
DO PREDICTORS BEHAVE EFFICIENTLY? ANALYSIS OF THE HISTORICAL SERIES ..55
3.2 Methodology ... 65
3.3 Main results ... 68
3.4 Conclusion ... 76
Appendix A. 3 - Hurst coefficient value calculated for each predictor ... 78
Appendix A. 4 – Difference in Hurst average forecast value and efficient value ... 81
CHAPTER IV...84
IS THERE A LEADER WHO DOMINATES THE EXCHANGE RATE MARKET?...84
4.1 Hypotheses development and motivation analysis ... 84
4.2 Literature Review ... 86
4.3 Application Methodology ... 95
4.3 Results and Comments ... 100
4.5 Conclusion ... 110
Appendix A. 5 - Granger causality Wald tests ... 112
Appendix A. 6 - The top 50 of the 147 “super-connected” companies ... 119
CONCLUSION AND COMMENTS ... 120
REFERENCES ... 123
LIST OF TABLES
Table page
Table 1 - Initial situation ... 42
Table 2 - Forecast Error Class ... 43
Table 3 - Evidence of worsening revisions ... 45
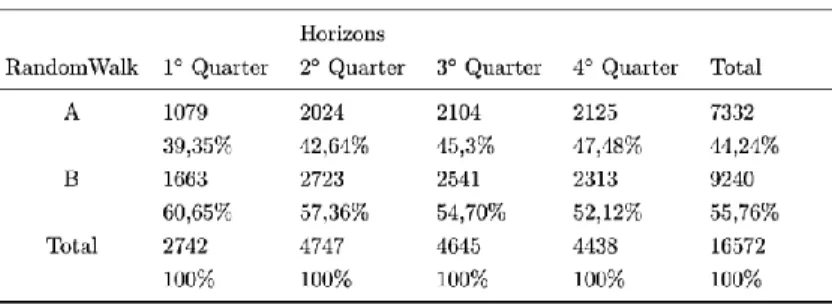
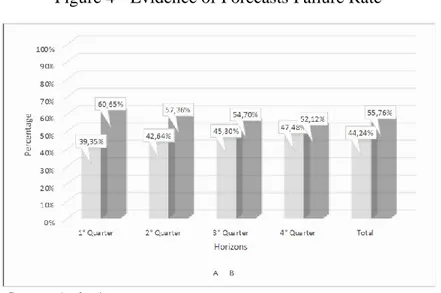
Table 4 - Forecast Failure Rate ... 47
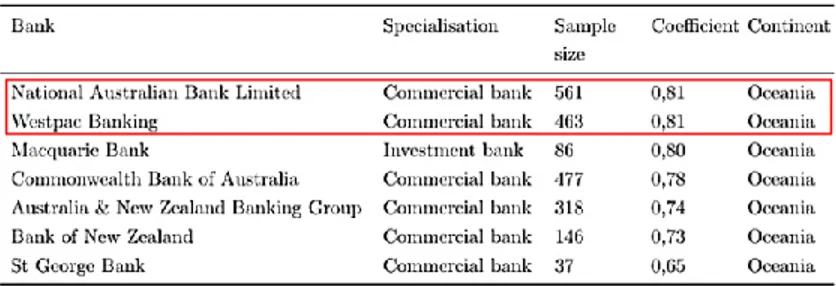
Table 5 - Coefficient of Hurst Banks Oceania ... 68
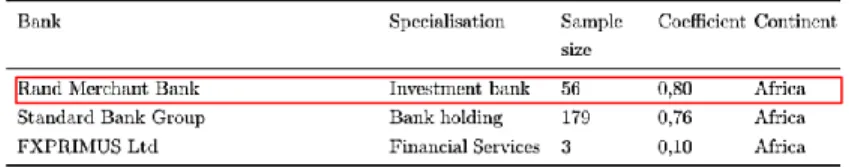
Table 6 - Coefficient of Hurst Banks Africa ... 69
Table 7 - Coefficient of Hurst Banks Asia ... 70
Table 8 - Coefficient Hurst Banks America ... 71
Table 9 - Coefficient of Hurst Banks Europe ... 72
Table 10 - Percentage of efficiency or inefficiency ... 74
Table 11 - Difference Hurst Efficient coefficient by continent ... 75
Table 12 - The World's 10 largest banks by total assets (2007)... 101
Table 13 - Wald test “Top 5” banks by assets vs “The others” ... 101
Table 14 - Wald test "Top 10" banks by assets vs “The others” ... 103
Table 15 - Wald test between Top 5 assets banks (2007) ... 104
Table 16 - The World's 20 largest banks by total equity (2007) ... 105
Table 17 - Wald test “Top 5” banks by equity vs “The others” ... 106
Table 18 - Wald test "Top 10" banks by equity vs “The others” ... 107
Table 19 - Wald test between Top 5 equity banks (2007) ... 108
LIST OF FIGURES
Figure page
Figure 1 - Overconfidence increases over time ... 24
Figure 2 - Value function ... 26
Figure 3 - Evidence of worse revision ... 46
LIST OF APPENDICES
Appendix page
Appendix A. 1 - Number of worse forecasts issued by each predictor in the horizon
considered ... 50
Appendix A. 2 - List of banks used in the dataset ... 52
Appendix A. 3 - Hurst coefficient value calculated for each predictor... 78
Appendix A. 4 – Difference in Hurst average forecast value and efficient value... 81
Appendix A. 5 - Granger causality Wald tests ... 112
ABSTRACT OF DISSERTATION PRESENTED TO THE GRADUATE SCHOOL OF THE UNIVERSITY OF MACERATA OF THE REQUIREMENTS FOR THE
PhD DEGREE IN QUANTITATIVE METHODS FOR ECONOMIC POLICY
THE ROLE OF INFORMATION EFFICIENCY IN EXCHANGE RATE FORECASTS: EVIDENCE FROM SURVEY DATA
By Gianluca Valeri
2020
Forecasting is a natural attitude of men and women: forecasts are made because to make certain decisions today, we need to know how the world will be tomorrow, and therefore how the future state of the world will influence the result of those choices. In finance, the term "forecast" refers to the expectations of individuals on the future trend of the variables studied, based on information or intuition, starting from the assumption that individuals have a good knowledge of the system in which they operate and political economy.
This dissertation is divided into four chapters.
In the first chapter there is an account of the existing literature that shows the principles of behavioural finance as a solution and development to the limits of the classical theory of which Fama was one of the major exponents, underlining the role that psychological
paradigms have, in the process that leads to the formulation of choices in the economic and financial field. This new conception discredited in the beginning made it possible to make up for the theoretical and empirical shortcomings that affirmed that individuals were always rational, demonstrating on the contrary that it is irrationality that dominates choices.
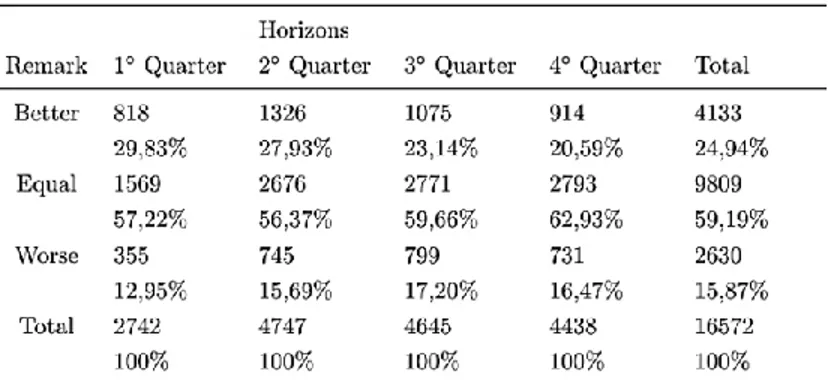
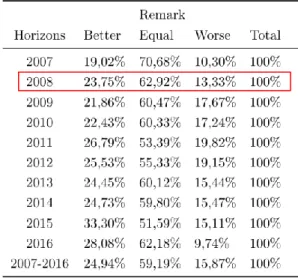
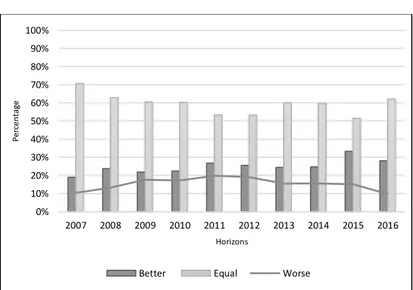
In the second chapter of this dissertation we analyse the role of revisions of the first forecasts or other revisions already issued, to determine in percentage terms whether the revisions are better, worse or equal. This allows us to determine the degree of efficiency of the predictors, whose investment choices, known in literature, are influenced in the short term due to market volatility, and in the long term by the difficulty of absorbing new information in a complete and timely way, using them to our advantage. It follows that the predictors analysed in the Bloomberg dataset available, which contains the historical series relating to the forecasts and revisions in euro-dollar currency, of 120 financial institutions, in the horizon from the first quarter of 2007 to the second quarter of 2016, show that in 15.87% of cases the revisions issued are not efficient, since the forecasts previously issued worsen.
This shows that predictors are not always able to improve their forecasts even if they get new information in the time path that leads to the terminal date for which the forecast was issued. Furthermore, to demonstrate that the predictors' forecasts are not efficient, we compared whether the number of cases in which the average quarterly forecast error generated by the 120 financial institutions is greater, in terms of absolute value, than a forecast based on a random walk model. The results, in accordance with pre-existing literature, showed that the percentage of cases in which the forecast errors generated by the difference between the
predictors' forecasts for each period and the spot rate is higher than the forecast errors generated by the difference between the rate spot and the real value of the exchange rate generated at the end of each period. This shows that, in each horizon considered, the random walk model is more efficient than the forecasts provided by a professional predictor.
In the third chapter, we wanted to check and confirm whether the forecasts and revisions issued by each financial institution as a whole were efficient, or if, on the contrary, they had demonstrated that they had a long term memory of their past forecasts, which means that the choices and forecasts issued in the past by financial institutions influence future choices and forecasts. To do this we used the Hurst statistical test, developed in the early twentieth century, through which it was analysed that the average of the forecasts and revisions, for each predictor, in the horizon from the first quarter of 2007 to the second quarter of 2016, were for the 99.17% of cases not efficient, showing that the Hurst index value is different from the threshold of 0.5. Specifically, we find that 91.67% of predictors show that their past has an influence on their future. This allows us to say that predictors who have proved inefficient in the past will tend to be inefficient in the future as well.
Finally, in the fourth chapter of this dissertation we wanted to show if among the 120 financial institutions analysed there was a cause and effect phenomenon that allowed to demonstrate that the forecasts of one or more predictors systematically precede those of all, demonstrating the presence of a leader of the exchange rate market in euro-dollar currency. To analyse the historical series available, we have chosen to use the Granger causality test developed by Toda and Yamamoto in 1995. The results have shown that there is a cause and
effect phenomenon among the Top 5 World Banks for assets and equity, according to the ranking updated in 2007, the year the analysis started. Furthermore, we find that the banks that in our analysis take on the role of market leaders, are the same that were fined by the European Antitrust Authority in 2019 for creating a real exchange rate cartel, in 11 types of different currencies, including the euro-dollar one. Furthermore, the existence of Granger causality among the banks that are inefficient according to the Hurst index and that have long term memory, allow us to say that among the financial institutions analysed there is a further trend to follow the so-called "Flock effect", which pushes people to standardize choices and forecasts, as the judgment of others is important and influences our rationality.
INTRODUCTION
Prediction is a natural attitude of men and women: we make predictions because to make certain decisions today, we need to know how our world will be tomorrow, and therefore how the future state of the world will influence the outcome of our choices. In finance, the word "prediction" refers to the expectations of individuals on the future trend of the variables studied, based on information or intuition, starting from the assumption that individuals have a good knowledge of the system in which they operate and of economic policy models.
Eugene Fama in the 1970s said that markets are efficient if the prices of traded securities reflect exactly their fundamental value, corresponding to the discounted sum of expected future cash flows. This theory takes into account the mere presence of rational investors, who evaluate their investments rationally, that is, they direct their choices towards those options that have higher expected returns, with the aim of maximizing their wealth. Likewise, even in the case of irrational investors, their exchanges, considered to be random, do not affect the price level, since the market tends to cancel them. Therefore, according to the theory of efficient markets, neither technical analysis nor fundamental analysis can allow an investor to generate a greater profit through arbitrage transactions, since the demand will always tend to match the offer and the price of the securities will incorporate correctly and promptly all the information available (perfect arbitration transactions)1.
In reality, changes in the price of securities are not due solely to a change in the fundamental
1. 3 value. The continuous alternation of euphoric phases and depressive phases that characterize the financial markets, have attracted the attention of a growing number of scholars who have begun to doubt the traditional theory of expected utility proposed by von Neuman and Morgenstern in 1947, according to which people with the same expected value, do not have choice preferences. In fact, contrary to what was previously believed, investors demonstrate different attitudes depending on whether the options to choose from generate a chance of gain or a risk of loss.
The psychologists Kahnemann and Tversky have developed a new concept of utility function that takes into account the aspect related to losses. The prospect theory was based on the personal propensity of each individual to bear a certain risk in the face of a given gain, since each individual has an aversion to different losses, which may depend on the status quo, the psychological state (happy or sad), or even just from an imaginary reference point, a sort of fixed point beyond which we are not willing to go, known in literature as the anchor bias2.
Kahnemann and Tversky introduce purely psychological and social aspects in the evaluation of economic and financial factors, demonstrating that investors, in an attempt to maximize their expected usefulness, base their choices on a series of psychological paradigms, known as heuristics, which allow to simplify the decision-making process behind every investment choice. These "shortcuts of thought" are therefore very useful, but at the same time they are very dangerous, because they can generate cognitive errors or errors of judgment, because they push investors to make decisions about the outcome of future events on the basis of
1. 4 known models of the past, believing that what happened before will be repeated in the future.
Hirshleifer D. et al. (2019), through psychological tests, have shown that the accuracy of the predictions decreases over the course of the day as the number of predictions that the analyst has already issued increases. This phenomenon known as decision fatigue shows that the more predictions an analyst makes, the greater the likelihood that the analyst will resort to heuristic-based decisions, which simplify the decision-making process.
The implementation of these mechanisms derives from the fact that investors make investment decisions in a context of uncertainty. Heuristics allows you to limit this uncertainty, but not to make the best choice. In literature, there are many studies of psychology that demonstrate the existence of prejudices that systematically influence our choices. Moreover, it has also been demonstrated the existence of a so-called "fashion" effect that is created among investors, who push to reduce the negative effects generated by a possible loss, if such a mistake in the choice has been reached by a plurality of individuals. That is, if everyone makes the wrong predictions, it means that it is an extraordinary event that no one could have foreseen or stopped. It follows that if the investment generates positive effects, investors will tend to unfairly increase their predictive skills (excess security), or vice versa, they will blame it on bad luck.
To demonstrate the existence of these irrational trends that dominate the process that leads to the formation of any expectation, in the economic and non-economic spheres, we have concentrated our analysis on the forecasts and revisions issued by 120 financial institutions on
the exchange rate market, in the horizon from the first quarter of 2007 to the second quarter of 2016. The time series analysed, coming from a dataset extracted from the Bloomberg platform, have allowed us to demonstrate that the forecasts and revisions issued by the predictors are not always efficient. This implies that expectations are not always in line with classical theory, which is based on the concept of rationality, but on the contrary, shows that to understand its evolutionary process it is necessary to rely on the key concepts of behavioral finance, which violate the principles of expected utility.
We have shown that the historical series of the financial companies analysed, in addition to not being efficient, are characterized by "long term memory", showing that the past influences the future. This allows us to say that if the forecasts in the past were not efficient, they will not be efficient in the future and vice versa. In addition, we have also shown that the forecasts of exchange rates in euro-dollar currency are characterized by the presence of leaders who dominate the market, which allows us to affirm that the predictors are not independent, confirming and validating some interesting theories that confirm the existence of superior links between the main world banks, by volume of assets and equity.
The work is divided into four chapters.
In the first chapter of this dissertation we analysed the concept of market efficiency, showing the different classifications and the conditions necessary and sufficient for its occurrence. The efficiency is divided into three stages: weak efficiency, semi-strong and strong efficiency. In addition, we have reported an analysis of the literature that shows the
multiple applications and studies that have used the concept of efficiency as a metric for their analyses, through the use of different macroeconomic variables. This first chapter also allowed us to establish the meaning of our analysis, which aims to demonstrate how the financial market is generally not efficient, due to the irrationality that characterizes the majority of individuals who approach financial markets, are they are professional or non-professional. Furthermore, the growing complexity of the markets allows us to confirm once again how individuals, both in making economic-financial and non-economic decisions, base their beliefs on a plurality of psychological paradigms that allow us to lighten and speed up the decision-making process that rotates behind every choice, violating the theory of expected utility, at the basis of classical theory3.
In the second chapter of this dissertation, the dataset relating to the forecasts of exchange rates in euro-dollar currency, from 2007 to the second quarter of 2016, was analysed, with the aim of demonstrating that the revisions of the initial forecasts are not always efficient. This is because, as stated by pre-existing literature, predictors are unable to absorb new information in a complete and timely manner in the path that leads to the terminal date for which the forecast is issued. The analysis, conducted on the revisions issued by each predictor, with reference to the forecasts previously issued, has shown that both in the short term due to market volatility and in the long term due to the inability to absorb new information, there is a percentage of worsening forecasts which show that individuals are not always rational.
The model developed in our document considers forecasting errors as parameters for
assessing investors' predictive ability. The forecast error was calculated as the difference between the forecast or revision and the spot reference rate for each period. This comparison allows you to measure whether the forecast error increases, decreases or remains unchanged over time in order to evaluate the efficiency of the predictors.
This function, constantly accentuated by uncertainty, causes an increase in forecast errors. It follows that, in theory, exchange rates are easier to predict in a long-term perspective, due to their tendency to return to their fundamental average value.
The results obtained showed that the revisions do not systematically improve the forecasts previously issued for the same terminal date, showing how individuals do not always make efficient choices. This means that predictors fail to learn from their mistakes and therefore fail to incorporate new efficient information. It was also shown that predictors would perform better, i.e. a prediction error in a lower absolute value, using the random walk model or by issuing a prediction equal to the spot frequency known at the time of the prediction.
In the third chapter, the Hurst statistical test was used to confirm that the forecasts and the revisions, as we saw in the first chapter, are not always efficient due to the difficulty of incorporating the new information in a complete and timely manner, in the path which leads to the terminal date, for which the forecast itself is issued.
This statistical coefficient, that moves within a range from 0 to 1, has been used as a metric to measure if the prediction time series, issued by each predictor of the Bloomberg dataset you
have, are efficient. For this purpose, it is necessary that the test value for each analysed variable has a value of H = 0.5. The results of the application of the test reported in the table in Appendix A.3 have shown the existence of one predictor that has a value of H = 0.5, but, due to the limited sample size, this result is unreliable. Therefore, it can be said that the test results show that the forecasts of the intermediaries analysed in the long run, in line with the existing literature, are not efficient. Furthermore, using the idea used by Sukpitak et al. (2016), it was decided to measure the average deviation of the forecasts issued by the individual banks with respect to the efficiency value of the known Hurst index. Secondly, the same operation was also carried out for the average forecasts issued by the banks grouped by continent. The calculated difference will allow us to identify first which single bank and then which continent, have average forecasts closer to the efficiency threshold.
In addition, we also used the test to measure whether or not the variables analysed were characterized by "long term memory", a feature that allows us to understand whether the forecasts made in the past influence future forecasts. Therefore, if the value of H> 0.5, the series has the characteristic of "long term memory". On the contrary, if H <0.5, the past has a marginal influence on future forecasts. The idea is that every single prediction carries within itself a long memory of all the events that preceded it. Recent events have a greater impact than distant events, but the latter still have a residual influence. So, what happens today affects the future. Where we are today is the result of where we were yesterday. Time is important. The results obtained by applying the test with this second objective have shown with sufficient evidence (see table in Appendix A.3), that past forecasts influence future
forecasts. What happened yesterday is important to understand what will happen tomorrow, but it does not allow predictors to reduce their forecast errors, and therefore to be efficient.
Finally, the aim of the fourth and final chapter of this dissertation was to demonstrate whether Granger causality exists among the financial institutions of the Bloomberg dataset available. To do this, we used the statistical test of Toda and Yamamoto (1995), which allows us to understand if there is a cause and effect relationship between the predictors. That is, in other words, we want to demonstrate whether, the behaviour of one or more variables influences that of all the others. This would allow us to understand if there are one or more leaders of the euro-dollar exchange rate market, whose forecasts "systematically" precede those of all the others.
This idea was created thanks to the results achieved in the third chapter of this dissertation, which prompted us to ask ourselves if the predictors, in issuing their forecasts, are autonomous or follow a different model. The reason for this question derives from the fact that the forecasts available from the Bloomberg dataset banks are 99.17% inefficient. This result led us to wonder if there is a link between the inefficient predictions of all the predictors analysed. It would be interesting to be able to confirm the results achieved by a group of researchers from the Federal Institute of Technology in Zurich, Switzerland, who, analysing the transnational relationships between 43,030 multinational companies, have shown that there are 147 companies, mainly banks, called "superentities", which collectively hold 40% of the total wealth of the entire network of transnational exchanges (see table Appendix A. 5).
Furthermore, it would be even more interesting to be able to confirm the existence of a link between the banks that have been fined by the European Antitrust Authority for having created a real cartel on exchange rates in euro-dollar currency and not only. The ensemble of these motivations therefore prompted us to undertake this analysis, which with great satisfaction proved to be positive, showing that there are banks that act as market leaders and that systematically precede the forecasts of all the other predictors. Furthermore, the most important result was to find that the banks that act as leaders are the same ones that were sanctioned by the European Antitrust Authority in 2019.
Therefore, the tendency to formulate inefficient forecasts is not only a direct consequence of the inability of individual predictors to absorb new information, or of the heuristics that influence the outcome of our choices, accentuating their prediction error, but rather there is a phenomenon of cause and effect that pushes predictors to uniform behaviour, aimed at following one or more market leaders.
CHAPTER I
The efficiency market hypothesis.
The term efficiency is used to describe a market in which all available information is integrated into the price of financial assets traded in a rational and timely manner (EMH). This assumes that it is impossible for investors to achieve higher returns without having to bear equally high risks. According to Fama (1970) there are three conditions for an efficient market:
• operational efficiency, which concerns the organizations and procedures through which the market operates, which must be able to run smoothly, without obstacles of any kind, such as transaction costs;
• allocative efficiency occurs when all individuals act rationally pursuing the maximization of their utility;
• information efficiency occurs if prices reflect the available information promptly and correctly, and nobody is able to obtain returns above the market.
These conditions of market efficiency according to Fama (1970) show that information plays a key role in determining the price level. These conditions are sufficient and unnecessary to have an efficient market, since it is possible to have high brokerage costs which are not accessible to everyone, but which reflect all the information available. Similarly, if the information is not freely accessible to all market players or if it has a different interpretation, this does not mean that the market must be inefficient. These imperfections are only potential sources of inefficiency and can be found, at various levels, in real markets.
To understand the concept of efficiency of the financial markets it is necessary to carry out a triple classification, which differs according to the degree of intensity with which the new information is incorporated in the prices. So, in detail we can talk about efficiency in weak form, in semi-strong form and in strong form. The three levels of efficiency are classified in Fama (1991) based on the information used in defining them.:
• A market is characterized by weak efficiency when the prices that are formed gradually incorporate all information relating to past prices, making it impossible to create extra profits. Furthermore, prices are said to follow a random pattern over time, which means that prices are not temporally related;
• The second definition of efficiency with which the market can be invested is semi-strong efficiency. This definition enriches the concept of efficiency explained above, stating that prices promptly and completely reflect all past information and all public information. This means that arbitrage operations cannot be carried out on the basis of this information, unless there are subjects able to position themselves at a privileged level compared to other investors in the same market, since they are aware of privileged information, which can create information asymmetries;
• Finally, the third definition of efficiency refers to those markets where the prices of the securities traded reflect all past information, all public information and, moreover, all inside and / or private information. Pursuant to art. 181 of the TUF, this type of information significantly affects the prices of financial instruments, to the point of considering them as information that a reasonable investor would presumably use as
one of the elements on which to base his investment decisions. Theoretically, a strong market could give the illusion that the prices of the securities traded in it are always correct. In reality, this seems to be as little as possible and the definition must be interpreted flexibly, allowing for time intervals, which technically allow for price adjustments. Furthermore, the expression "correctly" must be interpreted as meaning "not systematically distorted".
This classification leads us to make some reflections. In the event of poor market efficiency, professional investors who are able to exploit public information or who have private and / or privileged information can make an additional profit. In the case of markets characterized by semi-strong efficiency, only insiders can use privileged information to generate operations that generate an extra return. Finally, in the case of a market with strong efficiency, no market operator, qualified or unqualified, is able to generate a greater profit than others. It follows that in cascade, efficiency in the strong form implies the semi-strong form and in turn the weak form, and the semi-strong implies the weak.
In an environment where asset prices reflect all the information available, it becomes impossible to beat the market: some investors cannot get higher returns than others, since they all have the same information. Prices promptly and completely reflect all the information available to market participants. It follows that prices are correctly integrated into an efficient market. The price at which the securities are traded is the correct price. There are no overvalued or undervalued securities and arbitrage operations are not feasible. Investors can only aspire to replicate market profitability - based on passive management - or, at best, to
achieve greater profitability, sporadically and always in the short term, thanks to luck or because they have been able to take advantage of some occasional inefficiencies before the market took them into consideration.
According to Andrei Schleifer (2000)4, three conditions are at the basis of the Efficient
Market Theory:
• rationality: the investments required to make rational investment decisions, evaluating the securities of the market on the basis of their fundamental value;
• independent deviations of rationality: even in the presence of non-rational agents, market efficiency can be achieved, because rational individuals are assumed to counterbalance irrational individuals;
• arbitrage: profit is generated through the simultaneous purchase and sale of different, mutually substitute shares. The arbitrageurs, in fact, buy an advantage because the price is lower and resell it where it is higher, trying to get a profit in the difference between these two.
According to M. Friedman (1953) and then E. Fama (1970), the presence of irrationality among economic agents does not mean that the market is also inefficient. The authors argue that rational investors (also called smart money) are able to restore the balance of the market, cancelling the choices of irrational agents. Therefore, from a theoretical point of view, the random transactions of irrational agents deviate the price of the securities from its
fundamental value causing information inefficiency: the price is no longer able to fully reflect the information associated with the title. The presence of rational investors makes it possible to eliminate this inefficiency by promptly restoring the efficiency of price information. Each transaction (purchase) made by an irrational individual corresponds to another (sale) of a rational individual and vice versa, which leads to keeping prices and the market unchanged.
Looking closely at the evolution of the markets, it emerges that the theoretical lines underlying the theory of the “efficient markets” are not always respected, as the markets are not always efficient and easy to predict, but on the contrary they present risks, for market operators, professionals or less, which lead to incorrect predictions. There is a strong tendency to make mistakes in an attempt to accurately predict the price at which the securities will be traded. The causes can be manifold, such as the difficulty of incorporating new information in a correct and timely manner, the impossibility for all operators to have the same information or the mathematical principles deriving from quantum physics. The mere fact that the market determines the price of a company, in the form of an offer, also changes its intrinsic value, directly influencing the company's competitive environment. These characteristics make the financial markets unstable and inefficient.
In literature there are numerous studies that have tried to test the efficient market hypothesis (EMH) of Fama (1965; 1970), using various methods and contexts. These reports examined not only whether asset prices reflect all relevant historical information, but also whether the arrival of new information is immediately and fully incorporated into the prices of the securities.
Among these we can mention the results of the autocorrelation tests conducted by Samuels and Yacout (1981), who by testing the efficiency in the weak form of twenty-one securities listed on the Nigerian stock exchange from 1978 to 1979, have shown that there is no random behaviour of the share price and that the Nigerian stock market is weak form efficient.
On the contrary, however, Fawson, Glovher, Fang and Chang (1996) conducted unit root tests on the securities of the Taiwanese stock exchange from 1967 to 1993, demonstrating the existence of poor efficiency of the weak form. Similarly, the results of the analysis carried out by Moustafa (2004) on the securities of the United Arab Emirates from 2001 to 2003, which showed the absence of a normal distribution, also followed. Similar results also for El-Erian and Kumar (1995), who carried out serial correlation tests on the equity markets of Turkey and Jordan showed the absence of poor efficiency of the weak form.
Another study by Barnes (1986) conducted on the Kuala Lumpur stock exchange revealed the absence of the efficiency of the weak form. However, the research conducted on the Shanghai and Shenzhener exchanges, by Darrat and Zhong (2000), applying the variance ratio test and the model comparison method, showed that there is no efficiency in weak form.
Another study conducted by Cooray and Wickermaisgle (2005) on the exchanges of South Asian securities of Bangladesh, India, Pakistan, applying the unit root test and the Elliot-Rothenber-Stock (ERS) test, showed that the Bangladesh stock market is not performing weakly. Similar studies have also been carried out by Mobarek and Keavin (2000), on the
Dhaka stock exchange, from 1988 to 1997 and through the use of parametric and nonparametric tests have demonstrated autocorrelation to different delays that reject the existence of a weak efficiency form.
A further study was carried out by Abraham, Seyyed and Al-sakran (2002) on the securities of Kuwait, Saudi Arabia and Bahrain, which rejected the hypothesis of random walk. A similar study was carried out by Magnusson and Wydick (2002) on the stock exchange of Nigeria, Ghana and Zimbabwe demonstrating significant correlations indicating the absence of efficiency of the weak form.
Another study to test efficiency in weak form was conducted on the Bombayay Stock Exchange and on the National Stock Exchange of India, by Basu dan Gupta (2007), who, taking daily data from 1991 and 2006, applied tests of unitary roots called ADF, PP and KPSS, which have shown how the national stock exchange and the Bombay stock exchange are not efficient in terms of weak form. Similar studies have also been conducted by Awad and Dartigma (2009), which through the Augmented Dickey fuller Test, Phillips-Perron test, unit root test, serial corrections and execution tests, found the absence of weak efficiency form on the stock exchange prices of Palestine. Furthermore, Hoss-ain and Uddin (2011), through autocorrelation tests, the increased Dickey Fuller test, Phillips Perron test, ARIMA models and GARCH models, have also tested the efficiency in weak form on the Dhaka stock market indices, finding absence of efficiency in weak form. Finally, Siddik and Azam (2011), Ali (2012), Alom and Raquib (2014) also demonstrated the lack of efficiency in weak form on the values of the Bangladesh stock exchange.
Other studies such as those of Givoly and Lakonishok (1980), Stickel (1991), Engels et al. (2001), Gleason and Lee (2003) and Zhang (2006a, 2006b), have shown that if a market is efficient, the price of securities must reflect all available information in a complete and timely manner, and investors can actively trade on the basis of this hypothesis, aware that prices should respond immediately to the analysts' forecasts and there should be no possibility of generating an extra profit after the revisions of the forecasts have been made public. But this trend, as widely demonstrated, occurs rarely.
In fact, the new information is not perfectly reflected in the share price. This can be caused by irrational behaviour, such as insufficient reaction (Chan et al. 1996), investor's propensity to conservatism (Barberis et al. 1998), explanation of risk adjustment (Conrad and Kaul 1998) or explanations from the market environment, such as short selling constraints (Diether, Malloy and Scherbina 2002). Furthermore, as Kang et al (2016) say, investors' reactions to the revision of analysts' forecasts also differ according to the investment horizon, since there may be short-term investors who have a keen interest in the information involved in the revisions of analysts' forecasts, and investors with long-term horizons who are neutral towards such information. Therefore, if the markets appear to be inefficient, the economic agents who have more information will be able to earn compared to the less informed. It should also be said that if the mechanism by which the price is determined, in a market, is inefficient, the price of the securities will not reflect its fundamental value, generating estimation problems with reference to economic analysis.
Another aspect that must be taken into account, when investigating the efficiency of the financial market, are the expenses that must be incurred to investigate the precise moment in which the news stops, which can be known to everyone, or only to some of the economic agents involved. Finally, it must be taken into account that the efficiency tests that are carried out on the financial markets can be influenced by loss of information and asymmetries.
The existence of these discrepancies between the market described by Fama (1970) and the real performance of the financial markets, lead the academics of the time to question the accuracy of the theoretical principles underlying the efficient market hypothesis, laying the foundations for the development of a new branch of finance, called behavioural finance. This new theory presents itself as an interdisciplinary study, capable of integrating psychology and sociology in the study of the behaviour of economic agents, going against the paradigm of the absolute rationality of the EMH.
The pioneering studies of the psychologist Slovic P. (1962-1972), represent the starting point of numerous subsequent researches, which began to analyse the wrong perception of risk by subjects. Through this vision, it was demonstrated that the decision-making process that leads to the maximization of utility, for each individual, is not rational. Investors, in an attempt to maximize their profits, are emotionally influenced by a series of psychological paradigms, known as "heuristics", which push them to violate Bayes' law and other principles of probability theory in making predictions in uncertain situations5.
5 Bayes' formula essentially asserts that the conditional probability of an event A, given B, also called posterior probability of A, is proportional to the likelihood of B, if A were known, for the a priori probability of A; in
According to Kahneman and Tversky (1974), these shortcuts of thought, on the one hand, simplify the resolution of a problem, but on the other they expose the individual to errors, known as cognitive biases. In psychology they indicate a tendency to create one's own subjective reality, not necessarily corresponding to the evidence developed on the basis of the interpretation of the information in possession, even if they aren't logically connected to each other. This therefore leads to an error of assessment, caused by lack of objectivity of judgment.
Kahneman e Tversky (1974), Slovic (1971)6 argue that the assessment of the probability with
which a given event occurs is a complex activity, which is transformed into a simple operation through the mental process of each individual, creating connections with past events, stored in memory. However, this ability to store memories has a limited duration, which tends to generate errors. Therefore, assuming that any decision problem can be broken down into three steps: gathering information, processing and issuing the forecast, we report the main heuristics, which characterize the process of forming a final choice, in the economic-financial area:
• Availability heuristics: estimates the probability of an event based on the information "available" in the memory, on the basis of direct or indirect experience, and on the emotional impact that the memory generates. The problem with this shortcut of thought, as well as the others, is that they tend to be misleading. Availability heuristics is a cognitive strategy that individuals use to give a satisfactory estimate to an event, in the shortest possible time and with
minimal effort. A typical example is that of a plane crash, which due to the strong emotional impact generates stronger memories in the minds of individuals, compared to statistics on the number of road accidents in a given period of time. The availability of this information in memory pushes individuals to estimate misleading probability, which generates a distortion in the cognitive process, leading to believe that the percentage of deaths in a plane crash is higher than that of other means of transport. However, this judgment is objectively incorrect, as shown by the real estimates of the two phenomena;
• Representative heuristics: this occurs when individuals, in an attempt to speed up and simplify the analysis of a problem, estimate the probability of an event based on family situations and stereotypes, associating the event with past or preconceived experiences. Regardless of the frequency and number of examples, the evaluation of the probability of the event depends on how similar it is to a certain class of events. A typical example is that of a person's description: “Paul is very shy and introverted, with little interest in people and in the real world. He has a sweet soul and has a passion for detail." After this description, the individuals are asked to evaluate the probability that Paul is a worker, a professor, or a librarian, or if the probability is the same in the three cases? Individuals will tend to indicate that its characteristics refer to the stereotype of the librarian, basing the judgment on similarity, representing the problem subjectively. Clearly, with this excessive simplification, numerous errors of assessment are made, because objective factors such as, for example, the employment rates in the professions listed should be
analysed. In fact, Paul is more likely to be a worker, since workers are much more numerous than librarians;
• Anchoring and adjustment heuristics: this occurs when individuals draw up an estimate or forecast judgment based on an initial value or starting point and reach the final answer by improving the forecast through "adjustments". “The starting point can be suggested by the formulation of the problem, or it can be the result of a partial calculation. In both cases, the adjustments are "insufficient", as the initial value acts as an anchor and slows down subsequent adjustments. Anchoring heuristics was first theorized by Amos Tversky and Daniel Kahneman, but there are many examples of experiments in literature. One of the most famous is that of a group of people who were to estimate in percentage how many of the states that are part of the United Nations are African. To some, with a kind of wheel of fortune rigged, the number 10 was shown, and to others the number 65. The percentage estimated by those who saw the number 10 (on average 25%) was always lower than that estimated by those who saw the 65 (on average 45%);
Another example used to explain the anchor heuristic is that proposed by Wilson et al. (1995): “Participants were asked to estimate the number of students who will get cancer over the next 40 years. Previously, half of the participants had been asked to copy numbers in words close to 4500 and the other half had been asked to write numbers in figures close to 4500. Those who had copied numbers in figures predicted an average of 3145 cases, while those who had copied numbers into words predicted an average of 1645 cases;
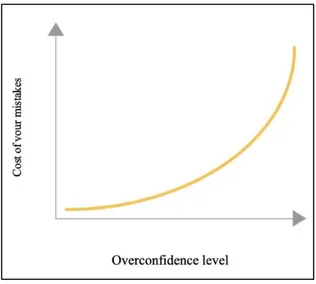
• Overconfidence: represents an excess of security in one's judgment and skills. Individuals believe they can take advantage of all the information they know of, overestimating that information. This leads individuals not to accept that they are wrong, but on the contrary, pushes them towards the search for information and motivations that justify their wrong choices. This type of error alters the knowledge related to one's own abilities, causing in the subject itself a sort of overestimation of himself. In addition, overconfidence has been shown to occur more in men than in women and at a young age, while it tends to decrease with the passage of time, as individuals with the acquisition of more experience develop a more objective evaluation process of one's abilities. Therefore, it is not a question of being more or less intelligent than others, but only of a greater conviction that is extreme and makes us think we are the best. This belief pushes individuals, faced with a significant loss, to motivate the error as the consequence of external causes or bad luck. Vice versa, in front of a profit, they take all the credit, increasing confidence in their own abilities. Odean (1998) developed a theoretical model in which he demonstrated that, in contrast to what classical theory claims, the expected utility decreases, showing that being too informed can be dangerous;
Figure 1 - Overconfidence increases over time
Source: Author's own
• Under-confidence: occurs when investors have an excess of distrust in their forecasts and tend to underestimate their skills. This phenomenon tends to occur in situations where the choice to be made is very complicated and uncertain. Investors carry out conservative attitudes and show an overly slow adjustment of the forecasts when new information arrives. In order to better understand the meaning of this heuristic, it should be specified that the phenomena of overconfidence and under-confidence are not correlated with the terms of optimism and pessimism, in fact, the excess or lack of trust in one's choices does not necessarily imply the optimism or pessimism about the market outlook;
• Overreaction: occurs when individuals show an excessive and overly optimistic reaction to the availability of new information regarding certain securities on the market. Consequently, investors will be excessively influenced by random events, generating a variation in the prices of the securities of the period following the
publication of the new information, which will no longer reflect the fundamental value of the securities. According to De Bondt and Thaler (1985), the irrational investor has an excess of optimism in the initial period, which is followed by a turnaround in the long term which brings the price of the security back to its correct value. This behaviour of investors is in contrast with the hypothesis of efficiency of the financial markets, and can be caused by the representativeness mechanism that intervenes in the decision-making process of the individual or by the subject's overconfidence, and is favoured by imitative behaviour;
• Underreaction: occurs when the arrival of new information on specific security is only partially transferred to purchases / sales, generating an under-reaction of the investors. The prices of the securities, after the release of new information, will tend to move slowly compared to the ordinary. This phenomenon has a shorter time horizon than overreaction, even if in the long run the prices of the securities will tend to return in parity with their fundamental value. According to Edwards (1968), the sub-reaction is due to conservative behaviour, which involves a slow updating of expectations in the face of the arrival of new information.
Kahneman and Tversky (1979) through the publication of the "Prospect Theory" defined it as a rational theory, capable of explaining irrational behaviour, due to the profound change, that has led the way of studying decision making. It shows that individuals behave irrationally every time they are called to maximize their expected utility, as they assign a different value to a loss or a potential gain, because they will tend to have a different attitude towards the
associated risk.
Figure 2 - Value function
Source: Kahnemann D., and Tversky A. 1979.
The concept of "value function", similar to the definition of "utility function", but with the addition of the part relating to losses (see Figure 2), shows a concave curve in the gain area and a convex curve in the area of losses. This means that people will show a marginal sensitivity to gains and losses, which will decrease as they move away from the reference point, which can be represented by the current position or status quo. People will experience greater pleasure for a $ 20 wage increase when wages rise from $ 20 to $ 40, than when wages rise from $ 1020 to $ 10407.
Therefore, contrary to the theory of expected utility, according to which an individual placed in front of two "lotteries" with equal expected value is indifferent between choosing one lottery or the other, they found a different type of choice in individuals depending on whether
the two options with the same expected value had as their object a possibility of gain or a risk of loss. To better understand this concept, we give an example. To demonstrate that individuals are risk averse we report these two situations. The first offers the possibility to choose between two alternative options with the same expected value, one of which with certainty of gain, the other random but with the possibility of greater gain:
• equal chance of winning € 500 or nothing. Current value = 500 * 50% + 0 * 50% = € 250;
• definitely win € 250.
Usually individuals choose the second option, showing a risk aversion attitude. In the second situation, the individual has the possibility to choose between two options, always with the same expected value, but one with safe loss, the other random with greater risk of loss, two options:
• equal probability of losing € 500 or nothing. Current value = -500 * 50% + 0 * 50% = -250 €;
• definitely lose € 250.
In this case, contrary to the previous situation, the individual tends to choose the first option. Herbert Simon (1978), in his theory of "Limited Rationality", argues that individuals are not always rational and for this reason they are not able to maximize their expected usefulness, even if they have the necessary knowledge and information. This shows what Kahneman and Tversky (1979) said, who said that in a loss situation the individual's attitude will be
risk-taking8.
Richard Thaler, winner of the Nobel Prize for Economics in 2017, said that the intuitive system of individuals, in these cases precedes the reflective and rational system, conditioning the maximization of the expected utility. According to the Nobel Prize, for individuals, the unhappiness caused by the loss of something is double compared to the happiness due to the gain of the same object. Furthermore, the difficulty of selling securities that are generating a loss is due to having to admit their mistakes to themselves and others. The force with which the behavioural finance theory has exposed and implemented the concept of irrationality, showing that individuals are not crazy, but that they only have a different view of the same investment option due to their personal risk aversion, is due to its ability to create a union between theory and empirical evidence.
CHAPTER II
Quantitative analysis of the first predictions: better, worse or equal revisions?
2.1 Literature Review and hypotheses development
In the last thirty years behavioural finance has been the subject of important studies and applications in both the economic and financial fields. The topic of rationality has been analysed in many respects thanks to the use of macroeconomic variables such as GDP, inflation and exchange rates. The development of this line of thinking that distances itself from the classical economy has allowed us to face issues that in the past would have been labelled only as irrational. Furthermore, it is very important to understand why both professional and non-professional investors show behaviours that do not tend to the traditional concept of rationality in decision making, introduced in literary history for the first time by Muth (1961). According to Muth (1961) the expectations of economic agents with reference to an investment opportunity should be in line with the mathematical expectations based on the real probabilistic calculation, which aim to achieve the best possible best in terms of expected utility. In order to obtain these results, however, it is necessary that the investment choices are always based on a complete information set, where the price of the shares reflects at any time all the useful and necessary information in order to make the best possible choice on the market.
According to Cavaglia et al. (1993), exchange rate forecasts are not rational, as agents do not use all available information efficiently. This analysis was carried out on a series of data
1. 30 based on exchange rate expectations taking as a reference point the differences between the expectations on the exchange rates of the European Monetary System and the US dollar. The results achieved by this study questions what was said years before by Frankel and Froot (1987), who considered the rationality of expectations directly proportional to the sampling period considered. Furthermore, Cavaglia et al. (1994) argued that through the decomposition of the change in unexpected movements on exchange rates, a change in the perception of risk premiums occurred, causing a greater fluctuation of the advent of news in the time path leading to the terminal date for which the forecast is carried out9.
In order to analyse the rationality of expectations, according to Pesaran (1987), the conditions of impartiality and orthogonality must be verified, allowing respectively to understand whether the expected exchange rate is a good predictor of the future spot rate and whether agents use available information efficiently to forecast future exchange rates. According to Esterwood and Nutt (1999) the orthogonality condition allows one to evaluate the existence of forecast errors and if the distortion is constantly identified in a certain direction. Once again, the contributions of Dominguez (1986) and Frankel and Froot (1987) employ the survey data on the expectations of professional predictors, obtaining clear empirical results in contrast with the hypothesis of impartial forecasts. Following the same lines, Chinn and Frankel (1994), who discovered that for the main currencies a casual walk wins in a competition against the previsions of professional forecasters, provide a result consistent with the influential contribution of Meese and Rogoff (1983a, b, 1988).
Further studies tend to find evidence of irrationality and no predictive ability to predict the professional exchange rate. For example, Dominguez (1986), Frankel and Froot (1987), Avraham and Ungar (1987), Cavaglia et al. (1993), Chinn and Frankel (1994), MacDonald and Marsh (1994), and more recently Cavusoglu and Neveu (2015) demonstrate through a regression of the real depreciation on expected depreciation, that expectations on exchange rates based on polls are distorted. Jongen et al. (2008) affirm that the hypothesis of impartiality is rejected in almost all currencies and forecasting horizons. Takagi (1991), MacDonald (2000) and Jongen et al. (2008) agree that the literature on expectations based on exchange rate surveys is not rational and has limited predictability.
Nordhaus (1987) argues that the revision of a prediction made for an uncertain future event and its potential predictive error should not be correlated with the previously realized predictions, but rather, should assume a behaviour called random walk. On the contrary, however, the results of this study show that the revisions of the forecasts are correlated in most cases with the previously published forecasts, especially if it refers to individual professionals in the economic and financial sector. Other studies document predictable errors in analysts' forecasts, including Abarbanell and Bernard (1992), who say that forecasts underreact to information on previous earnings. According to Lys and Sohn (1990), forecasts do not react to returns. Shane and Brous (2001) claim that forecast revisions have a positive correlation with subsequent forecast errors.
Furthermore, according to Ashiya (2006), the basic idea is that a rational expert should use the available information efficiently, so the forecast error should not be correlated with the
information available at the time of the forecast and a planned revision should not be related to the information available at the time of the previous forecast. The first important contributions in this sense are due to De Bondt and Thaler (1985, 1987, 1990). They have shown that in the psychological field there is a strong correlation between the predictions for a future event and what happened in the past. In particular, as far as professional analysts who predict share prices are concerned, an overreaction to new, negative and unexpected news has been demonstrated if the reference companies have historically put in place non-optimal behaviour.
These results reflect those of Ehrbeck and Waldmann (1996), Abarbanell and Bernard (1992) and Amir and Ganzach (1998), according to whom analysts react disproportionately to new information. According to Clements (1995, 1997) and Brown (2001), investors cannot exploit all the new information available to their advantage, because they cannot extract from the characteristics of the forecast analysts all the information necessary to improve their forecasts. Recent studies have shown that forecasts are influenced by behavioural bias. According to Ashiya (2002, 2003) analysing the data of the International Monetary Fund (IMF) and the Organization for Economic Cooperation and Development (OECD), shows how economic individuals often react exaggeratedly to new information in the time path that leads at the terminal date for which the revision is carried out, i.e. when the resolution of the uncertainty occurs.
Another phenomenon known to literature thanks to the studies of Tversky and Kahneman (1981) and Arrow (1982), Scotese (1994), Loungani (2001) and Harvey et al. (2001), regards
1. 33 the tendency of people to absorb new information, good or bad, slowly. According to these studies the new information is not absorbed promptly, such that, forecasts do not reflect in a positive or negative sense the potential surprises that the market can give. Other important studies in this sense have been dealt with by Berger and Krane (1985), who have tested the information effectiveness of the forecasts on the nominal and real gross national product. Their results showed once again that revisions to these forecasts are predictable in most cases only by examining previous forecasts, highlighting how new forecasts fail to fully incorporate all available information.
In the wake of these results, Chia-Lin Changa, Bert de Bruijn, Philip Hans Franses and Michael McAleerc (2013), have developed a methodology that explains the tendency to evaluate revisions of fixed event forecasts by analysing the gap created between a forecast at time t-1 and a revision of the same forecast at time t. However, it emerges that, as already stated by other studies mentioned above, this condition rarely occurs, giving rise to levelling or hyper-reaction phenomena. The blame for these distortion effects must be attributed to most cases in the process that governs intuition and news but is subject to shock. According to Isiklar and Lahiri (2007), the predictors should deviate from the anchoring behaviours that push them to rely too much on a single piece of information when making a decision and keep their initial forecasts for too long. Forecast variability should decrease as you approach the final result, but this could only happen if the predictors provide increasingly accurate estimates as new information is available, in the time path leading to the terminal date, where take place the resolution of uncertainty. Bruno Deschamps, Christos Ioannidis and Kook Ka (2019) also say that the forecasts do not incorporate all the financial information received in
1. 34 equal measure, which implies the presence of information rigidities in the integration of information on credit spreads.
In our work we will use a newly available data set of explicit forecasts on the euro-dollar exchange rate, made by forecasting experts, to evaluate the efficiency of exchange rate forecasts. An important feature of our data set is the presence of a very large number of forecast revisions, i.e. cases in which the author of a forecast has released more than one prediction for the same terminal date. The revisions of the forecasts are interesting because they offer the unique opportunity to check whether large banks and financial institutions incorporate new information efficiently by examining and adjusting their estimates of the future value of the currency, while time progresses towards the terminal date and new information arrives (Easterwood and Nutt, 1999). This dataset shows a very heterogeneous set of data, both in terms of the number of predictions, and of forecasting horizons themselves, which allow us to explore how the forecaster behaves in the time path that leads to the terminal date, when the resolution of the uncertainty occurs.
The model developed in our document considers forecast errors as parameters for the evaluation of investors' predictive capacity. The results are in agreement with Beckmann and Czudaj (2017), according to whom, by their nature, exchange rates have greater short-term volatility. This feature, constantly accentuated by uncertainty, causes an increase in forecasting errors. It follows that the exchange rates shown by Mark (1995), Taylor and Sarno (2004) are easier to predict in the long term, due to their tendency to return to their fundamental average value. On the same line of thought, Rossi (2013) affirms that the degree
of predictability of the exchange rate depends on the horizon, the currency and the model.
We find that the predictors would have obtained a better performance, that is a forecast error in lower absolute value, using the random walk model, or issuing a forecast equal to the spot rate known at the time of the forecast. This once again confirms the result of Meese and Rogoff (1983), and more recently Beckmann and Czudaj (2017), according to whom a random path overcomes structural theories in forecast rates outside the sample, since the market models of exchange activities are not empirically relevant, and in any case, it cannot improve random walk forecasts.
Kamil Kladivko and Pär Österholm (2019), analysing the financial variables in the Prospera survey commissioned by Sveriges Riksbank, one of Sweden's most important economic surveys, have shown that market participants' forecasts are able to significantly outperform random walk on a short-term horizon. However, in accordance with what was previously stated by Beckmann and Czudaj (2017), random walk significantly exceeds the market participants in a medium-long term perspective. Another interesting study demonstrating how revisions tend to worsen previously issued forecasts, was carried out by Singleton C. et al. (2019) on a fixed number of matches in the English football league (Premier League). They demonstrated how predictors worsened their initial predictions as the event (the start of the game) approaches and new information is made available.
Our contribution enriches existing literature by focusing on review efficiency. Other studies that used revisions as a metric to evaluate efficiency are due to Boero et al. (2008) who
analyzed inflation and GDP growth forecasts provided by individual respondents in the Bank of England's quarterly external forecast survey, 1996-2005. Dong W. Cho (2002) also follows the same line of thought, taking into account the forecasts and revisions relating to exchange rates.
Another very important element that innovates pre-existing literature in our contribution, is that the number of revisions released is unlimited, therefore each predictor can review his initial forecast whenever he deems it appropriate until the final date for which the forecast is issued. The concepts of predictive efficiency for the prediction of fixed events have been introduced by Nordhaus (1987), according to which a sequence of predictions of fixed events is weakly efficient if the revisions of the forecasts are independent. In this regard, Clements (1997) has shown how the grouping of different revision sequences can overcome this difficulty. The forecasts have been revised in response to the latest news, but it is only the surprise news component that is relevant, because a previous forecast has already incorporated the predictable news component, if it is efficient. This leads to the notion of high efficiency, that forecast revisions are independent of the information used to build the previous forecast. This is more difficult to test, as the complete set of weather information is not known to the researcher.
Furthermore, unlike Dong W. Cho (2002), who develops an evaluation model of expectations based on only two observations per forecast horizon, using as a benchmark the mean or consensus value of all participants in the survey, in our model, the benchmark is the spot rate.