Other uses, including reproduction and distribution, or selling or
licensing copies, or posting to personal, institutional or third party
websites are prohibited.
In most cases authors are permitted to post their version of the
article (e.g. in Word or Tex form) to their personal website or
institutional repository. Authors requiring further information
regarding Elsevier’s archiving and manuscript policies are
encouraged to visit:
A 70,000 year multiproxy record of climatic and environmental change
from Rano Aroi peatland (Easter Island)
Olga Margalef
a,⁎
, Núria Cañellas-Boltà
b,c, Sergi Pla-Rabes
d,e, Santiago Giralt
a, Juan Jose Pueyo
c,
Hans Joosten
f, Valentí Rull
b, Teresa Buchaca
e, Armand Hernández
g, Blas L. Valero-Garcés
h,
Ana Moreno
h, Alberto Sáez
caInstitute of Earth Sciences Jaume Almera CSIC, Lluís Solé i Sabarís s/n, E-08028 Barcelona, Spain b
Laboratory of Palynology and Paleocology, Botanic Institute of Barcelona (IBB-CSIC-ICUB), Spain
c
Faculty of Geology, University of Barcelona, Martí i Franquès s/n, E-08028 Barcelona, Spain
d
Ecological Research Center and Forestry Applications (CREAF), Campus de Bellaterra (UAB) Cerdanyola del Vallès, Barcelona, Spain
e
Advanced Studies Center of Blanes, C/D'accés a la Cala St. Francesc, 14, Blanes, Girona E-17300, Spain
f
Institute of Botany and Landscape Ecology, Grimmer Strasse 88, D-17487 Greifswald, Germany
g
IDL, Faculty of Sciences, University of Lisbon, Lisbon, Portugal
hPyrenean Institute of Ecology CSIC, Avda. de Montañana, 1005, 50059 Zaragoza, Spain
a b s t r a c t
a r t i c l e i n f o
Article history:
Received 27 September 2012 Accepted 29 May 2013 Available online 14 June 2013 Keywords:
South Pacific paleoclimate Peat geochemistry Stable isotopes
X-rayfluorescence core scanner Marine Isotope Stage 3 Last Glacial Maximum Holocene
The Rano Aroi mire on Easter Island (also known as Rapa Nui; 27°09′S, 109°27′W, 430 m above sea level) pro-vides a unique non-marine record in the central South Pacific Ocean for reconstructing Late Pleistocene environ-mental changes. The results of a multiproxy study on two cores from the center and margin of the Rano Aroi mire, including peat stratigraphy, facies analysis, elemental and isotope geochemistry on bulk organic matter, X-ray fluorescence (XRF) core scanning and macrofossil analysis, were used to infer past water levels and vegetation changes. The chronology was based on 18 14C AMS dates for the upper 8.7 m. The extrapolated age for the base of the sequence is 70 kyr, which implies that this record is the oldest paleolimnological record on Easter Is-land. The recovered Rano Aroi sequence consists of a radicel peat formed primarily from the remains of sedges, grasses and Polygonaceae that have accumulated since Marine Isotopic Stage (MIS) 4 (70 kyr BP) to the present. From 60 to 40 kyr BP (MIS 3), high precipitation/runoff events were recorded as organic mud facies with lighter δ13C, low C/N values and high Ti content, indicating higher detritic input to the mire. A gradual shift inδ13C bulk
organic matter from−14% to −26%, recorded between 50 and 45 cal kyr BP, suggests a progressive change in local peat-forming vegetation from C4 to C3 plant types. Post-depositional Ca and Fe enrichment during sub-aerial peat exposure and very low sedimentation rates indicate lower water tables during Late MIS 3 (39– 31 cal kyr BP). During MIS 2 (27.8–19 cal kyr BP), peat production rates were very low, most likely due to cold temperatures, as reconstructed from other Easter Island records during the Last Glacial Maximum (LGM). Geochemical and macrofossil evidence shows that peat accumulation reactivates at approximately 17.5 cal kyr BP, reaching the highest accumulation rates at 14 cal kyr BP. Peat accretion decreased from 5.0 to 2.5 cal kyr BP, coinciding with a regional Holocene aridity phase. The main hydrological and environmental changes in Rano Aroi reflect variations in the South Pacific Convergence Zone (SPCZ), Southern Westerlies (SW) storm track, and South Pacific Anticyclone (SPA) locations.
© 2013 Elsevier B.V. All rights reserved.
1. Introduction
Peatlands are globally important paleoenvironmental archives because they contain abundant carbon for dating and hold a wide range of hydroclimatically sensitive paleoenvironmental proxies (de Jong et al., 2010; Jackson and Charman, 2010). Peatland research has been main-ly focused on the ecology of boreal and temperate mires (Gorham, 1991; Grootjans et al., 2006). However, the paleoenvironmental evolution of
tropical and subtropical peatlands has received increased attention (Page et al., 2006; Muller et al., 2008; Dommain et al., 2011). Recent geo-chemical studies have addressed the origin and distribution of major and trace elements to reconstruct environmental changes (Weiss et al., 2002; Bindler, 2006; Muller et al., 2006; Kylander et al., 2007), and macrofossil remains such as seeds and invertebrates have been useful proxies to re-flect the local flora and fauna in mire deposits (Barber et al., 2003; Birks and Birks, 2006).
The Late Pleistocene and Holocene climates of the Pacific and Circumpacific regions have been reconstructed from marine and terres-trial records (Lamy et al., 1998; Stuut and Lamy, 2004; Valero-Garcés et
⁎ Corresponding author. Tel.: +34 934095410. E-mail address:[email protected](O. Margalef).
0921-8181/$– see front matter © 2013 Elsevier B.V. All rights reserved. http://dx.doi.org/10.1016/j.gloplacha.2013.05.016
Contents lists available atSciVerse ScienceDirect
Global and Planetary Change
al., 2005; Heusser and Heusser, 2006; Muller, 2006; Wang et al., 2007; Pena et al., 2008). Despite the relevance of the Southern Pacific region for global climate dynamics, paleo-oceanographic studies in central Pa-cific are scarce (Pena et al., 2008) because sedimentation rates on abys-sal zones are too low for high-resolution reconstructions. For this reason, continental records from Eastern Island represent key archives to understand Late Pleistocene Circumpacific climate evolution and mil-lennial time-scale changes in the El Niño-Southern Oscillation (ENSO). Paleo-environmental reconstructions from Easter Island have tradi-tionally been based on pollen studies (Flenley and King, 1984; Flenley et al., 1991; Dumont et al., 1998; Butler et al., 2004; Gossen, 2007; Azizi and Flenley, 2008; Mann et al., 2008) and macrofossil remains (Dumont et al., 1998; Orliac and Orliac, 1998; Orliac, 2000; Peteet et al., 2003; Horrocks and Wozniak, 2008; Mann et al., 2008; Cañellas-Boltá et al., 2012). Many studies focused on the timing of human arrival, societal evolution and deforestation because those mat-ters remain still controversial. Several studies have also described local responses to regional Last Glacial and Holocene paleoclimatic evolution (Flenley et al., 1991; Azizi and Flenley, 2008). Recently, multiproxy studies of the sediments of Raraku Lake, which combined sedimento-logical, minerasedimento-logical, geochemical and macrofossil data, allowed a de-tailed reconstruction of the large hydrological changes that have taken place on Easter Island since ca. 34 cal kyr BP (Sáez et al., 2009; Cañellas-Boltá et al., 2012). Concordant geological and biological prox-ies have characterized the glacial period as cold and relatively humid, ending in the two-step Termination 1 (17.3–12.5 cal kyr BP). From 11.2 cal kyr BP, the Raraku Lake record shows a decreasing water avail-ability trend, whereas intense drought periods during the Middle and Late Holocene were responsible for a long sedimentary gap from 4.2 cal kyr BP to 800 yr BP (Sáez et al., 2009; Cañellas-Boltá et al., 2012). Sedimentation resumed approximately 700 cal yr BP with the onset of a humid period.
Fewer studies have focused on the Late Pleistocene evolution of Rano Aroi, a small mire situated on Easter Island (Flenley et al., 1991; Peteet et al., 2003). The aim of this paper is to provide new insights into Rano Aroi environmental history as revealed from high-resolution multiproxy analyses from two peat cores. In this study we present new geochemical profiles (TC, TN, δ13C, Ti, Fe, Ca content),
peat facies description and macrofossil analyses from the longest record hitherto obtained from Easter Island. The reconstructed water level and
vegetational changes during the last 70 kyr have been integrated with and tested against the results of previous studies from Raraku and Kao lacustrine records and other marine and terrestrial sequences from Pa-cific and Circumpacific areas (Lamy et al., 1998; Stuut and Lamy, 2004; Valero-Garcés et al., 2005; Heusser and Heusser, 2006; Muller, 2006; Wang et al., 2007; Pena et al., 2008).
2. Regional setting
Easter Island (27° 07′S, 109° 22′W), known as Rapa Nui in the local indigenous language, is a small Miocene volcanic island in the southern Pacific Ocean, located 3510 km from the South American continent. The topography is characterized by more than 70 volcano craters and the rolling surfaces of lava flows (Baker et al., 1974; González-Ferran et al., 2004).
The climate is subtropical, with average monthly temperatures be-tween 18 °C and 24 °C (Junk and Claussen, 2011) and highly variable annual rainfall (mean of 1130 mm). Three interacting meteorological phenomena control precipitation in the eastern Pacific: the South Pa-cific Anticyclone (SPA), cyclonic storms carried in by the Southern Westerlies (SW) and the South Pacific Convergence Zone (SPCZ) (Fig. 1). The weakening of the SPA during the winter and the north-ward migration of the SPCZ and SW lead to the highest precipitation from April to July. In the winter, rainfall occurs due to depression fronts, while summer rain is mainly driven by the land–sea breeze and convection induced by the warmer Sea Surface Temperatures (SST) and Easter Island orography (Mucciarone and Dunbar, 2003; Junk and Claussen, 2011). No correlation has been found between ENSO and rainfall on Easter Island (MacIntyre, 2001a, 2001b; Genz and Hunt, 2003), although ENSO variability and dynamics are respon-sible for changes in the SST and the predominant wind direction in the region (Mucciarone and Dunbar, 2003; Anderson et al., 2006).
There are three permanent inland wetlands in the island: the cra-ters of Rano Raraku and Rano Kau occupied by lakes, and Rano Aroi. Except for a few coastal creeks, a surface drainage network does not exist in Easter Island, because precipitation infiltrates immediately in the very pervious lavaflows (Herrera and Custodio, 2008). The flora and fauna of the island exhibit low diversity and have been al-most completely altered by humans (Zizka, 1991; Rull et al., 2010a). Today, the island is largely covered by meadows that are dominated
Fig. 1. a) Location of Easter Island on a southern Pacific Ocean rainfall rate map (mm/year) and main atmospheric systems, modified fromSáez et al. (2009). b) Map showing the position of Rano Aroi on the island. c) Photo of the Rano Aroi mire, indicating the location of the cores studied in this work (ARO 06 01, center of the mire and ARO 08 02, edge of the mire).
by grasses (90%), few tree plantations (mainly Eucalyptus), shrubland, and secondary pioneer vegetation (Etienne et al., 1982; Rull et al., 2010a).
The Rano Aroi mire (27°S, 108°W, 430 m elevation) is located in an ancient Pleistocene volcano crater near the highest summit of the island, Mauna Terevaka (511 m) (Fig. 1). The gentle crater slopes form a small catchment area (15.82 ha) of very porphyritic olivinic tholeite, basalt and hawaiite lavaflows (González-Ferran et al., 2004) that are covered by grassland and planted eucalyptus. The mire (0.13 km2) almost fullyfills the basin and is covered by vegetation that
is dominated by Scirpus californicus, Polygonum acuminatum, Asplenium polyodon var. squamulosum, Vittaria elongata and Cyclosorus interruptus (Zizka, 1991).
The natural outflow follows a small ravine and infiltrates before reaching the coast. The construction of an artificial outlet in the 1960s partially drained the basin, and the water levels have been con-trolled since that time. The chemical composition of theflowing Rano Aroi outlet (slightly acidic, pH = 5.5–6.5) is similar to that of the groundwater, indicating that it represents the discharge of the main aquifer or a perched spring of a highly saturated zone (Herrera and Custodio, 2008). Water isotopic data (δ18O,δ2H) show that– unlike
the closed waterbodies of Rano Kau and Rano Raraku that are con-trolled by rainfall and evaporation– the residence time of Rano Aroi water is short and the water is renewed through discharge from an aquifer very sensitive to seasonal variations in precipitation (Herrera and Custodio, 2008). Therefore, Rano Aroi can be characterized as a geogenous fen, a peatland or mire fed by groundwater or water that has been in close contact with the mineral soil or bedrock (Joosten and Clarke, 2002; Grootjans et al., 2006).
3. Material and methods
Two sediment cores (ARO 06 01, ARO 06 02) reaching 13.9 and 16.3 m depth, respectively, were recovered with a UWITEC corer from the central part of Rano Aroi during a drilling expedition in March 2006. The uppermost two meters of the sequence were rejected to avoid potential anthropic remobilization, as described in previous studies. The cores were sealed, transported to the laboratory and stored at + 4 °C until sampling. In October 2008, three cores up to 4 m in depth were retrieved with a Russian corer from the eastern margins of the mire (ARO 08 01, ARO 08 02, ARO 08 03), an area that was potentially not affected by recent human activities (Flenley and King, 1984; Flenley et al., 1991). None of the cores retrieved in either campaign reached the bedrock. This study focused on the 13.9-m deep core from the center of the mire (ARO 06 01) and a 4-m deep core from the edge of the mire (ARO 08 02). Both cores were litholog-ically described and sampled for smear slides every 5 cm. Age models for both cores were constructed from 27 radiocarbon AMS dates of pol-len concentrates that were prepared by acid digestion (Rull et al., 2010b) and measured at the Poznan Radiocarbon Laboratory (Poland).
The obtained ages were calibrated using CALIB 6.02 software and the INTCAL 09 curve (Reimer et al., 2004) for samples younger than 20 kyr BP and CalPal online calibrated to a Hulu curve (Weninger et al., 2008) for older samples (Danzeglocke et al., 2008). No reservoir effect correction was applied to the radiocarbon dates since the dated pollen predominantly derived from sedges and other emer-gent and surrounding vegetation using atmospheric CO2, and the
pollen enriched concentrates did not contain significant amounts of amorphous organic matter that could have been of aquatic origin. Beyond the radiocarbon limit, ages were extrapolated using average accumulation rates (seeSection 5.1for details).
Cores were sampled every 5 cm, dried at 60 °C for 48 h, frozen with liquid nitrogen, ground in a ring mill and analyzed for total car-bon (TC), total nitrogen (TN) (RSD, 5% of the measurements) andδ13C
(0.2‰ of analytical precision) using a Finnigan delta Plus EA-CF-IRMS spectrometer at the Serveis Cientifico-Tècnics of the Universitat de Barcelona (SCT-UB). The carbonate content was below the detection
Fig. 2. Peat facies from Rano Aroi: Facies A (reddish peat), Facies B (granulated muddy peat), Facies C (organic mud), and Facies D (sapric peat).
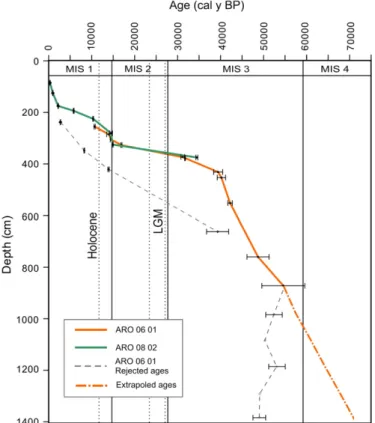
Fig. 3. Rano Aroi sequence age model. Samples from ARO 06 01 (central core section) and ARO 08 02 (marginal core section). Error bars for each point are shown. Ages in dashed lines were rejected (see text for details). Dotted line indicates extrapolated ages (see text for details). The recovered sequence of Rano Aroi spans the last 70 kyr BP.
limit; consequently, total carbon (TC) was considered to be equal to Total Organic Carbon (TOC).δ13C variability (
δ13C
res) was analyzed
by subtracting a 19-sample mean running average from the raw δ13C data to highlight high-frequency events compared to long-term
tendencies.
The iron (Fe), titanium (Ti) and calcium (Ca) relative counts and X-ray radiographs were obtained every 2 mm for ARO 06 01 with a new-generation XRF ITRAX core scanner (Mo and Cr tube at 30 kV and 20 mA measuring 60 s) of the Large Lakes Observatory (Universi-ty of Minnesota, Duluth, MN).
Morphological and elemental Energy-dispersive X-ray spectrosco-py (EDS) analyses of sand grains with high mineral contents (4.8 m, 8.3 m and 10.55 m core depth) were performed with an environmen-tal scanning electron microscope (ESEM, FEI QUANTA) operating in a low vacuum (0.5 Torr) and a scanning electron microscope (SEM, FEI) operating in a high vacuum (b10−4Torr).
Samples (30–45 cm3) for plant macrofossil analysis were
extracted from ARO 06 01 (30 samples, 1 sample every 45 cm) and ARO 08 02 (16 samples, 1 sample every 20 cm), measured by water displacement, and sieved over 125-μm and 500-μm sieves with a gen-tle stream of tap water (Birks, 2001). The residues were examined systematically under a stereomicroscope at 12 × magnification. The identification of macrofossils (seeds, coleoptera and oribatid mites) was carried out by comparisons with reference materials (Birks, 2001). The remains were stored in the general reference collection of biological micro and macro remains at the Botanical Institute of Barcelona with the nomenclature code IBB- for unknown remains (Cañellas-Boltá et al., 2012).
The major elemental chemical compositions of nine rock samples from Aroi crater were determined at SCT-UB by XRF with a Philips PW2400 (Rh tube at 60 kV and 125 mA) using Li-tetraborate dilution. Assessments of semi-quantitative bulk mineral composition of the same powdered samples were obtained by X-ray diffraction (XRD) with a PANalytical X'Pert PRO MPD-DY 3197 diffractometer (SCT-UB). The statistical treatment of the data was performed with R soft-ware (R Development Core Team, 2011) together with the‘vegan’ package (Oksanen et al., 2006). Principal component analyses (PCA) were run to extract the main components of variability of the geo-chemical data (TC, TN, δ13C
res, Fe, Ti, Ca) after standardizing and
resampling with a regular spacing of 5 cm and omitting rows with missing values.
4. Results
4.1. Facies description and macrofossil analysis
ARO 06 01 and ARO 08 02 sequences were found to be predomi-nantly radicel peats (Succow and Joosten, 2001), consisting offine roots (diameterb 1 mm) with b10% larger remains, mainly from the Cyperaceae, Poaceae and Polygonaceae. Four facies were defined based on plant components, chemical composition, grain size, color and degree of humification (Fig. 2). Facies A (reddish peat) is com-posed of Cyperaceae (cf. Cyperus cyperiodes) and Polygonaceae (P. acuminatum). This facies is only present in the uppermost 6.5 m of the ARO 06 01 sequence and the first 1.5 m of the ARO 08 02 core. The facies is associated with very high C/N ratios, low TN, low
Fe and Ti values andδ13C values between−21‰ and −26‰. Facies
B (Granulated muddy peat) is a brown peat composed of coarse or-ganic fragments, mainly roots and rootlets, with low terrigenous con-tent. This facies is present over the entire record and is characterized by high C/N ratios, low Fe and Ti contents andδ13
C values ranging from−14‰ to −26‰ (Fig. 2). A few Cyperaceae seeds are found lo-cally in the uppermost 5 m of the sequence. Facies C (Organic mud) is composed of hemic and dark brown to black radicel peat (with scarce and disperse sand fraction). Seeds of cf. Axonopus paschalis (Poaceae) are more abundant in the lower part of the ARO 06 01 and most of them are associated with the organic mud facies. Facies C was found as thin layers displaying high Fe and Ti values, high TN and relatively lowδ13C values (−14‰ to −22‰) and interbedding sediments of
Fa-cies B. FaFa-cies D (Sapric peat) consists of dark brownfine-grained layers with high Fe and Ca values. The changes among Facies B, C and D are gradual and transitional, whereas the intervals of Facies A show sharp basal limits.
4.2. Chronology
A total of 27 AMS14C dates were obtained from the ARO 06 01 and
ARO 02 08 core sequences, but only 18 dates were used for the Rano Aroi sequence age model (Fig. 3). The construction of the chronolog-ical model was based on linear interpolation between dated intervals. Problems encountered in developing the model are discussed in
Section 5.1.
4.3. Geochemistry and mineralogy of the cores
The Rano Aroi deposits are mostly organic, with TC concentrations between 40% and 70% (Fig. 4a). In ARO 06 01, TC values have a greater variability from 14 m to 9 m and a smaller range, with a mean value of 55% for core depths of 9 m to 5 m. TN levels vary between 0.4% and 2%, with C/N ratios ranging from 40 to 110. ARO 08 02 shows similar values as core ARO 06 01 with respect to TC (50–60%), TN (0.8–2%, peaking to 2.5% at 140 and 80 cm) and C/N (20–80, with a marked decrease from 2 m upward) (Fig. 4b).
In ARO 06 01,δ13C shows a constant value around−14‰ from
depths of 14 m to 9 m, whereas from 9 m to 6 m,δ13
C values gradu-ally shift from−14 to −26‰ (Fig. 4a). In the upperfive meters, δ13C
values oscillate around−26‰. In ARO 08 02, a gentle shift of δ13C
from−19‰ to −23‰ occurs from depths of 4 m to 3.5 m (Fig. 4b). δ13C
res curves show high-frequency changes (dips) within the
long-term trend signal and significantly lower values for Facies C be-tween 6 and 11 m in ARO 06 01.
The XRF signal is very weak for the Rano Aroi sediments, in accor-dance with the high organic content. Thus, only Fe (from the Mo tube) and Ti and Ca (from the Cr tube) from ARO 06 had sufficient intensity (counts per second, cps) to be considered statistically significant, al-though also these elements have low counts (Fe = 300–700 cps, Ca = 1000–2000 cps, Ti = 100–2000 cps) all along the sequence. The general trends are similar for Fe, Ti and Ca, although some differences are appar-ent when comparing Fe and Ca with Ti variability (Fig. 4a). Ca and Fe reach maximum values at 6–4 m, coinciding with Facies D deposition. Fe and Ti, although they have very low background values, show synchro-nous higher values that coincide with Facies C.
Fig. 4. (a): Main paleoenvironmental proxies analyzed in ARO 06 01 core versus depth. Lithology and radiocarbon age samples are indicated in the column. Geochemical proxies: TC, TN (in percentages), C/N ratios, andδ13C (‰) are indicative of the origin of organic matter. Residual values of δ13
Cres(‰) are used to record δ13C dips that are not related to
long-term C4–C3changes and caused by humidity changes or punctual variations in C3/C4ratio Fe, Ti and Ca (in cps) come from terrigenous inputs together with the presence
of sand grains on Facies A, B, and C, while Fe/Ti and Ca/Ti ratios are indicative of post-depositional remobilization and coincide with high values of Fe and Ca on Facies D. Macrofossil record: Seeds such as Cyperaceae (Cyperaceae sum), Poaceae (Poaceae sum) and Polygonum acuminatum.δ13
Cres, TN, and Ti values are wet event indicators. Ca/Ti and Fe/Ti indicate
oxidation and peat exposure. Periods of inferredflood and drought conditions are marked. (b): Paleoenvironmental proxies analyzed in ARO 08 02 core versus depth. Lithological units and their ages are indicated in the column. Geochemical proxies: TC, TN (in percentages), C/N ratios, andδ13C (‰) are indicative of organic matter origin. Residual values of
δ13
Cres(‰) are used to record δ13C dips that are not related to C4–C3changes. Macrofossil record: Sand grains associated with detritic input. Seeds such as Cyperaceae (Cyperaceae
sum), Poaceae (Poaceae sum) and Polygonum acuminatum. The episode characterized by heavyδ13
C and low C/N ratios at a depth of 1.25 m might indicate a basin disturbance, such as higher oxidation and opening of the surrounding vegetation.
Fig. 5. Principal component analysis of the geochemical data (δ13
CresTi, Fe, Ca, TN, TC, C/N). Two principal component axes explain the 60% of the variability (Axis 1: 30.7%, Axis 2:
27.8%). Variable loadings and sample scores are presented in the plane defined by the first two axes. To elucidate the relationship between the PCA results and the established facies, the scores are plotted following a facies color code. The diagram shows how granulated muddy peat (Facies B) and reddish peat (Facies A) lie near the axes origin and are therefore interpreted as Rano Aroi baseline conditions (termed water rise mire). Organic mud (Facies C) is associated with high Ti and TN and lowδ13
Cres, and are representative offlood
conditions. By contrast, sapric peat (Facies D) is related to Ca, Fe and TC variability and represents exposure and oxidation of the peat surface (dry peatland stage).
Table 1
14C AMS radiocarbon age measured in pollen-enriched extract of Rano Aroi core samples. Rejected ages marked with an asterisk (see text).
Sample name Depth
(cm)
Fraction dated Dates Calibrated ages
(yr BP) ARO 06 01
ARO 01-01 03 238 Pollen concentrate 2580 ± 30* 2730 ± 30*
ARO 01-01 20 255 Pollen concentrate 9460 ± 50 10,690 ± 120
ARO 01-01 50 285 Pollen concentrate 12,150 ± 60 13,995 ± 153
ARO 01-01 70 305 Pollen concentrate 12,880 ± 70 14,505 ± 483
ARO 01-01 92 327 Pollen concentrate 13,800 ± 60 16,910 ± 180
ARO 01-01 103 338 Pollen concentrate 7440 ± 50* 8270 ± 80*
ARO 01-01 143 378 Pollen concentrate 26,960 ± 150 31,742 ± 80
ARO 01-02 23 421 Pollen concentrate 12,070 ± 60* 13,923 ± 138*
ARO 01-02 31.5 431.5 Pollen concentrate 34,000 ± 500 39,431 ± 1051
ARO 01-02 53 453 Pollen concentrate 35,300 ± 600 40,190 ± 970
ARO 01-03 57 552 Pollen concentrate 37,600 ± 600 42,210 ± 520
ARO 01-04 62 662 Pollen concentrate 33,900 ± 500* 39,310 ± 2570*
ARO 01-05 67 760 Pollen concentrate 45,000 ± 2000 48,710 ± 2570
ARO 01-06 72 872 Pollen concentrate 49,000 ± 3000 54,600 ± 5000
ARO 01-07 83 979 Pollen concentrate 52,000 ± 4000 57,339.09
ARO 01-08 83 1083 Pollen concentrate >50,000 60,843.14
ARO 01-09 88 1181 Pollen concentrate 53,000 ± 4000 64,145.02
ARO 01-10 88 1288 Pollen concentrate >49,000 67,750.15
ARO 01-11 88 1380 Pollen concentrate 49,000 ± 3000 70,849.88
ARO 08 02
ARO 02-02 35 85 Pollen concentrate 270 ± 30 307 ± 25
ARO 02-03 25 125 Pollen concentrate 1050 ± 30 965 ± 41
ARO 02-04 25 175 Pollen concentrate 2265 ± 30 2206 ± 48
ARO 02-04 44 194 Pollen concentrate 5070 ± 40 5820 ± 92
ARO 02-05 25 225 Pollen concentrate 9180 ± 50 10,339 ± 100
ARO 02-06 31 281 Pollen concentrate 12,420 ± 60 14,501 ± 350
ARO 02-07 25 325 Pollen concentrate 13,880 ± 70 14,921 ± 100
SEM analysis of Facies C sand grains revealed the presence of pla-gioclase and quartz grains in the coarse (> 500μm) and of rutile, quartz and Mn oxide grains in thefine fractions (b500 μm). SEM analysis of the Facies D (Sapric peat) showed that minerals consist of Fe, Mn oxides and organic bounded Ca. Facies A and B had insuf fi-cient mineral contents for SEM analysis.
4.4. Watershed rock analyses (mineralogy and geochemistry)
To investigate the inorganic fraction of sediment material that has been delivered to the Rano Aroi mire, the mineralogical and geochemi-cal composition of selected volcanic rock samples from the watershed was analyzed. XRF analysis of bulk samples showed that SiO2is the
most abundant oxide, followed by Fe, Al and Ca oxides (Table 2a). Na, Mg and Ti oxides are present in concentrations of 3–4 wt.%, while Mn, P and K oxide concentrations remain below 1%. Very high levels of Fe and Ti in the Rano Aroi catchment have been documented by previous petrographic studies (Baker et al., 1974). XRD analysis showed that most rocks are composed of Ca-plagioclase and pyroxenes (enstatite– diopside). Ilmenite and quartz minerals are frequently present, and Na-felspathoids, spinel, olivine and rutile are present in significant con-centrations (Table 2b). These results indicate that rocks in the catch-ment range from basalts to tholeites–hawaiites.
4.5. Geochemical variability of the peat record
Principal Component Analysis (PCA) of 6 variables (TN, TC,δ13C res,
Ti, Fe, and Ca) and 200 samples (Fig. 5) shows that thefirst nent explains 30.7% of the total variance, whereas the second compo-nent explains an additional 27.8%. Ti, Fe and Ca contributed negatively to the first component, while δ13C
resvalues were found
at the opposite end. TN and Ti tied the negative end of PC2, while Ca, Fe, TC andδ13C
rescontributed positively to PC2. The reddish peat
(Facies A) and granulated muddy peat (Facies B) showed sample scores at the center of the PCA biplot (Fig. 5). By contrast, the scores of organic mud (Facies C) are related to Ti, TN and to lesser extent toδ13C
res, while Sapric peat (Facies D) follows Ca, Fe and TC.
5. Discussion 5.1. Chronology
The ages that were found for the Facies A reddish peat in the up-permost part of ARO 06 01 were systematically too young. On the X-ray radiographs (not shown), this facies shows less compaction and horizontal structures, suggesting it represents fresh Cyperaceae (Scirpus sp.) peat mats that are composed of roots, rootlets and rhi-zomes. Plant remains and macrofossil composition of Facies A are similar to the structure of the buoyant mats that are currently present in Raraku and Kau lakes. Similarly, Rano Aroi may have had similar,
partially buoyant peat patches during episodes with high water table, allowing simultaneous top down peat growth infloating mats and debris aggregation at the lake bottom. Floating vegetation dy-namics can cause peat mats to invert orflip over, as documented for Rano Kau (Butler et al., 2004). The growth pattern, presence of roots and rhizomes and inversion dynamics could be responsible for the previously described anomalous dating (Peteet et al., 2003; Butler et al., 2004). Moreover, if these (too young) ages are used to establish age–depth relationships between the ARO 06 01 and ARO 08 02 cores, the steep slope of the peat deposits would be inconsistent with the peat accumulation pattern of a kettle hole or a percolation mire (seeSection 5.2;Gaudig et al., 2006). From 8.5 m to the bottom of ARO 06 01, radiocarbon dating shows ages older than 50 kyr BP (Table 1,Fig. 3), i.e. beyond the radiocarbon detection limit. As the ac-cumulation rate between 40 and 48 cal kyr BP (3.7–7.6 m), based on four dates, is constant and the peat facies are the same until the base of the sequence, it can be assumed that sedimentation rates also have been the same. Consequently, the lower part of the core, was dated by linear extrapolating as 70 kyr old (Table 1,Fig. 3).
Accumulation rates vary from 0.02 to 1 mm/year, which are com-mon rates for peats worldwide (Couwenberg et al., 2001; Dommain et al., 2011). The mean accumulation rate from 13.90 to 4.31 m depth is 0.3 mm/year. Dates at 4.31 m and 3.78 m are approx. 39 cal kyr BP and approx. 31 cal kyr BP, respectively. The consequent very low accu-mulation rate is reflected in a sharp unconformity at 4.31 cm, where highly oxidized peat (Facies D) is covered by low humified peat (Facies A). Peat facies analysis (seeSection 5.2) suggests that dur-ing this time interval the wetland suffered from drought and ero-sion (seeSection 5.2). Peat accumulation must have started again soon after, as downward extrapolation of the very low accumula-tion rates between approx. 31 and 17.5 cal kyr BP (0.03 mm/year) indicate. This extrapolation also shows that– probably at the start of re-suming peat accumulation– accumulation rates must have been some-what larger, possibly coincident with the initial peak in the Chilean humidity index until 37 cal kyr BP. After approx. 14–15 cal kyr BP accu-mulation rates increase again in both ARO 06 01 and ARO 08 02. The mid-to-late Holocene (5–2.5 cal kyr BP) is characterized by very low accumulation rates in ARO 08 02; the rates rise again during the last 2.5 cal kyr BP up to the present time.
5.2. Origin of organic matter in the cores
As diagenetic shifts in carbon isotopes values over the millennial time scale are generally much lower than source differences (Talbot and Johannessen, 1992), δ13C may be used to distinguish between
remains from plants with C3and C4metabolic pathways of
photosyn-thesis (Talbot and Johannessen, 1992; Meyers, 1994). Significant methanogenesis as the single source of significant fractionation in peat (Talbot and Johannessen, 1992; Meyers, 1994) is improbable be-cause no correlation exists betweenδ13C and C/N changes, andδ13C
Table 2a
Bulk geochemistry from XRF expressed as major oxides (%(m/m)) (XRF data).
Sample name Fe2O3 MnO TiO2 CaO K2O P2O5 SiO2 Al2O3 MgO Na2O
Fe5 Mn3 Ti4 Ca3 K3 P3 Si3 Al3 Mg3 Na7 1 13.09 0.18 3.18 9.98 0.54 0.41 48.78 16.01 3.81 3.06 2 11.75 0.16 2.73 10.04 0.47 0.4 47.75 17.09 4.18 3.04 3 12.88 0.16 3.20 9.63 0.7 0.43 48.38 15.34 4.09 3.08 4 17.92 0.25 4.13 7.39 0.38 0.47 41.96 15.69 4.8 2.32 5 13.2 0.17 3.17 9.42 0.4 0.43 46.07 15.83 3.88 2.91 6 18.54 0.18 4.95 3.72 0.4 0.56 28.71 20.91 3.69 0.59 7 14.44 0.21 3.61 5.09 0.69 0.44 38.58 18.96 4.2 1.5 8 13.75 0.19 3.34 7.42 0.76 0.41 45.71 17.85 3.71 2.55 9 12.87 0.16 3.55 8.88 0.69 0.47 48.22 14.15 4.29 3.04
values are within the natural limits of changes between C3to C4land
plants. From 70 to 55 kyr BP, theδ13
C values of ARO 06 01 indicate the predominance of C4-type plant remains. A gradual transition from
C4 to C3plant remains is reflected by progressively lower values of
δ13C, reaching−26‰ at approximately 47 cal kyr BP. The uppermost
part of the record shows low values ofδ13C (
−26‰), which suggests that the mire from that time on until the present time has been domi-nated by C3plants. This interpretation is supported by the presence of
seeds of the C4grass species A. paschalis from 70 to 47 cal kyr BP,
where-as seeds of C3plants, including S. californicus, cf. C. cyperoides and P.
acuminatum, were found in the uppermost part of the sequence. The same unidirectional succession from C4to C3plants is described for
the same depth in palynological studies (Flenley and King, 1984; Flenley et al., 1991) of a core (ARO 01) from the center of the mire.
High-frequency oscillations of relatively lowδ13C values,
coincid-ing with Fe and Ti peaks in organic mud (Facies C) stand out from this general trend. In addition to differences in metabolic pathways of peat-forming vegetation,δ13C can provide information on changes
in productivity and environmental conditions, such as insolation or humidity (Hong et al., 2001). In the stage dominated by C4plants,
δ13C peaks with lower values can be interpreted as a higher
contribu-tion of algal and C3plant organic matter, both of which are favored by
wetter conditions. At the same time, C3plant fractionation is sensitive
to humidity and precipitation, as shown in isotope measurements on cellulose and macrofossils on peatland records (Aucour et al., 1999;
Hong et al., 2001). Higher levels of precipitation and soil moisture and a closer canopy result in lowerδ13
C values in C3plants and vice
versa (Aucour et al., 1999; Hong et al., 2001; Muller, 2006). 5.3. Facies interpretation and mire development
5.3.1. Mire development
Rano Aroi mire currently receives water from a perched aquifer with low permeability that is located to the north and loses water to surface outflow and infiltration toward the south (Herrera and Custodio, 2008). This hydrological configuration indicates that Rano Aroi is a self-sealing mire (sensuJoosten and Clarke, 2002), fed by discharging deeper groundwater (similarly to percolation mires) and not by interflow, and easily affected by changes in precipitation (similar to kettle hole mires). Moreover, the small basin reception volume amplifies rainfall sensitivity. Although we did not recover the oldest sediments deposited in the basin, it is likely that Rano Aroi evolved from a formerly dry basin into a very wet mire (Facies B) that was regularlyflooded (Facies C). As the mighty peat deposits and the identical age-depth curves of both ARO 06 01 and ARO 08 02 indicate, the water level must have steadily risen, probably as a result of formation of stagnating layers on increasingly higher levels (cf.
Gaudig et al., 2006). Earlier stages of this process, which is typical for kettle hole mires (Joosten and Clarke, 2002) can be observed in other small craters on the island.
Table 2b
Mineral assemblage of rock samples expressed as estimated %m/m (XRD-data).
Sample Ca–plag. Pyx (enst.–diop.) Ilmenite Qtz Foid. (sodalite) Spinel Oliv. (forst.) Rutile
1 80 17 3 – – – – – 2 75 21 1 3 – – – – 3 82 11 2 3 1 1 – – 4 69 18 4 – – – 9 – 5 67 26 2 – – – 5 – 6 39 47 9 – – 5 – – 7 49 34 5 – – – 11 1 8 83 14 – – 3 – – – 9 75 23 2 – – – – –
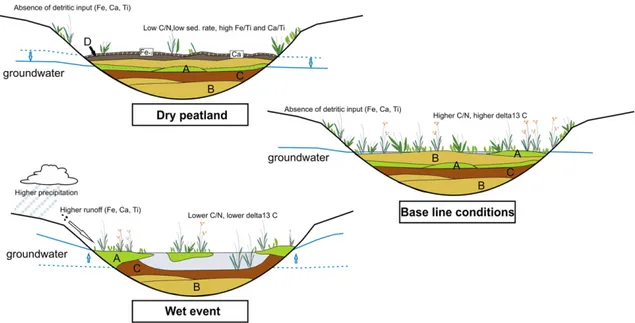
Fig. 6. Mire accumulation facies model by different water level stages. This model is based on the PCA analysis of the geochemical characteristics of facies (Fig. 5). Three stages of water level have been differentiated. The wet events stage entails aflooded area where fine-sized organic mud facies is deposited. High values of Ti, Fe and Ca are recorded due to increased runoff produced by more intense precipitation. Water rise mire is a stage that is representative of Rano Aroi baseline conditions and was dominant for the last 70 kyr BP: granulated peat facies are formed from the continuous accumulation of organic matter that is mainly composed of sedge and grass roots. The dry peatland stage occurs when water restriction leave the mire in a negative hydric balance. Surface peat is mineralized, and Fe and Ca are concentrated at the uppermost levels.
5.3.2. Principal Component Analysis (PCA)
The main geochemical processes that controlled depositional de-velopment are illustrated in the PCA plot (Fig. 5) that shows that the negative end offirst component (PC1) is tied by Ca, Fe and Ti, which have a lithogenic origin. These elements would have originated from the weathering volcanic rocks in the Rano Aroi catchment (Section 4.4), which are rich in Ca-plagioclase, pyroxenes, ilmenite and rutile (Tables 2a and 2b). This link suggests that PC1 primarily re-sponds to the presence of terrigenous components that have been brought to the mire by runoff and incorporated into the peat as particulate sediment.
The second component (PC2) of the PCA clearly displays that the chemical behavior of Ca and Fe (positive end of PC2) differs from that of Ti (negative end of PC2), although all three elements have been incorporated into the mire as terrigenous particles. In organic soils, Ca and Fe contents are not only related to primary input, but can be also caused by post-depositional remobilization. To check this hypothesis, the Ca and Fe data were normalized to Ti, which is considered to be immobile in peat (Weiss et al., 2002; Muller et al., 2006, 2008). The extremely high Ca/Ti and Fe/Ti ratios between 4
and 6 m depth resemble the enrichment levels that are found in peat profiles on the fen-to-bog transition, indicating the change from geogenous (fen) to ombrotrophic (bog) conditions (Gorham and Janssens, 2005). High Fe/Ti ratios can be attributed to Fe2+
mi-grating upward from the anaerobic peat below followed by precipita-tion as Fe3+oxide in the upper aerated peats. Through this process Fe
in ombrotrophic peat profiles accumulates in the zone of water table fluctuations (Damman et al., 1992). The distribution of Ca in ombrotrophic mires has been related to bioaccumulation in the biologically active zone (Damman et al., 1992; Shotyk, 1996; Shotyk et al., 2001). Similar high values have been observed in the ombrotrophic phase (8.2 to 4.9 cal kyr BP) of Raraku Lake sediments (Sáez et al., 2009). Negative PC1 but positive PC2 values can then be related to Fe and Ca complexation with organic matter, i.e. when a lowering water table leads to oxic conditions in the peat. Negative PC1 (higher Ca, Fe, Ti) and negative PC2 (no oxidation) with high TN and lower δ13C
res, in contrast, can be explained by a higher
water table and higher detrital input. In consequence, we interpret PC2 as being indicative of changes in water table level and redox conditions.
Fig. 7. Synthesis of Rano Aroi environmental mire evolution. Wet episodes are defined from Ti cps and δ13
C residual values. Very high Fe/Ti ratios are indicative of the exposure and oxidation of the peat sometime after 40 cal kyr BP, and low sedimentation rates indicate no deposition and possible erosion between 38 cal kyr BP and 17 cal kyr BP. Another ep-isode with a very low accumulation rate is defined during the mid-Holocene. A possible anthropogenic disturbance is inferred from δ13C and C/N ratio variations and defined as
5.3.3. The three main environmental and hydrologic conditions of Rano Aroi In the development of Rano Aroi three main environmental and hy-drologic settings can be distinguish on the basis of the Principal Compo-nent Analysis and the characterization of the four facies (Fig. 6): a) Flooded mire (Facies C). In the PCA, the Facies C samples are directly
tied to the TN and Ti loadings (negative PC1 and PC2), i.e. to a high content of lithogenic elements and a high water table. Facies C might represent an open water phase (as terrigenous material would not have been transported through dense mire vegetation), when suspended material could be transported to the center of the mire during periods of precipitation (Fig. 6). The lowerδ13
Cres
isoto-pic values are in accordance with organic matter that originated in conditions of higher soil moisture or precipitation (Muller, 2006; Hong et al., 2001, seeSection 5.2). The lower isotopic values could, however, also result from the increasing presence of C3 plants, and therefore point at a change in vegetation during wet events. The abundant roots and rootlets that cross-cut the Facies C layers would have penetrated the lake sediments from above in subse-quent mire phases (displacement peat,Weber, 1930).
b) Dry mire (Facies D). The dark color andfine grain size demonstrate advanced humification of the Facies D sapric peat. Facies D scores are directly related to Fe and Ca loadings (negative PC1, positive PC2) which can be interpreted as oxidized peat. These chemical and morphological features suggest that Facies D reflects long-term drought phases likely entailing strong decomposition (Fig. 6). The ac-cumulation rates that– in spite of apparent stronger mineralization – are similarly high as before (Fig. 3) indicate that these drier condi-tions were associated with higher vegetation productivity.
c) Baseline mire conditions (Facies B and A). The brown-reddish peats of Facies B and A are mainly composed of roots, rootlets and other macroremains of sedges and herbs with constantδ13C
resand high
C/N ratios. Facies A is better preserved and has a lower degree of hu-midification than Facies B, likely due to more constant water tables and faster burial. Facies A and B are interpreted as being deposited in a kettle-hole mire (Joosten and Clarke, 2002), similar to the present Rano Aroi conditions, in which long-term stable water tables near the surface allow for the constant accumulation of low-decomposition peat with very restricted terrigenous input (Fig. 6). The scores of Fa-cies A and B samples show very low variability on thefirst two PCA components (Fig. 5). They illustrate the more stable baseline condi-tions that are interrupted by wetter phases of allochtonous sediment delivery (Facies C) or drier phases with stronger decomposition (Fa-cies D).
5.4. Environmental changes
The facies model and geochemical and paleo-ecological data allow us to interpret the development of the Rano Aroi mire in terms of de-positional and paleo-hydrological changes during the last 70 kyr. Mire development is strongly controlled by temperature and humid-ity, which permit us to reconstruct the Late Pleistocene regional paleoclimate on Easter Island (Fig. 7).
5.4.1. MIS 4 (70–60 kyr BP in Rano Aroi)
The homogenous sequence of Facies B during the MIS 4 stadial shows that Rano Aroi was in its base-line state when in the C4
grass-dominated kettle-hole mire accumulation rates were reached of approximately 0.3 mm/year. The MIS 4 stadial is regionally character-ized by low southern Pacific SST temperatures (Kaiser et al., 2005). Wind circulation around Antarctica was intensified, and the northward migration of the Westerlies and the Antarctic Circumpolar Current (ACC) brought sub-Antarctic cold waters up to temperate latitudes (Kaiser et al., 2005). Simultaneously, a southward shift of the ITCZ resulted in enhanced precipitation over Brazil (Wang et al., 2007), while a dry period was recorded in the Northern Hemisphere, such as
in Eastern China (Wang et al., 2007) and the Central American Pacific coast (Leduc et al., 2007). This climatic configuration involved a shrink-ing SPA and a favorable pattern for regular precipitation at Easter Island, caused by the eastward expansion of the SPCZ. The constant water sup-ply will have favored peat accumulation in the sheltered basin. At the end of MIS 4 thefirst abrupt wet event of the record occurred. 5.4.2. MIS 3 (60–27.8 cal kyr)
Two different MIS 3 states (Early and Late) can be distinguished in Rano Aroi. Thefirst phase from ca. 60 to 42 cal kyr BP is characterized by short and abrupt events of higher sediment delivery, which implies the establishment of moister conditions on Easter Island (Fig. 7). The millennial-scale range of these events is coherent with climatic instabil-ity and temperature and humidinstabil-ity suborbital cycles that were globally identified for MIS 3 (Baker et al., 2001; Haug et al., 2001; Oppo et al., 2003; Wang et al., 2004, 2007; Muller, 2006; Clement and Peterson, 2008). Antarctic records show millennial-scale warming events that were simultaneous with drops in temperature in the north Atlantic re-gion (Heinrich events), configuring an interhemispheric teleconnection known as the“bipolar seesaw” (Blunier and Brook, 2001). Many studies note the coincidence of millennial-scale cycles of SST, humidity and ma-rine productivity in the tropical Atlantic and Pacific Oceans and cooling episodes in the Northern Hemisphere and Greenland (Baker et al., 2001; Haug et al., 2001; Oppo et al., 2003; Wang et al., 2004, 2007; Muller, 2006; Clement and Peterson, 2008). Several mechanisms have been proposed to explain these teleconnections, including thermoha-line circulation (THC) variability, sea ice feedbacks and changes in con-vection or movement of the Intertropical Convergence Zone (ITCZ) (Clement and Peterson, 2008). Southern displacements of the ITCZ and the SPCZ together with intensification of the Southern Westerlies result in a regional configuration that favors the occurrence of higher moisture and storminess on Easter Island (Wang et al., 2004; Muller, 2006). Such moister conditions, which affect most of the south Pacific region (Lamy et al., 1998; Stuut and Lamy, 2004), could have been re-sponsible for the Rano Aroi wet events. Records from the central Coast of Chile (Lamy et al., 1998; Stuut and Lamy, 2004) prove the importance of precession cycles over the SW Storm Track position and show the oc-currence of a wet period from 50 to 40 cal kyr BP.
The Late MIS 3 is characterized by geochemical evidence (high Ca/ Ti and Fe/Ti ratios) of peat oxidation which allow us to identify an an-cient exposure surface dated at 39.5 cal kyr BP. Peat is highly effec-tively lost by oxidation with a rate of up to few cm per year (Couwenberg et al., 2001). This oxidation event must have happened between 39 and 31 cal kyr, resulting in a failing to record environ-mental changes during and before the event. The age–depth curve and the reconstructed accumulation rates (par. 5.1) indicate that ex-posure has only been short lasting and peat accumulation restarted rather quickly, be it with a (very) low accumulation rate. Conditions between 39 and 31 cal kyr BP were probably dry and relatively cold in Easter Island as also observed in South American continent records where a dry period was identified between 37 and 31 cal kyr BP (Lamy et al., 1998; Stuut and Lamy, 2004,Fig. 7). Rano Aroi record shows very low accumulation rates during Late MIS 3 (31 to 27.8 cal kyr BP) possibly due to low temperatures that hampered the growth of the mire. These low temperatures would have lasted until the end of MIS 2 (Sáez et al., 2009).
Overlaid with this wet–dry variability, Rano Aroi deposits record a change in the prevalence of C4to C3plants over the period from 50 to
45 cal kyr BP. To some extent, this process is supported by pollen studies published byFlenley et al. (1991)indicating dominance of C4plants until
50 cal kyr BP, then shifting to a C3dominance. In ARO 06 01, at 45 cal kyr
BP, extremely well-preserved plant remains, including S. californicus rhi-zomes, were found in peat with very high C/N values. These rhizomes represent the oldest S. californicus remains that have been found to date on the island. Changes in the ratio of C3/C4plants are generally associated
1997; Huang et al., 1999; Meyers and Terranes, 2001; Street-Perrott et al., 2004), with low concentrations of atmospheric CO2, low temperatures
and restricted water supply being the major selective forces for the dom-inance of C4 over C3 (Street-Perrott et al., 1997; Huang et al., 1999;
Ehleringer et al., 1997).
In the case of Rano Aroi, vegetation succession toward a domi-nance of C3plants could reflect the expansion of C3sedge species as
a response a) to milder temperatures and globally higher atmospher-ic CO2concentration and b) to the progressive increase of humidity
since the beginning of MIS 3 as indicated by the occurrence of abrupt wet events. At Rano Aroi, the changing C4-to-C3signal can, however,
also be ascribed to the arrival and expansion of S. californicus on the island. The arrival of this species, which originates from the South American continent, is attributed to wind or bird transport (Heiser, 1974), with both vectors having a possible climatic and a substantial stochastic component.
5.4.3. Early MIS 2 and Last Glacial Maximum (LGM) (27.8–19 cal kyr BP)
The lowest peat accumulation rates at Rano Aroi were recorded between 27.8 and 17.5 cal kyr BP (0.03 mm/year,Fig. 7). Thisfinding likely reflects low temperatures hampering the normal growth of the plant species in the mire at that time. Previous studies from the Raraku site attribute humid and cold conditions to the island during the LGM (Azizi and Flenley, 2008; Sáez et al., 2009). The reconstructed high water table of Raraku Lake suggests substantial rainfall coupled with low evaporation. However, pollen data fromAzizi and Flenley (2008)
suggest that cold temperature was the main factor controlling forest development on Easter Island during glacial periods. During MIS 2, global temperatures reached a minimum between 19 and 22 cal kyr BP (Heusser and Heusser, 2006; Lea et al., 2006; Kaiser et al., 2008), and the northward migration of the Westerlies storm track caused the arrival of colder waters to intermediate latitudes (Lamy et al., 1998; Pena et al., 2008). It is therefore likely that temperature was the driving factor for the low accumulation rates at Rano Aroi during that period.
5.4.4. Late glacial (19–11.7 cal kyr BP)
Rano Aroi provides evidence of a warmer climate at 17.5 cal kyr BP, when peat accumulation accelerated. A high water table event was recorded at 15 cal kyr BP (Fig. 7), followed by an episode of very high peat accumulation from 15 to 14 cal kyr BP (1 mm/year,Fig. 7). This period is characterized by a high concentration of P. acuminatum seeds, a pioneer species that is commonly found in thefirst stages of succession. Marine records from the central Pacific region show that de-glaciation warming started approximately 19 cal kyr BP, parallel to the retreat of the Antarctic sea ice (Kaiser et al., 2008) and appreciably ear-lier than the continental response (Sáez et al., 2009). This warming has been related to phases of low precession and high obliquity (Pena et al., 2008), which drove storm tracks southward and enhanced the E–W Pacific thermal gradient, favoring La Niña-like conditions (Koutavas et al., 2002; Pena et al., 2008).
Studies of the Raraku Lake record describe the Easter Island hydro-logical and vegetational response to deglaciation at 17.3 cal kyr BP, in accordance with South American and New Zealand continental records (Sáez et al., 2009). Maximum accumulation (14 cal kyr BP) coincides with the highest rates of sea level rise during the last degla-ciation period as a response to Melt Water Pulse A1 (Hanebuth et al., 2000; Dickinson, 2001; Lambeck and Chappell, 2001). Sea level rise together with warmer SST, might have played an important role in the development of enhanced convection storms.
5.4.5. Holocene (11.7–2.5 cal kyr BP)
During the Early Holocene, the accumulation rate at Rano Aroi was low (0.1 mm/year) (Fig. 7). Raraku Lake underwent a gradual drop in water level, leading to the establishment of a shallow swamp system
from 11 to 5.5 cal kyr BP (Sáez et al., 2009). From a regional perspec-tive, the early Holocene is according to several southern hemispheric records (Pena et al., 2008) characterized by a warming trend. Pacific SST were maximal at approximately 12 cal kyr BP and generally de-creased thereafter, until modern SST were reached (Kaiser et al., 2005; Kaiser et al., 2008). Arid conditions during the early Holocene occurred in Central Chile (Moreno and León, 2003; Paduano et al., 2003; Tapia et al., 2003; Valero-Garcés et al., 2005) and lasted until approximately 5–4 cal kyr BP.
The dominant dry conditions were interrupted by a short-term flood episode at 5.8 cal kyr BP in Aroi and between 6.2 and 5.8 cal kyr BP in Raraku (Sáez et al., 2009). This wet period on Easter Island is synchronous with the global climatic event between 6 and 5 cal kyr BP (Mayewski et al., 2004), the enhanced precipitation period from 6 to 5.8 cal kyr BP on the Galápagos Islands (Conroy et al., 2008) and stronger SW activity in Southern Chile (Heirman, 2011).
Dry conditions on Easter Island lasted until the Late Holocene. Low lake level conditions caused a sedimentary hiatus in the center of Raraku Lake from 4.2 to 0.8 cal kyr BP (Mann et al., 2008; Sáez et al., 2009) and a shorter period in the eastern lake margin (Cañellas-Boltà et al., work in progress), while in Rano Aroi, the 5.5–2.5 cal kyr BP period is characterized by very low accumulation rates (0.06 mm/year).
5.4.6. Late Holocene (2.5 cal kyr BP to present)
The Rano Aroi record shows that Late Holocene wetter conditions began on Easter Island approx. 2.5 cal kyr BP, coinciding with wetter conditions in mid-latitude Chile (van Geel et al., 2000) and Antarctica warming due to increased southern summer insolation (Ingolfsson et al., 1998). The timing of this transition lags that of eastern circumpacific regions, where it occurred approx. 4 cal kyr BP, as shown by many Alti-plano lacustrine (Jenny et al., 2002; Paduano et al., 2003; Valero-Garcés et al., 2005) and marine records (Lamy et al., 2001).
The peat growth rate at Rano Aroi recovered completely at 2.5 cal kyr BP, and relatively humid conditions were inferred up to the present time. A more humid Late Holocene is a consistent regional pattern that has been observed at tropical to temperate latitudes (Lamy et al., 2001; Valero-Garcés et al., 2005; Conroy et al., 2008). The regional shift to wetter conditions after 4 cal kyr in eastern Pacif-ic areas has been related to stronger convective summer rains due to increased summer insolation together with a northward shift of the Southern Westerlies.
At 1.3 cal kyr BP (655 AD), a decrease in C/N suggests enhanced mineralization, and highδ13C values indicate a higher contribution
of C4grass organic matter. The age of this event lies in the time
inter-val proposed for human arriinter-val or expansion (Rull et al., 2010a), so these features could be interpreted as peat exposure and vegetation opening caused by anthropogenic disturbance. Nevertheless, this event could also reflect climate change during the Medieval Climate Anomaly (1205–705 yr cal BP), which brought warm and dry condi-tions, a low degree of interannual variability and less storminess to the eastern Pacific (Nunn, 2007).
6. Conclusions
The Rano Aroi sequence is the oldest and longest terrestrial record recovered on Easter Island, spanning the last 70 kyr BP and documenting water level and vegetation changes during the Late Pleistocene. Radicel peat facies indicate that Rano Aroi grew as a ket-tle hole mire from a formerly dry basin, creating impervious layers on increasingly higher levels. The geochemical record and peat charac-terization allow us to define three peatland types depending on the hydrological conditions: (1) baseline mire conditions (Facies A and B), (2)flooded mire (Facies C) formed during periods of enhanced precipitation and (3) dry mire (Facies D) when drier conditions prevailed.
During MIS 4 (70 to 60 kyr BP in Rano Aroi), the hydric and envi-ronmental conditions in the mire were stable and resembled mire baseline conditions. The MIS 3 (60 to 27.8 cal kyr BP) is characterized by the occurrence of abrupt wet events owing to the progressive in-crease of humidity. After 45 kyr BP vegetation in Rano Aroi changed from C4to C3plant dominance, which might have been triggered by
more adequate conditions for sedge colonization or by the arrival of S. californicus to the island. Late MIS 3 was a very dry period, which led to peat oxidation and exposure shortly after 39 cal kyr BP.
During early MIS 2 (27.8–19 cal kyr BP), peat accumulation rates were low, apparently due to cold conditions, which will have ham-pered vegetation development. Evidence of the onset of deglaciation is concordant with Raraku Lake environmental development and was dated at 17.5 cal kyr BP at Rano Aroi, when peat accumulation rates began to increase again. The regional mid-Holocene dry period is well characterized at Rano Aroi from 5 to 2.5 cal kyr BP.
Our Rano Aroi record shows a development that is in accordance with regional paleoclimate records and illustrates the terrestrial re-sponse to the main Late Pleistocene phases in the Pacific region in terms of vegetation and paleo-hydrological change. The lack of sedi-mentary sequences that indicate Late Pleistocene precipitation over the remote Pacific region demands further studies into the correlation among circumpacific series to characterize the moisture distribution mechanisms from a regional perspective. Additional work is required to understand the interplay of ENSO patterns, SPCZ interglacial position and high-latitude responses over atmospheric features. Future work on the understanding of the Rano Aroi record and regional correlation will provide a unique opportunity to understand millennial-scale climate features over the southern Pacific Ocean.
Acknowledgments
This research was funded by the Spanish Ministry of Science and Ed-ucation through the projects LAVOLTER (CGL2004-00683/BTE), GEOBILA (CGL2007-60932/BTE) and CONSOLIDER GRACCIE (CSD2007-00067) and an undergraduate grant JAE (BOE 04/03/2008) to Olga Margalef. We thank CONAF (Chile) and the Riroroko family for the facilities provid-ed on Easter Island, Anders Noren and Erik Brown for their valuable guid-ance in the process of obtaining XRF data at the LacCore/Limnological Research Center (LRC) and Large Lake Observatory (LLO) (University of Minnesota) and Hilary Birks, Torstein Solhøy and Heinrich Schwartz for their help in macrofossil identification. We also thank John Couwenberg, Martin Theuerkauf, Annie Wojatschke, Almut Spangenberg, Dierk Michaelis and René Dommain for their help and contributions to the peat facies descriptions and peatland characterization during the stay of OM at the University of Greifswald.
References
Anderson, A., Chappell, J., Gagan, M., Grove, R., 2006.Prehistoric maritime migration in the Pacific Islands: an hypothesis of ENSO forcing. The Holocene 16 (1), 1–6. Aucour, A.-M., Bonnefille, R., Hillaire-Marcel, C., 1999.Sources and accumulation rates
of organic carbon in an equatorial peat bog (Burundi, East Africa) during the Holo-cene: carbon isotope constraints. Palaeogeography, Palaeoclimatology, Palaeoecol-ogy 150, 179–189.
Azizi, G., Flenley, J.R., 2008.The last glacial maximum climatic conditions on Easter Island. Quaternary International 184, 166–176.
Baker, P.E., Buckley, F., Holland, J.G., 1974.Petrology and geochemistry of Easter Island. Contributions to Mineralogy and Petrology 44, 85–100.
Baker, P.A., Rigsby, C.A., Seltzer, G.O., Fritz, S.C., Lowenstein, T.K., Bacher, N.P., Veliz, C., 2001. Tropical climate changes at millennial and orbital timescales on the Bolivian Altiplano. Nature 409, 698–700.http://dx.doi.org/10.1038/35055524.
Barber, K.E., Chambers, F.M., Maddy, D., 2003.Holocene palaeoclimates from peat stra-tigraphy: macrofossil proxy climate records from three oceanic raised bogs in England and Ireland. Quaternary Science Reviews 22, 521–539.
Bindler, R., 2006.Mired in the past—looking to the future: geochemistry of peat and the analysis of past environmental changes. Global and Planetary Change 53, 209–221. Birks, H.H., 2001.Plant macrofossils. In: Smol, J.P., Birks, H.J.B., Last, W.M. (Eds.), Track-ing Environmental Change UsTrack-ing Lake Sediments, vol. 3. Kluwer, Dordrecht, pp. 49–74.
Birks, H.H., Birks, H.J.B., 2006.Multiproxy studies in palaeolimnology. Vegetation Histo-ry and Archaeobotany 15, 235–251.
Blunier, T., Brook, E.J., 2001.Timing of millennial-scale climate change in Antarctica and Greenland during the last glacial period. Science 291, 109–112.
Butler, K., Prior, C.A., Flenley, J.R., 2004.Anomalous radiocarbon dates from Easter Island. Radiocarbon 46, 395–405.
Cañellas-Boltá, N., Rull, V., Sáez, A., Margalef, O., Giralt, S., Pueyo, J.J., Birks, H.H., Birks, H.J.B., Pla-Rabes, S., 2012.Macrofossils in Raraku Lake (Easter Island) integrated with sedimentary and geochemical records: towards a paleoecological synthesis. Quaternary Science Reviews 34, 113–126.
Clement, A.C., Peterson, L.C., 2008. Mechanisms of abrupt climate change of the last gla-cial period. Reviews of Geophysics 46.http://dx.doi.org/10.1029/2006RG000204. Conroy, J.L., Overpeck, J.T., Cole, J.E., Shanahan, T.M., Steinitz-Kannan, M., 2008.
Holo-cene changes in eastern tropical Pacific climate inferred from a Galápagos lake sed-iment record. Quaternary Science Reviews 27 (11–12), 1166–1180.
Couwenberg, J., De Klerk, P., Endtmann, E., Joosten, H., Michaelis, D., 2001. Hydrogenetische Moortypen in der Zeit– eine Zusammenschau (Hydrogenetic mire types in time—an overview). In: Succow, M., Joosten, H. (Eds.), Landschaftsökologische Moorkunde. (Landscape Ecology of Peatlands), Second edition. Schweizerbart, Stuttgart, pp. 399–403 (in German).
Damman, A.W.H., Tolonen, K., Sallantaus, T., 1992.Element retention and removal in ombrotrophic peat of Hådetkeidas, a boreal Finnish peat bog. Suo 43, 137–145. Danzeglocke, U., Jöris, O., Weninger, B., 2008. CalPal-2007 online.
http://www.calpal-online.de/(accessed 2009.05.03).
de Jong, R., Blaauw, M., Chambers, F.M., Christensen, T.R., de Vleeschouwer, F., Finsinger, W., Fronzek, S., Johansson, M., Kokfelt, U., Lamentowicz, M., Le Roux, G., Mauquoy, D., Mitchell, E.A.D., Nichols, J.E., Samaritani, E., van Geel, B., 2010. Cli-mate and peatlands. In: Dodson, J. (Ed.), Changing CliCli-mates, Earth Systems and Society. Springer, Dordrecht, pp. 85–121.
Dickinson, W.R., 2001.Paleoshoreline record of relative Holocene sea levels on Pacific islands. Earth-Science Reviews 55, 191–234.
Dommain, R., Couwenberg, J., Joosten, H., 2011.Development and carbon sequestration of tropical peat domes in south-east Asia: links to post-glacial sea-level changes and Holocene climate variability. Quaternary Science Reviews 30 (7–8), 999–1010.
Dumont, H.J., Cocquyt, C., Fontugne, M., Arnold, M., Reyss, J.-L., Bloemendal, J., Oldfield, F., Steenbergen, C.L.M., Korthals, H.J., Zeeb, B.A., 1998.The end of moai quarrying and its effect on Raraku Lake, Easter Island. Journal of Paleolimnology 20, 409–422.
Ehleringer, J.R., Cerling, T.E., Helliker, B.R., 1997.C4 photosynthesis, atmospheric CO2
and climate. Oecologia 112, 285–299.
Etienne, M., Michea, G., Díaz, E., 1982.Flora, vegetación y potencial pastoral de la Isla de Pascua. Boletín Técnico n° 47, Facultad de Ciencias Agrarias, Veterinarias y Forestales.Universidad de Chile, Santiago de Chile (in Spanish).
Flenley, J.R., King, S.M., 1984.Late Quaternary pollen records from Easter Island. Nature 307, 47–50.
Flenley, J.R., King, S.M., Jackson, J., Chew, C., Teller, J.T., Prentice, M.E., 1991.The Late Quaternary vegetational and climatic history of Easter Island. Journal of Quaterna-ry Science 6, 85–115.
Gaudig, G., Couwenberg, J., Joosten, H., 2006. Peat accumulation in kettle holes: bottom up or top down? Mires and Peat 1 (6), 1–16 (http://www.mires-and-peat.net/ map01/map_1_6.htm).
Genz, J., Hunt, T.L., 2003.El Niño Southern Oscillation and Rapa Nui prehistory. Rapa Nui Journal 17 (1), 7–14.
González-Ferran, O., Mazzuoli, R., Lahsen, A., 2004. In: Centro de Estudios Volcanológicos (Ed.), Geoloía del Complejo Volcánico Isla de Pascua Rapa Nui Santiago-Chile.1:30.000 Geol. map, (in Spanish).
Gorham, E., 1991.Northern peatlands: role in the carbon cycle and probable response to climatic warming. Ecological Applications 1, 182–195.
Gorham, E., Janssens, J.J., 2005.The distribution and accumulation of chemical elements infive peat cores from the mid-continent to the eastern coast of North America. Wetlands 25, 259–278.
Gossen, C., 2007.Report: the mystery lies in the Scirpus. Rapa Nui Journal 21 (2), 105–110. Grootjans, A.P., Adema, E.B., Bleuten, W., Joosten, H., Madaras, M., Janáková, M., 2006. Hydrological landscape settings of base-rich fen mires and fen meadows: an over-view. Applied Vegetation Science 9, 175–184.
Hanebuth, T., Stattegger, K., Grootes, P.M., 2000.Rapidflooding of the Sunda Shelf: a late-glacial sea-level record. Science 288, 1033–1035.
Haug, G.H., Hughen, K.A., Sigman, D.M., Peterson, L.C., Röhl, U., 2001. Southward migra-tion of the Intertropical Convergence Zone through the Holocene. Science 293, 1304–1308.http://dx.doi.org/10.1126/science.1059725.
Heirman, K., 2011.A Wind of Change': Changes in Position and Intensity of the Southern Hemisphere Westerlies During Oxygen Isotope Stages 3, 2 and 1. PhD Thesis Ghent University.
Heiser, C.B., 1974.Totoras, Taxonomy, and Thor, vol. 20 no. 2. Botanical Society of America, Inc.
Herrera, C., Custodio, E., 2008. Conceptual hydrogeological model of volcanic Easter Island (Chile) after chemical and isotopic surveys. Hydrogeology Journal. http://dx.doi.org/10.1007/s10040-008-0316-z.
Heusser, C.J., Heusser, L.E., 2006.Submillennial palynology and palaeoecology of the last glaciation at Taiquemo (50 000 cal yr, MIS 2–4) in southern Chile. Quaternary Science Reviews 25, 446–454.
Hong, Y.T., Wang, Z.G., Jiang, H.B., Lin, Q.H., Hong, B., Zhu, Y.X., Wang, Y., Xu, L.S., Leng, X.T., Li, H.D., 2001.A 6000-year record of changes in drought and precipitation in northeastern China based on a13
C time series from peat cellulose. Earth and Planetary Science Letters 185, 111–119.