Università degli Studi di Napoli
“Federico II”
Ph. D. in Chemical Sciences
XXX cycle
Increasing the Deposition Efficiency
Preface
This Ph. D. thesis summarizes the work carried out during the last three years in the field of the industrial physical chemistry. The theoretical background was complemented by collecting experience in the characterization of both thermodynamic and structural properties of the investigated colloidal systems through light and neutron scattering techniques. At the same time, the knowledge and the application of different chromatographic techniques allowed gaining expertise also in the field of the analytical chemistry.
The Ph. D. project was funded by Procter & Gamble (P&G) and Consorzio interuniversitario per lo Sviluppo dei Sistemi a Grande Interfase (CSGI), Sesto Fiorentino, Italy and supported by the Julich Center for Neutron Science (JCNS) and ISIS at the STFC Rutherford Appleton Laboratory, providing beam times for the experiments involving neutrons. Moreover, further experiments were performed in the department of Strategic Innovation & Technology located at P&G Brussels Innovation Center, located in Strombeek-Bever, Belgium.
1
Contents
Introduction ... 4
Chapter 1 – Polymer particle-based technologies ... 6
1.1 – An overview of polymer particle preparation protocols ... 6
1.2 – Increasing the deposition efficiency of active components: the current technologies at industrial level ... 9
1.3 – Vinyl alcohol-based technologies: an overview ... 13
1.4 – The Hofmeister effect ... 15
1.5 – The salting-out behavior exerted by sodium chloride ... 19
1.6 – The aggregation mechanisms: a theoretical insight ... 20
Chapter 2 – Experimental section ... 23
2.1 – Investigating the Hofmeister series: the choice of the salt ... 23
2.1.1 – Materials ... 23
2.1.2 – Sample preparation ... 24
2.1.3 – Characterization techniques ... 24
2.2 – Characterization of the aggregation process ... 25
2.2.1 – Materials ... 25
2.2.2 – Sample preparation ... 25
2.2.3 – Characterization techniques ... 26
2.3 – Structural characterization of polymer aggregates ... 27
2.3.1 – Materials and sample preparation ... 27
2.3.2 – Characterization techniques ... 28
2.4 – Investigation on polymer-surfactant interaction ... 29
2.4.1 – Materials ... 29
2.4.2 – Sample preparation ... 30
2.4.3 – Characterization techniques ... 31
2.5 – Fragrance segregation process ... 31
2.5.1 – Materials ... 31
2 2.5.3 – Characterization techniques ... 33 2.6 – Washing tests ... 34 2.6.1 – Materials ... 34 2.6.2 – Sample preparation ... 35 2.6.3 – Characterization techniques ... 39
Chapter 3 – A preliminary screening of the Hofmeister series: a model study ... 40
3.1 – Screening of different salts ... 40
3.2 – The choice of the salt ... 43
Chapter 4 – Rationalization of the polymer aggregation process in the presence of sodium chloride ... 44
4.1 – The choice of the polymers ... 44
4.2 – Aggregation properties of aqueous polymer solutions ... 45
4.3 – Sodium chloride effect on polymer behavior in solution ... 49
4.4 – Aggregation process in the presence of sodium chloride ... 53
4.4.1 – EVOH aggregation process ... 53
4.4.2 – PVA aggregation process ... 58
4.4.3 – A picture of the aggregation process ... 60
Chapter 5 – Structural characterization of polymer particles ... 62
5.1 – Determination of the aggregate structural parameters ... 62
5.1.1 – EVOH particles... 62
5.1.2 – PVA particles ... 66
5.2 – Investigation on mesoscopic length scales ... 73
5.2.1 – EVOH particles... 73
5.2.2 – PVA particles ... 78
Chapter 6 – The effect of surfactants on polymer aggregation and structural properties: a model study ... 82
6.1 – Surfactant characterization in aqueous solutions ... 82
6.2 – Aggregation process in the presence of surfactants ... 87
6.2.1 – NaCl effect on critical micellization concentration ... 87
6.2.2 – Aggregation properties of EVOH and PVA in the presence of surfactants ... 88
3
6.4 – General considerations ... 93
Chapter 7 – Fragrance segregation within the polymer particles ... 94
7.1 – Perfume Raw Material classification ... 94
7.2 – Aggregation process in the presence of Perfume Raw Materials ... 97
7.2.1 – Solubilization tests ... 97
7.2.2 – Characterization of the aggregation process in the absence of NaCl... 99
7.3 – Perfume Raw Material segregation ... 100
7.3.1 – GC-FID measurements ... 100
7.3.2 – GC-MS measurements ... 102
Chapter 8 – Washing tests: evaluating the technology efficiency ... 104
8.1 – Modification of the preparation protocol ... 104
8.1.1 – Speeding up the preparation protocol and the aggregation process ... 104
8.1.2 – Comparison between two preparation protocols ... 105
8.2 – Evaluation of the technology efficiency ... 109
8.2.1 – An overview of the tests ... 109
8.2.2 – Washing procedure and analysis approach ... 110
8.2.3 – Deposition tests... 111
8.2.4 – Release tests ... 113
8.2.5 – Product aging ... 115
Chapter 9 – Conclusions ... 116
9.1 – An easy, fast and cheap protocol for the preparation of vinyl alcohol-based particles ... 116
9.2 – Tunable aggregation and structural properties ... 116
9.3 – Surfactant-resistant polymer particles ... 117
9.4 – High segregation efficiency and fragrance deposition/release ... 117
9.5 – Final remarks and future perspectives ... 118
Appendices ... 119
A.1 – SLS data analysis ... 119
A.2 – DLS data analysis ... 121
4
Introduction
The aim of this project is the development of perfume deposition technologies for use in liquid detergents, which represent very complex mixtures of natural and synthetic molecules. Current fragrance carriers (such as melamine formaldehyde-based polymer capsules) present a good compatibility with the laundry detergent components and a high perfume loading efficiency. However, not all the perfume raw materials can be stably incorporated into the capsules because some of them (mainly the hydrophilic ones) easily leak out of the capsules by breakage and diffusion before the capsules deposit on the fabrics during the wash. Therefore, these perfume ingredients are not deposited effectively on the fabrics.
On these basis, our aim is the design of innovative perfume carriers with i) excellent stability in liquid detergent formulation and ii) improved deposition during product application. Among the possible candidates for the development of such a technology, vinyl alcohol-based copolymers, currently referred to as PVA (poly vinyl alcohol) or EVOH (poly ethylene-co-vinyl alcohol), represent a suitable tool to obtain a carrier system, which can be used for the purpose of this project thanks to the great stability of their aggregates in water. Moreover, particles formed by these copolymers are characterized by excellent transport properties: indeed, diverse vinyl alcohol-based systems have been already proposed as carriers in biomedical applications or environmental science for pollutant removal. An efficient procedure to obtain PVA or EVOH-based particles consists in promoting the aggregation of the chains by preparing a polymer solution and adding a certain quantity of a salt (i.e. NaCl) that is able to favor the salting-out process: this effect was already tested for another common water soluble polymer like PEG (polyethylene glycol).
In the following section (chapter 1) we present different examples of polymer particle-based technologies and their preparation protocols, giving more emphasis to the vinyl alcohol-based technologies and the salting-out method, which was
5
studied in this project. A detailed description of the materials and methods used for the preparation and the characterization of the investigated systems is given in the experimental section (chapter 2). The choice of the salt used to induce the salting-out process is presented (chapter 3). Consequently, the polymer aggregation process triggered by the presence of the salt and the structural properties of the obtained polymer particles are discussed (chapter 4 and chapter 5, respectively). A model compatibility study performed in the presence of polymer aggregates and two common surfactants employed in the final liquid detergent matrix is shown (chapter 6). The perfume segregation efficiency and the washing tests aimed at evaluating the technology efficiency are presented in chapter 7 and chapter 8, respectively. Finally, conclusions are summarized in chapter 9.
6
Chapter 1 – Polymer particle-based technologies
During the last years, an emerging interest has been devoted to the development of micro- and nano-structured materials for a wide range of applications in biomedicine, catalysis or environmental science. Specifically, soft polymer particles have been proposed as effective technologies to deliver target molecules with a precise function. Different protocols for the preparation of polymer-based delivery systems can be found in literature and the choice of a particular preparation method strictly depends on the final application of the developed technology. In this Ph. D. project, our attention was focused on the ion-specific effect on the macromolecule solubility, rationalized through the so-called Hofmeister series, which can be used as a tool to predict the polymer aggregation behavior in solution. In particular, the polymeric aggregates prepared through the addition of a salt to a polymer solution to be used as an effective carrier system for increasing the deposition of perfume ingredients on fabrics. In this chapter, we give an overview of the methods aimed at preparing polymer particles, as well as a focus on the technologies which are currently in use at industrial level for enhancing the deposition efficiency of active components in laundry products. Some examples of application of vinyl alcohol-based copolymers, which were investigated in this project, are also shown. Moreover, we present some general theories concerning the Hofmeister effect, as well as a description of the aggregation mechanisms that lead to the particle formation, in order to provide a theoretical basis to support this study.
1.1 – An overview of polymer particle preparation protocols
Polymer particles can be prepared through many different preparation protocols, which can be usually divided into two groups: those based on the polymerization of
7
monomers and those taking advantage of preformed polymers, as clearly summarized in fig. 1.1.1.1
At the same time, these two methods can be classified into two categories: i) two-steps procedures involving the preparation of an emulsification system followed by formation of particles in the second step of the process and ii) one-step procedures where emulsification is not required for the particle formation.2 Other methods have also been reported recently and they are based on spray-drying strategies3,4, supercritical fluid technologies5,6 or piezoelectrical ways7.
Figure 1.1.1 – Schematic representation of the preparation methods of polymer
particles.
Concerning the first category, emulsions are defined as a mixing of two or more totally or partially immiscible liquids with or without a surface active agent. They are typically classified according to the size of the droplets: microemulsion, containing thermodynamically stable droplets with a diameter ranging from 10 to 100 nm and miniemulsion or macroemulsion, which are not stable and that contain droplets with a diameter ranging from 100 to 1000 nm and above 1000 nm, respectively.8,9,10 Emulsions can be obtained through low-energy and high-energy emulsification techniques. Among the first ones, we can find the spontaneous emulsification11,12, which consists in promoting the solubilization of the oily
8
component into a water-soluble solvent and then in adding the obtained solution into the aqueous phase. Such a technique is also described as solvent displacement method13, well known as “Ouzo effect”. Other routes are the emulsion inversion point14 and the inversion temperature15 methods. Among the second ones, we can find the emulsification with rotor-stator devices16, sonication17,18 and microfluidic techniques19,20. After the preparation of the emulsion, the formation of polymer particles can be carried out by following different protocols. The solvent evaporation method consists in dissolving the polymer into volatile solvent like dichloromethane, chloroform or ethyl acetate. In a second step, at least the 90% of solvent is removed through fast evaporation and then the residual solvent is evacuated through slow evaporation. Poly(lactic-co-glycolic acid) (PLGA)-, poly(lactic acid) (PLA)- and polyethylene glycol (PEG)-based particles were successfully prepared through this technique.21,22,23 The solvent diffusion method consists in promoting the formation of a two-phase system, followed by emulsification and dilution with water with the consequent formation of polymeric particles from the emulsion. PLA, PLGA, but also gelatin or chitosan particles were synthesized through solvent diffusion24,25,26, with poly-vinyl alcohol (PVA) typically employed as a steric stabilizer. Salting-out is another process that generally requires the use of a solvent miscible with water (usually acetone), whose solubility is modified by adding high amounts of salt or sucrose. The emulsion is formed with a polymer dissolved in the solvent droplets and particle precipitation is induced by adding a large quantity of water that drops the salt concentration. Typical salts used are magnesium chloride27,28 or calcium chloride29, even though salting-out can be exerted by preparing a saturated solution of PVA30, which acts as thickener and emulsion stabilizer. A further process is the gelation of emulsion droplets, which is obtained by either cooling down the previously prepared nanoemulsion31 or inducing ionic gelation32 through the addition of divalent cations (like calcium). Conventional emulsion33,34, surfactant-free emulsion35,36, miniemulsion37,38, microemulsion39,40, interfacial41 and controlled/living radical42
9
polymerization are other traditional protocols used for the preparation of polymer particles.
As regards the second category, nanoprecipitation is one of the easiest, most reproducible and economic routes to produce nanoparticles using preformed polymers. In this method only the polymer, the solvent and the non-solvent for the polymer are required: the polymer can be either synthetic or natural, typical polymer solvents are ethanol, acetone, hexane and a common non-solvent phase is either a single component or a mixture of non-solvents for the polymer, with or without surfactants. The mechanism of particle formation is similar to that one already described for the solvent displacement technique. Such a method can be chosen for a wide range of polymers43,44 and also non-polymeric compounds45. Dialysis46 is another common method very similar to the one previously described, with the presence of additional tools such as dialysis tubes or membranes provided with specific molecular weight cutoffs. Desolvation47 is also very similar to nanoprecipitation and consists in promoting the precipitation of the polymer through addition of salts, alcohols or solvents in solution of macromolecules. Self-assembly and gelation are two other processes used to obtain polymer particles in an easy way. As an example, complexation of polyelectrolytes is a spontaneous association phenomenon involving charged macromolecules that are able to assemble themselves to form complexes which can be swollen by water. Nucleic acids48, alginate49 or chitosan50 are commonly used.
1.2 – Increasing the deposition efficiency of active components: the
current technologies at industrial level
From an industrial viewpoint, the choice of a proper technology implies considering different aspects like the cost of raw materials and process, the possibility to scale-up the preparation protocol and the compatibility with the other
10
components of the matrix where the technology is introduced. Therefore, a limited number of processes and materials can be taken into account.
Concerning the increase of deposition of active components like enzymes, perfumes, bleaching agents or antioxidants, many different technologies have been proposed and have been claimed. Generally, industrial technologies are designed to be the most versatile possible, covering a wide range of applications. However, in this paragraph we draw our attention on the delivery systems for perfume additives, since they represent the target molecules of this research project.
Stabilization and fragrance deposition increase can be achieved through the use of silicone pellets51, perfume-impregned macroparticles52 or powdery solids53. In most of these cases, it is possible to obtain a suspension rather than a homogeneous system. Alternatively, liquid formulations can be enclosed within pouches where the perfume is contained in the pouch core.54,55 Also solid polymer matrices made of polypeptides or polyelectrolytes56, as well as of silicone, silicon-wax or cellulose57 have been claimed: in this case, the most hydrophobic and less volatile fragrances are dispersed within the matrix, that allows protecting the perfume from emulsification. Gel systems containing fragrances58,59,60, able to release the active component upon external stimuli have also been proposed: natural polymers frequently used are carrageenan gum, gellan gum, Arabic gum, pectin, starch, whereas the most common synthetic polymers are poly(propylene glycol) esters, polyacrylates or poly-vinyl alcohol.
Even though some of the previous inventions can be used in liquid detergent matrices, the most successful technologies currently in use in laundry products are the polymer capsules, i.e. particles whose structure is usually characterized by a polymeric shell and a core containing perfume. Ethylene vinyl copolymers, as well as PVA, or poly-methyl methacrylates, polystyrene, ethyl cellulose, poly-vinyl pyrrolidones, poly-acrylic acid or starches have been used for designing the polymeric shell.61,62,63,64,65,66
11
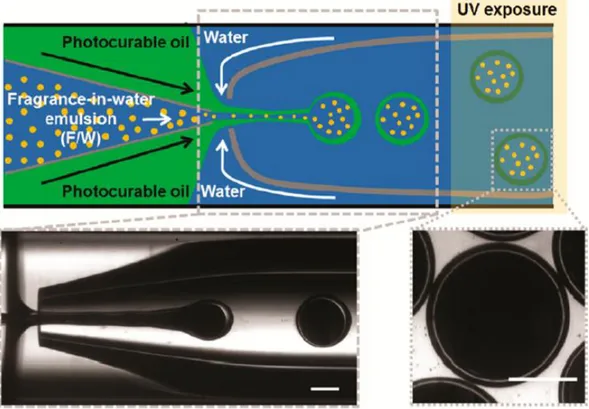
Also in literature it is possible to find many different examples of fragrance containing capsules prepared by following distinct protocols. Peppermint oil was successfully encapsulated through preliminary emulsification and consequent in situ polymerization through the use of a melamine-formaldehyde polymer.67 Optical and scanning electron micrographs of the obtained particles are shown in fig. 1.2.1. Vanillin was enclosed within polysulfone microcapsules prepared through the solvent displacement method.68 Also α-pinene was encapsulated within acrylate-based polymers by miniemulsification through sonication followed by free radical polymerization of the monomers.69 A blend of hydroxypropyl methylcellulose, PVA and ethylcellulose was used to prepare capsules in the presence of (1R)-camphor, (3R)-citronellal, eucalyptol, D-limonene, (1R, 2S, 5R)-menthol and 4-tert-butylcuclohexyl salicylate by following the solvent displacement method supported by dialysis.70 Again, α-pinene was enclosed upon emulsification and encapsulation through the use of a glass capillary microfluidic device71: in particular, the photocurable oil in the middle phase was in situ polymerized by UV exposure, as shown in fig. 1.2.2.
Figure 1.2.1 – Image photographs of melamine-formaldehyde resin microcapsules
containing peppermint oil. Panel A: optical micrograph (× 100). Panel B: scanning electron micrograph (× 3500).67
12
Figure 1.2.2 – Schematic illustration of the glass capillary microfluidic device for
preparing polymer microcapsules enclosing a preformed fragrance-in-water (F/W) emulsion. Bottom optical microscope image shows the generation of triple emulsion drops containing multiple internal fragrance drops. Upon UV irradiation, the photocurable oil in the middle phase polymerizes to form a polymeric shell. Scale bar represents 200 μm.71
The main advantages of the polymer capsules are the high compatibility with the laundry detergent components and the high perfume loading efficiency (up to 30% w/w of active component). However, the main drawback of this technology is that not all perfume components remain within the capsules since they can leak out due to various mechanisms (such as diffusion or capsule breakage) before the product is used. Those perfume ingredients are then emulsified by the surfactants contained in the detergent matrix. A promising alternative to the rigid capsules are the soft capsules, whose structure is composed by a soft polymer matrix enclosing perfume
13
surrounded by the surfactants contained in the laundry detergent that are able to self-assemble to form spheroidal particles. In this case, the polymer matrix is not cross-linked and the mechanical resistance is higher. Therefore, soft particle-based technologies may represent a successful improvement of the current technologies.
1.3 – Vinyl alcohol-based technologies: an overview
As already shown in the previous paragraphs, vinyl alcohol-based copolymers, such as PVA or poly-ethylene-vinyl alcohol (EVOH) are among the most common species used for preparing polymer particles. This is thanks to their non-toxicity, non-carcinogenicity, good biocompatibility and desirable physical properties such as rubbery or elastic nature and high degree of swelling in aqueous solutions.72,73 Moreover, these copolymers are commercially available and can be obtained at low cost, which are two important factors to consider from an industrial point of view. It is possible to find many examples of vinyl alcohol-based technologies in literature and several preparation protocols. A model protein drug, bovine serum albumin (BSA), was successfully incorporated into injectable PVA hydrogel nanoparticles prepared by mixing a BSA and a PVA solution and by adding silicon oil to an aqueous BSA and PVA solution.72 Then, the obtained mixture was homogenized in order to obtain a water-in-oil emulsion, which was frozen through multiple freeing-thawing cycles resulting in the conversion of the emulsion to a suspension of PVA hydrogel particles extracted by using acetone and separated by means of filtration. Fig. 1.3.1 shows a scanning electron micrograph of the obtained particles, with a radius of about 100 nm. Capillary electrophoresis was then used in order to check the release efficiency of BSA, which was found to be about 95% at 37 °C.
14
Figure 1.3.1 – A scanning electron micrograph of the PVA hydrogel nanoparticles
showing the shape and the surface characteristics.72
Acrylamine-functionalized PVA particles for would healing application were prepared through UV cross-linking. The model drug used for this study was soybean trypsin inhibitor, whose maximum release was about 76% in optimized conditions.74 PVA particles can be also prepared through chemical cross-linking. Glutaraldehyde is the most common molecule used for this purpose. As an example, PVA microspheres were prepared via inverse suspension-chemical cross-linking method.75 In this study, the effect of stirring speed, cross-linker amount, hydrochloric acid concentration and oil-to-water volume ratio on microsphere diameter were taken into account. EVOH functional nanofibers for pollutant removal with an average radius of 260 nm were successfully synthesized through melt-blending extrusion of immiscible blends.76 In a second step, layer deposition technology was used in order to obtain films formed by the previously prepared EVOH fibers. The resulting membranes were then tested for Cr(VI) adsorption. EVOH foams in the presence of propylene carbonate as a cross-linker were prepared by a high-temperature thermal treatment that allowed the formation of a gel phase.77 In this case, among the different parameters considered, also the effect
15
of the propylene carbonate amount on the foam expansion ratio was taken into account and it was found that such a parameter reaches a maximum value at intermediate cross-linker concentration, as shown in fig. 1.3.2.
Figure 1.3.2 – Scanning electron micrographs of EVOH foams with different
propylene carbonate contents. Image A: 2 parts per hundred resin (phr). Image B: 6 phr. Image C: 10 phr.77
In this Ph. D. project, we decided to investigate about an easy and cheap particle preparation protocol, which differs from the previous ones shown in this paragraph. This method is the salting-out, already described in paragraph 1.1. Such a protocol does not require the use of chemical cross-linkers and does not modify the structure of the vinyl alcohol-based copolymers, preserving their original properties of biocompatibility and biodegradability. The theoretical bases that support this preparation method are discussed in detail in the following paragraphs.
1.4 – The Hofmeister effect
The presence of different ions affects the solubility of macromolecules in solution.78,79,80,81 In his first pioneering study78 Franz Hofmeister rationalized the ion-specific effect on the protein solubility, demonstrating that the influence of the
16
salt on the protein conformation is strictly dependent on the nature of the ions. This phenomenon was rationalized through the so-called Hofmeister series82,83,84, shown in fig. 1.4.1. Then, it was shown that this effect is more universal and the Hofmeister series was used to predict the physiochemical properties of many phenomena that occur in solution, like pH variation85, protein crystallization86, enzyme activities87,88, optical rotation of aminoacids89, emulsion stability90, swelling and deswelling of hydrogels91 and polymer solubility92.
Figure 1.4.1 – Representation of the Hofmeister series. The species on the right are
known as chaotropes and are able to increase the macromolecule solubility in water (salting-in effect), whereas the species on the left are known as kosmotropes and decrease the macromolecule solubility in water, leading to the salting-out phenomenon.
At the beginning, it was supposed that the ion specificity was intimately related to the specific interactions that ions have with water. This is reflected in different easily measurable physicochemical parameters of aqueous salt solutions, i.e. conductivity and viscosity.93 As regards the conductivity in solution, it was originally hypothesized that the ionic electrochemical mobility in solution was high for small ions and low for big ions.94 However, the trend was the opposite of what was expected, since the actual effective size of ions in water is very different for that in a crystal. This is due to the higher degree of hydration of the smaller ions (e.g. Li+, F-), which are highly polarizable and able to bear several water molecules while migrating in solution. As a consequence, they move slowly compared with
17
bigger and poorly hydrated ions. Concerning the viscosity of salt solutions, it was found that such a parameter is related to the nature of the salts according to the following equation95: Bc c A 0 equation 1.4.1
where η/η0 is the relative viscosity, A is an electrostatic parameter about equal for
all salts and B is an ion-specific parameter known as the Jones Dole viscosity coefficient. Therefore, it was supposed that the water structure, formed by a dynamic fluctuation of the hydrogen bond network, was affected by the ion nature, thus by the B value. The ions with a positive value of this parameter increased the viscosity of aqueous solutions, making order in the water structure, whereas those with a negative B value decreased the viscosity, breaking the water structure order. The former were called kosmotropes, the latter chaotropes. On the basis of this classification, the Hofmeister’s experiment on salt induced protein precipitation can be clearly explained: kosmotropic anions withdraw the water molecules from the hydration shell of proteins, reducing their solubility and forcing the aggregation, i.e. the salting-out phenomenon, whereas chaotropic anions act with the opposite mechanism, leading to the salting-in phenomenon.96
However, there are several observations that demonstrate that the mechanism at work is more complicated than that one presented and there are still many open questions that are not solved. Firstly, whereas the kosmotropic behavior of anions can be clearly explained by the water withdrawing power mechanism previously discussed, the salting-out behavior of chaotropic cations still remains a doubt. Secondly, it was found in literature that the Hofmeister series was reversed in order.97,98 This is due to the fact that both specific surface hydration–ion hydration interactions and hydrated ion–bulk water interactions are involved. Thirdly, it was originally thought that the Hofmeister effects occurred at high salt concentrations, typically from 0.5 to 3 M99, but it was then shown that the ion-specific effect has a strong impact at definitely lower salt concentrations (from 0.1 to 0.15 M),
18
reflecting the key role of the ion specificity in most biochemical mechanisms.100 Finally, some experiments have demonstrated that ions do not affect hydrogen bonding of water beyond their first solvation shells.101 Therefore, ions do not affect the long-range water structure.
Many macromolecules show ion-specific aggregation and changes in phase transition temperature with ion types. Let us consider a model macromolecular surface, shown in fig. 1.4.2, and let us assume that the macromolecular surface does not undergo direct ion-induced structural changes.102
Figure 1.4.2 – Schematic representation of two macromolecules in ion solutions.
Ions are drawn as spheres.
Instead, at the macromolecular surface, the surface ion concentration and the bulk ion concentration can be different, and there can be an excess charge density accumulated at the macromolecular surface. When two surfaces approach closer than the interfacial depth w1, where the surface ion concentration deviates from the
bulk ion concentration, this will induce depletion interaction, while at the same time any excess charge at one macromolecular surface will also interact with the excess charge at the other macromolecular surface electrostatically. As a consequence, the macromolecules feel the attractive force when ions are depleted
19
from the macromolecular surface, which is proportional to the concentration difference between the bulk ion concentration and the surface ion concentration. At the same time, when the surface ion concentration becomes significant, the excess charge density at the macromolecular surface induces electrostatic repulsion. Therefore, the aggregation phenomenon is governed by two opposite forces: the depletion attraction that favors the salting-out and the excess charge repulsion that favors the salting-in, i.e. the homogeneous distribution of the macromolecules in solution. The ions ranked higher in the Hofmeister series, such as Cl-, have smaller ion concentrations at the surface compared with ions ranked lower, such as Br- and I-. As a consequence, both depletion attraction and excess charge repulsion act in a concerted way to favor macromolecular aggregation.102
1.5 – The salting-out behavior exerted by sodium chloride
As clearly shown in the previous paragraph, some salts are able to trigger the aggregation of macromolecules in solution. In particular, for the present study, sodium chloride was used in order to induce the formation of the EVOH and PVA-based particles. The reason will be explained in chapter 3, where experimental data supporting this choice are presented.
Furthermore, it has been already shown in literature that sodium chloride, whose position in the Hofmeister series is within the salting-out behavior, is able to favor the aggregation of many different hydrophilic polymers103,104. Indeed, the presence of NaCl above a threshold concentration which depends on the nature of the polymer may dramatically influence the interaction between the solvent and the solute, as shown for both natural (e.g. lysozyme105) and synthetic macromolecules (e.g. poly(styrene-b-sodium acrylate)106). From a thermodynamic point of view, this happens due to the change of two fundamental parameters that are involved in the aggregation process: the second virial coefficient107 and the interaction
20
parameter108 that describe the polymer-solvent and the polymer-polymer interaction, respectively. Light scattering techniques, i.e. Static Light Scattering and Dynamic Light Scattering, are the method of choice for the determination of these parameters. At the same time, the above-mentioned techniques can be used to determine fundamental structural parameters, like the radius of gyration or the molar weight of the scattering particles, whose knowledge allows shedding light on the kind of regime that governs the aggregation process.
1.6 – The aggregation mechanisms: a theoretical insight
The most widely considered form of colloid aggregation is that which begins with a suspension of monodisperse particles. Upon aggregation, these particles collide due to their Brownian motion and stick together irreversibly to form rigid clusters. The clusters themselves continue to diffuse, collide and form yet larger clusters, resulting in a polydisperse mass distribution. This process is called cluster-cluster aggregation, and is a non-equilibrium, kinetic growth process. Both the aggregation kinetics and the shape of the cluster mass distribution are intrinsically related to the structure of the clusters that are ultimately formed. A complete characterization of this aggregation process must include a full description of both the structure of the clusters, as well as the shape and time evolution of the cluster mass distribution.109 Two different regimes of colloid aggregation have been identified. The first occurs when the aggregation rate depends only on the time between the collisions of the particles due to their diffusion and is called diffusion limited aggregation (DLA).109 The second occurs when the reaction rate of two particles is much slower than the collision rate, so that a large number of collisions are necessary before two particles can stick together, and is called reaction limited aggregation (RLA).110
A kinetic study on the evolution of the cluster mass over time allows determining which regime governs the aggregation process. The time dependence of the cluster
21
mass can be determined by means of the Smoluchowski equations111. For a DLA process, a linear dependence is predicted and the relation between cluster mass and time can be represented as follows:
1 0 t t M equation 1.6.1 where 0 0 8 3 TN k V t B
with M the average cluster mass, t the aggregation time, η the
viscosity of the fluid, T the temperature and N0/V the initial particle concentration.
For a RLA process, an exponential dependence is predicted:
0 exp t t M equation 1.6.2
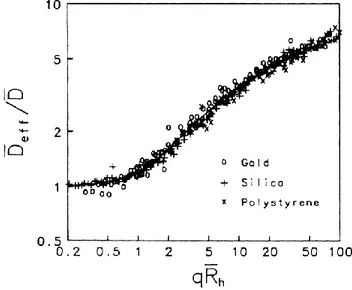
From the analysis of Light Scattering data collected for three different colloidal systems (gold, silica and polystyrene latex nanoparticles) it was finely demonstrated that both kinds of regime are universal and independent on the nature of the cluster. This was clearly presented through the construction of master curves where the data from all investigated systems are reported, showing an excellent superposition of the different scaled datasets.109,110
An example of master curve obtained from Dynamic Light Scattering data is shown in fig. 1.6.1. In particular, experimental data from the three different colloidal systems were represented by scaling the average effective diffusion coefficient through the use of a constant, i.e. the value of diffusion coefficient at null scattering vector. Then, this ratio was plotted as a function of the product between the scattering vector and the hydrodynamic radius.
In the case of soft polymers, such as elastomers with glass-transition temperature significantly lower than room temperature, upon aggregation they may deform or even coalesce as a result of polymer chain inter-diffusion or viscous flow. Due to
22
the coalescence, the particle identity within a cluster is lost, that is, all of the spherical primary particles merge to form a larger spherical particle.
Figure 1.6.1 – Master curves obtained independently for gold, silica and
polystyrene latex nanoparticles for RLA.110
Once coalescence occurs between two particles, even though it is a physical process owing to the inter-diffusion and anchoring of the polymer chains, the two particles can permanently stick together and are difficult to separate. If the coalescence of particles within a cluster can be controlled to a desired degree through physical gelation, a permanent gel can be directly obtained with desired structures.112
23
Chapter 2 – Experimental section
The design of a novel technology for applications in laundry products implies a deep study that starts from the choice of a proper preparation protocol. In this project, we drew our attention on the salting-out phenomenon, which may occur when either natural or synthetic macromolecules are present in solution together with salts. The polymer aggregation behavior depends on the nature of the kosmotropic species used in order to favor the aggregation process, on the polymer-polymer and the polymer-solvent interactions, as well as on the effect exerted by all the components present in complex mixtures like surfactants and additives (i.e. perfumes). We performed a study aimed at increasing the number of components of the investigated systems gradually, starting from a binary solution containing just polymer and water until reaching a complex mixture containing polymer, salt, surfactant, additives and solvents. In particular, in order to rationalize the role of each species, as a first step we needed to study the chemico-physical properties of many different systems containing a limited number of components. As a second step, we focused our attention on the synergic effect of all components shedding light on possible interactions among them. In this chapter, the materials and methods used for the preparation of all these solutions are reported, as well as the sample preparation procedure. Moreover, the protocols and the procedures followed to design the technology for the final application are described.
2.1 – Investigating the Hofmeister series: the choice of the salt
2.1.1 – Materials
Poly-vinyl alcohol (PVA) +99% hydrolyzed, mass average molecular weight 85000 ÷ 124000 g mol-1, sodium chloride (NaCl, purity ≥ 99%, AR grade), sodium thiocyanate (NaSCN, purity ≥ 99.9%), potassium chloride (KCl, purity ≥ 99.0%)
24
and calcium chloride (CaCl2, purity ≥ 96.0%) were purchased from Sigma Aldrich,
Milano (Italy). All aqueous solutions were prepared by using twice distilled Milli-Q water.
2.1.2 – Sample preparation
A PVA stock solution was prepared by weighing the polymer and water into a glass vial. The vial was placed into a controlled temperature bath at 85 °C and the solution was kept under stirring at 700 rpm for 4 hours. The obtained solution was kept at room temperature (about 20°C) for 1 hour. Stock salt solutions at different concentrations were prepared by adding the proper quantities of salt and water into a vial. In order to avoid the presence of dust particles, all solvents were filtered by using 0.20 μm filters. PVA stock solution was filtered, since a small amount of polymer was not completely solubilized. About 2 g of solution were used for determining the PVA concentration through Total Organic Carbon (TOC) analysis. For Dynamic Light Scattering measurements, the samples were prepared by diluting a stock PVA 2% w/w solution with water and/or a stock salt 4.5 mol kg-1 solution.
2.1.3 – Characterization techniques
TOC analysis was performed by splitting the amount of PVA solution used for the analysis in two parts. A first aliquot of solution was treated with phosphoric acid so as to transform all the inorganic carbon into CO2. A second aliquot of solution was
injected into a combustion chamber at 700 °C in order to transform all the carbon (both inorganic and organic) into CO2. An IR spectrophotometer was used for
determining the concentration of carbon dioxide. Then, the TOC was determined by subtracting the carbon concentration obtained in the acidification step from the carbon concentration obtained in the combustion step.
25
Dynamic Light Scattering (DLS) measurements were carried out by using a home-made instrument composed by a Photocor compact goniometer, a SMD 6000 Laser Quantum 50 mW light source operating at 532.5 nm, a photomultiplier (PMT-120-OP/B) and a correlator (Flex02-01D) from Correlator.com. All measurements were performed at 25 °C with the temperature controlled through the use of a thermostat bath. We measured the scattering intensity at fixed scattering angle of 90°.
2.2 – Characterization of the aggregation process
2.2.1 – Materials
Poly-ethylene-vinyl alcohol (EVOH) HR-3010 resin (purity > 97%) was purchased from Kuraray, Chiyoda, Tokyo (Japan). Poly-vinyl alcohol (PVA) +99% hydrolyzed, mass average molecular weight 85000 ÷ 124000 g mol-1, sodium chloride (NaCl, purity ≥ 99%, AR grade) and dideuterium water (D2O, 99.9% atom
D) were supplied by Sigma Aldrich, Milan (Italy). All aqueous solutions were prepared by using twice distilled Milli-Q water with the only exception of samples for neutron scattering experiment where D2O was used.
2.2.2 – Sample preparation
Stock polymer and NaCl solutions were prepared as described above.
For Dynamic Light Scattering measurements on solutions containing EVOH, the samples were prepared by diluting a stock EVOH 2% w/w solution with water and/or a stock NaCl 2.3 mol kg-1 solution. We analyzed a 1% w/w salt-free polymer solution and 15 samples at 5 different EVOH concentrations (0.70% w/w, 0.85% w/w, 1.00% w/w, 1.15% w/w and 1.30% w/w) and 3 different NaCl concentrations (0.65 mol kg-1, 0.75 mol kg-1 and 0.85 mol kg-1). For PVA we followed the same protocol described for EVOH. The samples were prepared by
26
diluting a stock PVA 2% w/w solution with water and/or a stock NaCl 4.5 mol kg-1 solution. In this case, the polymer concentration was kept constant (1% w/w) and 5 different NaCl concentrations (1.500 mol kg-1, 1.625 mol kg-1, 1.750 mol kg-1, 1.875 mol kg-1 and 2.00 mol kg-1) were studied.
The samples prepared for Small Angle Neutron Scattering measurements on the EVOH solution were prepared by following the same procedure shown for the samples analyzed through Dynamic Light Scattering by using a mixed solvent, so as to obtain a final solvent weight ratio D2O/H2O of 80/20. Such ratio was chosen
in order to obtain a good contrast between the polymer and the solvent keeping a reasonable EVOH solubility. We prepared a free-salt sample containing EVOH at 1% w/w. For PVA, D2O was chosen as a solvent and a sample at PVA 1% w/w was
prepared.
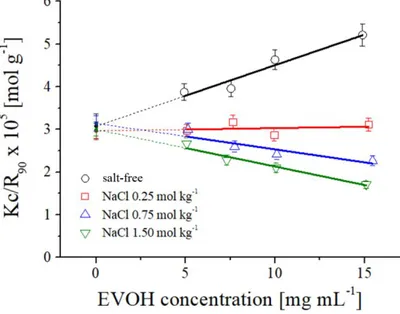
For Static Light Scattering measurements on solutions containing EVOH, the samples were prepared by diluting a stock EVOH 2% w/w solution with water and/or a stock NaCl 4.5 mol kg-1 solution. We studied 4 sets of samples at different NaCl concentrations: 0 mol kg-1 (i.e. salt-free samples), 0.25 mol kg-1, 0.75 mol kg-1 and 1.50 mol kg-1. For each set, 4 different EVOH concentrations were investigated (0.50% w/w, 0.75% w/w, 1.00% w/w and 1.50% w/w). For PVA the same procedure described for EVOH was followed, with the only exception that the investigated NaCl concentrations were 0 mol kg-1, 0.50 mol kg-1, 1.00 mol kg-1 and 2.00 mol kg-1. For each set, 4 different PVA concentrations were investigated (0.25% w/w, 0.50% w/w, 0.75% w/w and 1.00% w/w).
2.2.3 – Characterization techniques
Static Light Scattering (SLS) and Dynamic Light Scattering (DLS) measurements were performed by using the same instrument described above. We measured the scattering intensity at fixed scattering angle of 90°.
27
The refractive indexes of all solutions studied through SLS were measured by using an Abbe refractometer (Atago® NAR-3T) operating at 25°C by dropping 100 μL of solution between the illuminating and the refracting prisms. Each measurement was repeated three times and the average value of refractive index was calculated.
Small Angle Neutron Scattering (SANS) measurements were performed at 25 °C with the KWS-2 diffractometer operated by Julich Centre for Neutron Science at the FRMII source located at the Heinz Maier Leibnitz Centre, Garching (Germany). For all the samples, neutrons with a wavelength of 5 Å and Δλ/λ ≤ 0.2 were used. A two-dimensional array detector at two different wavelength (W)/collimation (C)/sample-to-detector (D) distance combinations (W 5 Å/C 8 m/D 2 m and W 5 Å/C 8 m/D 8 m) measured neutrons scattered from the samples. These configurations allowed collecting data in a range of the scattering vector modulus q between 0.08 Å−1 and 0.4 Å−1 for the salt-free samples containing only polymer at 1 % w/w.
2.3 – Structural characterization of polymer aggregates
2.3.1 – Materials and sample preparation
The same materials presented in paragraph 2.2.1 were used. Stock polymer and NaCl solutions were prepared as described above.
For Static Light Scattering measurements on EVOH aggregate solutions, 3 sets of 5 samples at constant NaCl concentration and different polymer concentrations were prepared by diluting a stock EVOH 1% w/w aggregate solution with a NaCl stock solution of the same concentration. We studied 3 different NaCl concentrations: 0.65 mol kg-1, 0.75 mol kg-1 and 0.85 mol kg-1. At each NaCl concentration, 5 different EVOH concentrations (0.20% w/w, 0.40% w/w, 0.60% w/w, 0.80% w/w and 1.00% w/w) were investigated. Samples containing PVA were prepared by
28
diluting a stock PVA 1% w/w aggregate solution with a NaCl stock solution of the same concentration. We studied 5 different NaCl concentrations: 1.500 mol kg-1, 1.625 mol kg-1, 1.750 mol kg-1, 1.875 mol kg-1 and 2.000 mol kg-1. At each NaCl concentration, 5 different PVA concentrations (0.20% w/w, 0.40% w/w, 0.60% w/w, 0.80% w/w and 1.00% w/w) were investigated.
For Small Angle Neutron Scattering measurements on EVOH solution, 3 samples at constant EVOH concentration (1% w/w) and 3 different NaCl concentrations (0.45 mol kg-1, 0.55 mol kg-1 and 0.65 mol kg-1) were prepared by using a mixed solvent so as to obtain a final solvent weight ratio D2O/H2O of 80/20. For PVA, 3
samples at constant PVA concentration (0.85% w/w) and at 3 different NaCl concentrations (1.50 mol kg-1, 1.75 mol kg-1 and 2.00 mol kg-1) were prepared by using D2O as a solvent.
2.3.2 – Characterization techniques
Cryogenic Transmission Electron Microscopy (Cryo-TEM) was used to study the microstructure of the EVOH aggregates in the presence of NaCl. The EVOH samples were vitrified by using a standard vetrification robotic system (Vitrorobot™ Mark IV by FEI™) at 25 o
C and 100% relative humidity. A sample drop of 1-2 μL was loaded on a carbon-coated film with a woven pattern supported on a copper grid (standard 200-mesh TEM grids by Electron Microscopy Science). Once the sample was loaded on the carbon grid, the drop was rapidly blotted in order to remove any sample excess from the grid. Following the loading and blotting, the grid was quenched into clean liquid ethane and as result a thin layer of vitrified EVOH sample was obtained. The samples were then rapidly placed into a cryogenic holder in the presence of liquid nitrogen (N2) at a temperature below
-170 oC to maintain the vetrification and avoid any structural change during data collection. The microscope used is the FEI™ Tecnai G2 Sphera, which was held with an accelerating voltage of 200 kV. The EVOH samples were observed in a
29
low-dose mode to minimize radiation damages. Sample images were taken with a digital camera and analyzed with Gatan Digital Micrograph software.
Transmission Electron Microscopy (TEM) images for PVA were collected by using a JEM-2100 Plus Transmission Electron Microscope located at the department of Chemistry of Texas Christian University.
Static Light Scattering (SLS) and Dynamic Light Scattering (DLS) measurements were carried out by using the same instrument described above. In the case of SLS, we measured the scattering intensity at different scattering angles: 60°, 75°, 90°, 105° and 120°, in the case of DLS, at fixed scattering angle of 90°.
The refractive indexes of all solutions studied through SLS were measured by using the instrument described above.
Small Angle Neutron Scattering (SANS) measurements were performed by using the same instrument described above. In this case, a two-dimensional array detector at three different wavelength (W)/collimation (C)/sample-to-detector (D) distance combinations (W 5 Å/C 8 m/D 2 m, W 5 Å/C 8 m/D 8 m, and W 5 Å/C 20 m/ D 20 m) measured neutrons scattered from the samples. These configurations allowed collecting data in a range of the scattering vector modulus q between 0.002 Å−1 and 0.4 Å−1. For the sample at higher NaCl concentration, we also used neutrons with a wavelength of 10 Å and Δλ/λ ≤ 0.2 and the same wavelength (W)/collimation (C)/sample-to-detector (D) distance combination reported above, in order to extend the experimental profile at lower values of the scattering vector.
2.4 – Investigation on polymer-surfactant interaction
2.4.1 – Materials
EVOH, PVA, NaCl and D2O, whose characteristics are reported in paragraph 2.2.1,
were used. A mixture of non-ionic ethoxylated surfactants (Lorodac 7-24, traded as C12-C14 ethoxylated alcohols, 100% active component) was supplied by Sasol,
30
Antwerp, Belgium. Sodium Laureth Sulfate (SLES, 70% active component) was supplied by KLK Tensachem, Liège, Belgium.
2.4.2 – Sample preparation
Stock polymer and NaCl solutions were prepared as described above. Surfactant (C12-C14 ethoxylated alcohols or SLES) solutions were prepared by weighing a certain amount of surfactant into a glass vial and by adding either water, D2O, a
NaCl solution or a polymer solution according to the type of sample to prepare. Samples for surface tension measurements on binary (surfactant + water) systems were obtained by preparing a stock solution at a surfactant concentration corresponding to about 10 times the expected critical micellization concentration. This solution was then gradually added to about 15 g of water. Samples for surface tension measurements on ternary (surfactant + polymer + water) systems were prepared by preparing a stock surfactant solution by using a polymer (EVOH or PVA) solution at 1% w/w as a solvent at a surfactant concentration corresponding to about 10 times the critical micellization concentration. This solution was then gradually added to about 15 g of polymer solution at 1% w/w. Samples for surface tension measurements on ternary (surfactant + NaCl + water) systems were obtained by preparing a stock surfactant solution by using a 2 mol kg-1 NaCl solution as a solvent at a surfactant concentration corresponding to about 5 times the critical micellization concentration. This solution was then gradually added to about 15 g of a 2 mol kg-1 NaCl solution.
DLS measurements on binary (surfactant + water) systems were carried out on 3% w/w surfactant solutions, whereas DLS measurements on quaternary (surfactant + polymer + NaCl + water) systems were performed at 1% w/w polymer (EVOH or PVA), 0.65 mol kg-1 or 1.50 mol kg-1 NaCl (for EVOH and PVA, respectively) and at a surfactant concentration corresponding to 5 times the critical micellization concentration determined in water.
31
SANS measurements on binary (surfactant + D2O) systems were carried out on 5%
w/w surfactant solutions, whereas SANS measurements on quaternary (surfactant + polymer + NaCl + solvent) systems were performed at 1% or 0.85% w/w polymer (for EVOH and PVA, respectively), 0.45 mol kg-1 or 1.50 mol kg-1 NaCl (for EVOH and PVA, respectively) and at a surfactant concentration corresponding to 5 times the critical micellization concentration determined in water.
2.4.3 – Characterization techniques
Surface tension measurements were carried out by using a Sigma 70 Force Tensiometer from Nordtest, equipped with an interface and a system unit and based on the du Noüy ring technique. This method allows measuring the force required to raise a platinum ring from the surface of the liquid, which is related to the surface tension.
Dynamic Light Scattering (DLS) measurements were performed by using the same instrument described above. We measured the scattering intensity at fixed scattering angle of 90°.
We carried out Small Angle Neutron Scattering (SANS) measurements with the same instrument and configuration described in paragraph 2.3.2.
2.5 – Fragrance segregation process
2.5.1 – Materials
EVOH, PVA and NaCl, whose characteristics are reported in paragraph 2.2.1, were used. A fragrance mixture of 10 different components (Decylaldheyde, p-Methylacetophenone, Methyl salicylate, Eugenol, Hexyl Acetate, Citral, Ethyl-2-Methyl Butyrate, Geraniol, Habanolide and PRM A) was supplied by Procter and Gamble. The exact composition of such mixture was determined through GC-FID
32
(Gas Chromatography with Flame Ionization Detection) by using the single components (all with purity ≥ 97%) supplied by Sigma Aldrich. Ethanol (purity ≥ 99.8%), hexane (purity ≥ 95%) and octane (purity ≥ 99%) were also purchased from Sigma Aldrich.
2.5.2 – Sample preparation
PRM stock solutions were prepared by solubilizing a certain amount of fragrance either in a mixture of hexane and octane 100:1 w/w or ethanol. Stock polymer and NaCl solutions were prepared as described above.
For GC-FID measurements on PRM solutions, 10 stock solutions of single fragrances at a concentration of 4% w/w were prepared by using as a solvent a mixture of hexane and octane 100:1 w/w. Then, 10 sets of samples at 2 more different PRM concentrations (1% w/w, 2% w/w) were obtained by diluting the stock 4% w/w solutions in the hexane and octane mixture, so as to have 3 PRM concentrations for each set of samples, which were used for building the calibration curves.
For the solubilization tests we prepared 11 samples at fixed fragrance concentration (1% w/w) and 11 different ratios of water and ethanol, ranging from 100/0 w/w to 0/100 w/w with a step of 10% w/w.
For Dynamic Light Scattering measurements the samples were prepared by diluting a stock EVOH 2% w/w solution with a stock PRM solution and ethanol. We analyzed 2 solutions containing fragrance at 0.5% w/w and polymer at 1% w/w solubilized in a mixture of ethanol and water 30/70 w/w.
For GC-FID measurements on the hexane extracts, firstly a solution containing polymer particles was prepared, by choosing a final EVOH or PVA concentration of 1% w/w and a final NaCl concentration of 0.85 mol kg-1 and 2.00 mol kg-1 for the samples containing EVOH and PVA, respectively. Then, a stock fragrance solution in ethanol was added, in order to have a final PRM concentration of 0.5%
33
w/w and a final ethanol concentration of about 30% w/w. The final concentrations here reported are related to the final solutions obtained by mixing the aggregate solution with the PRM solution. Reference solutions without polymer and at comparable PRM concentrations were prepared. Finally, about 1 g of solutions containing polymer, NaCl, PRM, water and ethanol was filtered by using 0.20 μm filters and the filtered solutions were treated with 2 g of hexane. The same procedure was followed for the reference samples without polymer.
For GC-MS measurements on the hexane extracts, the same preparation protocol described for GC-FID measurements was followed. In this case, we tested 3 different concentrations of PRM A (0.09% w/w, 0.12% w/w and 0.15% w/w) and polymer (0.51% w/w, 0.68% w/w and 0.85% w/w), instead of the mixture of 10 fragrances and the fixed 1% w/w polymer concentration used for GC-FID measurements. The ratio PRM A/polymer was kept constant for all samples. The final ethanol concentration was 30% w/w and the final NaCl concentration was of 0.85 mol kg-1 and 2.00 mol kg-1 for the samples containing EVOH and PVA, respectively.
2.5.3 – Characterization techniques
GC-FID measurements were carried out by using a FOCUS GC System from Thermo Electron Corporation equipped with an apolar DB-5 capillary column (30 m x 0.32 mm x 0.25 μm) and a Flame Ionization Detection system with an acquisition rate of 300 Hz. Liquid injection was performed into an oven at 260 °C with a 1:8 split ratio. Nitrogen was used as mobile phase. We operated by using a temperature-programmed analysis (from 40 °C for 2 min to 200 °C for 15 min with a heating rate of 30 °C/min).
Dynamic Light Scattering (DLS) measurements were performed by using the same instrument described above. We measured the scattering intensity at fixed scattering angle of 90°.
34
GC-MS (Gas Chromatography with Mass Spectrometry detection) measurements were carried out by using a Hewlett Packard G1530A GC System equipped with a DB-5MS apolar capillary column (30 m x 0.25 mm x 1 μm) and a Hewlett Packard 5973 MSD (Mass Spectrometric Detector). Hexane extracts were put into 2 mL glass vials and closed with a magnetic cap provided with a perforable silicon septum. Liquid injection was performed into an oven at 260 °C with a 1:8 split ratio. We operated at constant flow mode (1.5 mL/min at 113 kPa, with a total flow of 16.8 mL/min) by using a temperature-programmed analysis (from 40 °C for 1 min to 80 °C with a heating rate of 30 °C/min and from 80 °C to 250 °C with a heating rate of 8 °C/min). Finally, the analytes were detected by fast GC-MS in full scan mode. Perfume concentrations were subsequently quantified through the use of Chemstation Software.
2.6 – Washing tests
2.6.1 – Materials
EVOH, PVA and NaCl, whose characteristics are reported in paragraph 2.2.1, were used. Ethanol (purity ≥ 99.8%) and PRM A (purity ≥ 97%) were purchased from Sigma Aldrich. PRM B (purity ≥ 97%) was supplied by International Flavors & Fragrance, Benicarló (Spain). Unperfumed liquid detergent containing both anionic and non-ionic surfactants was used for the washing tests.
The exact composition of the unperfumed laundry product and the name of the fragrances tested (traded as PRM A and PRM B) cannot be disclosed due to confidentiality.
35
2.6.2 – Sample preparation
Technology (polymer + fragrance) and reference (free perfume) solutions were prepared by following two different protocols: the 5 steps in a row protocol and the 5 steps in 2 parts protocol.
According to the first protocol, solutions and solvents were added as follows: 1) Polymer stock solution;
2) Water (if needed); 3) Ethanol (if needed);
4) PRM stock solution in ethanol; 5) NaCl stock solution in water.
According to the second protocol, solutions and solvents were added as follows: FIRST PART
1) Polymer stock solution; 2) Water (if needed);
3) NaCl stock solution in water; SECOND PART
4) Ethanol (if needed);
5) PRM stock solution in ethanol.
For both protocols, calculated volumes of all solutions and solvents were added under stirring at 1200 rpm. Final concentrations of all components were the same, independently on the protocol followed. Reference solutions were prepared by adding water instead of the polymer solution.
Tab. 2.6.2.1 reports the concentrations of the stock solutions and the final polymer, NaCl, PRM, ethanol and water concentrations. As an example, tab. 2.6.2.2 summarizes the amounts used for preparing the technology solutions for a fixed quantity of final solution (about 10 g) at a final technology concentration of 1% w/w. Such amounts differ according to the polymer and the PRM used for the preparation. The same stock solutions were used for preparing the samples at lower
36
technology concentrations (0.6% w/w and 0.8% w/w): in this case, we used a lower quantity of polymer and PRM solutions and a higher amount of ethanol and water.
Table 2.6.2.1 – Concentrations of stock solutions and final concentrations of all
components in the mixture.
Technology Concentration [% w/w] Polymer stock NaCl stock PRM stock Polymer final NaCl final PRM final Ethanol final Water final EVOH particles + PRM A 2.00 18.1 0.750 0.850 4.68 0.150 19.8 74.52 EVOH particles + PRM B 2.00 19.8 0.750 0.925 4.68 0.0750 30.0 64.32 PVA particles + PRM A 4.00 21.1 0.750 0.850 10.4 0.150 19.8 68.8 PVA particles + PRM B 4.00 21.1 0.750 0.925 7.98 0.0750 30.0 61.02
Table 2.6.2.2 – Volumes of solvents and stock solutions needed for preparing the
technology solutions at a fixed amount of final solution (about 10 g) at a final technology concentration of 1% w/w.
Technology
Volume [μL] Water Ethanol Polymer solution NaCl solution PRM solution EVOH particles + PRM A 1176 0 4325 2284 2579 EVOH particles + PRM B 0 2589 4706 2084 1290 PVA particles + PRM A 978 0 2162 4326 2579 PVA particles + PRM B 912 2589 2353 3331 1290
37
For DLS measurements we prepared 4 different sets of samples at distinct technology concentrations (0.6% w/w, 0.8% w/w and 1% w/w). Such samples and their references were prepared by following the 5 steps in two parts protocol and by using water, ethanol and the stock solutions whose concentrations are reported above.
Washing tests were carried out by using a Launder-o-Meter. Cotton and polyester fabric tracers of 5 cm x 5 cm were used. The details of the washing procedure are reported below:
1) The fabric is weighed and put into the metal Launder-o-Meter jar; 2) 10 metal spheres are added into the jar;
3) 200 mL of demineralized water are poured;
4) About 1 g of unperfumed detergent are added into the jar;
5) Either the free perfume reference solution or the technology solution (about 5.0 g) are poured into the jar;
6) The jars are closed and placed into the Lauder-o-Meter;
7) The temperature is set to be between 35 °C and 40 °C (37-38 °C); 8) After 1 hour, the jars are removed from the Launder-o-Meter; 9) The fabrics are squeezed by applying the same pressure; 10) The jars and the metal spheres are rinsed;
11) The washed fabric is put into the jar again together with the metal spheres; 12) 200 mL of demineralized water are poured;
13) The jars are closed and placed into the Lauder-o-Meter;
14) The temperature is set to be between 35 °C and 40 °C (37-38 °C); 15) After 5 minutes, the jars are removed from the Launder-o-Meter; 16) The fabrics are squeezed by applying the same pressure;
17) Finally, according to the test, the fabrics are treated as follows:
a. for deposition: each fabric is placed into a tray on an aluminum foil and dried at room temperature for one night;
38
b. for dry release: each fabric is placed into a tray on an aluminum foil and dried at room temperature for one night;
c. for wet release: each fabric is placed into a vial for GC-MS head-space analysis and the vial is closed.
The samples for release tests were prepared by using glass vials of 20 mL equipped with a magnetic cap and a plastic septum.
The samples for deposition tests were prepared as follows: 1) Each dried fabric is put into a 20 mL vial;
2) 12 mL of ethanol are poured into each vial containing the fabrics;
3) 12 mL of ethanol are also poured into 3 vials for the preparation of the standards (at 3 different perfume levels);
4) All the vials containing the fabrics are placed into an oven with orbital shaking at 60 °C for 1 hour;
5) All the vials are transferred into an ultrasonic bath and left under sonication for 15 minutes;
6) The vials are shaken and each ethanol solution is poured into a different vial (containing the extracts);
7) A stock PRM solution (about 0.5% w/w of PRM in ethanol) is prepared. This solution is used to prepare a work solution with a concentration of 0.008% w/w of PRM in ethanol; 3 different amounts or work solutions are added to the vials containing 12 mL of ethanol, previously prepared;
8) 4.5 mL of a 20% w/w solution of NaCl are transferred into a vial for GC-MS head-space analysis. This procedure is repeated for each extract and standard solution. Each sample is replicated;
9) 0.5 mL of PRM solutions in ethanol (extracts and standards) are poured into the vials containing the NaCl solution;
39
2.6.3 – Characterization techniques
Dynamic Light Scattering (DLS) measurements were performed by using the same instrument described above. We measured the scattering intensity at fixed scattering angle of 90°.
GC-MS head-space analysis was carried out by using an Agilent Technologies 7890B GC System equipped with a DB-5UI apolar capillary column (30 m x 0.25 mm x 0.25 μm) and an Agilent Technologies 5977A MSD (Mass Spectrometric Detector). Either ethanol extracts or fabrics were put into 20 mL glass vials and closed with a magnetic cap provided with a perforable silicon septum. Samples were equilibrated for 10 minutes at 65 °C. Then, the head-space above the samples was sampled via Solid Phase Micro Extraction (SPME) by using a fiber made of Divinylbenzene (DVB), Carboxen and Polydimethylsiloxane (PDMS). The compounds adsorbed on the fiber were then desorbed into the GC by using a temperature-programmed analysis (from 40 °C for 0.5 min to 270 °C for 0.25 min with a heating rate of 17 °C/min). Finally, the analytes were detected by fast GC-MS in full scan mode. Perfume head-space concentrations were subsequently quantified through the use of Chemstation Software.