1
POLITECNICO DI MILANO
FACOLTÀ DI INGEGNERIA
Dipartimento di Bioingegneria
Corso di Laurea Magistrale in Ingegneria Biomedica
A NEW SYSTEM BASED ON LASER INTERFEROMETERS
AND OPTICAL DISTANTIOMETERS FOR THE
ASSESSMENT OF THE CHEST WALL MECHANICS
Relatore:
Prof. Ing. Raffaele DELLACÀ
Correlatore: Ing. Ilaria MILESI
Tesi di Laurea di:
Luca ROVERON
Matr. n. 750570
2 INDEX FIGURES INDEX ... 5 TABLES INDEX ... 9 ABSTRACT ... 10 Summary ... 11 Sommario ... 14 1. INTRODUCTION ... 17 2. STATE OF ART ... 21
2.1 Forced-oscillation Technique (FOT) ... 21
A. Oscillation mechanics of the respiratory system ... 21
1) Models of the respiratory system ... 21
2) Impedance and transfer function of the respiratory system ... 25
B. Experimental equipment ... 30
1) Pressure and flow generators ... 30
2) Pressure and flow measurements ... 33
C. Optoelectronic Pletismography (OEP) ... 34
1) Principles of measurements ... 34
2) Spatial distribution of transfer impedance ... 35
D. Measurement of local mechanical properties by an optical interferometer ... 39
1) Experimental setup... 39
2) Results and comparison with OEP ... 43
2.2 Technologies to detect distance ... 45
A. Laser interferometry ... 48
1) Michelson interferometer ... 48
2) Laser diode self-mixing interferometer ... 51
B. Laser distantiometers ... 59
1) Triangulation laser distantiometers ... 61
2) Time of flight sensors ... 70
2.3. Measurement of mechanical properties in anesthetized patients ... 78
A. Causes and mechanisms of atelectasis formation ... 78
B. Assessment of lung recruitment/derecruitment ... 82
3. MATERIALS AND METHODS ... 86
3
A. Working scheme of the measuring system ... 86
B. Role of the distantiometer ... 88
3.2. Choice of the appropriate distantiometer ... 89
A. Characteristics requested to the distantiometer ... 89
B. Sensitivity curve ... 91
3.3 Hardware design ... 93
A. Components‟ choice ... 93
1) Front-end board of the distantiometer ... 93
2) Data acquisition board ... 98
B. Board development ... 105
C. The system‟s structure ... 106
3.4 Hardware problems and adopted solutions ... 107
A. Front-end board‟s issues ... 107
B. Data acquisition board‟s issues ... 108
3.5 Firmware programming... 109
A. Firmware‟s principal functions ... 109
B. The interrupt service routines ... 113
C. Communication between the front-end boards and the data acquisition board ... 117
D. Serial data transmission to the PC using the UART module ... 119
3.6. Labview interface ... 122
A. Data visualization ... 123
B. Setting and control of the stepper motor ... 127
4. DISTANTIOMETER VALIDATION AND RESULTS ... 130
4.1 Calibration of the distantiometers ... 130
A. Calibration setups and protocols of measurements ... 130
B. Distances and angles calculation ... 133
4.2 Validation of the distantiometer‟ s measurements ... 140
A. SMART settings and validation setup ... 140
B. Comparison between the different calibrations ... 142
C. Angle in vitro measurements ... 145
4.3 Measurements on normal and anesthetized subjects ... 157
A. Experimental setup and protocols ... 157
B. Data processing... 162
4 5.2 Future developments ... 177 6. BIBLIOGRAPHY ... 178 APPENDIX 1 – FIRMWARE‟S FUNCTIONS ... Errore. Il segnalibro non è definito.83 APPENDIX 2 – MATLAB‟S ROUTINES ... Errore. Il segnalibro non è definito.88
5
FIGURES INDEX
Figure 1 Rohrer relation. ... 23
Figure 2 Simple model of the respiratory system... 24
Figure 3 Model of T network. ... 24
Figure 4 An airway of length L may be divided into infinitesimal segments of length dx. ... 25
Figure 5 Model of T network including the airways (complex impedance Zaw), tissues (lung plus chest wall, complex impedance Zt), and compressible alveolar gas (complex impedance Zg). ... 25
Figure 6 Modulus and phase of input impedance. ... 26
Figure 7 Model proposed by Michaelson et al. to interpret input impedance measurements. ... 27
Figure 8 Transfer impedance forcing at the chest. ... 28
Figure 9 Measured and theoretically determined phase velocity for an excised canine trachea with static distending pressure of zero. ... 30
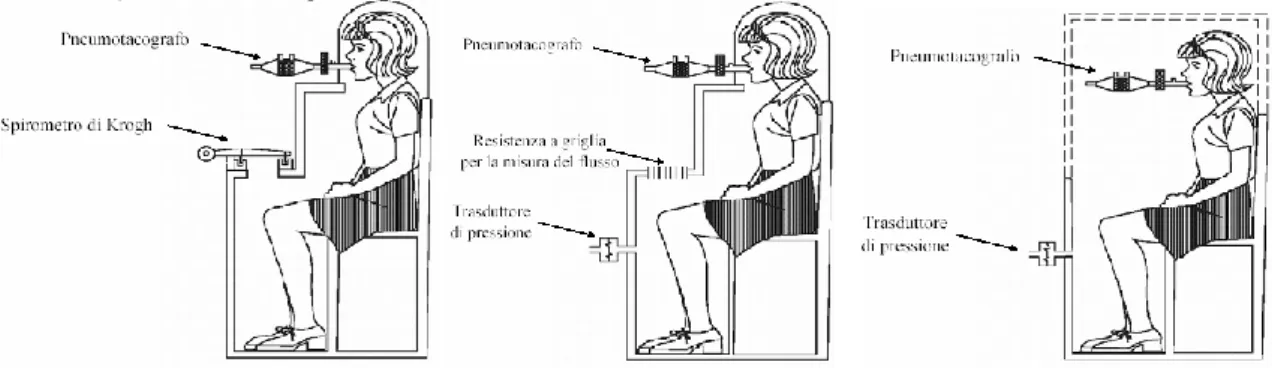
Figure 10 Pressure and flow generators. ... 31
Figure 11 From left to right volume, flow and pressure plethysmograph. ... 32
Figure 12 Optolelectronic Plethysmography: working principle. ... 34
Figure 13 Local transfer impedance maps. ... 39
Figure 14 Measurements set-up. ... 40
Figure 15 Markers and interferometers reference points. ... 41
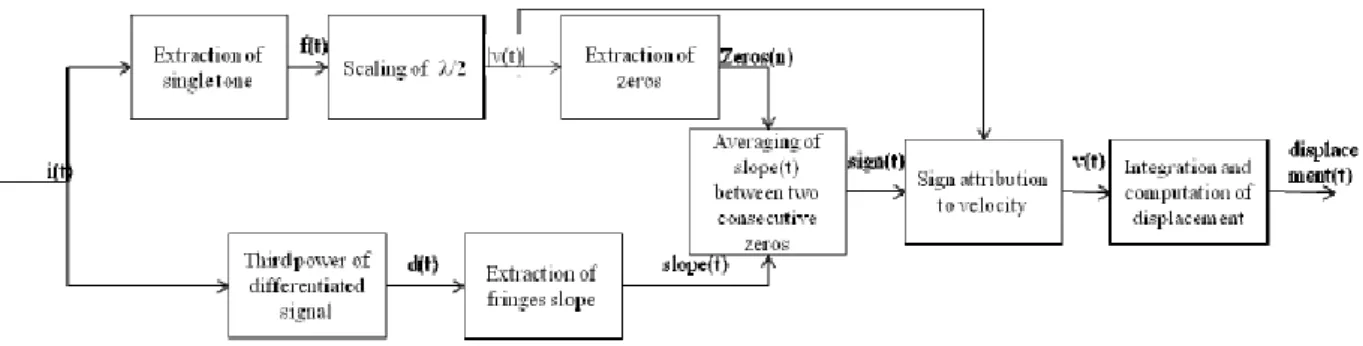
Figure 16 Flow chart of algorithm. ... 42
Figure 17 Panel a) Uncorrected velocity. Discontinuities are marked by a red arrows. b) Corrected velocity. ... 42
Figure 18 Phase displacement among 9 points on the chest wall calculated by the self-mixing interferometer and compare with the theoretical ones measures by the correlation technique. ... 43
Figure 19 Comparison of the displacement measures. ... 43
Figure 20 Displacement Spectrum comparison between interferometer and OMAS. ... 44
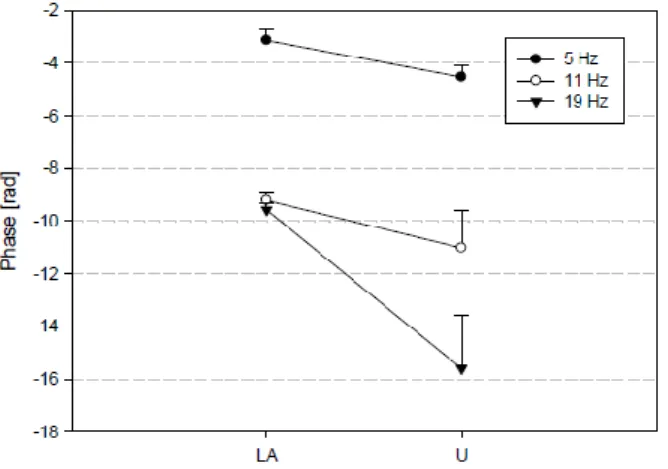
Figure 21 Phase delay for LA and U point is represented for each frequency. ... 44
Figure 22 Systems to produce small pressure signals and measuring the related response. ... 46
Figure 23 Three compartments characterized by pressure input P, flow output V‟ and complex impedance Z. ... 47
Figure 24 Path of light in Michelson interferometer. ... 48
Figure 25 Interferometric fringes. ... 49
Figure 26 Changes in angle of tilt vs. time of the buccal cusp relative to the lingual cusp in the bucco-lingual direction. ... 51
Figure 27 Conventional self-mixing configuration using a LD. ... 52
Figure 28 Modulation of the original electric field of the cavity E0 with the one modified after the reflection of the target. ... 53
Figure 29 Calculated waveforms of the function F(φ) for different values of the C parameter. (a) C = 0.7; (b) C = 3; (c) C = 10. ... 54
Figure 30 Experimental self-mixing signal waveforms obtained for different values of the total optical attenuation ... 55
Figure 31 Optical setup of the instrument. ... 56
Figure 32 Block scheme of the electronic processing (trans-Z corresponds to transimpedance amplifier). ... 56
6
Figure 34 Signal processing 2. ... 58
Figure 35 Principle of the optical distantiometer‟ s triangulation. ... 59
Figure 36 Time of flight principle. ... 60
Figure 37 A diffuse triangulation sensor projects a beam of light onto a target and the reflected light is captured by a detector. ... 61
Figure 38 Specular and diffusive surfaces. ... 61
Figure 39 The electronic processor controls the transmitter that emits the laser beam. The beam illuminates the target object and reflects light into the receiver. The receiver transmits data back to the processor, which interprets the data and outputs a measurement. ... 61
Figure 40 The diameter of the beam dictates the minimum measurable feature size, or spatial lateral resolution. ... 62
Figure 41 Beam diameter and standoff distance. ... 62
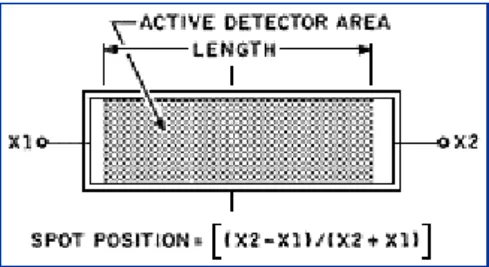
Figure 42 Position-sensing detectors produce two electrical current outputs that vary in relation to spot position. ... 63
Figure 43 Light intensity distribution and position detection with a CCD element and an analog PSD element. ... 63
Figure 44 Principle of laser triangulation. ... 66
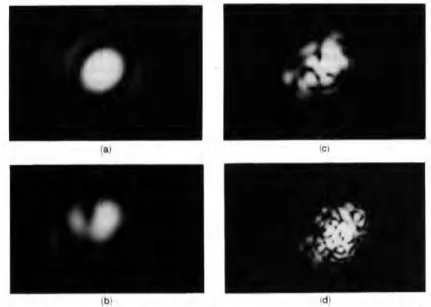
Figure 45 Spot images S‟ on the position-sensitive detector for different observation apertures: a) 0.063, b) 0.031, c) 0.016, d) 0.013. ... 66
Figure 46 Position and working of laser triangulation sensors. ... 67
Figure 47 Charts illustrating the use of phase locking to determine the amplitude of a signal component of known frequency. ... 68
Figure 48 Flow chart of the steps performed by the apparatus. ... 68
Figure 49 Operational principles of a pulsed time-of-flight radar illustrate that the echoes from the nearer houses return to the radar first and that the echoes from the last two houses overlap and appear to the radar as a single return ... 70
Figure 50 Received signal after detection. ... 71
Figure 51Antenna beam patterns. ... 72
Figure 52 Transmitted and received pulse trains. ... 72
Figure 53 Solid state laser transmitter. ... 73
Figure 54 Effect of changing the bandwidth of a matched filter. ... 73
Figure 55 Measuring range. ... 74
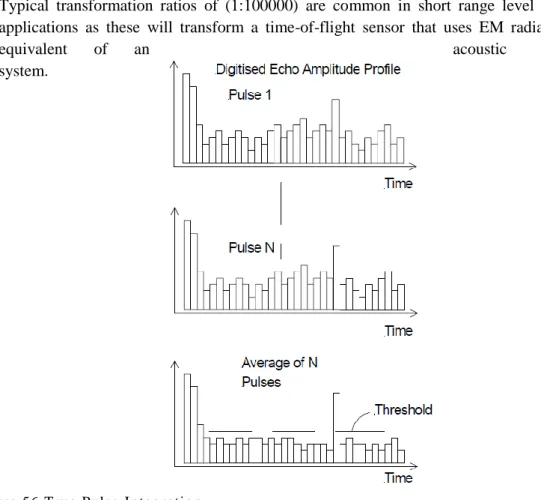
Figure 56 True Pulse Integration. ... 75
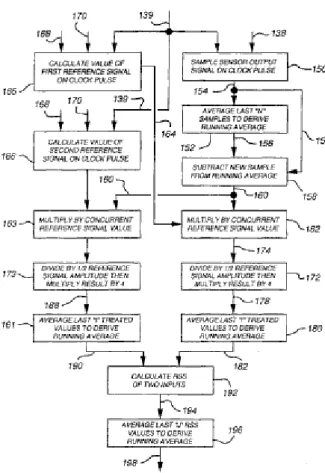
Figure 57 A method of phase/amplitude calculation. ... 76
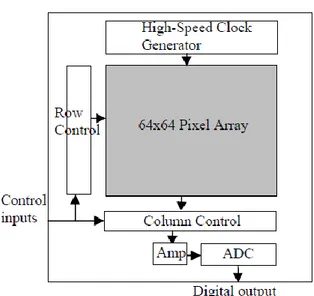
Figure 58 CMOS sensor chip architecture. ... 77
Figure 59 Phase-distance relationship for the depth sensor. ... 77
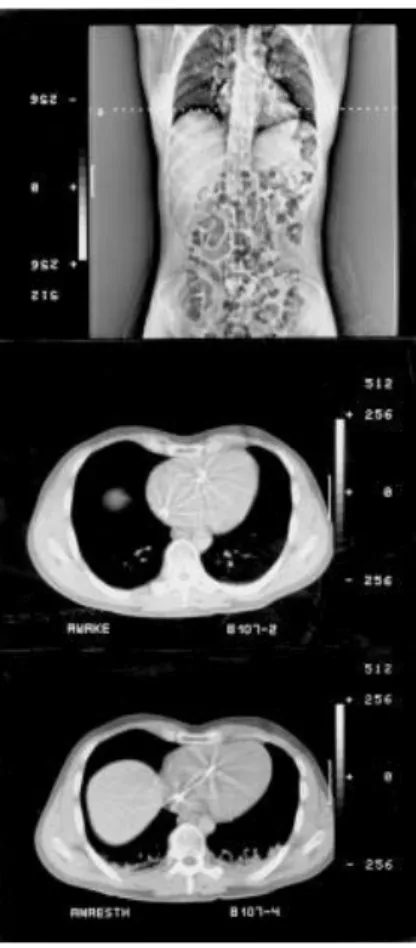
Figure 60 CT scans of atelectasis ... 78
Figure 61Transverse CT-scan with atelectasis visible in the dependent parts of both lungs (left panel) and corresponding vertical distributions of ventilation and lung blood flow (right panel) in an anesthetised subject. ... 79
Figure 62 Curves related to the pressure-volume characteristic (left) and then mean airways pressure (MAP) vs the reactance (right) in order to determine the degree of lungs recruitment/derecruitment. ... 83
Figure 63 FOT equipment and data acquisition setup. ... 84
Figure 64 Examples of breath classification using the Mead and Whittenberger graphs. ... 85
7
Figure 66 Determination of the incident angle with the chest wall surface. ... 88
Figure 67 Block diagram of the distantiometer. ... 90
Figure 68 Timing chart reporting the delay related to the valid output generation. ... 91
Figure 69 Sensitivity curve approximations. ... 92
Figure 70 Front-end board schematic. ... 93
Figure 71 ADC161S626 connection diagram. ... 94
Figure 72 Comparison between the different distance resolution of the ADCs. ... 96
Figure 73 schematic of the data acquisition board ... 98
Figure 74 Power supply schematic ... 98
Figure 75 DC/DC converter schematic. ... 99
Figure 76 MIC block diagram. ... 100
Figure 77 Pins configuration of the USB-to-UART interface module... 101
Figure 78 Block diagram of the dsPIC core and of the connected peripheries ... 102
Figure 79 PCB design. ... 105
Figure 80 The complex system of interferometers and distantiometers arranged with a multiple bar structure. ... 106
Figure 81 Block scheme of the firmware‟s principal functions. ... 109
Figure 82 Timer 1 block diagram ... 113
Figure 83 ADCs timing charts. ... 117
Figure 84 User interface for the visualization and record of the data. ... 123
Figure 85 Serial peripheral settings. ... 123
Figure 86 Configuration of the serial port. ... 124
Figure 87 Acquisition state function. ... 125
Figure 88 Data acquisition function. ... 126
Figure 89 Read channel function. ... 127
Figure 90 Stepper motor control interface. ... 128
Figure 91 simulation of the minimal difference between two consecutive distances. ... 132
Figure 92 Calibration setup (left) and particular of the distantiometers (right). ... 133
Figure 93 Three repeated calibrations in the 40-90 cm range. ... 135
Figure 94 Two calibration experiences in the 30-60 cm ... 136
Figure 95 Comparison between the two kind of calibrations performed ... 138
Figure 96 Calibration setup performed with the SMART system to assess the reference distances (left), composed by four cameras (right). ... 140
Figure 97 Comparison between the different considered calibrations. In blue it‟ s represented the calibration done in the laboratory, the red line the experience with the SMART system and the green on the last measuring procedure using the OEP. ... 143
Figure 98 Calibration curves with the different distantiometers‟ boards. ... 144
Figure 99 Digital signal following the steps driven by the motor on a 30° tilted surface. ... 147
Figure 100 Distances between the 30° tilted surface and related incident angles. ... 149
Figure 101 Polar diagram representing the different distances computed with a 30° tilted surface at every angular step. ... 150
Figure 102 Digital signal following the steps driven by the motor on a 45° tilted surface. ... 150
Figure 103 Distances between the 45° tilted surface and related incident angles. ... 152
Figure 104 Polar diagram representing the different distances computed with a 45° tilted surface at every angular step. ... 153
8 Figure 106 Distances between the 60° tilted surface and related incident angles. ... 156 Figure 107 Polar diagram representing the different distances computed with a 60° tilted surface at every angular step. ... 156 Figure 108 FOT Measurements on the patient and detail of the all the instruments. ... 158 Figure 109 Mechanical ventilator integrated with all the system (left) and particular of the screen (right)... 159 Figure 110 Measurements on awake patient. ... 160 Figure 111 Measurements on sedated patient. ... 161 Figure 112 Comparison between the previous (in blue) and the new calibration curve taken in the clinical environment (in red). ... 162 Figure 113 Digital output of the paths traced by the distantiometers to reach the first row of the interferometric measurements on awake patient. ... 163 Figure 114 Digital output of the paths traced by the distantiometers to reach the second row of the interferometric measurements on awake patient. ... 165 Figure 115 Digital output of the paths traced by the distantiometers to reach every row of the interferometric measurements on sedated patient. ... 166 Figure 116 Plots of the distance between the point on the row in which the interferometer‟s beam is recorded and the related incident angle. ... 171 Figure 117 Distances of the points around the first row, on the left, and the second computed every step. ... 172 Figure 118 Distances of the points around the first row, on the left, and the second computed at every step. ... 173 Figure 119 Distances of the points around the third row, on the left, and the fourth computed at every step. ... 174
9
TABLES INDEX
Table 1Theoretical maximal angular error and percentage accuracy. ... 92
Table 2 A/D converters‟ timings comparison. ... 97
Table 3 Maximal and minimal distance shifts within the angle variations. ... 132
Table 4 statistical parameters for the first calibration setup. ... 136
Table 5 statistical parameters for the validation of the last calibration modality. ... 138
Table 6 difference in the digital output between three calibration experiences. ... 143
Table 7 Measured angle with 30° tilted surface and related statistical parameters. ... 148
Table 8 Measured angle with 45° tilted surface and related statistical parameters. ... 151
Table 9 Measured angle with 60° tilted surface and related statistical parameters. ... 155
Table 10Distances calibrated in the clinical environment and related statistical parameters. ... 163
Table 11 First line‟s distance and angle computed on the awake patient. ... 164
Table 12 Second line‟s distance and angle computed on the awake patient. ... 165
Table 13 First line‟s distance and angle computed on the sedated patient. ... 167
Table 14 Second line‟s distance and angle computed on the sedated patient. ... 168
Table 15 Third line‟s distance and angle computed on the sedated patient. ... 168
Table 16 Fourth line‟s distance and angle computed on the sedated patient. ... 169
Table 17 Comparison between last positions and relative angles for each line in the different conditions. ... 170
Table 18 Reciprocal distances between consecutives rows in which the punctual displacement is recorded starting from the top of the chest wall. ... 175
10
ABSTRACT
The estimation of the mechanical properties of the respiratory system can be performed by means of the forced-oscillation technique (FOT), which aims to calculate the frequency response to a sinusoidal pressure signal given at the mouth and the flow induced, in particular the assessment of the local transfer impedance. This one is the complex ratio between the pressure signal at the airways opening at a higher frequencies that normal breathing and the chest wall displacement, gets a lot of improvements thanks to the more performing used the optoelectronic pletysmography (OEP) to estimate the displacement of target points, but it is methodologically complex and expensive, for these reasons new approaches are needed. Thanks to the developments of silicon technologies, laser interferometers became more diffuse and cheaper but, although the promising results, they still present limits which should be overcome.
An interesting solution may be represented by the distantiometers, that are able to detect the absolute distances from them to a reflecting rough surface following the triangulation method, and arranged with the interferometers in modular frames that compose a structure scanning the thoracic-abdominal system In this work of thesis this multichannel acquisition system has been realized integrating the distantiometers with the existing interferometers and, after the selection of the best one according to the design requirements, a conditioning circuit has been proposed and implemented to perform all the calibrations required.
In order to estimate the incidence angle from the distance measured and the stepper motor angular displacement, a smart and feasible method has been proposed based on trigonometrical equation, then an in-vitro validation has been realized using OEP to assess the right distance measurements and rough surfaces tilted by a know angle to test the effective angle determination. Finally the FOT measurements are performed, in collaboration with the Uppsala University Hospital, in patient awake, anesthetized and sedated, in order to assess the mechanical properties of the respiratory system in different functional conditions and lung recruitment.
11
SUMMARY
The study of the mechanical properties of the respiratory system is performed both to deepen the comprehension of many physical and functional structure inside it and the consequent modelization and to contribute to detect some feasible and significant parameters and indicators which can be used in clinical and diagnostic analysis; the use of biomedical and engineeristic technologies can this way help the reaching of these aims.
A considerable example of what explained is the technique in which this work is included, the Forced Oscillation Technique (FOT), introduced by Brody and DuBois (1956) and subsequently assessed by Brody, DuBois, Nissell, and Engelberg (1956), DuBois, Brody, Lewis, and Burgess (1956), and Brody et al. (1964). The method is based on the theory that the respiratory system has a resonant frequency (DuBois et al., 1956) and is used to study the mechanical properties of the respiratory system by measuring its response to an externally applied forcing signal.
In particular the first measurements were performed by measuring the pressure and the flow at the airways opening and estimating their complex ratio, (input impedance), which provides rich information on the mean properties of the respiratory system. On the other hand the estimation of the so call transfer impedance, which requires the determination of the chest wall volume variation were not so diffuse because of the technical difficulties encountered in having an accurate measure of the displacement of the chest wall. This problem can be resolved thanks to the developments of silicon technologies, laser interferometers became more diffuse and cheaper but, although the promising results in this task, they still present limits which should be overcome.
In this work we will focus on the implementation of a complex multichannel system able to detect the chest wall displacement, that is a good estimation of the flow at the body surface, combining the interferometers and distantiometers distance measures, and then the relative measurements are done on both awake and anesthetized and sedated patient supported by mechanical ventilation. So the principal aims of this thesis are:
1. design and development of the adequate front-end and data acquisition system in order to completely control and manage of the distantiometers in the different measurements situations and regulate the interaction with the other devices composing the whole structure;
2. building the appropriate framework that gathers all the optical sensors and makes them able to catch the relative and absolute distances in all the points of the thoracic-abdominal surface desired by the user;
3. data processing starting from the digitalized output voltage of the distantiometers and determination of the incidence angles between the laser beam and the surface and the reciprocal distances between the different points in which the interferometer is directed, in order to know the precise location and direction of its velocity displacement measures.
State of art
Oscillation mechanics is the study of structural and mechanical properties of the respiratory system as deduced from its mechanical responses to small time-varying forces, that can be generated internally or externally by loudspeakers or pumps and may be periodic, steplike, impulsive or random and the characteristic frequencies may be smaller than that of spontaneous breathing up to several orders of magnitude greater.
12 The method most often used in oscillation mechanics is the construction of computational models of the respiratory system that reflect as closely as possible the oscillatory data and contain the physical properties in question or some combination of them. In particular the focus is pointed on the passive elements (resistances, inertance and elastances) which can be useful to distinguish the presence and progression of a great variety of the respiratory pathologies such as Acute Respiratory Distress Syndrome (ARDS), restrictive and obstructive diseases, while the active elements are ideal pressure of flow generators forcing a sinusoidal signal containing frequencies higher than the usual normal breathing bandwidth.
We can this way define the system function: if a pressure difference and flow are measured at the same terminals, the impedance (admittance) is called input or drive-port impedance (input admittance), if they are measured at different terminals, the impedance (admittance) is called transfer impedance (transfer admittance) and specifically we will focus on the input and local transfer impedance.
The last one in particular is interesting to know as it underlines the spatial distribution of the transfer impedance; following this purpose the use of optoelectronic plethysmography (OEP) has proven capable of measuring volume variations of the chest wall, which is the most difficult measurements among the other ones required for the assessment of the complex function, accurately made up by noninvasive measurements of the displacements of passive markers placed on the external surface of the chest wall over selected reference points. This is actually a methodologically complex and expensive procedure, so new approaches are found, involving the laser interferometers, laser devices, widely used in the industrial and laboratory environments to measure displacement, velocity (of both solid targets and fluids), vibration and relative distances. This device presents even the drawback of not assessing the position in which its signal is recorded and then the velocity displacement determined can be only in the direction of its laser beam, so its action is integrated with the distantiometer‟ s measurements. This is an optical device incorporating a LED diode and a PSD sensor and it can measure the absolute distance from it to a target point situated on a rough reflecting surface using the triangulation method.
Using this device and a structure by which it‟ s possible to scan the thoracic-abdominal surface and integrating it with the necessary equipment to generate a pressure signal at the airways opening, the assessment of the chest wall mechanics computing the transfer impedance map is followed, measuring both awake and ventilated and sedated patients.
Materials and methods
The system designed and developed is mainly composed by:
1. Measuring devices: it comprises both pressure and flow sensors, the distantiometers and interferometers, which are arranged on a metal bar moved by a stepper motor by a fixed angle in order to scan the thoracic-abdominal surface.
2. Data acquisition: the data acquisition board in made up of a polygraph that manages both the signals coming from the distantiometers and pressure and flow sensors and gives some specific commands to their front-end boards, as the enable and the clock signals necessary for the ongoing of the ADC sampling, and furnishes the voltage supply and ground.
The polygraph also controls the stepper motor and sends specific pulses in order to synchronize in particular the signals of pressures, flows an absolute distances with different acquisition platforms as the one controlling interferometers outputs. Finally it generates the sinusoidal
13 signals at 5, 9 and 11 Hz that are necessary to drive the loudspeaker which constitutes the pressure generator at the airways opening necessary for the FOT measurements.
3. Data processing: the polygraph communicates with a portable PC via a RS232 interface, so it can get the data of distances, pressures and flows, that are displayed with a specific Labview program. The interferometric and distantiometric signals needs a further elaborations with specific Matblab routines to get the desires variables of interest, the fist one for the determination of the velocity displacement of the single points in which is directed and the sign of if, the second needs the computation of the calibration curve, which is not linear compared to the distance shift, then the formulas for the angles determination and the distances within the different lines described on the chest wall.
Validation protocols and results
The system described above needs many validations and calibrations and the results for every optical device must be compared with the other ones in order to assess the absolute error, the accuracy and repeatability of the measurement done. The theoretical resolution is under the mm, the great noise superposed to the output signal of the distantiometer and other reflection issues about the device get worse the minimum distance recognizable difference, even if it‟s tested a maximal absolute error of about 4 mm, while the maximal accuracy is about 1.2% and the repeatability is very high too. To improve the accuracy of the calibration, as the assessment of the right distances directly influences the angle determination, the detection of the correct distances are made by the OEP, so it‟ s possible to have an eligible standard to which comparing the data coming from the distantiometers.
Dealing with the angles measurements, it‟ s performed first an in vitro evaluation, measuring the values moving the device on a surface which tilting is determined by the operator. The angular resolution is less than 1° and it‟ s the necessary requirement as the angle by which the distantiometers are shifted driven by the stepper motor is 1.8°, and the results show good statistical parameters involving angles not very wide, till 45 degrees, then the absolute error increases. Anyway, it‟ s demonstrated that the device can detect the surface orientation anyway with a reasonable shift from the right measurement, which is tolerable considering the experimental error. Finally the measurements done on both awake and sedated patients show that the device can reconstruct the punctual directions of movement of the chest wall surface adapting to many different situations, whether the particular district has a wider or not range of motion, without evince any particular problems in integrating the distantiometers with the other instruments that are part of the FOT equipment, so it can be considered a feasible and useful way to contribute to the assessment of the chest wall mechanics.
14
SOMMARIO
Lo studio delle proprietà meccaniche del sistema respiratorio viene eseguito sia per approfondire la comprensione di molte delle strutture fisiche e funzionali al suo interno e la loro conseguente modellizzazione e di contribuire a rilevare alcuni possibili parametri e indicatori significativi che possono essere utilizzati in analisi cliniche e diagnostiche. L'uso di tecnologie biomediche e ingegneristiche in questo modo possono aiutare il raggiungimento di questi obiettivi. Un esempio importante di ciò è la metodologia che rappresenta la base di questo lavoro, la tecnica delle oscillazioni forzate (FOT), introdotta da Brody e DuBois (1956) e successivamente valutata da Brody, DuBois, Nissell, e Engelberg (1956), DuBois, Brody, Lewis, e Burgess (1956), e Brody et al. (1964). Il metodo si basa sulla teoria che il sistema respiratorio ha una frequenza di risonanza (DuBois et al., 1956) ed è usato per studiare le proprietà meccaniche del sistema respiratorio, misurando la sua risposta ad un segnale forzante applicato esternamente.
In particolare i primi esperimenti sono stati eseguiti misurando la pressione e il flusso all‟apertura delle vie aeree e stimando il loro rapporto complesso, (impedenza di ingresso), che fornisce informazioni sulle proprietà medie del sistema respiratorio. D'altra parte la stima della impedenza di trasferimento, che richiede la determinazione della variazione del volume della parete toracica, non si è subito diffusa a causa delle difficoltà tecniche incontrate nel‟effettuare una misura precisa dello spostamento della parete toracica. Questo problema può essere risolto grazie agli sviluppi delle tecnologie al silicio, per cui gli interferometri laser sono diventati più diffusi e più economici, ma, nonostante i risultati promettenti in questo ambito, sono ancora presenti dei limiti.
Questo lavoro si concentrerà sulla realizzazione di un sistema multicanale in grado di rilevare lo spostamento della parete toracica, che è una buona stima del flusso sulla superficie del corpo, combinando le misure di distanza di interferometri e i distanziometri, per poter realizzare misurazioni sia su pazienti svegli che anestetizzati e sedati, supportati da ventilazione meccanica. Quindi gli obiettivi principali di questa tesi sono i seguenti:
1. progettazione e sviluppo di un adeguato sistema di front-end e di acquisizione dati al fine di controllare e gestire i distanziometri nelle diverse situazioni di misura e regolare l'interazione con gli altri dispositivi che compongono l'intera struttura;
2. costruire la struttura appropriata che raccolga tutti i sensori ottici e li renda in grado di misurare accuratamente le distanze relative e assolute in tutti i punti della superficie toraco-addominale stabiliti dall‟operatore;
3. elaborazione dei dati a partire dalla tensione di uscita digitalizzata dei distanziometri e la determinazione degli angoli di incidenza tra il raggio laser e la superficie e le distanze reciproche tra i diversi punti in cui è diretto l'interferometro, al fine di conoscere la posizione esatta e la direzione della misura della velocità di spostamento eseguita.
Stato dell'arte
Le oscillazioni forzate sono lo studio delle proprietà strutturali e meccaniche del sistema respiratorio quale risulta dalla sua risposta meccanica a piccole sollecitazioni variabili nel tempo, che possono essere generate internamente o esternamente da altoparlanti o pompe e possono essere periodici, a gradino, impulsivi o casuali e le frequenze caratteristiche possono essere inferiori a quella del respiro spontaneo fino a diversi ordini di grandezza maggiore.
15 Il metodo più usato è la costruzione di modelli computazionali del sistema respiratorio che riflettano il più possibile i dati determinati con lem metodiche oscillatorie e contengono le proprietà fisiche in questione, o una qualche combinazione di queste. In particolare l'attenzione è puntata sugli elementi passivi (resistenze, inertanze e compliance) che possono essere utile per distinguere la presenza e la progressione di una grande varietà di patologie respiratorie come sindrome da stress respiratorio (ARDS), malattie restrittive e ostruttive, mentre gli elementi attivi sono la pressione ideale di generatori di flusso, che forzano un segnale sinusoidale contenente frequenze superiori a quella della normale respirazione.
Possiamo in questo modo definire la funzione di trasferimento del sistema: se le differenze di pressione e di flusso sono misurate ai terminali stessi, l'impedenza (ammettenza) si chiama impedenza di ingresso o ammettenza di ingresso, se sono misurate a diversi terminali, l'impedenza (ingresso) viene chiamata impedenza di trasferimento (ammettenza di trasferimento) e, in particolare ci concentreremo su impedenza di ingresso e di trasferimento locale. L'ultima in particolare è interessante conoscere, come sottolinea la distribuzione spaziale della impedenza di trasferimento, e, seguendo questo fine, l'impiego di pletismografia optoelettronica (OEP) si è dimostrato in grado di misurare variazioni di volume della parete toracica, che è la più difficile tra le misure le richieste per la valutazione della funzione complessa, accuratamente da misurazioni non invasive degli spostamenti dei marcatori passivi posti sulla superficie esterna della parete toracica più punti di riferimento selezionati. Questo è in realtà una procedura metodologicamente complessa e costosa, quindi nuovi approcci si trovano, coinvolgendo gli interferometri laser, dispositivi laser, ampiamente usato nel settore industriale e ambienti di laboratorio per misurare spostamento, velocità (di entrambi i bersagli solidi e liquidi), vibrazioni e distanze relative .
Questo dispositivo presenta però l'inconveniente di non valutare la posizione in cui viene registrato il suo segnale e poi la velocità di spostamento può essere determinata solo nella direzione del suo raggio laser, per cui la sua azione si integra con le misure del distanziometro. Si tratta di un dispositivo ottico che incorpora un diodo LED e un sensore CCD e può misurare la distanza assoluta da esso ad un punto di destinazione situato su una superficie ruvida che riflette con il metodo della triangolazione.
L'utilizzo di questo dispositivo in una struttura con la quale è possibile scansionare la superficie toraco- addominale e la sua integrazione con i dispositivi necessarie per generare un segnale di pressione all'apertura delle vie aeree, permette la valutazione della meccanica della parete toracica e il calcolo le mappe impedenza, misurata sia i pazienti svegli che sedati e ventilati.
Materiali e metodi
Il sistema progettato e sviluppato è principalmente composto da:
1. Dispositivi di misurazione: comprende entrambi i sensori di pressione e di flusso, i distanziometri e interferometri, che sono disposti sulla barra di metallo mossa da un motore passo-passo con un angolo fisso al fine di eseguire la scansione della superficie toraco-addominale.
2. Acquisizione dati: la scheda di acquisizione dati è formata da un poligrafo che gestisce sia i segnali provenienti dai distantiometri e sensori di pressione e di flusso e fornisce alcuni comandi specifici per le loro schede di front-end, come l'enable e il segnale di frequenza di
16 clock necessari per il campionamento mediante ADC, e la tensione di alimentazione e la massa.
Il poligrafo controlla anche il motore passo-passo e invia altri impulsi per sincronizzare in particolare i segnali di pressione, flusso e dei distanziometri con l'acquisizione da piattaforme differenti, che gestiscono l‟acquisizione dagli interferometri. Infine, genera i segnali sinusoidali a 5, 9 e 11 Hz, che sono necessari per pilotare l'altoparlante che costituisce il generatore di pressione all‟apertura delle vie aeree necessarei per la determinazione delle misure FOT. 3. Elaborazione dati: il poligrafo comunica con un PC portatile tramite una porta seriale RS232,
in modo che possa ottenere i dati delle distanze, pressioni e flussi, che vengono visualizzati con un programma specifico, Labview. I segnali interferometrici e distantiometrici hanno bisogno di ulteriori elaborazioni con specifiche funzioni di calcolo eseguite in Matblab per ottenere le variabili di interesse, i primi per la determinazione della velocità di spostamento dei singoli punti in cui sono registrati e il relativo segno, i secondi hanno bisogno del calcolo della curva di calibrazione, che non è lineare rispetto alla distanza, e in seguito delle implementazione delle formule per la determinazione di angoli e le distanze tra le linee diverse descritte sulla parete toracica.
Protocolli di validazione e risultati
Il sistema sopra descritto ha bisogno di molte convalide e tarature ed i risultati per ogni dispositivo ottico deve essere confrontato con gli altri al fine di valutare l'errore assoluto, l'accuratezza e ripetibilità della misura eseguita. La risoluzione teorica è sotto il mm, ma il rumore sovrapposto al segnale di uscita del distanziometro e i problemi di riflessione del raggio emesso peggiorano la minima differenza di distanza riconoscibile, anche se è testato un errore massimo assoluto di circa 4 mm, mentre la massima accuratezza è di circa 1,2% e la ripetibilità è pure molto alta.
Per migliorare la precisione delle misure, come la valutazione delle distanze che influenzano direttamente la determinazione dell'angolo, il rilevamento delle distanze di riferimento per la calibrazione viene effettuato dall‟OEP, in modo che è possibile ottenere uno standard con il quale confrontare i dati provenienti dal distanziometro.
Trattando ora le misure degli angoli, è eseguita prima una validazione in vitro, che si basa sullo spostamento del dispositivo su una superficie inclinata a piacere da parte dell'operatore e sulla registrazione del corrispettivo segnale. La risoluzione angolare è inferiore a 1° ed è necessaria in quanto l'angolo di cui vengono spostati i distanziometri attraverso il motore passo-passo è di 1,8°. I risultati mostrano buoni parametri statistici che coinvolgono angoli non molto ampi, fino a 45 gradi, oltre i quali aumenta l‟errore assoluto, ma è dimostrato che il dispositivo è in grado comunque di rilevare l'orientamento della superficie con un ragionevole spostamento dalla misura teorica, che è tollerabile considerando l'errore sperimentale.
Infine le misure effettuate sui pazienti sia svegli che sedati mostrano che il dispositivo è in grado di ricostruire le indicazioni puntuali di movimento della superficie della parete toracica e di adattarsi alle diverse situazioni, se la particolare zona ha una gamma più ampia o meno di movimento, senza mostrare particolari problemi nell'integrazione con gli altri dispositivi che fanno parte della strumentazione per le misure con le oscillazioni forzate. La metodologia descritta può essere pertanto considerata pratica e utile per contribuire alla valutazione della meccanica della parete toracica.
17
1. INTRODUCTION
The study of the mechanical properties of the respiratory system is performed both to deepen the comprehension of many physical and functional structures inside it and the consequent modelization and to contribute to detect some feasible and significant parameters and indicators which can be used in clinical and diagnostic analysis. These ones are useful to determinate whether a specific pathology or anomaly is present and/or the degree and progression of it, since respiratory complications as the Acute Respiratory Distress Syndrome (ARDS), restrictive diseases produce alterations in the chest wall mechanics.
The use of biomedical and engineeristic technologies can this way help the reaching of these aims by applying the mathematical and physical analysis to create specific methodologies; a considerable example of what explained is the technique in which this work is included, the Forced Oscillation Technique (FOT), introduced by Brody and DuBois (1956)1
and subsequently assessed
by Brody, DuBois, Nissell, and Engelberg (1956), DuBois, Brody, Lewis, and Burgess (1956), and Brody et al. (1964). It has been applied to clinical measurements because it eliminates the need for an esophageal balloon, because it‟s minimally invasive, and as it requires very little co-operation from the subject it can be used during spontaneous breathing. The method is based on the theory that the respiratory system has a resonant frequency (DuBois et al., 1956) and is used to study the mechanical properties of the respiratory system by measuring its response to an externally applied forcing signal.Mead (1960) shows that the measurements could be made during spontaneous breathing by superimposing the forced oscillations on the breathing pattern, so the mechanical response is studied by means of the
impedance, defined as the complex ratio between the applied pressure and the resulting volumetric flow rate at the frequencies contained in the forcing signal, where all the pressure sources inside the system (the respiratory muscles) must be not active, so at frequencies much higher that 4 Hz. The ways to detect and measure these fundamental parameters are much different and evolved during the decades following the improvement of electronic technologies about transistors and integrated circuits and the developing of calculation softwares that allow a more accurate and powerful processing of the data.
In particular the first measurements were performed by measuring the pressure and the flow at the airways opening and estimating their complex ratio, (input impedance), which provides rich information on the mean properties of the respiratory system. On the other hand the estimation of the so call transfer impedance, which requires the determination of the chest wall volume variation were not so diffuse because of the technical difficulties encountered in having an accurate measure of the displacement of the chest wall, although the total chest wall mechanics is significantly affected by several respiratory disorders, supporting the possible clinical usefulness of this information.
In this work we will focus on the implementation of a complex system able to detect the chest wall displacement, that is a good estimate of the flow at the body surface as we will explain better in the FOT dedicated section, combining the interferometers and distantiometers distance measures. Once it‟s figured out the methodological framework, it‟s also fundamental to say in which sector of the clinical practice this work can be part of: the anesthetized patients.
General anesthesia is a state of unconsciousness resulting from the administration of one or more medications, with the overall aim of ensuring hypnosis, amnesia, analgesia, relaxation of skeletal
18 muscles, and loss of control of reflexes of the autonomic nervous system; if the patient assuming these drugs is submitted to mechanical ventilation the oxygenation of blood is observed to decreased. The main consequence of that is the collapse of lung tissue, the atelectasis, that has been shown to regularly occur in 90% of all subjects, both during spontaneous breathing and after muscle paralysis, and whether intravenous or inhalational anesthetics are used, in particular it‟s facilitated by oxygen supplementation of the inspired gas. So the transient mild desaturation during anaesthesia is common, and more long-lasting (up to five minutes) and severe hypoxemia may have an incidence as high as 20%.
There is a correlation between the amount of atelectasis and pulmonary shunt, that doesn‟t increase with age and can be evidenced, as well as the atelectic state, by combining CT scanning and single photon emission
computed tomography (SPECT), so the mechanical behaviour of the respiratory system is altered, in particular the functional residual capacity (FRC) and compliance are reduced. There are different procedures that can be used in order to prevent atelectasis or to reopen collapsed lung tissue:
the application of positive end-expiratory pressure (PEEP): it has been tested in several studies. On the average, arterial oxygenation does not improve markedly, and atelectasis may persist and reopened lung units re-collapse rapidly after discontinuation of PEEP.
Vital capacity maneuver: it consists in a deep breath that aims to reach the maximal lung volume and the inflation of them with an airway pressure of 40 cm H2O maintained for 15
seconds it‟s able to re-expands all previously collapsed lung tissue. So, following this method, it‟s possible to completely reopen the lung in adults during general anesthesia with mechanical ventilation and a similar approach
may be used successfully in adults with respiratory failure.
Anesthetic gas: during induction of anesthesia the use of a gas mixture, that includes a poorly absorbed gas such as nitrogen, may prevent the early formation of atelectasis. Indeed pulmonary collapse reappears slowly if a slow fraction of oxygen in nitrogen is used for the ventilation of the lungs after a previous vital capacity maneuver, but the ventilation of the lungs with pure oxygen results in a rapid reappearance of atelectasis. Thus, ventilation during anesthesia should be done if possible with a moderate fraction of inspired oxygen, alternatively the use of PEEP may be considered to reduce the alveolar collapse.
In summary, atelectasis is present in most humans during anesthesia and is a major cause of impaired oxygenation. Avoiding high fractions of oxygen in inspired gas during induction and maintenance of anesthesia, intermittent vital capacity maneuvers together with PEEP reduces the amount of atelectasis and pulmonary shunt.
In this situation the FOT technique is suitable for measurements of the impedance of the overall or parts of the respiratory system and the respiratory system without the influence of the respiratory muscles. In particular it‟s shown by Kostic et al.2 that respiratory system reactance (Xrs), measured
by the forced oscillation technique (FOT) at 5 Hz, may be used to identify the minimal PEEP level required to maintain lung recruitment. Mechanical ventilation indeed is a mainstay of intensive care for patients with acute lung injury (ALI) and the acute respiratory distress syndrome (ARDS) and a ventilation strategy based on tidal volumes of 6 ml.kg-1 and pre-defined positive end-expiratory pressure (PEEP) settings has been shown to reduce morbidity and mortality probably due to less ventilation-induced lung injury (VILI). Various protocols using higher levels of PEEP, meanwhile, experimental studies have been designed to define the optimal PEEP level based on lung compliance or elastance recorded during a recruitment maneuver (RM) with decremental PEEP.
19 It has been have recently shown that respiratory system reactance (Xrs) obtained by the forced
oscillation technique (FOT) at 5 Hz is more reliable than dynamic compliance for assessing lung collapse and the effects of lung RMs in a porcine ALI model. Specifically, Xrs (and its derived
variable CX5, the oscillatory compliance at 5 Hz) identifies the minimum PEEP level required to
maintain lung recruitment with high sensitivity and specificity. The advantages of this non-invasive approach are that it can be easily integrated in mechanical ventilators, it is suitable for bedside continuous monitoring, and it can also be used in the presence of spontaneous breaths; then., during long-term ventilatory treatments, the optimal PEEP level is likely to change with time due to the developing disease process as well as various interventions in the ICU. Hence, a strategy designed to reduce VILI should probably include repeated assessment of lung mechanics, with subsequent changes in the ventilator settings.
Finally it‟s this way possible the constant monitoring of the development of atelectasis and to assess the effects of heterogeneity of lung collapse with quantitative measurements involving non invasive devices that provide real-time pressure differences and volume variations of the respiratory system.
In this paper the attention is focused on the devices that are able to determinate the displacement of the thoracic-abdominal wall, the interferometer and distantiometer; they‟re two laser sensors emitting in the infrared wavelength, but they differ in the working principle (as it‟s dealt with in chapter 2.1) and the signals carried by them give complementary information about relative and absolute distances from the point in which they‟re positioned to the body surface.
Up to now laser interferometers have been successfully used to measure the displacement of the chest wall (Milesi et al., 2010) in a very simple system made by just one interferometer moved by hand by operator to change the measured points. In order to realize a scanning system of the chest wall, which allows to build impedance maps in short time, a new project is needed; basically it consists in five optical blocks made by the interferometers and distantiometers fixed on a bar moved by a stepper motor.
The coordinate use of two different distance measuring laser devices is set up in order to get all possible quantitative information about the chest wall displacement (module, direction and verse) both during normal breathing and in condition of mechanical ventilation with anesthetized patients, as previously discussed, considering the ultimate aim of the work, the calculation of the local transfer impedance. Besides reaching this fundamental goal that allows to understand the physio-pathological condition of the respiratory system and/or to assess the therapy or monitoring process about it, there are other important objectives more strictly connected to this work:
1. complete control and managing of the distantiometers in the different measurements situations and regulation of the interaction with the other devices composing the system made up to get all the data necessary to implement the forced-oscillation technique.
These laser sensors have a particular non linear characteristic, so their sensitivity must be differently considered within the varied intervals of distances of interest, and the signals carried by them must be appropriately conditioned by front-end boards, that perform also the task of digitalize them. The control of these five devices, whose chosen number coming out from the compromise between the necessity to get the best spatial resolution on the body surface and the limited data flow that can be managed by the elaboration unit, is related to a polygraph that acts in the same time on the pressure and flow sensors and with the interferometer, whose signal is separately acquired.
2. Building the appropriate structure that gathers all the laser sensors and makes them able to catch the relative and absolute distances in all the points of the thoracic-abdominal surface
20 desired by the user. The complex of interferometers and distantiometers must indeed take place over the subject of the measured chest wall and it‟s important that their beams are directed on the same points, actually at a short distance from each other to avoid interferences between their equal wavelength emissions, to attribute at every step the right characteristics of location and displacement. Besides there must be an engine that allows to move all the laser sensors at regular time and space intervals to cover all the desired portion of the chest wall surface, that becomes the object of the measure and can be different in dependence from the type of analysis that must be performed. The laser sensor must be inserted in a structure made of aluminum metal bars and a stepper motor moves one of them assuring the right motion of these devices and the adequate control to the user‟s needs.
3. Calculation of the angle between the body surface and the interferometric waves by using the coupled distantiometers. As the principal function of the distantiometer is to determinate the above defined angles that allows to get the component of the displacement velocity of the chest wall which is perpendicular to it. The interferometers indeed can get, with an appropriate elaboration of their signals, the signed velocity of every point analyzed of the skin surface, so it can be useful to detect whether the direction of motion is changed or not, but only in the same direction of its beam.
4. Determination of the distance between two consecutive measurements of the distantiometers. As it‟s shown in Fig. above and will be successively explained in chapter 3.1 B, the angle with the body surface is determined with two distance measurements, so it can be performed at every step of the motor, and the angle comprises between them, so the it‟s possible to define the perpendicular component of the velocity integrating this data with the one given by the interferometer. The determination of the distance comprises between the two consecutive beams of the distantiometer allows us to detect the precise position in which the displacement is calculated by the interferometer signal, so it‟s possible to perform a great variety of analyses, for example calculating the transfer impedance measuring the displacement of the whole chest wall or putting on evidence the different mechanical properties inside it by focusing the measurements only in some parts of it.
So, matching the distances calculated from the distantiometers‟ signals, it‟s feasible to have the right module and direction of the velocity vector and to calculate the exact displacement of the many analyzed points and, as final goal, to get more precise values of local transfer impedance. It‟s then definitely possible to realize the so-called FOT maps, the assessment of the different mechanical properties of the regions analyzed by calculating the local transfer impedances, the complex ratios of the pressure oscillations induced by a loudspeaker and the correspondent displacements which can be located on the chest wall surface. Using the information of the reciprocal distances between them and the angles between the interferometric beam and the chest wall, it‟s feasible to reconstruct the position and orientation of the surface of which the evaluated points are part of, extending the analysis of the transfer impedance not only on the single point in which the lasers are focused, but on a specific region, whose mechanical characterization can be compared to the one of another district analyzed in the same measurement.
21
2. STATE OF ART
2.1 Forced-oscillation Technique (FOT)
A. Oscillation mechanics of the respiratory system
Oscillation mechanics is the study of structural and mechanical properties of the respiratory system as deduced from its mechanical responses to small time-varying forces, that can be generated internally or externally by loudspeakers or pumps an may be periodic, steplike, impulsive or random and the characteristic frequencies may be smaller than that of spontaneous breathing up to several orders of magnitude greater.
The method most often used in oscillation mechanics is the construction of computational models of the respiratory system, as it‟s explained by Peslin et al.3, that reflect as closely as possible the oscillatory data and contain the physical properties in question or some combination of them.
1) Models of the respiratory system
A mechanical system is a collection of matter and components defined by a real or imaginary boundary, chosen to provide a convenient conceptual separation of the system from its environment and which outputs of interest are observable and inputs are controllable or at least observable. We can separate all the elements of the model in passive and active mechanical elements in order to describe them as the electrical equivalents and then to report the equations with the mechanical parameters characterizing them.
Passive mechanical elements.
It is considered an assemblage of three simple types of passive elements called elastances, inertances and resistances, with each element corresponding to a unique mode of energy handling: respectively storage by means of potential energy, of kinetic energy (inertial) and dissipation by friction (viscous).
In respiration mechanics it is conventional to characterize these elements in terms of pressure differences ( ) across the element and associated volume flow rates ( ) passing through it, so the relationship of pressure differences to volume flow for each primitive element depends on only the physical material and geometry of the system.
To avoid the complexities of dealing with nonlinear systems, we limit attention to very small departures of the system from a prescribed reference state. In this case the curvilinear constitutive relations may be replaced by a linear approximation and entail only small errors; this greatly simplifies analysis but is valid only in the immediate neighborhood of the reference state defined by a prescribed volume history, lung volume and volumetric flow rate.
Inertances: in absence of viscosity, the pressure difference applied across a fluid column of length l and cross-sectional area A is balanced by fluid acceleration in accordance with Newton‟s law that force (F) equal mass (ρlA) times acceleration (du/dt). Because force is pressure difference times area, Newton‟s law becomes
F = A(P2-P1) = AP21 = nρlA(du/dt)
where u is velocity, ρ is the fluid density and d/dt denotes rate of change with respect to time t.
The volumetric flow rate ( ) is the cross-sectional area times the average particle velocity (u), thus the ideal elemental equation becomes
22 P21(t) = I(d/dt) (t)
where
I = nρl/A
Equation 6 demonstrates that the pressure drop P21 across an inertance is largest when flow
rate changes rapidly and is zero when flow is steady. Energy stored in inertial elements by virtue of their motion is called kinetic energy. In case of a solid mass (M) exposed to a pressure difference across an area (A), a solid inertance can be define by equation 6
I=M/A2.
Elastances (compliances) : an ideal fluid elastance (E) has a pressure differences in direct proportion to volume, P21 = EV. Rate of volume change (dV/dt) is the volumetric flow rate,
so this relation may be expressed
(d/dt)P21(t) = E (t)
where E=1/C. In the respiratory system gas compressibility is the most important source of fluid elastance; for an ideal gas volume (V0) at absolute mean pressure (P0), the elastance is
a non linear function of the pressure variations but may be linearized as follow E = βP0/V0
Equation 9 demonstrates that the volumetric flow through a fluid capacitance is largest when pressure rapidly changes and zero when the pressure is steady. Energy stored in elastic elements by virtue of compression o gas or distension of elastic walls is called elastic potential energy.
Solid elastances encountered in respiration mechanics tend to dependent on volume history and profoundly nonlinear, like lung parenchyma, airway walls and chest wall. Linearization of them made on the pressure-volume curve is the elastance and is called the incremental modulus.
Resistances: an ideal fluid resistances exhibits a pressure drop proportional to flow rate according to the elemental relation
P21(t) = R (t).
For steady fully developed laminar flow at low Reynolds number (parabolic velocity profile) in a long straight pipe of length I and cross section A containing fuid viscosity μ
R = 8πμl/A2
which is Poiseuille formula for flow resistance. This result alos applies to slower oscillatory flows, but fails at higher frequencies, at higher oscillatory Reynolds numbers, and in the presence of bias flows. A useful approximation that takes into account unsteadiness and the superposition of steady bias flows is
where circular frequency ω is 2π times the frequency f in cycles per second (Hz). The steady DC incremental flow resistance (RDC) is measured or calculated from the tangent of
the steady-state pressure-flow curve (see Fig. 1) and is frequency invariant, the kinematic viscosity ( ) is μ/ρ and tube radius is r. The frequency-dependent second term arises as oscillations become more rapid and fluid inertia changes the velocity profile from its steady-state shape and, in these cases, the oscillatory flow resistance is always greater than or equal to the tangent resistance of Fig. 1.
23
Figure 1 Rohrer relation.
Rohrer relation (Eq. ( 2)) taken as an example of nonlinear pressu re-flow relations linearized for small departures about any given bias flow rate
( ). Oscillatory resistance for slow oscillations is the local tangent slope of the pressure -flo w curve. For long straight tubes, slope at is the Poiseuille flow resi stance.
The pressure drop in proportional to the square of the flow rate through an orifice, so the resistance is given by
where Cd is the discharge coefficient and A0 is the orifice area.
Energy dissipated in resistive elements by virtue of friction is lost irreversibly to heat, in contrast with inertial and elastic ones.
Active mechanical elements.
They are capable of delivering energy to the system over an extended period that account for sustained respiratory system motions and are the respiratory system muscles or external loudspeakers and pumps.
Ideal flow source: maintains a prescribed volumetric flow source as a function of time through its terminals independent of the pressure drop required to achieve that flow.
Ideal pressure source: maintains a prescribed pressure rise as function of time across its terminals independent of the flow required to maintain that pressure.
A linear respiratory system model is formulated by assembling resistive, inertial and elastic elements previously described into a network or circuit and the junctions between them are called nodes.
To this network two physical principals are applied: mass must be conserved (continuity) and Newton‟s law must be obeyed (compatibility). To respect the first physical need, at a node the sum of all flows must be zero, as Kirchoff‟s current law, the second requires instead that the net pressure drop taken in a specified direction around any close path in the system circuit is zero, as Kirchoff‟s voltage law.
In a simple model of respiratory system as the one presented in Fig. 2, we can see the components of impedance, both real (resistive) and imaginary (reactive). But the model that is widely used in oscillation mechanics of the respiratory system and can account for forcing at the mouth and/or at the body surface in the one depicted in Fig. 3. It‟ s a T network accounting for airway impedence Zaw, lung tissue and chest wall properties Zt, alveolar as compression Cg, body surface external
sources at mouth and body surface, while atmospheric pressure is taken to be zero.
We can this way define the system function: if a pressure difference and flow are measured at the same terminals, the impedance (admittance) is called input or drive-port impedance (input admittance), if they are measured at different terminals, the impedance (admittance) is called transfer impedance (transfer admittance).
24
input admittances: , ;
input impedances: , ;
transfer impedances: , ;
transfer functions: , .
Following the same rules of the electric circuits, we can obtain the equivalents of the model:
one port systems, if pressure (relative to atmosphere) and flow variations are applied and measured only at the mouth, so the respiratory system can be represented as a black box;
two–port systems, if the mouth is viewed as one port and the body surface as a second port, so the respiratory system can be seen as a black box with two sets of terminals.
Figure 2 Model of T network.
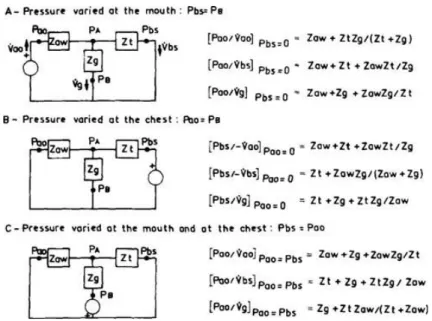
Model of T network accounting for airway impedance (Zaw), tissue impedance (Zt), and gas compression (Zg). Forcing may be at mouth, body surface, or both. Either generator may be short-circuited (no pressure difference) or open-circuited (no flow) to deal with the case of a single input.
Figure 3 Simple model of the respiratory system.
A: simple series model of the respiratory system. B: impedance vector at several frequencies. Components of impedance vector: real (resistive) component (C); imaginary (reactive) component (D); magnitude (E); phase angle (F).
In the models discussed above, the morphological characteristics of airways are bypassed a priori by assignment of extensive dynamic variables, instead in some cases we may need to investigate the spatial distribution of oscillatory pressures and flows within the upper and lower airways or to specific the physical properties of the airway tree.
In these circumstances spatially distributed models become preferable to lumped-parameter models, so we need the ones in which spatial dimensions coordinates and branching topology are dealt with explicitly.
For example, we can consider an airway segment with its associated pressures and flows of infinitesimal length dx, as shown in Fig. 4, that describes the pressure waves and the corresponding distensional motion in the airway. Starting from it, we can calculate the shunt admittance per unit length (Y) associated with the parallel combination of gas compression (Cg), gas thermal
conductance (Gt) and airway wall distensions:
25 where aww refers to airway wall properties and includes mechanical support of surrounding tissues.
Figure 4 An air way of length L may be divided into infinitesimal segments of length dx. The equivalent circuit for such a segment incorporates air way inertance (Iaw) and viscous resistance (Raw) as series elements. Shunt elements can be subdivided into the gas compressibility pathway, consisting of gas compressibility (Cg) and gas thermal conductance (Gt), and the wall distension pathwa y, consisting of air way wall elastance (Eaww), inertance (Ia ww), and resistance (Raww).
2) Impedance and transfer function of the respiratory system
The ultimate objective of the forced-oscillation technique is to deduce some specific mechanical properties of the respiratory system from oscillatory data, even in most cases the desired pressure difference and flow relevant to that characteristic is not directly available in the laboratory and some variables can‟t be observed. So we choose from the measurable variables the ones that are more sensitive to the property of interest of a particular compartment, functionally arranged in different ways with the others depending on where the pressure variations are applied, as shown in Fig. 5.
Figure 5 Model of T net work including the airwa ys (complex impedance Zaw), tissues (lung plus chest wall, compl ex impedance Zt), and compressible alveolar gas (com plex impedance Zg).
Functional arrangement of the compartments depends on where the pressure variations are applied.
26 Finally we have to consider the trade-off between measurement specificity and ease; for example input impedance measured at the airway opening.
[ ] with Pbs=0 depends on all factors (airways, gas and tissues) but is relatively easy
to measure, so it catches a lot of attentions in this field. The drawback are that this usually requires data over ranges of frequency wide enough that system response is not dominated by only one or a few parameters, so sophisticated computational procedures are required.
Figured out all these considerations, it‟ s analyzed all the transfer impedance or function that are defined in many different studies.
1. Input impedance forcing at the airway opening: an external forcing is superimposed on quiet breathing and the results are reported in Fig. 6. The total respiratory system behave roughly like a second-order linear system with constant coefficients, as in Fig. 2A: the magnitude of the impedance decreases then increases with frequency and the phase angle is always between -90° and +90°; it is negative at low frequencies, increases with increasing frequency, and tends asymptotically toward +90°.
Figure 6 Modulus and phase of input impedance.
A: modulus (|Zrs|), phase angle (Φrs), and real (real [Zrs] or equivalent resistance) and imaginary (imag[Zrs] or equivalent reactance) parts of the relationship between transrespiratory pressure and flow when pressure is varied at the mouth, .
Data from 9 healthy humans. B: modulus (|Zrs|), phase angle (Φrs), and real (real [Zrs]) and imaginary (imag[Zrs]) parts of the total respiratory input impedance observed at 5 lung volumes in a healthy human.