PhD School in
ENDOCRINE, METABOLIC and PSYCHIATRIC SCIENCES
Course in
NEUROBIOLOGY and CLINICAL MEDICINE of AFFECTIVE DISORDERS
SSD: BIO 10
Thesis
Fibromyalgia: a proteomic approach to study a double
Fibromyalgia: a proteomic approach to study a double
Fibromyalgia: a proteomic approach to study a double
Fibromyalgia: a proteomic approach to study a double----face disease.
face disease.
face disease.
face disease.
PhD student
Dr. Federica Ciregia
Tutor and Chief of PhD Course Prof. Antonio Lucacchini
THESIS FOR THE DEGREE OF PHILOSOPHIAE DOCTOR IN NEUROBIOLOGY AND CLINICAL MEDICINE OF AFFECTIVE DISORDERS
SECRETAZIONE
SECRETAZIONE
SECRETAZIONE
SECRETAZIONE TESI
TESI
TESI
TESI
“Il contenuto di questa relazione è strettamente riservato, essendo
presenti argomenti tutelati dalla legge come segreti. Pertanto tutti
coloro che ne prendono conoscenza sono soggetti all’obbligo,
sanzionato anche penalmente dagli articoli 325 e 623 del codice
penale, di non divulgare e di non utilizzare le informazioni acquisite.”
IN
IN
IN
INDEX
DEX
DEX
DEX
ABSTRACT
ABSTRACT
ABSTRACT
ABSTRACT
5
IN
IN
IN
INTRODUCTION
TRODUCTION
TRODUCTION
TRODUCTION
7
FIBROMYALGIA FIBROMYALGIA FIBROMYALGIA FIBROMYALGIA 7 AUTOANTIBODIES. 10 FM AND INFLAMMATION. 11
FM AND GENETIC FACTORS. 14
FM AND ENVIRONMENTAL TRIGGERS. 17
THE ROLE OF THE PERIPHERAL AND CENTRAL NERVOUS SYSTEM IN FM. 18
DIAGNOSIS AND THERAPY. 22
PROTEOMICS PROTEOMICS PROTEOMICS PROTEOMICS 24 TWO-DIMENSIONAL ELECTROPHORESIS. 25 SAMPLE PREPARATION. 26 FIRST DIMENSION. 27 SECOND DIMENSION. 28
MASS SPECTROMETRY,MALDI-TOF-MS. 29
SELDI-TOF-MS. 32
PROTEINCHIP®ARRAYS. 33
DESORPTION,IONIZATION, AND ANALYSIS IN THE PROTEINCHIP SELDIREADER. 35 SALIVA SALIVA SALIVA SALIVA 36
AIM
AIM
AIM
AIM
38
MATERIAL AND METHODS
MATERIAL AND METHODS
MATERIAL AND METHODS
MATERIAL AND METHODS
39
CHEMICALS. 39
HUMAN SUBJECTS. 39
SAMPLE COLLECTION AND PREPARATION. 42
2-DE ANALYSIS. 43
STAINING AND IMAGE ANALYSIS. 44
STATISTICAL ANALYSIS. 45
PREPARATIVE GELS. 46
2-DE ANALYSIS OF PREPARATIVE GELS. 46
WESTERN BLOT. 47
SELDI-TOF-MS. 48
STATISTICAL ANALYSIS. 50
RESULTS AND DISCUSSI
RESULTS AND DISCUSSI
RESULTS AND DISCUSSI
RESULTS AND DISCUSSION
ON
ON
ON
51
RESULTS OF 2-DE ANALYSIS. 51
DISCUSSION OF 2-DE ANALYSIS. 58
RESULTS OF SELDI-TOF-MS ANALYSIS. 63
DISCUSSION OF SELDI-TOF-MS ANALYSIS. 64
FUTURE PERSPECTIVES. 70
REFERENCES
REFERENCES
REFERENCES
A
A
A
ABSTRACT
BSTRACT
BSTRACT
BSTRACT
Fibromyalgia is a chronic non inflammatory musculoskeletal disorder
characterized by a variety of symptoms related to pain. The first criterion for the
diagnosis requires patient to report at least 3 months of widespread pain. The
second is widespread pain in response to a tender point examination. Common
unspecific symptoms include fatigue, nonrestorative sleep, morning stiffness,
mood disorders, anxiety, depression, cognitive dysfunction (e.g., memory
problems, concentration difficulties, diminished mental clarity), irritable bowel
and bladder syndrome, sexual dysfunction and sicca symptoms. In the last few
years many attempts have been carried out for the research of specific biomarkers
in fibromyalgia, but, at present, there are no specific markers and the diagnosis is
basically clinical.
In the present work we used two complementary proteomic approaches to obtain
the whole saliva protein map of fibromyalgia patients: two-dimensional
electrophoresis in combination with mass spectrometry and Surface enhanced
laser desorption ionization time of flight mass spectrometry (SELDI-TOF-MS).
The aim of this study was the evaluation of the global changes of protein profiles
which occur in the disease and the research for any eventual diagnostic or
prognostic salivary biomarkers, which could be used routinely, in the future, for
the management of fibromyalgia patients. 22 fibromyalgia patients and 26 healthy
while for SELDI-TOF-MS technique saliva samples were collected from 63
patients and 63 controls.
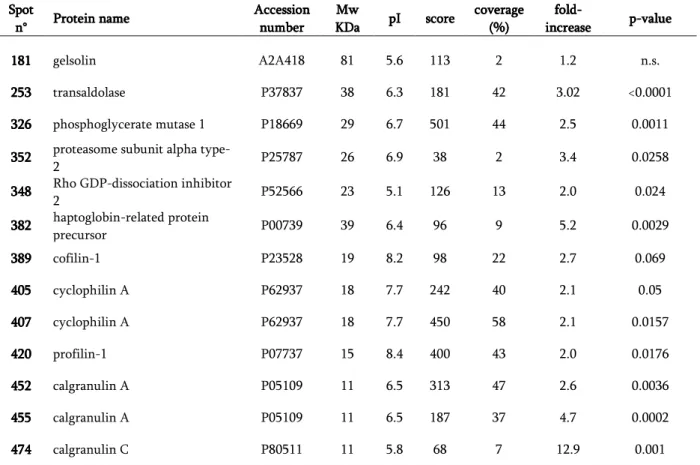
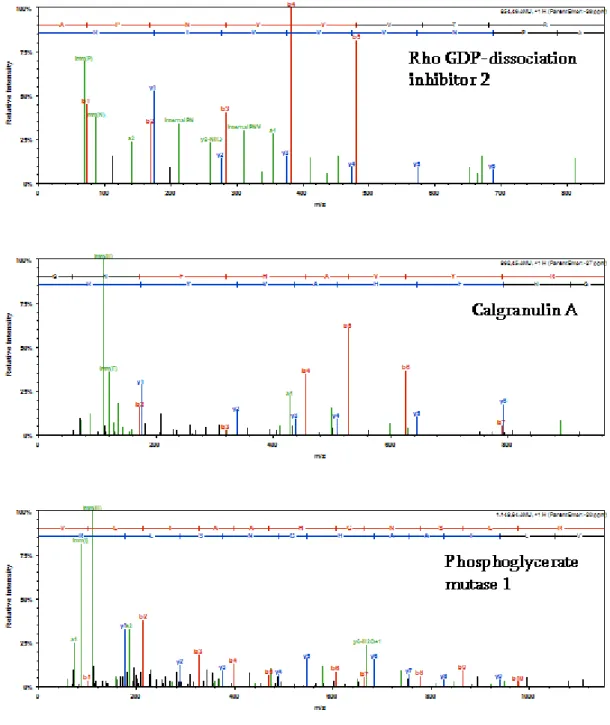
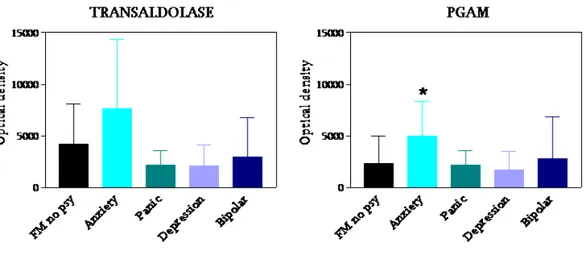
With two-dimensional electrophoresis we found the significant over-expression
of transaldolase and phosphoglycerate mutase I. These findings were validated by
Western blot analysis and the total optical density confirmed their significant
up-regulation in fibromyalgia samples with respect to healthy subjects. It was
noteworthy that seven further salivary proteins resulted differentially expressed:
calgranulin A, calgranulin C, cyclophilin A, profilin 1, Rho GDP-dissociation
inhibitor 2, proteasome subunit-a-type-2 and haptoglobin-related protein
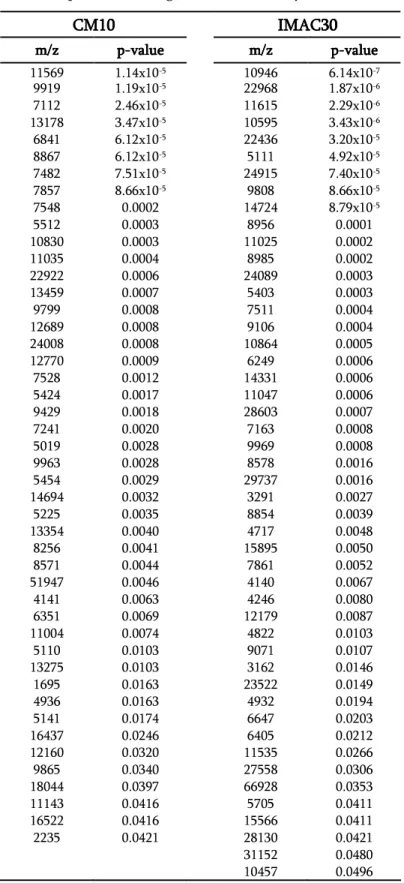
precursor. With SELDI-TOF-MS technique we highlighted also the presence of a
pattern of proteins potentially useful to discriminate fibromyalgia patients from
healthy subjects.
These results demonstrated the utility of proteomic analysis in the identification
INTRODUCTION
INTRODUCTION
INTRODUCTION
INTRODUCTION
FIBROMYALGIA
FIBROMYALGIA
FIBROMYALGIA
FIBROMYALGIA
Fibromyalgia syndrome (FM) is a chronic non inflammatory musculoskeletal
disorder which can occur as a primary disease or in association with other
autoimmune diseases (i.e. Rheumatoid arthritis, Systemic sclerosis, Sjögren’s
syndrome, autoimmune thyroiditis, tetany and chronic fatigue syndrome). In
1990, The American College of Rheumatology laid out several sets of criteria for
the diagnosis of FM. [1]. The first criterion required patients to report at least 3
months of widespread pain. Pain was considered widespread if it was present in
four quadrants of the body, the right and left side as well as above and below the
waist. Axial skeleton pain is also very commonly present in FM and is often
considered a fifth “quadrant.” The second diagnostic criterion was widespread
pain in response to a tender point examination. In this assessment the clinician
presses on 18 specific areas, the patient’s report of pain in at least 11 of these
tender points completes the requirements for the diagnosis of FM.
Common unspecific symptoms associated with FM include fatigue, nonrestorative
sleep, morning stiffness, mood disorders, anxiety, depression, cognitive
dysfunction (e.g., memory problems, concentration difficulties, diminished
mental clarity), irritable bowel and bladder syndrome, sexual dysfunction and
population studies and criteria used, ranging from 0.5% and 5.0% [7], with a
female to male ratio of approximately 9:1 [4].
Symptoms usually appear between the ages of 20 and 55 although juvenile FM in
patients as young as 10 years old or even less has been reported and is probably
under-recognised [8]. The disorder may be dormant for years until triggered by
infection, injury, physical or emotional stress or sleep disturbance [9]. Although
the key alerting symptom is chronic widespread pain or tenderness, FM is not just
a pain disorder. The Fibromyalgia Impact Questionnaire (FIQ; table 1) gives a
good idea of the full range of symptoms that are regularly found. The patients fill
out a questionnaire consisting of 10 items, from which derives a score that
indicates the impact of the disease on life (FIQ total score), the total score reflects
the impact of FM and ranged from 0 (no impact) to 100 (maximum impact).
Although there is no official consensus of what constitutes a clinically significant
score on this scale most patients diagnosed with FM have an FIQ total score of at
least 50 (out of a maximum of 100-see table 1). Severely afflicted patients
Table 1. Fibromyalgia Impact Questionnaire (FIQ).
Question 1 Physical functioning
During the past week were you able to: Do shopping?
Do laundry with a washer and dryer? Prepare meals?
Wash dishes/cooking utensils by hand? Vacuum a rug?
Make beds? Walk several blocks? Visit friends or relatives? Do yard work or gardening? Drive a car?
Climb stairs? Question 2
In the past week, how many days did you feel good? (1–7)
Question 3
How many days last week did you miss work, including housework, because of fibromyalgia ?
(1–7) Question 4
When you worked, how much did pain or other symptoms of your fibromyalgia interfere with your ability to do your work, including housework?
(No problem with work < > Great difficulty with work) Question 5
How bad has your pain been? (No pain < > Very severe pain) Question 6
How tired have you been? (No tiredness < > Very tired) Question 7
How have you felt when you get up in the morning? (Awoke well rested < > Awoke very tired)
Question 8
How bad has your stiffness been? (No stiffness < > Very stiff) Question 9
How nervous or anxious have you felt? (Not anxious < > Very anxious) Question 10
How depressed or blue have you felt?
Table 1. Table 1. Table 1.
Table 1. The items in question 1 are scored 0, 1, 2 or 3 for always, most of the time, occasionally or never. Because some patients may not do some of the tasks listed, they are given the option of deleting items from scoring. In order to obtain a comparable score for all patients, the mean of the scores for the rated items is used. The average score is thus 0–3. This score is multiplied by 3.33 to obtain an adjusted score (maximum 10). Question 2 is scored inversely of the number of days (0 ¼ 7, 1 ¼ 6, 2 ¼ 5, 3 ¼ 4, 4 ¼ 3, 5 ¼ 2, 6 ¼ 1 and 7 ¼ 0). It is multiplied by 1.43 to obtain an adjusted score (maximum 10). Question 3 is directly the number of days. It is multiplied by 1.43 to obtain an adjusted score (maximum 10). Questions 4–10 are visual analogue scales scored on a 100 mm line with the limits given in parentheses. The score (0–10) is the distance (in centimetre from the left hand end). These values are not adjusted. Scoring: The FIQ is scored so that a higher score indicates a greater impact of the syndrome. Each of the 10 items has a maximum possible score of 10. The maximum possible score is thus 100.
Autoantibodies
Autoantibodies
Autoantibodies
Autoantibodies....
Although FM is generally regarded as a non-inflammatory and non-autoimmune
disease, there is a broad spectrum of organ and non organ specific autoantibodies
which have been widely detected in the patients sera [11]
.
Two autoantibodies, the anti-68/48 kD and the anti-45 kD, have been reported as
possible markers for certain clinical subsets of primary FM and chronic fatigue
syndrome and of secondary FM/psychiatric disorders, respectively [12]. In
particular, the anti-68/48 kD antibodies were considered to be closely associated
with FM /chronic fatigue syndrome patients presenting with hypersomnia and/or
cognitive disorders. Pamuk and Cakir [13] reported that thyroid autoimmunity in
FM patients was similar in frequency to that in rheumatoid arthritis (RA) patients
but higher in frequency when compared to the control group. Although the
frequencies of TPO antibodies (antithyroid peroxidase) in both FM and RA
patients were significantly higher than in the controls, the increase in the
frequency of thyroglobulin antibodies (antithyroglobulin) was not significant.
Thyroid autoimmunity, especially the presence of TPO antibodies, was found to
be associated with the presence of migraine and tension headaches [13].
Compared with healthy subjects or with patients affected by other diseases, FM
patients present anti-polymer antibodies (APA) with contrasting results in
literature. Wison et al. found a higher prevalence of APA (67%) in FM patients in
the USA population [14], while Bazzichi and collaborators found a lower
In 1986 Dinerman and team [16] found that 14% of FM patients had a positive
antinuclear antibody (ANA) test, 30% had a history of Raynaud’s phenomenon,
and 18% had symptoms of Sjögren’s syndrome, but none of them progressed to a
classic connective tissue disease [11]. Al-Allaf and co-authors [17] suggested that
patients with FM have the same rate of positive ANA as do osteoarthritis patients
(8.8% and 8.9%, respectively). Results from their study did not show that ANA
are a good predictor of the future development of connective tissue disease in FM
patients and the majority of ANA-positive patients became ANA negative on
follow-up [11]. Recently it was reported that there was no significant difference
in the frequency of ANA or thyroid antibodies between FM patients and controls,
and that the risk of connective tissue diseases is not increased in FM [11, 18].
Other antibodies (anti-serotonin, antiganglioside and anti-phospholipids) were
identified in FM patients compared to healthy subjects [19], but according to
Werle and collaborators the prevalence of autoantibodies against serotonin and
thromboplastin that they found in patients with FM has no diagnostic relevance
[20].
So far, nonetheless, no laboratory tests and none of the above mentioned
autoantibodies have yet been appropriately validated for the disease.
FM and
FM and
FM and
FM and inflammation
inflammation
inflammation
inflammation. . . .
Based on the hypothesis that the origin of all pain is inflammation and the
inflammatory hypothesis of FM. Since 1988 it has been known that increased
levels of the inflammatory transmitter substance P (SP) are found in the spinal
fluid of FM patients [22].
In recent years, inflammatory cytokines have also been suggested to be involved
in the FM syndrome. This hypothesis was based on the assumption that IL-6 and
IL-8, release of which is stimulated by SP, may have an important role in FM
symptoms, since IL-8 promotes sympathetic pain and IL-6 is associated with
hypersensitivity to pain, fatigue and depression. [23, 11]
.
Taken together, theprofile of pro- and anti- inflammatory cytokines in FM patients has recently
attracted considerable attention. Several studies have focused on circulating
pro-inflammatory cytokines as possible “pro-inflammatory markers” in FM patients.
Higher levels of IL-8 and tumor necrosis factor-alpha (TNFα) were found in FM
patients than in controls [24, 25]. On the other hand, results for IL-10, an
anti-inflammatory cytokine which is an antagonist of TNFα and IL-1β, appear to be
controversial, since both increases [24] or no significant changes [25, 26] have
been reported in serum IL-10 concentration in FM patients compared with
healthy controls.
The sources of inflammation triggering the FM syndrome remain to be
elucidated. It has been proposed that FM is due to neurogenic inflammatory
response to allergens, infectious agents, chemicals or emotional stress [21].
Bearing in mind that mechanical abnormalities of the cervical or lumbar spine are
or lumbar disorders can be a source of inflammation, and thus may be one cause
of FM rather than a consequence [23].
Frequently, FM and depression present symptomatic similarities. If FM and
depression coexist, the question is whether depression must be regarded as an
associated affection or whether it is the actual cause of the chronic pain disorders
[27]. Several studies indicate that major depression is accompanied by the
activation of inflammatory response, with an increased production of
pro-inflammatory cytokines [23, 28]. In fact, many FM patients are treated with
antidepressant agents, which may suppress the production of pro-inflammatory
cytokines, such as IFNγ, and stimulate the production of anti-inflammatory
cytokine IL-10 [29]. However, it is known that FM and depression do not always
coexist [27]; even different profiles of pro- inflammatory and anti-inflammatory
cytokines between patients with or without diagnosis of depression have been
reported. For example, Müller and co-workers [27] reported higher circulating
levels of pro-inflammatory (IL-1α and TNFα) and anti-inflammarory (IL-10)
cytokines in FM patients without signs of depression. However, Bazzichi and
co-workers [24] found increased levels of IL-10 and IL-1 in patients with depression,
but they did not find differences in the circulating level of IL-8 between FM
patients with or without depression, both of them strongly higher compared with
the levels found in control healthy people. This finding strongly suggested that
IL-8 may be an “inflammatory marker” for FM syndrome regardless of associated
FM and Genetic Factors.
FM and Genetic Factors.
FM and Genetic Factors.
FM and Genetic Factors.
Genetic factors may predispose individuals to FM. FM in families clusters suggests
a genetic predisposition. Environmental and psychological factors, which could
impact various members of the same family, may contribute to the symptoms of
the disease [30, 31, 32].
Significant data suggest that FM is genetically related to a wide range of
conditions subsumed under the rubric of “affective spectrum disorders” (ASD),
including major depression disorder (MDD) and anxiety disorders, premenstrual
dysphoric disorder, attention deficit hyperactivity disorder (ADHD), irritable
bowel syndrome (IBS) as well as migraine and cataplexy conditions [33].
For example, Hudson et al. [34] concluded that patients with FM were twice as
likely to have at least one of these other conditions, compared with individuals
without FM.
A recent study has refined our understanding of genetic links between mood and
pain/somatic disorders by suggesting intriguing patterns of genetic overlap and
environmental specificity for these conditions [33, 35]. Briefly, in a large twin
study on the relationship between two psychiatric disorders (MDD and
generalized anxiety disorder [GAD]) and somatic syndromes (FM, chronic fatigue,
IBS and recurrent headache), multivariate analyses suggested the influence of two
factors: one, most likely genetic, shared between somatic disorders, MDD and
GAD and a second one, more specific to somatic conditions, that was more
Genes implicated in mood disorders have been identified as risk factors for FM
and related pain states. These genes include the serotonin transporter (5HTT), the
serotonin 5HT2A receptor, catechol-O-methyltransferase (COMT) and the
dopamine D4 receptor. [33].
Although not found by all studies [36]
,
the association between FM and the “s”allele of serotonin transporter promoter locus (5HTTLPR) is particularly
interesting given its association with a wide range of conditions that are risk
factors for FM, including anxiety, neuroticism (tendency towards excessive
emotional reactivity to stressful stimuli), MDD, Bipolar Disorder, Psychosis and
even ADHD [33].
Results from several investigations indicate that a single nucleotide
polymorphism (SNP) in the serotonin transporter (5-HTT) gene may contribute
to enhanced pain sensitivity in patients with FM. Offenbaecher and colleagues
[37] were the first to report that the short (S) allele of this SNP (i.e., the S/S
genotype) in the regulatory region of the 5-HTT gene occurs significantly more
frequently in patients with FM than in healthy controls. Cohen and colleagues
[38] subsequently replicated this observation in an independent sample [39].
There also evidence that the presence of a SNP in the 5HTT gene may moderate
the association between exposure to stressful life events and depression [39].
Caspi and colleagues studied young adults in a large, prospective, longitudinal
study and found that, 1 or 2 copies of the short allele of the polymorphism
relation to stressful life events from age 21 to age 26 than those who were
homozygous for the long allele (
L/L
) genotype [40].Another area of investigation is the 5HT2A receptor gene; the analysis of genetic
polymorphisms showed that the serotonin 5-HT2A receptor polymorphism T/T
phenotype occurred more often in FM patients than in normal controls [41].
Interestingly, a separate study [42] noted that the same T/T allele, in the presence
of high maternal nurturance, was associated with lower depressive symptoms
than the C/C genotype, consistent with the notion that environmental factors
may play a role in triggering the development of mood disorders.
COMT is also a candidate for involvement in FM. The COMT gene encodes an
enzyme that metabolizes catecholamines (i.e., norepinephrine and dopamine) and
thereby influences several cognitive-affective phenotypes, including pain
phenotypes. COMT also has been implicated in the pathogenesis of migraine and
anxiety disorders, as well as a variety of cardiovascular diseases [39]. Initial
studies focused on the
val
158met
polymorphism, a SNP in codon 158 of the COMTgene that substitutes valine for methionine and results in reduced activity of the
enzyme. Individuals homozygous for the
met
158 allele of this polymorphismshowed a diminished mu-opioid receptor response to pain, and a stronger
subjective experience of pain when compared to heterozygous subjects. Opposite
effects in pain and negative affect have been found in
val
158 homozygotes [43].stress response, the trait of novelty seeking, cognition, MDD, schizophrenia,
anxiety disorders and ADHD [33].
Finally, some reports have established a connection between FM and dopamine
D4 receptor. For example, Buskila and colleages [44] have demonstrated an
association between FM and the
DRD4
exon III 7 repeat genotype, respect tohealthy controls; the frequency of the 7-repeat genotype was significantly lower
in persons with FM. Treister and collaborators [45] found an association between
the dopamine transporter gene (DAT-1) polymorphism and cold pain tolerance.
The results underlined the association between the DAT-1 polymorphism and a
decrease in pain threshold.
In conclusion, genetic studies of FM have noted alterations in genes regulating
(likely in a convergent manner with depression and pain) monoamine and
inflammatory signalling. It is tempting to speculate that shared genetic vulnerabilities
towards depression and pain states may be reflected in deregulation of circuitry
involved in modulating stress responses, pain and emotional states [33]. However, no
single candidate gene has been strongly associated with FM. It is very likely that FM,
depression and chronic pain have complex genetic factors, some of which may be
shared [46].
FM and
FM and
FM and
FM and Environmental Triggers.
Environmental Triggers.
Environmental Triggers.
Environmental Triggers.
Environmental factors may play a role in triggering the development of FM and a
number of “stressors,” such as physical trauma (especially involving the trunk),
disease), emotional stress, catastrophic events, autoimmune disease, and other
pain conditions have been correlated with the onset of the syndrome, [47, 48]. Of
note, each of these stressors leads to chronic widespread pain or FM in
approximately 5% to 10% of affected individuals. In other words, these stressors
do not act as triggers in the overwhelming majority of individuals who regain
their baseline state of health after experiencing infections or traumatic events
[49]. Commonly reported psychosocial triggers include chronic stress, emotional
trauma, and emotional, physical, or sexual abuse [4]. The effects of psychosocial
stressors may be especially pervasive because, in addition to being associated with
the onset of chronic widespread pain, they may also contribute to enhanced pain
responses via involvement of the neuroendocrine system [39].
Owing to the fact that different “stressors” can trigger the development of this
condition, the human stress response has been closely examined for a causative
role. This system is primarily mediated by the activity of corticotropin releasing
hormone (CRH) and norepinephrine [50].
The role of the peripheral and central nervous
The role of the peripheral and central nervous
The role of the peripheral and central nervous
The role of the peripheral and central nervous system in FM.
system in FM.
system in FM.
system in FM.
Pain pathways implicated in FM have peripheral and central components. Pain
signals are detected by peripheral nociceptive nerve endings and conveyed to
neurons located in dorsal root ganglia (DRG). From the DRG pain information is
conducted by lightly myelinated A-delta and un-myelinated slow C-fibers to
Aside from functional alterations in nerve membranes and endocellular signaling,
peripheral sensitization may occur as a result of alterations in synaptic
connectivity resulting from sprouting of sympathetic axons within DRG (which
may further augment pain transmission), ectopic discharges and ephaptic (direct
electrical transfer of signal) communication. Central sensitization in neuropathic
pain (NeP) may in part be mediated by collateral sprouting as well as damage to
inhibitory GABA inter-neurons [33, 51]. On the other hand, there are fewer data
to support an important role for abnormalities in peripheral or spinal cord pain
signaling in FM. Nonetheless, some evidence does indicate potential peripheral
contributions to the disorder [33]. For example, Salemi et al. have performed skin
biopsies in 53 FM patients and found mononuclear and fibroblast-like cells
adjacent to nociceptive neuronal fibres that stained positive for inflammatory
cytokines, suggesting a role for neurogenic inflammation in the etiology of the
FM [52].
After synaptic processing in the dorsal horn of the spinal cord, pain signals are
propagated via spinothalamic (paleo-spinothalamic) and spinoparabrachial
(neo-spinothalamic) tracts to higher central nervous system (CNS) pain centres.
Spinothalamic signals are relayed through thalamus to somatosensory cortices I
and II (SI and SII) and associated areas, including insula, anterior cingulate cortex
(ACC) and posterior cingulate cortex (PCC). ACC, in turn, has close bidirectional
connections with amygdala and hippocampus [33]. Spinoparabrachial fibers
amygdala, hippocampus and hypothalamus. Ascending pain signals and
information from supraspinal pain circuitry are integrated in the mesencephalic
periaqueductal gray area (PAG), which also has a pivotal role in regulating
descending pain pathways [33]. Dorsolateral prefrontal cortex (DLPFC) and
lateral-orbital prefrontal cortex (LOPFC) appear to initiate the descending pain
modulatory sequence, explaining how attention and anticipation may influence
the intensity of pain [33]. These prefrontal areas, richly innervated by dopamine
fibers, can trigger opioid release in PAG, substantially reducing the intensity of
experienced pain [33].
Imaging studies have consistently identified several brain areas as having a major
role in pain processing, including primary and secondary somatosensory cortices
(S1 and S2), thalamus, insula, ACC and PFC [33]. Together these brain areas are
commonly referred to as the “pain matrix” [53] and many studies indicate that
function is disrupted in this matrix in the context of chronic pain states, including
FM.
For example, Bailiki et al. utilized functional magnetic resonance imaging (fMRI)
to study chronic back pain patients. Functional neural imaging enables
investigators to visualize how the brain processes the sensory experience of pain.
These authors reported an association between the intensity of spontaneous pain
and activation of medial prefrontal cortex (mPFC) [54], an area known to have a
population, duration of pain was most strongly associated with increased activity
in the insula [54].
A second fMRI study noted a greater activation in DLPFC and ACC in response to
nonpainful stimuli in patients with FM relative to control subjects, a finding
likely to reflect alterations in processes central to the cognitive and emotional
aspects of pain, such as attention and anticipation [56]. In response to an
equivalent pressure stimulus, patients with FM have been shown to demonstrate
increased activity in several areas of the CNS pain matrix when compared to
normal control subjects, including S2, insula, posterior cingulate cortex (PCC),
ACC, superior temporal gyrus and inferior parietal lobule [57]. Moreover, mild
pressure applied to subjects with FM elicited subjective pain and cerebral
responses similar to the responses seen in normal subjects when twice as much
pressure was applied [57]. fMRI studies like these provide objective evidence of
altered cerebral processing of painful stimuli in FM patients.
In addition to functional differences, several studies have found significant
structural changes in the brains of FM patients. Kuchinad and co-workers
reported significantly reduced gray matter density in the cingulate cortex, insula,
mPFC and the para-hippocampal lobe of FM patients when compared to a control
group [58]. As with depression, the physiological changes that accompany FM
may themselves damage brain structures over time, given that in this study
duration of illness correlated with greater gray matter changes, such that each
[33]. Changes in these areas appear to contribute to the compromised pain
regulation, emotional modulation, stress responsivity and cognitive functioning,
often described in FM patients [58]. For example, Luerding et al. reported that
neurocognitive deficits in FM patients correlated with reduced gray matter
volume in DLPFC and ACC (areas typically associated with executive function),
additionally pain scores were noted to be negatively correlated with gray matter
volume in mPFC [33, 59].
Diagnosis and Therapy.
Diagnosis and Therapy.
Diagnosis and Therapy.
Diagnosis and Therapy.
Currently, there is no therapy formally approved by the European Agency for the
Evaluation of Medicinal Products or by the US Food and Drugs Administration
for treatment of the pain of FM or the syndrome as a whole [23]. Treatment is
largely empiric, although experience and small clinical studies have proved the
efficacy of low-dose antidepressant therapy and exercise [60]. Nowadays,
treatment of the FM syndrome includes both pharmacologic and
non-pharmacologic therapies. Pharmacologic therapies are based on antidepressants,
analgesics, muscle relaxants and antiepileptics. Non-pharmacologic therapies
include exercise, massage, cognitive behavioural therapy etc [61]. Today
non-pharmacological therapies, such as exercise, are recommended in the
management of FM symptoms together with pharmacological treatment. In fact,
it has been shown that aerobic exercise training improves physical function,
However, non-pharmacological therapies cannot replace pharmacological ones
yet.
The difficulty with making a formal diagnosis of FM is that laboratory tests are
normal and many of the symptoms mimic those of other conditions including
many rheumatic complaints, psychiatric conditions and other somatic disorders.
It is therefore important to exclude rheumatic disorders before proceeding to a
diagnosis of FM. It has been estimated that it takes an average of 5 years from the
time the patient’s first reports symptoms to the time when FM is formally
diagnosed [10, 62].
In spite of the alterations found in the different studies and although some
criteria were established to standardize patients for research studies, the diagnosis
of FM is basically clinical [63] and the lack of easily accessible laboratory
measures makes difficult to collect under the term of FM, patients presenting
with homogeneous features and prognosis [64, 65]. At present, there are no
specific markers of FM, and many of them are used only to understand the
pathogenetic mechanisms and to identify patient subgroups.
Therefore it is desirable to identify precise biomarkers of FM according to
feasibility and reproducibility criteria, for diagnostic and therapeutic purposes
PROTEOMICS
PROTEOMICS
PROTEOMICS
PROTEOMICS
In the last few years, it has become widely recognized that the genome only
represents the first layer of complexity. Biological function is carried by the
dynamic population of proteins, moreover, only the characterization of the
proteins themselves can reveal posttranslational modifications (e.g.,
phosphorylation, sulfation, glycosylation, ubiquitination, and methylation) and
give insight into protein-protein interactions and subcellular localization, thus
providing clues about function. For these reasons, there is increasing interest in
the field of proteomics: the large-scale identification of proteins contained in
cells, tissues or body fluids [66]. The proteome was originally defined as the
complete protein complement expressed by a genome [67]. However, this
definition does not take into account that the proteome is a highly dynamic
entity that will change based on cellular state and the extracellular milieu.
Therefore, the definition of a proteome should specify that it is the protein
complement of a given cell at a specified time, including the set of all protein
isoforms and protein modifications [68].
Proteomic analyses can be used to identify the protein content in complex
biological samples such as biological fluids and tissue extracts, and to determine
the quantitative or qualitative differences for each polypeptide contained in
different samples. It is expected that the proteomic profiling patterns resulting
from such analyses define comprehensive molecular signatures in health and
diseases has led to the hypothesis that multiple biomarkers or a panel of
biomarkers shown by proteomic profiling may correlate more reliably with a
specific disease than a single biomarker or protein. Expression pattern of a known
biomarker or correlation of expression of several known biomarkers can be a
valuable research and clinical tool for monitoring disease or treatment
progression [70].
For our study we used two complementary proteomic technique:
two-dimensional polyacrylamide gel electrophoresis (2-D PAGE) and surface
enhanced laser desorption ionization time of flight mass spectrometry
(SELDI-TOF/MS).
Two
Two
Two
Two----di
di
di
dimensional electrophoresis
mensional electrophoresis
mensional electrophoresis
mensional electrophoresis....
The identification of proteins from complex biological sample has traditionally
been performed using 2-D PAGE coupled with mass spectrometry (MS).
Two-dimensional electrophoresis (2-DE) separates proteins by both their isoelectric
point (pI) and molecular weight. With this technique proteins are resolved into
discrete spots, each of which represents a single protein that can be selectively
excised and identified by MS. The high resolution of 2-DE allows the researcher
to pick only the proteins of interest while bypassing the more abundant or less
interesting proteins [71].
Sample preparation
Sample preparation
Sample preparation
Sample preparation....
Preparation of samples for 2-D PAGE involves solubilization, denaturation and
reduction to completely break up the interactions between the proteins [72].
Although desirable, there is no single method of sample preparation that can be
universally applied due to the diverse samples which are analyzed by 2-DE gel
electrophoresis [73]. The ideal sample solubilization procedure for 2-D PAGE
would result in the disruption of all non-covalently bound protein complexes and
aggregates into a solution of individual polypeptides [74]. However, whatever
method of sample preparation is chosen, it is most important to minimize protein
modifications which might result in arte-factual spots on the 2-DE maps [73].
Samples containing urea must not be heated as this may introduce considerable
charge heterogeneity due to carbamylation of the proteins by isocyanate formed
from the decomposition of urea. Generally speaking, samples should be subjected
to as minimum handling as possible and kept cold at all times [75].
Protein extracts should not be too diluted to avoid loss of protein due to
adsorption to the wall of the vessel (glass or plastic). If samples are rather diluted
and contain relatively high concentrations of salts which can interfere with IEF,
samples may be desalted [73].
Alternatively, proteins can be precipitated with ice-cold TCA / acetone to remove
salts. Diluted samples with a low salt concentration may also be applied directly
solution. In this case, solid urea, CHAPS and dithiothreitol (DTT) are added to
the sample until the desired concentration is obtained [73, 76].
First dimension.
First dimension.
First dimension.
First dimension.
Iso-electro focusing (IEF) represents the first dimension of 2-DE and it is
performed in individual immobilized pH gradients (IPG) strips. Each sample
protein applied to an IPG strip will migrate to its isoelectric point (pI), the point
at which its net charge is zero. There are strips with broad or narrow pH gradient
(e. g., 3-10; 4-7; 4-9; 6-10; 5-6; 9-12; 10-12).
Dried gel strips containing immobilized pH gradient were commercially
introduced in 1991 (Pharmacia Biotech, Immobiline® DryStrip Gel), their
adoption for the first dimension of 2-DE has produced significant improvement
over the classical O’ Farrell carrier ampholyte-based 2-DE separation [77]. In the
original 2-DE the required pH gradient is established by the migration of
individual species of carrier ampholytes to their respective pI. Variations of the
complex carrier ampholyte mixtures result in variations in the shape of the pH
gradient [77]. The use of commercially prepared IPG DryStrip, introduced by
Bjellqvist et al. [78]. and Gorg et al. [79] eliminates these variations.
The pH gradient is immobilized by covalent incorporating Immobiline®
acrylamido buffers into the acrylamide matrix during polymerization. Since
by interlaboratory comparison [77, 80]. Further, pI resolution to 0.01 pH unit can
be achieved [78]. The acrylamide matrix with the Immobiline, acrylamido buffers
is cast onto a backing sheet, polymerized, washed and dried. The backing gives
the strips size stability and simplify handling. The dried strips can be rehydrated
in various buffers and additives that would inhibit polymerization if included at
the time of casting [77].
Second dimension.
Second dimension.
Second dimension.
Second dimension.
Prior to the second dimension (Sodium Dodecyl Sulphate PolyAcrylamide Gel
Electrophoresis-SDS-PAGE), the IPG strips are equilibrated twice with gentle
shaking in a solution containing urea and glycerol in order to diminish
electroendosmotic effects [79] which are held responsible for reduced protein
transfer from the first to the second dimension. DTT, a reducing agent, is added
to the first and iodoacetamide (IAA) to the second equilibration step [81]. IAA is
added to the equilibration buffer in order to remove excess DTT (responsible for
the "point streaking" in silver stained patterns) [82]. After equilibration the strips
are applied to vertical SDS gels in order to perform electrophoresis and to
separate proteins according to their molecular weight. Polypeptides separated can
be visualized by Coomassie Blue, silver staining, fluorescence or autoradiography,
or by "specific" stains such as glycoprotein staining or immunochemical detection
methods [73]. Whereas the "general" protein stains are carried out in the
performed after electrophoretic transfer ("blotting") of the separated polypeptides
from the electrophoresis gel onto an immobilizing membrane [83, 84]. Silver
staining methods are about 10-100 times more sensitive than various Coomassie
Blue staining techniques. Consequently, they are the method of choice when
very low amounts of protein have to be detected on electrophoresis gels. A huge
number of silver staining protocols have been published, based on the silver
nitrate staining technique of Merril et al. [85] and modifications.
Stained spots excised from the electrophoresis gel can be identified by mass
spectrometry.
Mass Spectrometry,
Mass Spectrometry,
Mass Spectrometry,
Mass Spectrometry, MALDI
MALDI
MALDI
MALDI----TOF
TOF
TOF
TOF----MS
MS
MS
MS....
In traditional protein chemistry, proteins were identified by de novo sequencing
using automated Edman degradation. Today, this technique is replaced by mass
spectrometry, which is becoming one of the most powerful techniques in protein
chemistry. The reason for this is a 100 fold increase in sensitivity and 10 fold
increase in speed. Until today, the matrix assisted laser desorption/ionization
time-of-flight mass spectrometry (MALDI-TOF-MS) has been the most
widespread technique used for protein identification [86, 87].
Spots of interest are excised from the gel and treated with tripsin, an enzyme that
cleaves C-terminal to arginine (R) and lysine (K). The mixture of protein
Basically, a mass spectrometer consists of three parts. In the first part (ion source)
the molecules to be analysed are ionised. The energy required for ionization of
the ions is provided by a laser (wavelength 337 nm). Once ionised the molecules
are accelerated and fly into the next part of the mass spectrometer, the analyser.
Here the individual ions are separated based on the size and charge of the
molecule. The last part of the instrument is a detector, which records the signals
from all ion [86].
Before transferred into the ionisation source the peptide or protein samples are
mixed with a matrix and the mixtures are placed to crystallize in small droplets
on a target. The matrix is an organic component like sinapinic acid (SPA),
dihydroxy benzoic acid (DHB), or α-cyano hydroxy cinnamic acid (HCCA). The
choice of matrix material and the method used depends on the sample and on the
sizes of the expected peptides.
The MALDI source is conveniently interfaced to a time-of-flight (TOF) analyzer.
In the TOF-analyzer the m/z ratio of the individual ions is measured based on the
flight time in a field-free drift tube. The m/z ratio of a peptide is calculated based
on the energy equation E=½mv2 (E=kinetic energy of the ion, m=mass,
v=velocity). At a constant energy, peptides with a high mass will have a longer
flight time in the tube before it reaches the detector at the end of the flight tube.
Therefore, the peptides are sorted due to the size of the individual peptides. Flight
times of ions are inversely proportional to their molecular mass. However,
energy during ionization. An ion mirror (a reflectron) and a time-lag focusing
(delayed extraction) are two approaches built into the MALDI-TOF instruments
today to overcome this problem [86].
This technique offers a fingerprint unique for the particular protein or protein
mixtures. The spectrum obtained is a graph of ion abundance versus the
mass-to-charge ratio. The experimental obtained mass-to-mass-to-charge (m/z) values can be
matched against theoretical obtained mass data from already identified protein
sequences and a score depending on the correlation can be given.
Correct identification of course requires that the database contain the specific
protein sequences, therefore, the approach is best suited for generically well
characterized organisms where the entire genome is known, but can also be used
for organisms were only part of the genome is known or for which very
homologous sequences are available.
MALDI is ideal for biological samples because it is compatible with buffers such
as phosphate and Tris and low concentrations of urea, non-ionic detergents, and
to a small degree alkali metal salts, however contaminants lower the sensibility of
the spectra. When analyzing small amounts of biological analytes using
MALDI-MS, optimizing sample preparation and removing contaminants from the sample
SELDI
SELDI
SELDI
SELDI----TOF
TOF
TOF
TOF----MS
MS
MS
MS....
Surface enhanced laser desorption ionization time of flight mass spectrometry
(SELDI-TOF-MS; by Bio-Rad Laboratories) is a high throughput technique,
particularly appropriate for the investigation of low-molecular weight proteins
(<of 25 KDa) with femtomole sensitivity and the ability to examine native
proteins that provides a complementary visualization technique of the 2-DE.
Furthermore SELDI-TOF-MS allows multiple samples to be analysed in a
relatively short time while 2-DE permits the analysis of a little number of
samples.
The principle of this technique is very simple [88]; a few microliters of a sample
of interest are deposited on the spots of Protein Chip Arrays that present
chromatographic surfaces with different physiochemical characteristics
(hydrophobic, cationic, anionic and presenting metal ion) to obtain a broad range
of proteins bound for analysis. The Protein Chip Arrays are incubated and then
washed with the appropriated buffer. The proteins are captured on the
chromatographic surface by depending on their properties and analyzed by TOF
mass spectrometry. The result is a spectrum comprised of the mass to charge
(m/z) values and intensities of the bound proteins/peptides. One of the unique
strengths of SELDI-TOF is its ability to analyze proteins from a variety of crude
sample types, with minimal sample consumption and processing [89].
ProteinChip® Arrays
ProteinChip® Arrays
ProteinChip® Arrays
ProteinChip® Arrays....
ProteinChip arrays are available with a variety of chromatographic surfaces.
Typically, chromatographic surfaces are used for profiling of proteins and
peptides in differential expression analyses.
The ProteinChip Q10 array: it is a strong anion exchange that can be used to
analyze molecules with a negative charge on the surface. The active spots contain
cationic, quaternary ammonium groups that interact with the negative charges on
the surface of target proteins, e.g., aspartic acid or glutamic acid. By maintaining
the pH of the binding/wash buffer at alkaline conditions (e.g., pH 8.0), an overall
net negative charge is imparted on a greater number of proteins within the
sample, and the result is more binding. By decreasing the pH of the binding/wash
buffer, an overall net positive charge is imparted on the proteins, resulting in less
binding (i.e., more specificity).
ProteinChip CM10 array: it is a weak cation exchange that can be used to analyze
molecules with a positive charge on the surface. The active spots contain weak
anionic carboxylate groups that interact with the positive charges on the surface
of target proteins, e.g., lysine, arginine or histidine residues. By decreasing the pH
of the binding/wash buffer, an overall net positive charge is imparted on a greater
number of proteins within the sample and the result is more binding. By
increasing the pH of the binding/wash buffer, an overall net negative charge is
imparted on the proteins, resulting in less binding (i.e., more specificity). Binding
strength of the buffer. By increasing the ionic strength, competition is generated
between the charged protein on the surface and the buffer ions, causing weakly
bound proteins to elute from the array surface (i.e., more specificity).
ProteinChip IMAC30 array: it is used to capture molecules that bind polyvalent
cationic metals such as nickel, gallium, copper, iron, and zinc. The active spots
contain nitrilotriacetic acid (NTA) groups on the surface that chelate metal ions.
Proteins applied to the array surface may bind to the chelated metal ion through
histidine, tryptophan, cysteine, and phosphorylated amino acids. To generate
selectivity, the binding and/or wash buffers may contain increasing
concentrations of competitors (e.g., imidazole), which compete with the metal on
the NTA group for binding to the protein or peptide.
ProteinChip H50 array: it is an hydrophobic surface that is used for capturing
proteins and peptides through reversed-phase or hydrophobic interactions.
Active spots contain methylene chains that closely mimic the characteristics of
C6 to C12 alkyl chromatographic sorbent.
Proteins less hydrophobic relative to the binding buffer will not bind to the array
surface, while proteins more hydrophobic will bind to the array surface. By
increasing the organic content of the wash buffer, the hydrophobic nature of the
buffer increases. Proteins that had previously bound to the array will divide into
the wash buffer and be washed away if their hydrophobicity is less than that of
the wash buffer. Only the most hydrophobic proteins will be retained with wash
Desorption, Ionization, and Analysis in t
Desorption, Ionization, and Analysis in t
Desorption, Ionization, and Analysis in t
Desorption, Ionization, and Analysis in the ProteinChip SELDI Reader
he ProteinChip SELDI Reader
he ProteinChip SELDI Reader....
he ProteinChip SELDI Reader
The technique relies on time-of-flight mass spectrometry for the accurate
measurement of the mass-to-charge ratio (m/z) of peptides and proteins.
The ProteinChip SELDI reader utilizes a nitrogen laser that induces both protein
ionization and a change of state from the solid, crystalline phase into the gas
phase. Therefore the analyte can move very rapidly, or fly, upon application of a
voltage differential. The voltage differential applies the same kinetic energy to all
of the analytes in the sample, thus resulting in flight times that depend upon the
mass (see the mass spectrometry chapter above). The ProteinChip SELDI reader
records the TOF of the analyte; from this measurement, a highly accurate and
precise mass is derived [Bio-Rad Laboratories].
SALIVA
SALIVA
SALIVA
SALIVA
In terms of disease diagnosis and prognosis, a human body fluid (e.g., blood,
urine, or saliva) appears to be more attractive than tissue because body fluid
testing provides several key advantages including low invasiveness, minimum
cost, and easy sample collection and processing [69, 90]. Serum or plasma have
been the fluids most often used in disease diagnosis but an issue with these
samples is sample preparation and handling. Another critical point is the
complexity of the proteome [90]. Most importantly, when searching for
biomarkers in blood, there are two serious consideration. First, the concentration
of substance can vary over 9 orders of magnitude, which severely diminishes the
likelihood of detecting those at the lower end of the scale; besides, blood is
composed of peptides, proteins and cells that have half-lives ranging from seconds
to weeks, or even a month or more. As a consequence, the presence of a given
substance might not accurately reflect the current state of the organism [91].
By contrast, human saliva is becoming a more attractive source for proteomic
profiling because it can provide clues to local and systemic diseases and
conditions. The physiology of the oral cavity is such that the flow of secreted
fluid is continually flushing and refreshing the fluid content of the mouth.
Therefore, the composition of the saliva temporally reflects the metabolic activity
of the secretory elements generating that fluid at any moment [91]. The logistical
advantages of salivary diagnostic are obvious; saliva is relatively easy to collect in
lower than those for serum and urine. Non-invasiveness, and ease of sample
processing are advantageous as well [69, 90, 92]. In addition, for health care
professionals and scientists, saliva tests are safer than blood tests, which are more
likely to result in exposure to HIV or hepatitis [90]. On the other hand, a variety
of factors may influence the rate of salivary flow and its physiologic
characteristics, including circadian rhythms and activities such as exercise, and
these factors should be taken into account when saliva is used as a diagnostic fluid
[92].
AIM
AIM
AIM
AIM
In the present work, for the first time, we used 2-DE in combination with MS
and SELDI-TOF-MS to obtain the whole saliva protein map of FM patients. The
aim of this study was the evaluation of the global changes of the protein profiles,
which occur in the disease and the research for any eventual diagnostic or
prognostic salivary biomarkers, which could be used routinely, in the future, for
the management of FM patients.
MATERIAL AND METHODS
MATERIAL AND METHODS
MATERIAL AND METHODS
MATERIAL AND METHODS
Chemicals
Chemicals
Chemicals
Chemicals....
Iodoacetamide (IAA), CHAPS, urea, thiourea, glycerol, SDS, TEMED, ammonium
persulfate, glycine, 30% acrylamide-N,N,N-bisacrylamide, trifluoroacetic acid
(TFA), HEPES and copper sulphate were acquired from Sigma-Aldrich (St. Louis,
MO, USA). Sodium chloride (NaCl), acetonitrile (ACN) from J.T. Baker. Sodium
acetate, Trizma base, SDS, DTT and trichloroacetic acid (TCA) from AppliChem.
IPGs pH 3–10 L, pharmalyte 3–10 and dry strip cover fluid were purchased from
GE Health Care, Europe (Uppsala, Sweden). Coomassie Brilliant Blue G 250 was
from Merck (Darmstadt, Germany). Transaldolase (T-20) and phosphoglycerate
mutase I (PGAM1) specific primary antibodies were from Santa Cruz
Biotechnology (CA, USA). Secondary antibodies (horseradish peroxidase
(HRP)-conjugated), donkey anti-goat and goat anti-mouse, were from Santa Cruz
Biotechnology and from PerkinElmer, respectively. DC and RC/DC protein assay
kit, chips CM10 and IMAC30, sinapinic acid (SPA) were provided by Bio-Rad. All
other reagents were supplied by standard commercial sources and were of the
highest grade available.
Human subjects
Human subjects
Human subjects
Human subjects....
A total of 85 patients were consecutively recruited from Department of Internal
Twenty-two women with a diagnosis of FM (mean age 43.38±13.23 years, M±SD),
made according to the ACR criteria for the disease [1], were enrolled in the study
of two-dimensional electrophoresis. Twenty-six healthy women, with similar
mean age (48.57±8.22; M±SD) and demographic characteristics, were included as
controls.
For Western blot and SELDI-TOF-MS analysis saliva samples were collected from
sixty-tree patients (mean age 45.39±11.09 years, M±SD; 55 females, 8 males), with
a diagnosis of FM made according to the ACR criteria and sixty-tree healthy
subjects (mean age 40.92±10.03 years, M±SD; 47 females, 16 males).
This study was approved by the local Ethics Committee. An informed consensus
was obtained for diagnostic or clinical purposes. Medical history and physical
examination of each patient was carefully recorded focusing in particular on the
number of tender points at the time of sample collections. Patients were also
asked to fulfil the FIQ and a visual analogue score scale (VAS) in order to assess
their overall pain levels. Moreover, as far as serological data is concerned,
complete blood tests, nonorgan-specific autoantibodies (Antinuclear antibodies.
ANA; Extractable Nuclear Antigen, ENA; Rheuma-test, Ra-test; Anti-cardiolipin
antibodies, ACLA) and thyroid hormones and thyroid specific autoantibodies
were detected in all the cases. Hepatitis B and hepatitis C infections were
excluded in all the participants. Patients affected by secondary FM who were
were excluded from the study. Patients with serious hepatic, cardiac, renal or
lung comorbidities were also not included in the study.
Finally, every FM patient had a psychiatric specialist evaluation to assess the
presence of psychiatric concomitant disorders. This psychiatric evaluation was
based on the administration of the Structured Clinical Interview for DSM-IV
(Diagnostic and Statistical Manual of Mental Disorders, 4th. Edition) axis-I
disorders (SCID-I/P) [93].
The clinical and serological data of the patients have been summarized in tables
2-4.
Table 2 Table 2Table 2
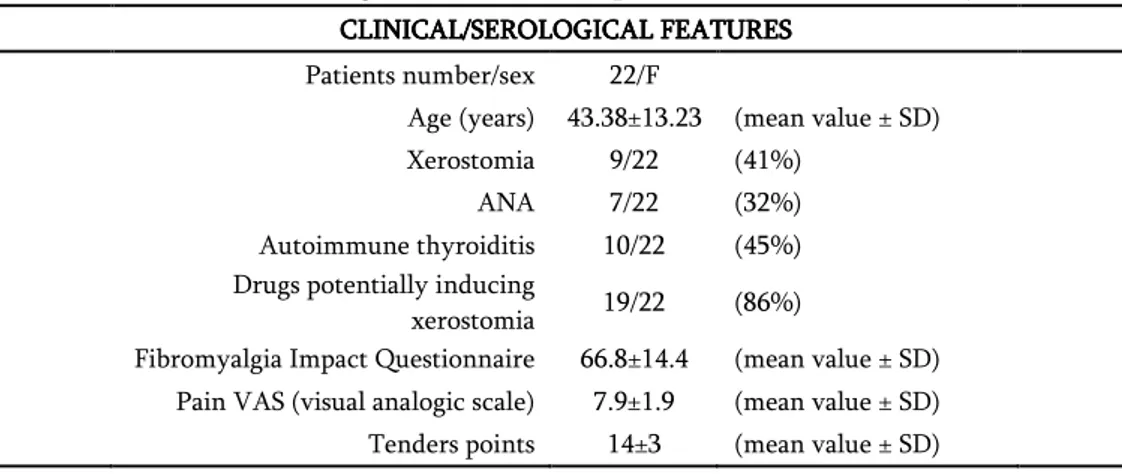
Table 2: Clinical and serological features of FM patients enrolled in the study of 2-DE.
CLINICAL/SEROLOGICAL FEATURESCLINICAL/SEROLOGICAL FEATURESCLINICAL/SEROLOGICAL FEATURESCLINICAL/SEROLOGICAL FEATURES
Patients number/sex 22/F
Age (years) 43.38±13.23 (mean value ± SD)
Xerostomia 9/22 (41%)
ANA 7/22 (32%)
Autoimmune thyroiditis 10/22 (45%)
Drugs potentially inducing
xerostomia 19/22 (86%)
Fibromyalgia Impact Questionnaire 66.8±14.4 (mean value ± SD)
Pain VAS (visual analogic scale) 7.9±1.9 (mean value ± SD)
Tenders points 14±3 (mean value ± SD)
Table 3 Table 3 Table 3
Table 3: Clinical and serological features of FM patients enrolled in the WB and SELDI-TOF-MS analysis.
CLINICAL/SEROLOGICAL FEATURESCLINICAL/SEROLOGICAL FEATURESCLINICAL/SEROLOGICAL FEATURESCLINICAL/SEROLOGICAL FEATURES
Patients number/sex 55/F 8/M
Age (years) 45.39±11.09 (mean value ± SD)
Xerostomia 28/63 (44%)
ANA 16/63 (25%)
Autoimmune thyroiditis 29/63 (46%)
Drugs potentially inducing
xerostomia 52/63 (83%)
Fibromyalgia Impact Questionnaire 68.5±194 (mean value ± SD)
Pain VAS (visual analogic scale) 7.8±2.1 (mean value ± SD)
Table 4 Table 4 Table 4
Table 4: Results of psychiatric evaluation FM patients enrolled in the study of 2 FM patients enrolled in the study of 2FM patients enrolled in the study of 2 FM patients enrolled in the study of 2----DEDEDEDE
PSYCHIATRIC COMORBIDITIES 8/22 (36%)
Depression 4/22 (18%)
Anxiety Disorder 3/22 (14%)
Panic Disorder 1/22 (4.5%)
FM patients enrolled in the WB and SELDI FM patients enrolled in the WB and SELDIFM patients enrolled in the WB and SELDI
FM patients enrolled in the WB and SELDI----TOFTOFTOF----MS analysisTOFMS analysisMS analysisMS analysis PSYCHIATRIC COMORBIDITIES 26/63 (41%) Panic Disorder 10/63 2/10 1/10 (16%) Eating Disorder Depression Anxiety Disorder 6/63 2/6 (9.5%) Depression Depression 5/63 (7.9%) Bipolar Disorder 4/63 1/4 (6.3%) Panic Disorder Eating Disorder 1/63 (1.6%)
Sample collecti
Sample collecti
Sample collecti
Sample collection and preparation
on and preparation
on and preparation
on and preparation....
Unstimulated WS samples were collected early in the morning in standard
conditions, i.e. all the subjects were asked no to eat (including gum or candies),
smoke or drink since the night before. About 2 ml of saliva were obtained from
each subject, processed immediately and kept on ice in order to minimize
proteins degradation. Immediately after collection, saliva samples were
centrifuged at 17000
g
for 30 min at 4°C to discard bacteria, exfoliated epithelialcells and debris. The resulting supernatants were stored at -80°C until use. The
protein amount was determined using Bio-Rad DC-protein assay. Bovine serum
2222----DE analysis
DE analysis
DE analysis
DE analysis....
For analytical gels, 150 μg of proteins, for each sample, were filled up to 350 µl in
7M urea, 2M thiourea, 4% CHAPS, 60mM DTT, 0.5% 3-10 ampholytes and
0.002% bromophenol blue (rehydration solution). Isoelectrofocusing (IEF) was
carried out by using 18 cm Immobiline Dry-Strips (GE Healthcare) with a linear,
pH 3-10, gradient. IEF was performed at 16°C on an Ettan IPGphor II apparatus
(Amersham Biosciences), according to the following schedule: the samples were
applied by in-gel rehydration for 10 h using low voltage (30 V), then the voltage
was linearly increased from 200 to 5000 during the first 4 h, and then the proteins
were focused for up to 70 000Vh at a maximum voltage of 8000 V. To prepare the
IPG strips for the second dimension, the strips were first equilibrated 15 min at
room temperature in a buffer containing 50 mM Tris-HCl, pH 8.8, 6 M Urea, 30%
glycerol, 2% SDS, 0.002% bromophenol blue, 1% DTT, followed by a second
equilibration for 10 min in the same buffer except that DTT was replaced by 2.5%
IAA. Subsequently, the IPG strips were applied horizontally on top of 12.5%
SDS-polyacrylamide gels (20x18x0.15 cm) and electrophoresis was performed
using the PROTEAN-II Multi Cell system (Bio-Rad) with constant amperage
(40mA/gel) at 10 °C until the dye front reached the bottom of the gel (about 5 h)
Staining and image analysis.
Staining and image analysis.
Staining and image analysis.
Staining and image analysis.
The analytical gels were stained with ammoniacal silver nitrate. The procedure of
silver staining consists of five sequential phases including protein fixation,
sensitization, silver impregnation, image development and stopping. To ensure
that the spot staining was within the values of the linearity range, the silver stain
was performed in standard conditions of time and temperature. All solutions were
kept at 4 °C, except for silver solution, while room temperature was controlled at
18 °C. All steps were performed on an orbital shaker.
Briefly, at the end of the second dimension run, the gels were removed from the
glass plates, washed in deionized water for 5 min, soaked in ethanol: acetic acid:
water (40: 10: 50) for 1 hour and then soaked in ethanol: acetic acid: water (5: 5:
90) overnight. After protein fixation, the gels were washed in deionized water for
5 min at 4°C and soaked in a solution containing glutaraldehyde (1%) and sodium
acetate (0.5 M) for 30 min. After washing 3 times in deionized water for 10 min at
4 °C, the gels were soaked twice in a 2.7 naphtalene-disulfonic acid solution
(0.05% w/v) for 30 min at 4 °C in order to obtain homogeneous dark brown
staining of the proteins. Then the gels were rinsed 4 times in deionized water for
15 min at 4 °C. Staining was carried out in a freshly made ammoniacal (30%)
silver nitrate (2.5%) solution for 30 minutes at 18 °C. After staining, the gels were
washed 4 times in deionized water for 4 min at 4 °C. The images were developed