ALMA MATER STUDIORUM – UNIVERSITA’ DI BOLOGNA
SCUOLA DI SCIENZE
Corso di Laurea in BIOLOGIA MARINA
Campus di Ravenna
EFFECTS OF THE INCLUSION
OF MICROALGAE SPIRULINE (Spirulina platensis)
IN THE DIET OF GILTHEAD SEABREAM (Sparusaurata)
ON GROWTH AND METABOLISM
TESI IN ADATTAMENTI DEGLI ANIMALI ALL’AMBIENTE MARINO
Relatore: Prof. Elena Fabbri Laureanda: Francesca Barbieri Correlatore: Prof. Juan Miguel Mancera
D. Ismael Jerez Cepa
VI SESSIONE
INDEX
Sommario
1 Introduction ... 1
1.1 Spiruline biology and composition ... 1
1.2 Use of Spiruline ... 5
1.3 Application of Spiruline in Aquaculture ... 6
1.4 Aquaculture of Gilthead seabream (Sparus aurata) ... 8
1.5 Stress: Definition and characteristics in aquaculture ... 11
1.6 Welfare in aquaculture ... 15
1.7 Welfare innovation in aquaculture ... 17
2 Research Scope ... 20
3 Materials and Methods ... 21
3.1 Inclusion of the microalgae Spirulina platensis in the diet of seabream (Sparus aurata) 21
3.3 Analysis of plasma metabolites ... 23
3.4 Statistical techniques ... 27
4 Results ... 28
4.1 Inclusion of the microalgae Spirulina platensis in the diet of seabream ... 28
4.2 Evaluation of the spiruline as anti-oxidant in a toxicological test ... 32
5 DISCUSSION AND CONCLUSION ... 37
5.1 Inclusion of the microalgae Spirulina platensis in the diet of seabream ... 37
5.2 Evaluation of the spiruline as anti-oxidant in a toxicological test ... 37
TABLES AND FIGURES
Table 1.Mean weight length and condition factor of animals after 128 days fed with the
different treatments ……….………...………29
FIGURE 1.ARTHROSPIRA PLATENSIS GOMONT,1892 ... 1
FIGURE 2.SPARUSAURATA LINNAEUS,1758.. ... 8
FIGURE 3.MAIN PRODUCER COUNTRIES OF SPARUS AURATA (FAOFISHERIESSTATISTICS,2006) ... 9
FIGURE 4.GLOBAL AQUACULTURE PRODUCTION OF S. AURATA FROM 1950 TO 2014 ... 10
FIGURE 5.NITROGEN CYCLE ... 13
FIGURE 6.STRESSORS ACT ON FISH TO EVOKE PRIMARY, SECONDARY AND TERTIARY OR WHOLE-ANIMAL RESPONSES.. ... 15
FIGURE 7.EXAMPLE OF TANKS DISTRIBUTION FOR THE GROWTH EXPERIMENT. ... 21
FIGURE 8.PLANNING OF SAMPLING FROM THE BEGINNIG TILL THE LAST DAY (GROWTH EXPERIMENT). ... 22
FIGURE 9.EXAMPLE OF FISH DISTRIBUTION AND SAMPLING DURING THE NITRITE EXPOSURE. ... 22
FIGURE 10.THE GLUCOSE REACTIONS DUE TO THE COMMERCIAL KIT “GLUCOSA –HK” ... 23
FIGURE 11.THE LACTATE REACTIONS DUE TO THE COMMERCIAL KIT “LACTATE”. ... 24
FIGURE 12.THE TRIGLYCERIDES REACTIONS DUE TO THE COMMERCIAL KIT “TRIGLYCERIDES” ... 26
FIGURE 13.MEAN WEIGHT OF ANIMALS AFTER 128 DAYS FED WITH THE DIFFERENT TREATMENTS. ... 28
FIGURE 14.PLASMA GLUCOSE OF ANIMALS AFTER 128 DAYS FED WITH THE DIFFERENT TREATMENTS . ... 30
FIGURE 15.PLASMA LACTATE OF ANIMALS AFTER 128 DAYS FED WITH THE DIFFERENT TREATMENTS. ... 30
FIGURE 16.PLASMA TAG OF ANIMALS AFTER 128 DAYS FED WITH THE DIFFERENT TREATMENTS. ... 31
FIGURE 17.PLASMA PROTEINS OF ANIMALS AFTER 128 DAYS FED WITH THE DIFFERENT TREATMENTS. ... 31
FIGURE 18.PLASMA GLUCOSE OF ANIMALS AFTER 24 HOURS WITH AND WITHOUT NITRITES. ... 33
FIGURE 19.PLASMA GLUCOSE OF ANIMALS AFTER 72 HOURS WITH AND WITHOUT NITRITES. ... 33
FIGURE 20.PLASMA LACTATE OF ANIMALS AFTER 24 HOURS WITH AND WITHOUT NITRITES. ... 34
FIGURE 21.PLASMA LACTATE OF ANIMALS AFTER 72 HOURS WITH AND WITHOUT NITRITES. ... 34
FIGURE 22.PLASMA TAG OF ANIMALS AFTER 24 HOURS WITH AND WITHOUT NITRITES. ... 35
FIGURE 23.PLASMA TAG OF ANIMALS AFTER 72 HOURS WITH AND WITHOUT NITRITES. ... 35
FIGURE 24.PLASMA TOTAL PROTEINS OF ANIMALS AFTER 24 HOURS WITH AND WITHOUT NITRITES. ... 36
Abstract
In gilthead seabream aquaculture, the feed supplies in the market is very expensive due to its high content of animal protein. In this respect,spiruline appear to be a valuable substitute to animal and vegetable protein.In this study we performed two experiment. The scope of the first one was to determine the effect of the inclusion of Spirulina platensis hydrolyzed on the physiological state and growth in juvenile fish of S. aurata.A total of 180 individuals were fed for 128 days with three different feeds: control diet, diet with 2% of hydrolyzed microalgae (Sp2), and diet with 4% of hydrolyzed microalgae (Sp4).The experimental groups were tested in triplicate (except control group that was in duplicate). Biometric parameters were registered every two or three weeks. At the end of the experiment blood samples were collected to analyze plasma metabolites. After this we try to evaluate the anti-oxidant response of first experiment remained animals in a toxicological assay with sodium nitrite lasting three days. Fish were divided into control, Spi 2% and Spi 4%, all them with and
withoutNaNO2. Even then, the plasma metabolites data were collected after 24h
and 72h. At the end of the first experimentthe administration of S. platensis seems to have a negative impact on growth of S. aurata respect the control feed. Furthermore, the lactate content registered showed a significant difference between the control and the spiruline administration. In the second experiment the spiruline feed showed a glucose and a lactate content with significant differences after 72h of exposition to nitrites respect the control group due to the interaction between nitrites and treatment. S. platensis hydrolyzed 2% and 4% do not seems a good substitution for S. aurata both as a growth enhancer and improver of health metabolic pathways. Regarding its role as a good antioxidant in this experience it has not been confirmed.
1 Introduction
1.1 Spiruline biology and composition Spirulina sp. is a cyanobacteria (blue
continues to be defined as a member of algae, rediscovered in recent years.
It was first used by Mexicans (Aztecs) who started using this microorganism as human food. About 3.5 billion yea
a huge contribution to the natural process of converting oxygen (O2)through the process of
photosynthetic bacteria that cover the groups of Cyanobacteria and Prochlorales of prokaryote kingdom (Ali & Saleh, 2012). There are two species, Arthrospira platensis(Fig.1)
tiny and has green, gas vacuolate filaments (3 to 12 µm) coiled in spirals of varying tightness and number, it grows naturally and rapidly in the alkaline waters with high pH and salinity (Ali & Saleh, 2012).
from a nutritional point of view, is given by:
Figure
- 1 - Spiruline biology and composition
yanobacteria (blue-green algae), while for convenience it continues to be defined as a member of algae, rediscovered in recent years.
was first used by Mexicans (Aztecs) who started using this microorganism as 5 billion years ago, it played an equally crucial role giving a huge contribution to the natural process of converting carbon d
through the process of photosynthesis. It belongs to oxygenic photosynthetic bacteria that cover the groups of Cyanobacteria and rokaryote kingdom (Ali & Saleh, 2012). There are two species,
(Fig.1) and Arthrospira maxima (Ciferri, 1983
tiny and has green, gas vacuolate filaments (3 to 12 µm) coiled in spirals of varying tightness and number, it grows naturally and rapidly in the alkaline and salinity (Ali & Saleh, 2012). Its composition, important itional point of view, is given by:
Figure 1.Arthrospiraplatensis,Gomont 1892 (http://www.cyanodb.cz/Arthrospira)
green algae), while for convenience it continues to be defined as a member of algae, rediscovered in recent years.
was first used by Mexicans (Aztecs) who started using this microorganism as played an equally crucial role giving dioxide (CO2) to
hotosynthesis. It belongs to oxygenic photosynthetic bacteria that cover the groups of Cyanobacteria and rokaryote kingdom (Ali & Saleh, 2012). There are two species, Ciferri, 1983). Its form is tiny and has green, gas vacuolate filaments (3 to 12 µm) coiled in spirals of varying tightness and number, it grows naturally and rapidly in the alkaline Its composition, important
- 2 -
Proteins
The protein content of spiruline, that is quite exceptional, varies between 50% and 70% of its dry weight. It has a complete framework of proteins, since all the essential amino acid are present, forming 47% of total protein weight. Among these essential amino acids, the most poorly represented are the sulphur-containing methionine and cysteine. There is also a slight amount of lysine. Therefore, the biological value of proteins in spiruline is very high and through a supplementation with a good source of sulphur-containing aminoacids and also lysine and/or histidine (for example cereals) an optimum product can be developed (Falquet, 2016).
Lipids
The lipid content is registered as 5.6-7% of dry weight (in both S. platensis and S. maxima), or 11% by using a better extraction system. These total lipids can be separated into a saponifiable fraction (83%) and a non-saponifiable fraction (17%).
Fatty acids
It can be noted the presence of polyunsaturated fatty acids, which constitute 1.5-2% of this cyanobacteria (Yeganeh et al.,2015).Gamma-linolenic acid, that is one of the best known complex fatty acids precursor, represents only 10-20% of fatty acids in S. maxima (1-2% of dry matter), whereas in S. platensis is 40%. It is a rare fatty acid and with a high nutrient value. Normally synthesized in human from linoleic acid (18:2 omega-6) of vegetable origin, usually cannot be directly assimilated. Its importance is due to the fact of being a valuable precursor of the prostaglandins, leukotrienes and thromboxanes that serve as chemical mediators of inflammatory and immune reactions. Other important fatty acids that are present are linoleic acid (18:2 omega-6) and gamma-linoleic acid (18:3 omega-6) that forms more than 60% of lipids in S. maxima and more or less 25% in S. platensis. Furthermore, sulfolipids (5% of the saponifiable fraction) seems to be protective against HIV infection of T-helper cells. Besides this, Spirulina sp. do not contain fatty acids with uneven carbon numbers and a very low level of branched-chain fatty acid, two types of lipids that cannot be
- 3 -
metabolized by higher animals. It can however be noted the presence of polyunsaturated fatty acids (Yeganeh et al.,2015) In case of fatty acids deficiency Spirulina sp. has been recommended as a food supplement.
Non-saponifiable lipids
While some authors emphasize the absence of sterols, it appears to represent 1.5% of the non-polar fraction of S. maxima lipids. In general, the sterols identified in spiruline are cholesterol and beta-sitosterol. Some of these sterols may be involved to the antimicrobial activity of spiruline. Terpene alcohol accounts for 5-10% of the non-saponifiable fraction and long-chain saturated hydrocarbons correspond to a fraction of 25% of the non-saponifiable element in both S. platensis and S.maxima. Two thirds of these hydrocarbons subsist in n-heptadecane (C15, C16, C18) and three unidentified saturated branched-chain hydrocarbons (Falquet, 2016).
Carbohydrates
Carbohydrates represent 15-25% of the dry weight of Spirulinasp. Glucose, fructose and sucrose can be found in very small quantities; polyols such as glycerol, mannitol and sorbitol are also present. The assimilable carbohydrates consist of polymers such as glucosamine (1.9% of dry weight), rhamnosamine (9.7%) or glycogen(0.5%).This is due to the cell walls composed by glucosamines and muramic acid associated with peptides. These walls are fragile and make the cell content readily accessible to digestive enzymes; this is a major advantage in comparison to organisms with cellulosic cell walls (for example yeast and chlorella). As it regards the nutritional aspect the carbohydrate that is present in sufficient quantities to be of interest is mesoinositol phosphate, which is an excellent source of organic phosphorus and inositol (350-850mg/kg dry matter). This inositol content is about eight times that of beef and several hundred times that of the vegetables with the highest levels. It is also important to point out that spiruline polysaccharides are believed to have a stimulating effect on DNA repair mechanism, which may be linked to the radio-protective efficacy of this cyanobacteria. Polysaccharides are
- 4 -
also thought to have immune-stimulating and immune regulating properties (Falquet, 2016).
Nucleic Acids
Regarding to S. platensis and S. maxima the total levels of nucleic acids is 4.2-6% of dry matter. The nucleic acid content of spiruline is far lower than that of unicellular organisms in general. The DNA/RNA content, then, does not pose problems, even over long periods and at high dosage (Falquet, 2016).
Vitamins
Pro-Vitamin A (β-carotene)
Beta-carotene corresponds approximately to 80% of the carotenoids present in spiruline, the remaining 20% is composed by phycoxanthin and cryptoxanthin. Beta-carotene and cryptoxanthin are convertible into vitamin A by mammals. The absence of free vitamin A means that there is not a cumulative toxicity effect. In human studies, it has been demonstrated that the spiruline can be used against chronic vitamin A deficiency, cancer and AIDS pandemic. It has been shown that the transmission of HIV from an infected mother to her child is strongly dependent on vitamin A deficiency (Falquet, 2016).
Vitamin E (tocopherols)
Dry spirulinecontains 50-190 mg/kg of vitamin E. Tocopherols with beta carotene, phycocyanine and superoxide dismutase enzyme (Sakinek et al., 2015)have an important role of antioxydant for unsaturated fatty acids(Falquet, 2016).
Vitamin B12
The content of vitamin B12 is exceptionally high in spiruline. This vitamin is not usually found in a meatless diet, no common plant derived food contain it. Spiruline is four times as rich in B12 compound as raw liver, which resulted to be the best choice among meat derived food. Vitamin B12 deficiency derives
- 5 -
either from a shortfall in intake or from defective absorption. Besides that, (pernicious anemia)B12 deficiency is very often caused by pathological conditions such as HIV infections leading to AIDS (Falquet, 2016).
Minerals and trace elements
The most important minerals that we can find inside Spirulina sp. are iron, calcium, phosphorus and potassium. Iron is highly present, and this is important for iron deficiencies that are very widespread, particularly in pregnant women and children. Moreover good sources in food are rare. In case of spiruline, iron bioavailability has been demonstrated both in rats and humans. Calcium, phosphorus and magnesium occur in spiruline in quantities comparable to those found in milk. The relative amounts of these elements are balanced which excludes the excess of phosphorus. It is also important to underline the high amount of potassium present, as the potassium/sodium ratio available in the majority of food sources is often a source of concern for nutritionist (Falquet, 2016).
1.2 Use of Spiruline
It is cultivated worldwide and used as a dietary supplement. It can be manufactured in tablet, flake and powder form (Belay, 2008). Moreover, it’s important to mark that it is used as food supplement in the aquaculture, aquarium and poultry industries. This cyanobacterium possess a balanced protein composition, rare essential lipids, numerous minerals and even vitamin B12. The interest aroused by this microorganism it’s due to high-digestibility, high-quality and simple production as food supplement (UNWFC, 1975) so that it has been declared “the best for tomorrow” (Radhakrisnan et al.,2016). It has attracted the attention of both researchers and industrialists alike. In medical scope is gaining more attention as nutraceutical and source of potential pharmaceuticals. Spiruline induces also the activity of immune system. It could support both the cellular and humoral alarms of the immune system and thus improving their ability function in spite of stresses from environmental toxins and
- 6 -
infectious agents, natural biochelate vitamins especially carotene and an antioxidant enzyme, superoxide dismutase (SOD). S. fusiformis possess potent antiviral activity and anti-cancer effects, strengthens immune system significantly reduces the nephro-toxicity (Falquet, 2016). Some toxicological studies underline the risk to consume spiruline: it is recommended that healthy adults consume no more than 4 grams per day to prevent the risk of vitamin A and heavy metals excess. Furthermore, if this cyanobacteria is improperly processed it could contain cyanotoxins that could accumulate in the body over time (Belay, 2008).
1.3 Application of Spiruline in Aquaculture
FAO predicts that world production of fisheries and aquaculture sector will stretch 172 million tons in 2021, looming essentially to increased demand for fish. This raise will be attributable mostly to aquaculture, to whose production strength will be extended by 33% in the period 2012-2021. This reality involves the need to increment aquafeed productions to fulfill the aquaculture demands. Actually what is mostly utilized to feed carnivorous fish as the main source of protein is fishmeal. However, the cost of fish food has increased markedly in recent years; this has led to find alternative and renewable ingredients for aquafeeds that should meet some important requirements, such as high protein content, adequate fatty acid profiles, secured supplies as well as affordable costs. The answer could be plant derived proteins, but they possess a wide range of anti-nutritional factors and high inclusion level of these ingredients can induce negative effects on growth and digestive enzyme activities. In some species such Oncorhynchus mykiss and Sparus aurata it can lead to an actual modification of the intestinal tract (Santigosa et al., 2008), even if it has been delineated to have an enteritis-like effect on gastrointestinal epithelium. For this reason, and thanks to their composition of proteins, lipid unsaturated fatty acids (HUFAs), vitamins, chlorophylls, carotenoids and phycobiliproteins, microalgae appears a promising alternative aimed to enhance the nutritive value of conventional feeds and to be used as a substitute for fishmeal. Therefore, they could reduce ecological impact, correlated to current fish-meal based intensive
- 7 -
fish farming, if sufficient quantity of algal biomass becomes available at an appropriate price.The actual price of dry microalgae biomass could be established below 10 euros/kg. Concurring to some knowledge, partial substitution of fishmeal by microalgae biomass can induce concrete effects on growth, feed utilization, lipid metabolism, body composition, meat quality and resistance to stress and disease(Vìzcaino et al., 2014). Furthermore, in many studies no evidence indicating negative effects on growth or fish development werereported (Olvera-Novoa et al., 1998; Nandeesha et al., 2001).
With regard to ingestion efficiency, it has been proved that the administration of Spirulinasp.has a positive effect on various species, as in a search conduct in juvenile stages of tilapia (Oreochromis niloticus) (Lu et al., 2006). Also, the digestibility and fat deposition, thanks to the absence of peptidoglycan walls, is higher in many fish (Nandeesha et al.,2001). However, the diet based on Spirulina sp. at high levels seems to lead to a reduced growth rate (El-Sayed,1994). In any case, the response of fish to algae is species – specific (Nandeesha et al., 2001). Spiruline can also be used as a useful immune stimulant in aquaculture (Watanuki et al., 2006;Machas-Sancho et al.,2014;Yeganeh et al., 2015).In O. nocticulus the mortality due to Aeromonas hydrophila infection was reduced with a higher level of spiruline. Yet this revealed that spiruline is a viable alternative to antibiotics for disease prevention (Abdel-Tawwab & Ahmad,2009). Spirulinasp.can influence the livery coloration and reproduction, which is very important in ornamental fishes like cichlid. Thanks to fatty acids, alpha-tocopherol, ascorbic acid and carotenoid likexanthophylls-b, beta-carotene and zeaxanthin present in the cyanobacteria these characteristics are valorized (Karadal et al., 2016). The composition of Spirulina sp. fatty acids, which are essential in the fish and in the human diet, can affect the grade of the fillet subject to the treatment. Jafari et al. (2014) evaluated the fatty acids composition in O. mykiss to which has been administered S. platensis.It is well known that spiruline has an important role as antioxidant and tissue protector. For example, vitamin E is very important for crustaceans, and many fishes in general, because they are not able to convert glucose to ascorbic acid. They are thus dependent on constant supplies of vitamin E (Radhakrishnan et al.,2013). Its antioxidant property results to be
- 8 -
significant also in cases of intoxication. In a case of study O. niloticus was exposed to subacute deltamethrin (DLM, a widely used insecticide) and two levels of spiruline were administered to cope the poisoning. Spiruline supplementation enhanced all altered serum biochemical parameters as well as tissue lipid peroxidation and antioxidant biomarkers. Therefore, spiruline administration could minimize DLM-induced toxic effects by its free radical scavenging and potent antioxidant activity (Abdelkhalek et al., 2014).
1.4 Aquaculture of Gilthead seabream (Sparus aurata)
The gilthead seabream (Sparus aurata)(Fig. 2), is a marine eurythermic and euryhaline teleost (Class Actinopterygi, order Perciformes, family Sparidae).
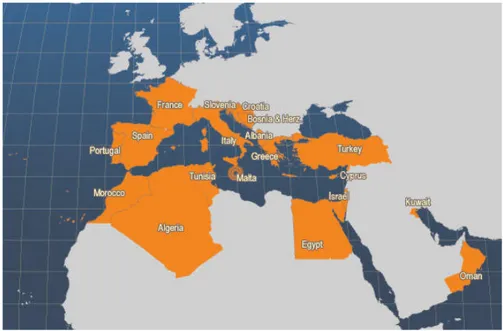
According to the latest FAO data of 2014, the global production of S. aurata is of 165092 ton of which 96% belongs to aquaculture production (158389 Tn) and only 6703 Tn regards fishing. The 32% of S. aurata production belongs to Greece, followed by Turkey with a production of 26%,andEgypt and Spain with 11% each (Fig.3). The total value of all this is 490M euro (FAO Global Fishery and Aquaculture Statistics, 2016).
Figure 2.Sparus aurata
- 9 -
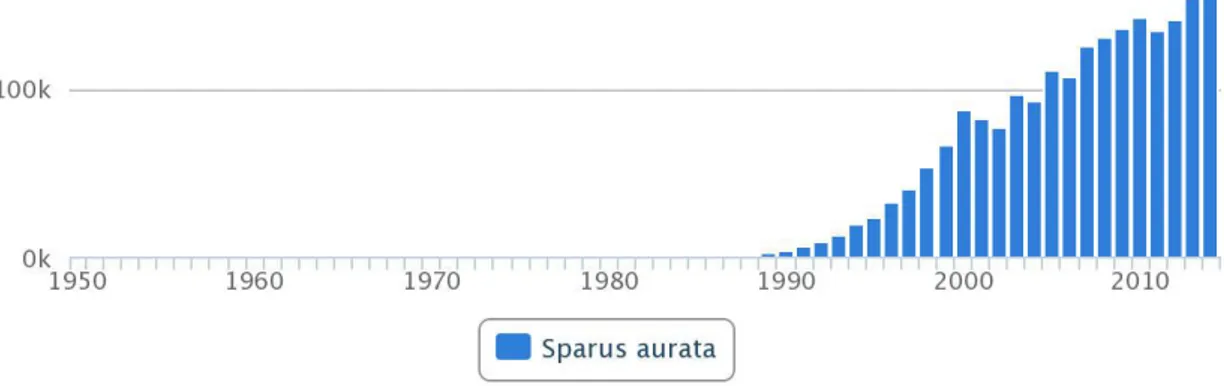
At the beginning, seabream have been farmed extensively in the coastal lagoons and brackish ponds of northern Italy (‘vallicoltura’) and in southern Spain (‘esteros’). Then, In the 1980s the reproduction in captivity reached the desired success and intensive breeding farm systems (especially sea cages) were developed. Since then this species has become one of the main products of European aquaculture. Initially, farming principally get dragged into capturing juveniles, but at the moment most of the sea bream production comes from juveniles produced in technologically sophisticated hatcheries lacking skilled staff. The traditional market for seabream has become saturated (Fig.4). The principal key performance indicators of Mediterranean aquaculture – growth, mortality and feed efficiency – have not advanced. Actually, they may have got worse.
- 10 -
Figure 4.Global aquaculture production of S. aurata from 1950 to 2014(http://www.fao.org/fishery/culturedspecies/Sparus_aurata/en)
First of all, the Mediterranean aquaculture industry requiresto highlight the adoption of more sophisticated methods marketing for coming growth. This is an obligation for entering new markets, but it is also necessary for enlarging the existing ones. Product diversification could also help the seabream aquaculture in the Mediterranean region. Seabream should not only be available as a goods item but also a value-added product. The development of possible markets and value-added products is likely to lead to higher preconditions for controlled and predictable quality, and for larger fish. The seabream industry still needs more efficient production systems and new technologies. These latter should take into account the necessity to minimize the possible impact of seabream aquaculture practices in coastal areas, such as:
- Farm location and the influence of organic matters like phosphorus and nitrogen, which can lead to eutrophication.
- Farmed fish escapes that can bring to a set of problems, involving dilution of the wild stock genetic pool through interbreeding, decreased wild stock fecundity, and modifications in the structure of the food web. - Transfer of diseases parasites between farmed and wild fish.
- Introduction of non-indigenous species that can act as “pests” in local communities.
- 11 -
As regard to health and disease it is important to identify emerging illness and establishing good health avoids losing money, the sector cannot support losses of >5-7%. We must also take into account that nurseries are not well prepared and there is a significant issue in applying the “basic” in the early life stages. About feed and nutrition, it is important to rough out more cooperation between research and industry, accompanied by more business-oriented research that is not seen in the Mediterranean at the moment.Finally, it would be important to find the suitable procedures for growing seabream in intensive farming. In this way chronic stress registered through a lowering of growth and a rise in plasma cortisol would be avoid (EAS & EATiP, 2014).
1.5 Stress: Definition and characteristics in aquaculture
The stress is “a measurable alteration of a physiological steady state that is induced by an environmental change and that renders the individual more vulnerable to further environmental change” (Newman, 2000).
It can be due to numerous factors or “stressors” (Fig.6) and their nature could be:
i) chemical: contaminant and pollutant exposure, low oxygen,
acidification;
ii) physical: handling, crowding, capture, confinement, transport; or
iii) perceived: stimuli evoking startle response, presence of predator.
Moreover, in aquaculture, water temperature and food supply have an influence on fish stress and especially on growth. Poor water quality and its deterioration increase negative interaction when fish are maintain at higher density (Pickering, 1993).Furthermore, different size-classes fish maintained in the same enclosure can create social stress between dominant and subordinated fish, that ends in a higher consumptionof theirenergy reserves and a decline ingrowth.This becomes important in intensive culture in which the fish occupy most of the space all time and it can influence in turn the water quality. Handling
- 12 -
and transport if is not done correctly can compromise fish welfare, common fish handling include using seines, nets or hands for moving fish to new aquatic enclosure. If this is not done properly disrupts the protective mucous coating and fish scales, thereby increase the susceptibility to parasitic or pathogenic invasion. When fish are stressed their ability to resist the assault is weakened, and stress is considered a primary contributing factor that leads to impaired health in culture fish (Conte, 2004). Also, species may differ in the nature of their physiological response and reproductive consequence to stressors. For example, disturbance or handling may affect the timing of reproduction (Schreck et al.,2000).
Nitrite as an element of stress in aquaculture
One of the most common chemical compounds in aquaculture is the nitrite. It enters in a fish culture system after feed is digested by fish and the surplus of nitrogen is transform into ammonia, which is then excreted as waste into the water. Total ammonia nitrogen (TAN; NH3 and NH4+) is then turn to nitrite (NO2-)
which, under normal conditions, is quickly converted to non-toxic nitrate (NO3-)
by naturally denitrifying bacteria (Fig.5).Feed that is not eaten and other organic matter also break down into ammonia, nitrite, and nitrate in a similar manner. Nitrite problems are mainly in closed, intensive culture systems due to insufficient, inefficient, or malfunctioning filtration systems.High nitrite concentrations in ponds occur more frequently in the fall and spring when temperatures are waving, emerging in the breakdown of the nitrogen cycle due to plankton and/or bacterial activity reduction.A decreasing in plankton activity in ponds (because of lower temperatures, nutrient depletion, cloudy weather, herbicide treatments, etc.) can result in less ammonia assumed by the algae, thus spread the load on the nitrifying bacteria.
- 13 -
Figure 5.Nitrogen cycle
(http://www.thefishsite.com/articles/202/ammonia/)
Elevated concentrations of nitrite can also be found in water taking nitrogenous effluents, in various hypoxic environments or in effluents from industries producing metals, dyes and celluloid. Factors that influence the nitrification process comprise pH, temperature, concentration of dissolved oxygen, number of nitrifying bacteria, and the presence of inhibiting compounds, e.g. nitrous acid, NH3 and antibiotics. Since this is a nitrogen-related problem, the most
evident preventive measures is to reduce or minimize the amount of nitrogen incorporated into the system by reducing feeding rates and utilize sodium chloride or calcium. The chloride portion of salt competes with nitrite for absorption through the gills. Nitrite is a well-known toxicant for fish as well as an altering substance of multiple physiological functions including ion regulatory, respiratory, cardiovascular, endocrine and excretory processes. One critical consequence of nitrite accumulation is the oxidation of haemoglobin to methemoglobin, prejudice blood oxygen transport. Nitrite toxicity to fish varies considerably and depends on a large number of external and internal factors.Among the most prominent ones are water quality (e.g. pH, temperature, cation, anion and oxygen concentration), length of exposure, fish species, fish size and age, and individual fish susceptibility. Nitrite concentrations in all the examined organs do not achieve the same levels as in the blood. Nevertheless, it looks to be the primary target of nitrite action.From the blood plasma, nitrite spreads into red blood cells, where it oxidizes iron in haemoglobin (Hb) to the
- 14 -
+3 oxidation state. Haemoglobin that is changed in this way is called
methaemoglobin, which omit the capacity to bind oxygen
reversibly.Themethaemoglobin decreases the total oxygen-carrying capacity of the blood. Nitrite has multiple physiological effects.As a result, the hypoxic conditions caused by methaemoglobinaemia could harm various organs such as liveror retina. Tissue hypoxia and anaerobic energy production can be reflected in elevated plasma lactate concentrations and, generally, a 24–48 hour exposure is required for maximum accumulation of nitrite in fish (Durborow, 1997,Kroupovaet al., 2005).
Stress effects
Whenever fish alter behavior in aquaculture, go off feed or show lethargic or erratic swimming it is an indication of unfavorable states, stress, distress or pathogenic condition. When this behavior isnoticed steps should be taken to define the cause and initiate the corrective action. One of the more dramatic visual indicator of stress is a change of the color in the tegument (Conte, 2004). The rejoinder of fish to stress has both adaptive and maladaptive factors. Fish have an intrinsic capacity to respond physiologically to stress to overcome the disturbance inflicted. But when response mechanisms are forced beside their normal limits, the response become harmful to the fish’s health, or are maladaptive. Adaptive and maladaptive aspects of the stress response may occur sequentially or simultaneously in the fish. Continued secretion and plasma elevation of corticosteroids under chronic stress are clearly detrimental to fish and are, therefore, consider maladaptive. The importance of increasing stress is important for aquaculture as it indicates that, while subletha ldisturbances may not appear to be harmful, the accumulation of response to such disturbances within a time period insufficient to allow for recovery between them could be detrimental to individual fish and, thus, the population. The primary response to various types of stressful stimuli is the elevation of plasma corticosteroids, mainly cortisol, in teleost fish in response has been well documented(Foo & Lam, 1993; Barton, 2002). Disclosure to certain types of toxicants are obviously detrimental to fish in that they cause direct mortality or damage fish health, but do not necessary highlightfeatures normally associated with the stress response. When interpreting stress induced physiological
- 15 -
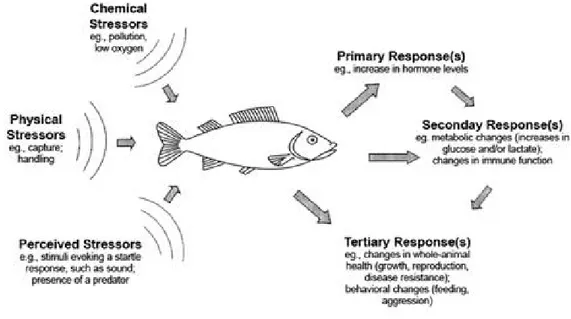
changes in fish, is important to realize that many environmental “nonstress” factors may modify the magnitude of these responses. These influences involve, for example, external factors such as acclimation temperature, salinity or water quality, and internal factors such as nutritional state or presence of an infection. The secondary effect of elevated corticosteroids is the homeostatic balance of metabolism may be perceived through monitoring a range of blood chemistry and hematological factors like energy metabolites, particularly glucose, lactic acid and protein increase dramatically in circulation response to most types of stressors and are now use usually as indicators of stress fish (Barton & Iwama, 1991). The tertiary responses derived from the rise of hematological factors correspond to a lowering of growth, swimming capacity, disease resistance and modified behavioral patterns (Fig.6) (Barton, 2002).
Figure 6.Physical, chemical and otherperceivedstressors act on fish to evokephysiological and relatedeffects, which are groupedasprimary, secondary and tertiary or whole-animalresponses. In some instances, the primary and secondaryresponses in turn maydirectlyaffectsecondary and tertiaryresponses, respectively, asindicated by the arrows (Barton, 2002).
1.6 Welfare in aquaculture
The welfare of farmed fish has become a more and more important issue for the general society and for governments and regulators. In response to such affairs, the aquaculture industry is doing what is necessary to ensure good welfare in
- 16 -
farmed fish, most particularly by establishing up codes of practice for responsible aquaculture that take fish welfare into account. An example is procured by the Federation of European Aquaculture Producers(FEAP), which includes respect the consideration for welfare that applied to the species being raisedas one of their guiding lights for responsible aquaculture (Huntingford, 2008) to combat the stress in aquaculture and then keep the animals welfare must be followed some simple management practice. First, operation should guarantee that the stock of fish used in culture programs are in the best health possible, that is, disease-free and right condition. An adequate period of time should be consented between individual disturbances and displacements to allow fish to recover to avoid the cumulative effect of stress. Also, when fish are moved, the features of the receiving water should be equal as closely as possible to the source water. Regarding to the transport phases, they should be done in multiple operation to minimize the stress and fish are taken of feed for about 24h prior to harvest and transport, so that they do not produce feces and foul of transport water (Conte, 2004). Because the degree of the stress response is congruent to both the strictness and length of the stressor, the duration of the recovery period should be selected consequently (Barton & Iwama, 1991). Animal density is one of the primary concerns in animal welfare. If aquatic animal density is regulated, it is important to guarantee that the most efficient and appropriate means of quantifying density and integrating environmental factor is chosen. Although space is important, the availability of the high quality water and flow rates needed to provide oxygen and dilute metabolic waste. As mentioned above to avoid competition phenomena, is significant that the fish in the tanks have the same size(Conte, 2004). Furthermore, certain environmental condition, like temperature, should be kept within the preferred optimum for the species and extremes in those condition averted. Fish farmers should know that some fishes may be more sensitive to stress and some phases in their lifecycle, for example, anadromous salmonids during smoltification, and avoid subjecting the fish undue stressors during these periods. Also, the use of anesthetics to produce mild sedation and salt additives in fresh water to reduce the osmotic gradient may prove useful in reducing the effect of stress in fish during transport. It is important thatfarmersconsider the species life history and natural habitat conditions when designing rearing
- 17 -
facilities. In stocking programs, consideration should be given to transporting and stocking fish at night to avert temperature extremes, sudden light stock at the time of release and increase vulnerability to predation. Finally, it would be worthwhile to routinely establish physiological and condition profiles of their captive population so if a stressful event occur that result in mortality, it can be properly assessed (Barton &Iwama, 1991). For this is significant monitoring continuously both the aquatic animal’s environment and animal physical condition through the use of method ranging from hand-held metering and water test kits to sophisticated computer monitoring system with jointly interested alarms (Conte, 2004).
1.7 Welfare innovation in aquaculture
To improve the welfare in aquaculture many innovative techniques were developed. Some shrewdness’ were evolved understanding fish behavior. Like several animals, fish modify their aggressive responses to the cost of fighting and relatively simple manipulation that increased the amount of fighting among farmed fish, similarly making fish swim against current or introducing older companions can reduce the aggression and promote even the growth. The practice in which food is delivered also has a strong effect on the social environment experience by farmed fish. Employing interactive feeders that deliver food whenever fish are hungry rather than a default predictable times of day originates farm environment in which there is much less competition for food and fish that are poor competitors are able to feed and thrive (Huntingford, 2008).
Feed Additives
The direction and control of fish health and production by natural substance has been classifiedasa valuable area for future improvements in aquaculture. Major objectives in aquaculture industry are to maintain fish health as well to improve fish performance. This has started the evaluation of 100 novel substances which may serve as practical dietary supplement in commercial fish feeds. Such products involve immunostimulant, probiotics and phytogenics. Many of these
- 18 -
products were developed for poultry, swine and cattle production, while their potential in fish diets still has to be established. Moreover, in the light of the prohibition of sub-therapeutic antibiotics as growth-promoters in European Union in 2006 (Regulation 1831/2003/EC), alternative to traditional antibiotics in aquaculture practices have consequently received much attention.These directions also relate well with the growing sensitivity of consumers, who more
and more demand eco-friendly farming practices and chemically
uncontaminated food products.
A first example of alternative substances used as additives in aquaculture areprobiotics.Probiotics are live microorganism which, when dispensed in adequate quantity, donate a health benefit on the host. The adoption of probiotics enhanced appetite and/or growth performance of the farmed species (Irianto& Austin, 2002).Bahiet al. in 2017 have shown that the administration of fenugreek combined withBacillus subtilis enhanced the immune response of gilthead seabream. Even the phytogenic substances play an important role in aquaculture as growth promoter, antioxidant and disease controller(Giannenas et al., 2012).
Microalgae are necessary for larvae nutrition during a short period, either for direct consumption, in the case of mollusks and peneid shrimp, or indirectly as food for the live prey fed to small larvae fish. Marine aquaculture of filtering mollusks, crustaceans (especially peneid shrimps), and small larvae fish (like seabreams, turbot, and other flat fish) generally need microalgae, directly or indirectly, in any casefor larval feeding. For many fresh and seawater animal species, the introduction of phytoplankton leads to much better results in term of survival, growth, and transformation index compared with clear water. For seabream, has become an economic requirement. The reason behind the positive roles of microalgae in larval rearing ponds of fish, as well as shrimps, has not been completely elucidated. There is a wide consent that water quality is enhanced and regulate by algal oxygen production, pH stabilization, etc., If, however, the algal tanks are deep and light intensity low, algae will not increase dissolved oxygen (DO) and, during the night, algae which have not been consumed will effect, reduce DO. The action of some eliminated biochemical
- 19 -
compounds is usually considered, along with the induction of behavioral processes like initial prey catching. Other positive functions such as regulating the bacterial populations, probiotic effects and stimulating immunity have likewise been suggested, but they are not sufficient understood. So far, only their action as a raw material has been considered, giving rise to what are called green water and pseudo-greenwaters effects (Muller-Feuga, 2004).
Spiruline as Feed Additive
Among all the algae applied in commercial aquaculture, the cyanobacteria spiruline (Arthrospira sp.) believably has the broadest range of applications. The data for spiruline confirm that this alga with its thin and fragile cell wall, does not present any problems in protein utilization and even simple sun drying is sufficient to obtain acceptable values(Becker, 2004). Spiruline, as mentioned above, can be used as a partial supplementation or complete replacement for protein in aquafeeds. It was found that the growth of silver seabream (Rhabdosargus sarba) fed on spiruline meal at up to 50% was normally not different from, and feed conversion efficiency not superior to those given control diets with solely fishmeal. In the shrimp farming industry many feed additives have been utilized, but spiruline is the only microalgae additive that demonstrate benefit to growers that offset the initial cost and provide a significant cost/performance and also is a cheaper feed ingredient than others of animal origin. China, one of the most important producers of this alga, is using it as a partial substitute of imported feed to promote the growth, immunity and viability of prawns. Furthermore, as already described, this microalga can be used as a colorant (Spirulina platensis strain pacifica contains the highest levels of β-carotene and zeaxanthin of any natural sources, both of which are converted to astaxanthin through oxidative process, the red pigment desired by consumers) and as an antioxidant (very useful in case of poisoning) (Ahsan et al.,2008).
- 20 - 2 Research Scope
In gilthead seabream aquaculture, the feed supplieshavea very high cost on the market because of its elevated content of animal protein. This is why many research projects have focused on replacing the feed supply with vegetables derived proteins, which turn out to be less costly. Microalgae seem to be a good alternative to animal and vegetable protein in general and increase growth and performance. Furthermore, they can work well as antioxidant.
Work has been done on two experimental tests:
- The objective of the first experiment was to determine the effect of the inclusion of Spirulina platensis hydrolyzed on the physiological state and growth in juvenile fish of S. aurata.
- As our final goal, once the administration of the spiruline is executed for nearly four month, we try to evaluate the anti-oxidant responseof animals in a toxicological assay with sodium nitrite.
- 21 - 3 Materials and Methods
3.1 Inclusion of the microalgaeSpirulina platensis in the diet of seabream (Sparus aurata)
Before the experiment, fish were acclimated for one week to the rearing conditions: salinity of 40‰, temperature of 20⁰C and natural photoperiod for the
Cadiz Bay (spring 2016,.36ο 32’ 00’’ N). The system was kept in an open circuit
system taking well water adjacent to the Rio San Pedro, from the aquaculture facilities of the Andalusian Centerof Higher Marine Studies (CASEM) located in the Marine and Environmental Science Faculty of Cádiz University in Puerto Real Campus (Cádiz, Spain).
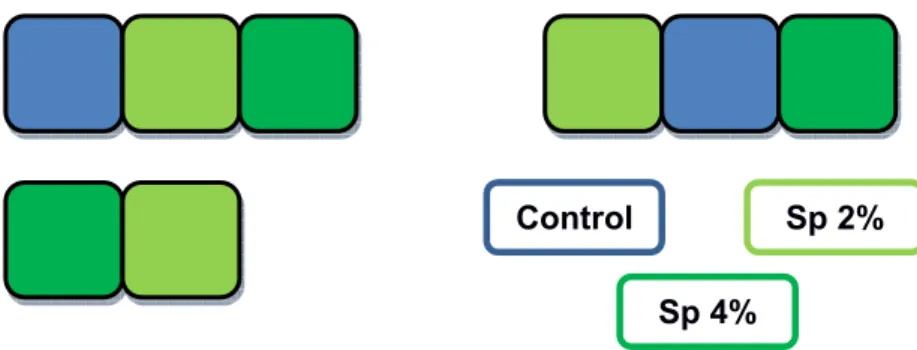
A total of 180 individuals (initial weight around 20 g) were fed for 128 days (until the weight was tripled) with three different feeds: i) control diet; ii) diet with 2% of hydrolyzed microalgae (Sp2); and iii) diet with 4% of hydrolyzed microalgae (Sp4).The experimental groups were tested in triplicate (except control group that was in duplicate) and the specimens were distributed randomly in 8 tanks with 20 individuals each. The initialstocking density was around 5.0 kg/m³ in 75 L tanks. Every two or three weeks weight and length were measured to adjust the amount of food, and to determine the growth rate, index feed conversion of the food and other parameters related to the growth. During the experiment, the animals were fed with a ratio of 2% of the weight distributed in 2 administrations per day.
Control Sp 2%
Sp 4%
- 22 -
Beginning Day 36 Day 65 Day 92
Biometric Day 128 Biometric Biometric Biometric Biometric Biometric Biometric Biometric Blood sampling n = 16 n = 16 n = 32 n = 32 n = 32 Control Spi 2% Spi 4%
At the end of the experiment (day 128), blood samples were collected to analyze plasma metabolites (glucose, lactate, triglycerides and total proteins).
3.2 Evaluation of the spiruline as anti-oxidant in a toxicological test
After four months of spiruline administration, a toxicological test was performed by exposing the individuals to a dose of 100 mg/L of NaNO2 for 3 days. Fish
remaining from the first experiment were divided in to control, Spi 2% and Spi
4%, all them with and withoutNaNO2 for a total of 6 tanks within 16 individuals
each. Blood samples (n=8) were collected at 24h and 72h to evaluate plasma metabolites changes (glucose, lactate, triglycerides and total proteins) due to nitrate exposure (Fig.9).
Without NaNO2 8→24h 8→72h 8→24h 8→72h 8→24h 8→72h 100 mg/L NaNO2 8→24h 8→72h 8→24h 8→72h 8→24h 8→72h Figure 8.Planning of sampling from the beginnigtill the last day (growthexperiment).
- 23 - G6F – DH
HK
3.3 Analysis of plasma metabolites
All the analysis techniques are based on colorimetric reactions which result in a compound from which we can determine its concentration with the reading of
absorbance in a spectrophotometer, in this case a PowerWaveTM 340
microplate reader of BIO-TEK. The readings collected from 96 wells microplates
wereprocessed with the software KC JuniorTM of BIO-TEK.
Glucose
The glucose concentration is determined with the commercial kit “Glucosa – HK” of SPINEREACT (ref. 1001200) adapted to a microplate of 96 wells. The glucose is phosphorylated by adenosine triphosphate (ATP) to glucose-6-posphate by the hexokinase (HK) and is itself, in the presence of nicotinamide adenine dinucliotide (NAD), oxidized to 6-phosphogluconate through the action of glucose-6-phophate dehydrogenase (G6PDH). During the oxidation an equimolar quantity of NAD is reduced to NADH. This compound has maximum absorbance at 340 nm and that means that the variation of absorbance observed at 340 nm is proportional to the initial concentration of glucose in the sample.
Glucose + ATP Glucose - 6 - Phosphate + ADP G6F + NAD+ 6 - phosphogluconate + NADH + H+
To determine the proportionality between the variation of absorbance at 340 nm and the initial concentration of glucose a standard straight line of glucose was
created starting from its own calibration kit solution (100 mg dL-1).
Concentration of 0, 50, 100, 150 and 200 mg dL-1were used making dilutions with distillate water in the case that the concentration was lower than the standard or increasing the quantity of molecules in the well for the concentration 150 and 200 mg dL-1. In this case the standard which describes it is a cubic
curve type that starts to saturate from 100 mg dL-1.The reactive solution that is
added to the samples is prepared by mixing the liquid content of R1 bottle
Figure 10.The Glucose reactions due to the commercial kit “Glucosa – HK” of SPINEREACT to obtain NADH.
- 24 -
POD LO
(buffer) with the enzymes of R2 in a beaker. This mixture is sealed with parafilm (Parafilm “M”, Laboratory film American CanTM) and it is heated to 37°C in darkness, inside the stove. In the microplate 10 µL of sample were deposited in each well for duplicate and other 10 µL of standard for quadruplicate.
For the concentrations of 150 and 200 mg dL-1, 15 and 20µL were added
respectively to increase the amount of molecules for well in a way that is proportional to absorbance. Finally, 200µL of reactive solution are added to every well then the microplate is sealed with parafilm and is incubated at 37 °C inside the stove for 5 min. After the incubation time the absorbance is measured immediately in the microplate reader using two different wavelengths for each well, 340 nm for the reading and 550 nm as a reference.
Lactate
The lactate in the plasma has been determined with the commercial kit “Lactate” of SPINREACT (ref.1001330) adapted to the 96 wells microplate. This kit is based on the action of lactate dehydrogenase (LDH), this enzyme oxidizes lactic acid to pyruvate and releases hydrogen peroxide (H2O2). In presence of
this peroxide, the enzyme peroxydase catalyzes the oxidative condensation of the cromogenic precursors in the reactive solution, producing a cromogenic compound that has a maximum of absorbance at 490 nm. At this wavelength the variation of absorbance is directly proportional to the concentration of lactate in the sample.
L-lactate + O2 + H2O Pyruvate + H2O2
2H2O2 + 4-AF + 4-Chlorophenol Quinone + H2O
The relationship between the variation of absorbance and the concentration of lactate is linear until 10 mg dL-1. To determine the proportionality of this line a
Figure 11.The Lactatereactions due to the commercial kit “Lactate of SPINREACT to obtain
- 25 -
standard was created starting with the calibration solution of the kit (10 mg dL-1) and two lower concentrations diluting the calibration solution (0 and 5 mg dL-1). The reactive solution of the essay is prepared with 10 ml of isotonic serum (0.6 % of NaCl) and 10 mL of bottle R1 (buffer), all of this is mixed in a beaker with the enzyme R2. This reactive solution is sealed with parafilm and it is heated at 37 °C in darkness inside the stove.
Using a micropipette, 10 µL of sample diluted 1:6 with distillate water were deposited in each well for duplicate for the plasma and an additional 10 µL for quadruplicate for the standard of the model line. For each well, 200 µL of reactive solution were added, then the microplate is sealed with parafilm and incubated for 5 min at 37°C in darkness, inside the stove. After the incubation time the absorbance is immediately measured in the microplate reader using two wavelengths for each well, 490 nm for the reading and 550 nm as a reference.
Triglycerides
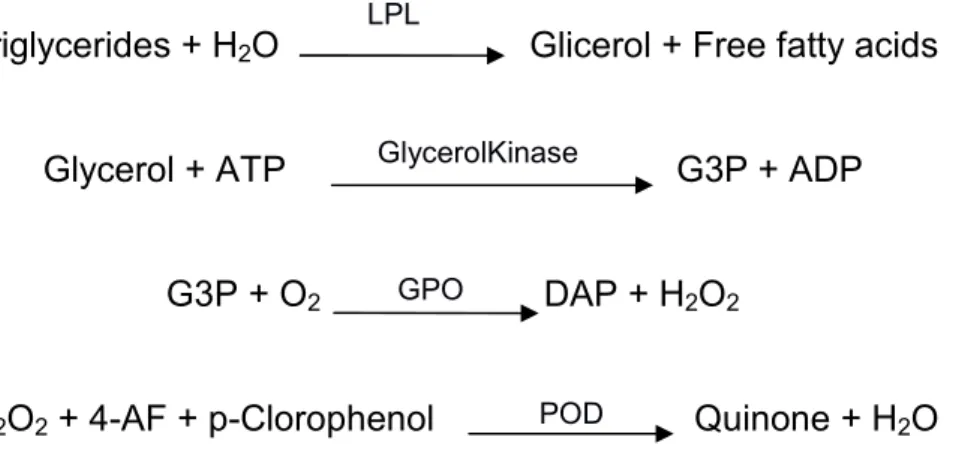
The plasma quantity in the triglycerides has been determined with the commercial kit of SPINREACT “Triglycerides” (ref. 1001311) adapted to 96 inches microplate. The enzyme lipasehydrolyze the triglycerides in glycerol and fatty acids, where the synthesized glycerol is phosphorylates in glycerol-3-fosfate with ADP by glycerol kinase. The glycerol-3-glycerol-3-fosfate (G3P) is converted in dihydroxyacetone phosphate (DAP) and hydrogen peroxide thanks to
glycerol-3-fosfate oxidase (GPO). Finally The H2O2 reaction to
4-aminophenazone and P-chlorophenol with the peroxidase (POD) to give quinones of red coloration with a maximum of absorbance at 490 nm. At this wavelength the variation of absorbance is directly proportional to the concentration of triglycerides (TAG) of the sampling.
- 26 -
GlycerolKinase
GPO
POD LPL
Triglycerides + H2O Glicerol + Free fatty acids
Glycerol + ATP G3P + ADP
G3P + O2 DAP + H2O2
H2O2 + 4-AF + p-Clorophenol Quinone + H2O
The relation between the variation of absorbance and the TAG concentration is linear till 200 mg dL-1. To determine the proportionality of this line it has been realized a standard starting from the calibration solution of the kit (200 mg dL-1)
and 4 lower concentration diluting the calibration solution (0, 25, 50, 100 mg dL
-1
). The reactive solution of assay is prepared with the liquid content of R1 bottle (20 mL) mixed in a beaker with enzymes of bottle R2. This reactive solution is sealed with parafilm and it is heated at 37°C in darkness inside the stove.
With a micropipette were deposited 10µL of sample diluted 1:6 with distillate water were deposited in each well for duplicate for the plasma and an additional 10 µL for quadruplicate for the standard of the model line. For each well 200 µL of reactive solution were added, then the microplate is sealed with parafilm and incubated for 5 min at 37°C in darkness, inside the stove. After the incubation time the absorbance is immediately measured in the microplate reader using two wavelengths for each well, 490 nm for the reading and 550 nm as a reference.
Total protein
The concentration analysis of total protein in plasma it has been made with the
commercial kit “PIERCE® BCA Protein assay kit of THERMO (ref.23225)
adapted to a 96 inches microplate. The protocol is based in the reduction of Cu2+ and a Cu1+ mediated by protein in an alkaline medium. The resulting cuprous ions form a chelated compound with two molecules of bicinchoninic
Figure 12.The Triglyceridesreactions due to the commercial kit “Triglycerides” of SPINREACT
- 27 -
acid, that give violet color with a maximum of absorbance at 562 nm. The absorbance of this wavelength will be directly proportional to the protein quantity.
The relation between the variation absorbance and the concentration of protein is linear until 2 mg mL-1. To determine the proportionality of this line it has been realized a standard starting from the calibration solution of the corresponding kit to the albumin (2 mg mL-1) and 3 lower concentration diluting the calibration solution (0, 0.5and 1mg mL-1). The reactive solution of the assay is prepared with 20 mL of the reactive A mixed in a precipitation cup with 400 µL of reactive B. This reactive solution is sealed with a parafilm and it is heated at 37°C in darkness inside the stove.
With a micropipette were deposited 10µL of sample diluted 1:50 with distillate water were deposited in each well for duplicate for the plasma and an additional 10 µL for quadruplicate for the standard of the model line. For each well 200 µL of reactive solution were added, then the microplate is sealed with parafilm and incubated for 5 min at 37°C in darkness, inside the stove. After the incubation time the absorbance is immediately measured in the microplate reader using two wavelengths for each well, 550 nm for the reading and 630 nm as a reference.
3.4 Statistical techniques
The data analysis was carried out with the statistical software GraphPad Prism 6 for the parameters determined.Among these were identified outliers. As regard to weight data of the first experiment, all the treatments groups were subjected to a normality test. Then a one way ANOVA test with 95% confidence interval and a Tukey post hoc test (p-value=0.05). Subsequently, for the second experiment, the means of data divided by with nitrites and without nitrites, 24 h and 72 h with relative standard deviation were obtained. At this point were realized two way ANOVA tests (p-value=0.05)on with nitrites and without data with source of variation interaction, time and treatment. Then two way ANOVA tests (p-value= 0.05)were achieved on 24h and 72h data with source of variation interaction, treatment, nitrites. Finally, the related graphics were created.
4 Results
4.1 Inclusion of the microalgae seabream(Sparus
Biometric parameters
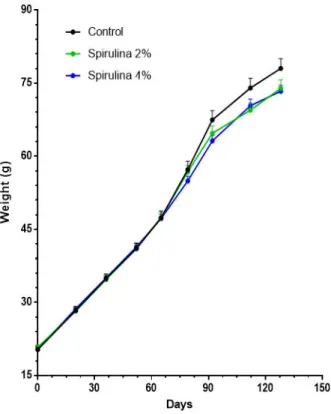
After 128 days we have found a decrease in the mean weig
with spiruline (Fig.13). Both treatments have a negative effect on the weight gain, but length and condition factor were not significantly affected by t
administration (Tab.1)”.
Figure 13. Mean weight (g) of animals after 128 days fed with the different treatments (control, spirulina 2% and spirulina 4%). Data are represented as mean ± SEM (control:
n = 60) for each sample point.
- 28 -
he microalgae Spirulina platensis in the diet of
aurata)
After 128 days we have found a decrease in the mean weight of animals fed ). Both treatments have a negative effect on the weight length and condition factor were not significantly affected by t
Mean weight (g) of animals after 128 days fed with the different treatments (control, spirulina 2% and spirulina 4%). Data are represented as mean ± SEM (control:
= 60) for each sample point.
in the diet of
ht of animals fed ). Both treatments have a negative effect on the weight length and condition factor were not significantly affected by the algae
Mean weight (g) of animals after 128 days fed with the different treatments (control, spirulina 2% and spirulina 4%). Data are represented as mean ± SEM (control: n = 40; spirulina:
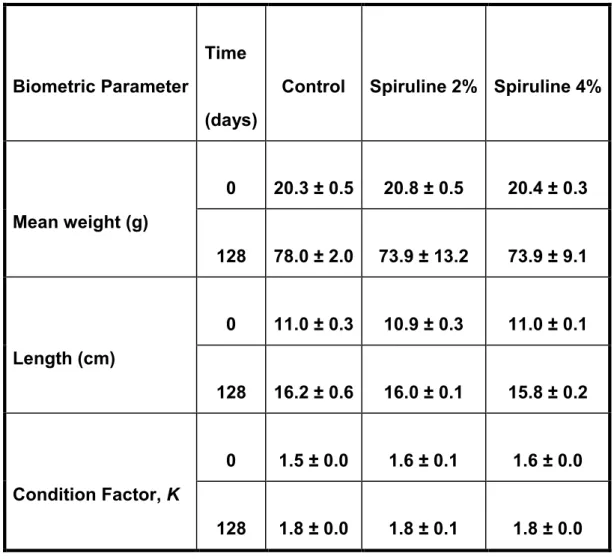
- 29 - Biometric Parameter
Time
(days)
Control Spiruline 2% Spiruline 4%
Mean weight (g) 0 20.3 ± 0.5 20.8 ± 0.5 20.4 ± 0.3 128 78.0 ± 2.0 73.9 ± 13.2 73.9 ± 9.1 Length (cm) 0 11.0 ± 0.3 10.9 ± 0.3 11.0 ± 0.1 128 16.2 ± 0.6 16.0 ± 0.1 15.8 ± 0.2 Condition Factor, K 0 1.5 ± 0.0 1.6 ± 0.1 1.6 ± 0.0 128 1.8 ± 0.0 1.8 ± 0.1 1.8 ± 0.0
Table 1.Mean weight (g), length (cm) and condition factor (K, non-dimensional) of animals after 128 days fed with the different treatments (control, spirulina 2% and spirulina 4%). Data are represented as mean ± SEM (control: n = 40; spirulina: n = 60) for each sample point.Different letters indicate statistical differences between groups at each sampling point (p< 0.05).
Plasma metabolites
At the end of the experiment we did no registe any variance in plama glucose values due to the administration of spiruline (Fig.14). Regarding the lactate content, the differenc ebetween the administration of spiruline and control feed that were reported is signifficantly higher (Fig.15). Despite the difference between the three treatments did not reach statistical significance in tryglicerides, we found an higher content of them in the group with the
- 30 -
administration of spiruline 2% (Fig.16). Lastly, the amount of total protein content is equal and does not differ between the three feeds (Fig.17).
.
Figure 14.Plasma glucose (mg dL-1) of animals after 128 days fed with the different treatments (control, spirulina 2% and spirulina 4%). Data are represented as mean ± SEM (control: n= 8; spirulina: n= 12).Different letters indicate statistical differences between groups at each sampling point (p< 0.05).
Figure 15.Plasma lactate (mg dL-1) of animals after 128 days fed with the different treatments (control, spirulina 2% and spirulina 4%). Data are represented as mean ± SEM (control: n= 8; spirulina: n= 12). Different letters indicate statistical differences between groups at each sampling point (p< 0.05). G lu c o s e ( m g d L -1 )
Control Spi 2% Spi 4%
0 20 40 60 80 100 L a c ta te ( m g d L -1 )
Control Spi 2% Spi 4%
0 5 10 15
A
A
B
- 31 -
Figure 16.Plasma triglycerides (mg dL-1) of animals after 128 days fed with the different treatments (control, spirulina 2% and spirulina 4%). Data are represented as mean ± SEM (control: n= 8; spirulina: n= 12). Different letters indicate statistical differences between groups at each sampling point (p> 0.05).
Figure 17.Plasma proteins (mg mL-1) of animals after 128 days fed with the different treatments (control, spirulina 2% and spirulina 4%). Data are represented as mean ± SEM (control: n= 8; spirulina: n= 12). Different letters indicate statistical differences between groups at each sampling point (p> 0.05). T A G ( m g d L -1 )
Control Spi 2% Spi 4%
0 100 200 300 P ro te in s ( m g m L -1 )
Control Spi 2% Spi 4%
0 10 20 30 40
- 32 -
4.2 Evaluation of the spiruline as anti-oxidant in a toxicological test Plasma metabolites
In the first 24h we have determined an elevated content of glucose in all the treatments with the presence of NaNO2, but it did not resulted significant
(Fig.18). There have been indicative changes at the end of 72h, where the difference between the three treatments without the nitrites exposure resulted significant. The control had an higher values of glucose respect the two treatments and also it differed between the exposure to nitrites and without their presence. The administration of the control feed showed a lower value of the metabolite with the exposure to nitrites respect the two treatments but this resulted no significant (Fig. 19). Regarding to plasma lactate in the first 24h, where the interaction between treatment and nitrites was significant, the control and the spiruline 2% supply showed a higher value with the exposure to nitrites. The treatment with spiruline 4%, instead, had a lower mean with the presence of NaNO2 (Fig. 20). After 72h (treatment and nitrites significant) we found a
higher content of lactate in all the treatments with the exposure of NaNO2, but
they differ between them. Spiruline 2% feed showed the higher value of glucose in this situation. Spiruline 4% feed exhibited a lower value respect spiruline 2%, but is still more elevated than the control (Fig. 23). The triglycerides content is significantly different between spiruline 2% with and without nitrites. The more elevated content of them belongs to the treatment without nitrites. Finally, plasma total proteins (where the only source of variance significant was the time) did not showed particular changes with and without the exposure to NaNO2 in both time intervals (Fig.24, Fig.25).
- 33 -
Figure 18.Plasma glucose (mg dL-1) of animals after 24 hours fed with the different treatments (control, spirulina 2% and spirulina 4%) without and with the exposure to NaNO2. Data are
represented as mean ± SEM (n= 8 for each treatment).Different letters indicate statistical differences between treatments at each sampling point (p< 0.05). Asterisks represent differences between with/without NaNO2 exposure for the same treatment (p< 0.05).
Figure 19.Plasma glucose (mg dL-1) of animals after 72 hours fed with the different treatments (control, spirulina 2% and spirulina 4%) without and with the exposure to NaNO2. Data are
represented as mean ± SEM (n= 8 for each treatment). Different letters indicate statistical differences between treatments at each sampling point (p< 0.05). Asterisks represent differences between with/without NaNO2 exposure for the same treatment (p< 0.05).
24 hours
G lu co se ( m g d L -1 ) 0 20 40 60 80 100Control Spirulina 2% Spirulina 4%
Without nitrites With nitrites
72 hours
G lu co se ( m g d L -1 ) 0 20 40 60 80 100Control Spirulina 2% Spirulina 4%
Without nitrites With nitrites
A*
B
- 34 -
Figure 20.Plasma lactate (mg dL-1) of animals after 24 hours fed with the different treatments (control, spirulina 2% and spirulina 4%) without and with the exposure to NaNO2. Data are
represented as mean ± SEM (n= 8 for each treatment). Different letters indicate statistical differences between treatments at each sampling point (p< 0.05). Asterisks represent differences between with/without NaNO2 exposure for the same treatment (p< 0.05).
Figure 21.Plasma lactate (mg dL-1) of animals after 72 hours fed with the different treatments (control, spirulina 2% and spirulina 4%) without and with the exposure to NaNO2. Data are
represented as mean ± SEM (n= 8 for each treatment). Different letters indicate statistical differences between treatments at each sampling point (p< 0.05). Asterisks represent differences between with/without NaNO2 exposure for the same treatment (p< 0.05).
24 hours
La ct a te ( m g d L -1 ) 0 5 10 15 20 25Control Spirulina 2% Spirulina 4%
Without nitrites With nitrites
a*
a
b
72 hours
La ct a te ( m g d L -1 ) 0 10 20 30 40 50Control Spirulina 2% Spirulina 4%
Without nitrites With nitrites