School of Industrial and Information Engineering
Master of Science in Management Engineering
Business Performance Analytics applications
and benefits: a theoretical framework and some
exploratory case studies
Supervisor: Paolo Maccarrone
Academic Year 2017/2018
Master Thesis of:
I would like first to express my appreciation to Professor Paolo Maccarrone for his support and useful critiques in key moments of the research.
I would also like to thank all the professionals that made this research possible by dedicating their time for the interviews.
Finally, I recognize that this research, and all my path at Politecnico di Milano, would have never been possible without the love of my family and Alice, or without the friendship and support of my friends in Vimercate, Politecnico di Milano and Tsinghua University.
Thank you all.
I
ABSTRACT
The study investigates Business Analytics and Big Data applications in the domain of Finance function and controller activities, addressing the topic as Business Performance Analytics (BPA) accordingly to the nomenclature provided by Silvi & Visani (2016).
BPA is recognized to have an high potential impact on companies’ performances and as source of sustainable competitive advantage. Nevertheless, few researches address directly the topic, often focusing on specific techniques and application areas. This Master Thesis effort aims therefore at contributing to bridge this gap, understanding from a managerial perspective how companies in the market implement Business Performance Analytics systems, analyzing its key components; which improvements it brings to controller activities; overall company benefits pursued. Finally, the Master Thesis contributes to solve a controversy about CFO role evolution as a consequence to BPA: will it become CEO’s strategic advisor and evolve as analytics leader, or reduce its strategic relevance?
To achieve these goals, a qualitative rather than quantitative approach has been selected, primarily because of the lack of adequate support from existing literature. Firstly, it is developed a theoretical framework; secondly, the theoretical framework is endorsed by interviewing practitioners and field experts; thirdly, it is further supported from eight exploratory case studies, proving it can adequately describe company applications.
II
ABSTRACT [ITALIAN]
Lo studio indaga le applicazioni di Business Analytics e Big Data nell’ambito della funzione di Finanza e nelle attività dei controller, affrontando l'argomento come Business Performance Analytics (BPA) in base alla nomenclatura fornita da Silvi & Visani (2016). Si ritiene che BPA abbia potenzialmente un elevato impatto sulle prestazioni aziendali, e che possa agire da fonte di vantaggio competitivo sostenibile nel lungo periodo. Tuttavia, poche ricerche affrontano direttamente l'argomento, spesso concentrandosi su specifiche tecniche o aree di applicazione. Questa tesi mira quindi a contribuire a colmare questa lacuna, comprendendo dal punto di vista manageriale come le aziende nel mercato implementino i sistemi di analisi delle performance aziendali, analizzando le sue componenti chiave; quali miglioramenti apportino alle attività dei controller e in che modo esse vengano influenzate; i benefici globali perseguiti. Infine, la tesi contribuisce a risolvere una controversia sull'evoluzione del ruolo del CFO come conseguenza sei sistemi di BPA: diventerà “Strategic advisor” del CEO e si evolverà come “analytics leader”, o vedrà ridursi la sua rilevanza strategica?
Per raggiungere questi obiettivi, è stato selezionato un approccio qualitativo, principalmente a causa della mancanza di un adeguato sostegno dalla letteratura esistente. In primo luogo, è sviluppato un framework teorico; in secondo luogo, esso è validato intervistando professionisti ed esperti sul campo; in terzo luogo, è ulteriormente supportato da otto casi studio esplorativi, dimostrando che può descrivere adeguatamente le applicazioni del settore e rispondere alle domande di ricerca.
III
TABLE OF CONTENTS
1. EXECUTIVE SUMMARY ... 1 Literature review... 1 Objectives ... 3 Methodology ... 4 BPA framework ... 5 Results ... 6 2. INTRODUCTION ... 11Structure of the thesis ... 13
3. LITERATURE REVIEW ... 15
Methodology ... 15
Introduction on Business Performance Analytics (BPA) ... 16
First component: Performance Measurement and Management Systems (PMMS) ... 17
Second component: Information Technology (IT) infrastructure ... 19
Third component: Big Data ... 21
Research trends ... 21
Introduction ... 25
Definition ... 27
Characteristics ... 29
Fourth component: Business Analytics ... 32
Descriptive analytics... 33
Predictive analytics ... 34
Prescriptive analytics ... 35
Analytical Performance Management (APM) and Business Performance Analytics (BPA) ... 37
BPA implementation ... 38
BPA Benefits and Challenges ... 41
Benefits ... 41
Challenges ... 43
Summary ... 44
IV
Research Questions ... 46
Methodology ... 47
BPA Framework ... 49
Exploratory case studies ... 49
5. BUSINESS PERFORMANCE ANALYTICS FRAMEWORK ... 52
Introduction ... 52
Business Performance Analytics (BPA) ... 53
Performance Measurement and Management Systems (PMMS) ... 53
Business Analytics ... 54
Big Data ... 54
IT Infrastructure ... 54
Improvement Areas ... 55
Robot Process Automation (RPA) ... 55
Increased data granularity and accuracy ... 56
Clearer cause-effect relationship between variables ... 56
New information available ... 57
Forecast Accuracy ... 57 Earlier Reactions... 58 Controller Activities ... 59 Plan ... 60 Administration ... 60 Report ... 62 Analyze ... 62 Advise ... 62 Company Benefits ... 63 Result ... 64 6. CASE STUDIES ... 65 Introduction ... 65 Tools S.p.A. ... 66 Company overview ... 66
Tools S.p.A. Business Performance Analytics ... 66
V
Company overview ... 70
Fintech S.p.A. Business Performance Analytics ... 71
Glue S.p.A. ... 73
Company overview ... 73
Glue S.p.A. Business Performance Analytics ... 74
Liquid S.p.A. ... 77
Company overview ... 77
Liquid S.p.A. Business Performance Analytics ... 77
Energy S.p.A. ... 80
Company overview ... 80
Energy S.p.A. Business Performance Analytics... 81
Nice House S.p.A. ... 86
Company overview ... 86
Nice House S.p.A. Business Performance Analytics ... 86
Water S.p.A. ... 91
Company overview ... 91
Water S.p.A. Business Performance Analytics ... 92
Pharma S.p.A. ... 96
Company overview ... 96
Pharma S.p.A. Business Performance Analytics ... 96
7. RESULTS AND DISCUSSION ... 100
Business Performance Analytics (BPA) ... 100
Performance Measurement and Management System... 101
Business Analytics ... 101
Big Data ... 102
IT infrastructure ... 103
Improvement Areas ... 104
Robot Process Automation (RPA) ... 104
Increased data granularity and accuracy ... 105
Clearer cause-effect relationship among variables ... 105
New information available ... 106
VI
Earlier reactions ... 107
Controller Activities ... 107
Finance function role evolution ... 109
Company Benefits ... 111
8. CONCLUSIONS ... 113
Limitations and further research ... 116
VII
INDEX OF FIGURES
Figure 1-1, BPA key components, adapted from Tavola 7 in Silvi & Visani, 2016 ... 1
Figure 1-2, BPA framework primary blocks ... 4
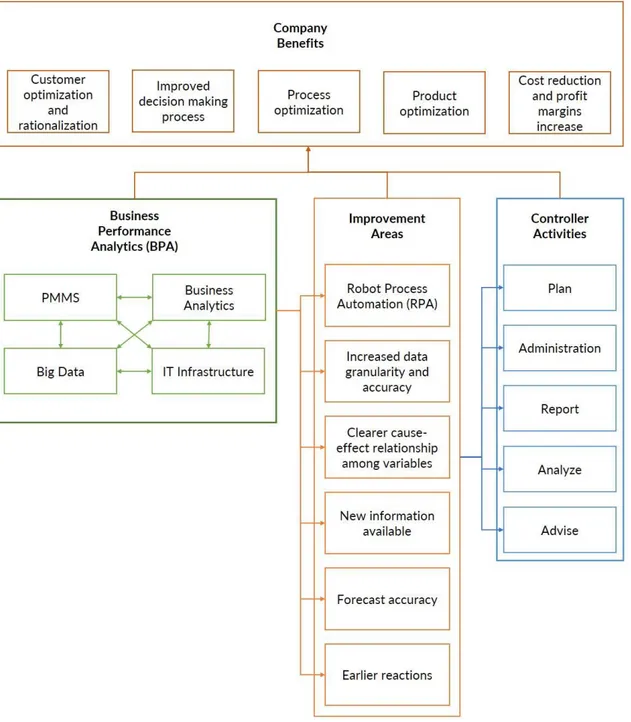
Figure 1-3, BPA framework ... 6
Figure 3-1, BPA key components, adapted from Tavola 7 in Silvi & Visani, 2016 ... 16
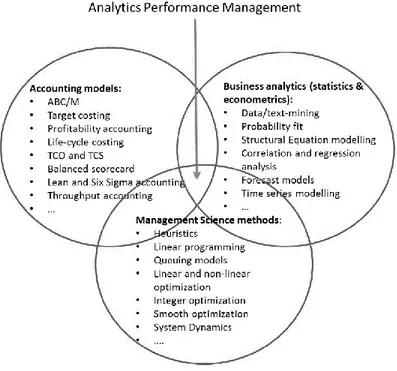
Figure 3-2, APM as the intersection of multiple disciplines (Nielsen, 2017) ... 38
Figure 4-1, BPA framework primary blocks ... 49
Figure 5-1, BPA block ... 53
Figure 5-2, Improvement Areas block ... 55
Figure 5-3, Analytics Probabilistic Planning Scenarios, from Cokins, 2013b ... 58
Figure 5-4, Controller Activities block... 59
Figure 5-5, Company Benefits block ... 63
Figure 5-6, BPA framework ... 64
Figure 6-1, Tools S.p.A. Business Performance Analytics framework ... 69
Figure 6-2, Fintech S.p.A. Business Performance Analytics framework ... 73
Figure 6-3, Glue S.p.A. Business Performance Analytics framework ... 76
Figure 6-4, Liquid S.p.A. Business Performance Analytics framework ... 80
Figure 6-5, Energy S.p.A. Business Performance Analytics framework ... 85
Figure 6-6, Nice House S.p.A. Business Performance Analytics framework ... 91
Figure 6-7, Water S.p.A. Business Performance Analytics framework ... 95
VIII
INDEX OF TABLES
Table 1-1, Core papers classification highlighting a gap in literature ... 3
Table 1-2, Improvement Areas block results summary ... 8
Table 1-3, Company Benefits block results summary ... 10
Table 3-1, Big Data classification in terms of Source and Format... 29
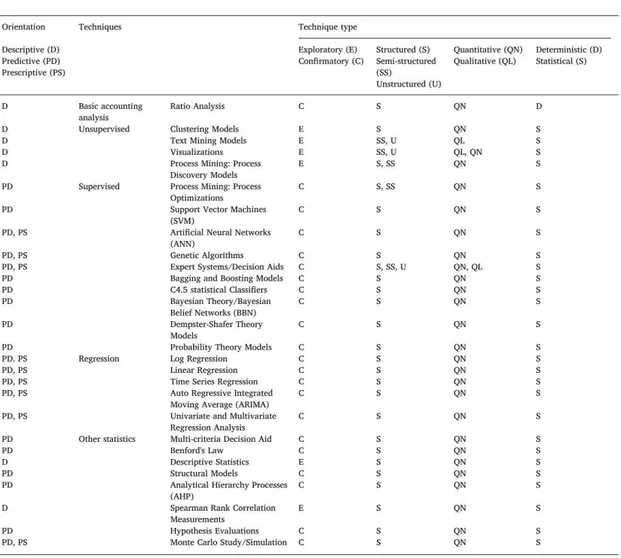
Table 3-2, Comprehensive classification of Business Analytics methods (Appelbaum, 2017) ... 36
Table 3-3, Core papers classification highlighting a gap in literature ... 39
Table 6-1, Tools S.p.A. industry and dimension ... 66
Table 6-2, Fintech S.p.A. industry and dimension ... 70
Table 6-3, Glue S.p.A. industry and dimension ... 73
Table 6-4, Liquid S.p.A. industry and dimension ... 77
Table 6-5, Energy S.p.A. industry and dimension ... 80
Table 6-6, Nice House S.p.A. industry and dimension ... 86
Table 6-7, Water S.p.A. industry and dimension ... 91
Table 6-8, Pharma S.p.A. industry and dimension ... 96
Table 7-1, Improvement Areas primary block results summary ... 104
IX
INDEX OF GRAPHS
Graph 1-1, BPA diffusion and configuration depends on Company Size ... 7 Graph 1-2, Finance function role evolution... 9 Graph 3-1, "Big Data" keyword search trend in Scopus database ... 22 Graph 3-2, Subject areas of results from "Big Data" keyword search in Scopus database ... 22 Graph 3-3, Subject areas of results from "Big Data" keyword search in Scopus database, 2016-20 period ... 23 Graph 3-4, "Big Data" AND "Performance management" keywords search trend in Scopus database ... 24 Graph 3-5, Subject areas of results from "Big Data" AND "Performance management" keywords search in Scopus database ... 24 Graph 3-6, Subject areas of results from "Big Data" AND "Performance management" keywords search in Scopus database, 2016-18 period ... 25 Graph 7-1, Core papers classification highlighting a gap in literature ... 100 Graph 7-2, Finance function role evolution... 110
1
1. EXECUTIVE SUMMARY
Literature review
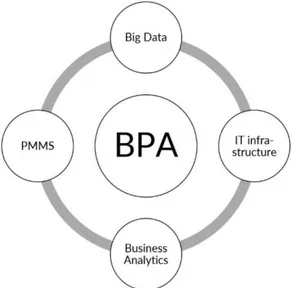
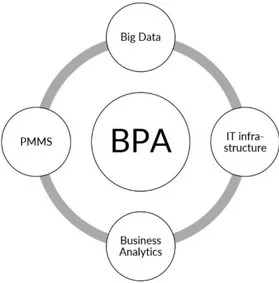
Big Data and Business Analytics are a complex and recent phenomenon that is deeply influencing how companies work, up to the point to be considered a “Management revolution” (McAfee & Brynjolfsson, 2012). Their impact in a firm is incredibly wide, and involves not only technology, but also competencies, organization and culture (Burton et al., 2014; T. H. . Davenport & Patil, 2012; T. H. Davenport & Bean, 2018). In particular, Big Data and Business Analytics are considered the missing link between complex Performance Measurement and Management Systems (PMMS) and their implementation (Schläfke et al., 2012) and in general a solution to the stagnant status of research in the accounting field (Merchant, 2012). The merging of these disciplines is called Business Performance Analytics (BPA). It consist of performance management models that, through 1) PMMS, 2) IT infrastructure, 3) Big Data and 4) Business Analytics improve business dynamics understanding, business strategies development and performance measurement and management (Silvi & Visani, 2016). Four key components can therefore be identified.
Figure 1-1, BPA key components, adapted from Tavola 7 in Silvi & Visani, 2016
A PMMS is a multi-dimensional set of metrics used to quantify both efficiency and effectiveness of actions, planning and manage the future of a business (Bourne et al., 2003; Neely et al., 1995), and it is enabled by IT infrastructure (Ferreira & Otley, 2009). IT infrastructure is rapidly evolving both in terms of enabling infrastructures (from data
2
warehouse to data lake) and software (from SQL to NoSQL and NewSQL systems) to support Big Data and Business Analytics (Osservatorio Big Data Analytics & Business Intelligence, 2017). For definition, in fact, Big Data cannot be managed from typical database software tools (Manyika et al., 2011) because of its characteristics of high Volume, Variety and Velocity (McAfee & Brynjolfsson, 2012). Business Analytics, such as machine learning and data mining (Appelbaum et al., 2017), are employed to analyze them, and are classified according to their orientation, that can be descriptive (analyzing historical data), predictive (analyzing data future evolution) and prescriptive (given a scenario, what is the best action to take?) (Holsapple et al., 2014). Four key components contribution to BPA system can be therefore synthetized as follows:
• PMMS, which sets BPA system goals;
• IT infrastructure, which enables BPA system; • Big Data, which act as BPA “fuel”;
• Business Analytics, which manipulate Big Data through IT infrastructure tools to achieve goals set by PMMS.
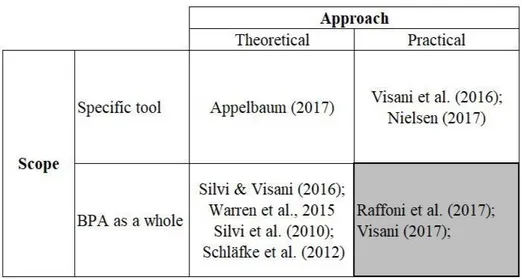
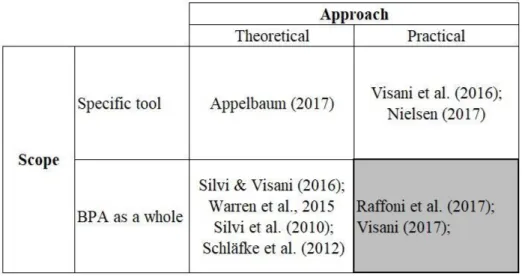
Despite the relevance recognized to BPA, research is still in its infancy, and does not meet expectations (Ask et al., 2016). In particular, as Raffoni et al. (2017) notices, studies focus on theoretical implementation frameworks, lacking empirical validation. Schläfke et al. (2012) and Silvi et al. (2010) are studies presenting this weakness. Recently, journals published researches bridging this gap in specific areas of Performance Measurement and Management, implementing, for examples, Business Analytics in tools such as the Balance Scorecard (BSC) adopting both a practical (Nielsen, 2017) and theoretical (Appelbaum et al., 2017) approach, or methodologies such as the Total Cost of Ownership (TCO) (Visani, 2016). It has been explained that BPA is a complex multidisciplinary system, impacting the whole company. Silvi & Visani (2016) analyzes its key components, while Raffoni et al. (2017) considers challenges that need to be faced in the implementation process building a framework later validated also from Visani (2017). Table 1-1 resumes this literature analysis, highlighting an existing gap in existing literature.
3
Table 1-1, Core papers classification highlighting a gap in literature
It summarizes consideration presented above, showing that exist two studies adopting a practical approach and analyzing the BPA system as a whole. However, Raffoni et al. (2017) and Visani (2017) do not consider impacts controllers’ daily activities, but macro-steps of BPA implementation.
Objectives
The thesis, therefore, aims at contributing to bridge this gap, providing a comprehensive picture of BPA, its applications and its influence on business dynamics from a practical point of view, providing in this way an overview about companies’ strategic decision-making concerning the configuration and adoption of these tools. The following research questions have therefore been formulated:
RQ 1
While BPA key components, showed in Figure 1-1, are well analyzed by Silvi & Visani (2016) from a theoretical point of view, their diffusion and configurations in the market are not clear. This research question aims therefore at clarifying this point.
<<What is the degree of diffusion of BPA systems among companies, in terms of key components (PMMS, IT infrastructure, Business Analytics, Big Data)?>>
RQ 2
Existing literature put relevant efforts to provide BPA system implementation best practices (Raffoni et al., 2017; Visani, 2017). However, it has not been investigated how,
4
in a fully or partially implemented system, each od the several improvements it generates influence business dynamics and particularly controllers’ activities.
<< How do BPA improvement areas impact controllers’ activities?>> RQ 3
Existing literature suggests what benefits can Big Data and Business Analytics bring to companies (McAfee & Brynjolfsson, 2012; Tien, 2013), but it does not focus on BPA. The third research question aims at evaluating these benefits, attempting to confirm or not results from previous more general studies.
<<Which advantages are pursued from companies implementing a BPA system?>>
Methodology
It has been selected a qualitative approach. The reason lies in the infancy status of BPA research, so that many issues have not been tackled directly from existing literature. In fact, while Big Data and Business Analytics have been deeply analyzed, their application in BPA domain is still scarce. Therefore, a structured survey may be misunderstood from interviewees, and important aspects neglected. The methodology therefore is composed by the following three main steps:
1) Development of an original theoretical BPA framework, both organizing existing literature directly addressing BPA (e.g. Silvi & Visani, 2016) and adapting general results about Big Data, Business Analytics and management control tools impact (e.g. McAfee & Brynjolfsson, 2012);
2) Since existing literature, as already mentioned, does not describe satisfyingly topics addressed by BPA framework, it has been necessary to validate and enrich it through preliminary interviews with field experts and practitioners;
5
3) Finally, eight companies have been selected to develop an exploratory case study research, which proved framework effectiveness describing BPA systems in real scenarios.
Case studies interviews followed a semi-structured approach, allowing differences among companies to emerge. In fact, they differ in terms of size, industry and culture, variables believed to have an influence on BPA system configuration. Each case study followed the same macro-steps:
1) Brief introduction of Master Thesis subject via email/phone; 2) BPA framework presentation and explanation face to face;
3) Ask interviewee to briefly introduce the company he is working for, together with business and market peculiarities:
4) Ask the interviewee to comment BPA applications currently present in the company and future projects, providing feedbacks about framework clarity and completeness;
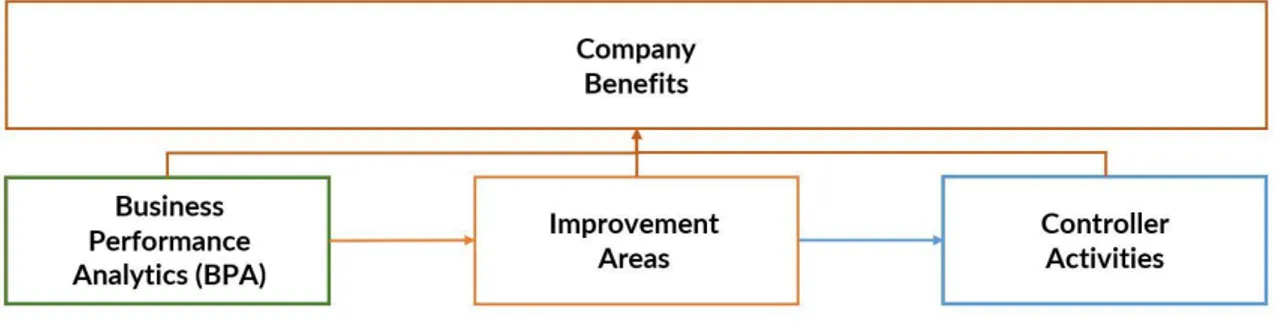
BPA framework
The resulting framework is composed by 4 primary blocks and 20 secondary blocks, and it is modelled so that investigating their content and relationships among them, research questions are answered. In fact, it aims to explain how a specific BPA system configuration (RQ 1) can bring which improvements to a list controllers’ activities (RQ 2). Finally, which benefits do BPA and its improvement areas to controller activities bring to the company as a whole (RQ3)? The output is descriptive and robust thanks to a detailed and comprehensive analysis and re-organization of existing literature, and to the validation and enrichment obtained thanks to the afore mentioned preliminary interviews. BPA block is based on Silvi & Visani, 2016. Secondary blocks have been adequately detailed in dedicated chapters, giving special attention to Big Data and Business Analytics. They are the innovative elements in the block, and therefore the most challenging to deal with for companies. Improvement Areas identification is based on several core papers (Accenture, 2018; Barton & Court, 2012; Chang et al., 2014; G Cokins, 2013b; Gary Cokins, 2014; Gandomi & Haider, 2015; Manyika et al., 2011; Network Digital 360, 2017; Plaschke et al., 2018), and then rectified by preliminary interviews; Controller Activities have been classified following a report by Accenture (Accenture, 2018), investigating
6
technologies related to BPA adoption in Finance function; Company Benefits block has been developed with the same approach as Improvement Areas one, therefore grouping different studies and then including suggestions from interviewees.
Results
A cross-case study analysis of each block allowed to enrich the framework, understanding their content and existing relationships among them, leading therefore to answer research questions. Here, final results are presented.
7
RQ 1
<< What is the degree of diffusion of BPA systems among companies, in terms of key components (PMMS, IT infrastructure, Business Analytics, Big Data)?>>
BPA diffusion and macro-configuration in terms of key components has been found to depend primarily on Company Size.
Graph 1-1, BPA diffusion and configuration depends on Company Size
Case studies allowed to analyze different firm sizes, ranging from Small-Medium Enterprises (SMEs) to Fortune 500 companies. Large firms have both more need of BPA systems, that enable to analyze and find correlations between different business lines and markets, and capabilities to invest in technologies and competencies. Currently, being BPA systems still in the infancy of their evolution, other drivers are still not definite enough. This has been suggested from several interviews, for example:
<<When we kicked off our analytics project for performance management, we started looking for benchmarks, but didn’t find any. This is something completely new not only for us, but for the market>> Energy S.p.A. AFC Digital Hub - Chapter Leader Data Competence Center & Advanced Analytics.
RQ 2
<<How do BPA improvement areas impact controllers’ activities?>>
Despite there is not statistical evidence and therefore results cannot be generalized, Improvement Areas relevance, and therefore their impact on controllers’ activities, have been measured and classified.
8
= Relevant in the case study X = Most important
Table 1-2, Improvement Areas block results summary
From Table 1-2, it is possible to notice that Increased data granularity and accuracy and Clearer cause-effect relationships among variables are considered the improvements impacting Controller Activity the most, but how? Two main relationships have been identified, depending on activity category:
• Operational Administration, (Report); • Strategic Plan, Analyze, Advise, (Report).
Report activity can be both Operational and Strategic, depending on company choices. While advanced robots, through Robot Process Automation (RPA), are now executing most of the repetitive and not value adding Operational activities, BPA is enriching and increasing strategic ones potential, thanks to Increased data granularity and accuracy, Clearer cause-effect relationship among variables, New information available, Forecast accuracy and Earlier reactions. Controllers can now take more fact-based decisions adopting a data-driven approach. Entering Lebanon market, which brand and which kind of stores should we adopt? This is an example of strategic decision now supported from BPA in a furnishing retail company included in case studies. Detailed impacts examples have been firstly presented in the Case Studies chapter, and then summarized in the Discussion and Results one.
9
These first results about BPA impact on controllers’ activities make possible to formulate some hypotheses about Finance function role evolution, topic long debated in literature: will it become CEO’s “Strategic advisor” (Gary Cokins, 2014) and “ramp up as analytics leader” (T. H. Davenport & Tay, 2016), empowered by BPA, or its strategic relevance will reduce because of automation (Frey & Osborne, 2013)? Two main evolution drivers have been identified during exploratory case studies: Business and Culture. Characteristics of company’s business, for example market and customers, together with its culture and strategy will determine the impact of BPA on Finance function role. While a business strongly influenced by consumers’ needs and whose culture is oriented to customer service and product differentiation will most likely decrease Finance function strategic relevance, another business operating in a commodity market and culturally oriented to its internal processes and cost reduction will tend to move in the opposite direction.
10
RQ 3
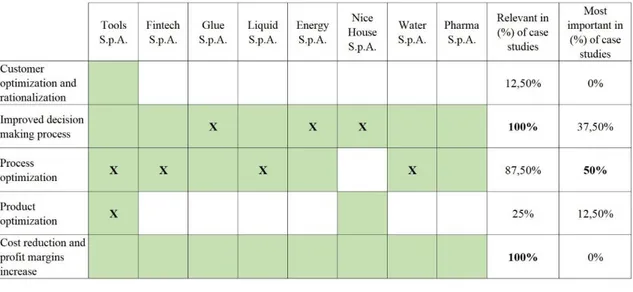
<<Which advantages are pursued from companies implementing a BPA system?>> Table 1-3 provides an overview of results, highlighting most mentioned Company Benefits in exploratory case studies.
= Relevant in the case study X = Most important
Table 1-3, Company Benefits block results summary
Other than Cost reduction and profit margins increase, that is, not surprisingly, a key goal for all companies studied, Improved decision-making process and Process optimization have been found to be the most pursued Company Benefits. In fact, the former is achievable thanks to the data driven approach guaranteed by BPA, while the latter is achieved automating controllers, repetitive activities, and making easier to identify inefficiencies in other processes. Other Company Benefits are matched in case studies, but rarely and indirectly. Customer optimization and rationalization and Product optimization, in fact, are often not directly addressed by BPA projects, but instead by other data analytics implementations in Marketing function.
It is important to highlight once again that, because of the qualitative nature of this study, results cannot be generalized. Nevertheless, they are satisfying: research questions have been answered and BPA framework is well suited to describe applications present in the industry. It can therefore serve as starting point for further research, that can investigate more in detail a specific block, or a specific relationship among blocks.
11
2. INTRODUCTION
Big Data and Business Analytics research is acknowledged to be of high and increasing relevance since 2011 (Fosso Wamba et al., 2015; Frizzo-Barker et al, 2016). In 2012, this trend was firstly recognized by the Harvard Business Review. It published a special issue hinged on these topics, which articles would have been quoted many times in the forthcoming years. For instance, T. H. . Davenport & Patil (2012) focuses on new roles that will be necessary in companies, while McAfee & Brynjolfsson (2012) emphasizes not only advantages, but also challenges and the barriers that could compromise the development of this new phenomenon. From that moment, research never slowed down, covering different aspects and applications of the “Management revolution” (McAfee & Brynjolfsson, 2012).
But what is it Big Data? Information technologies experimented a rapid development, allowing the collection of a greater amount of data and information from, for example, e-commerce, smart city surveillance camera, GPS systems and social networks. Some data can better describe this phenomenon: all over the world, the per-capita capacity to store information has roughly doubled every 40 months since the 1980s as of 2012; every day 2.5 Exabyte (2.5×1018 bytes) of data were created; as of 2014, every day 2.3 Zettabyte (2.3×1021 bytes) of data were created (Sh. Hajirahimova & S. Aliyeva, 2017). Data generation acceleration is caused also from Internet of Things technologies implemented in companies. RFID-enabled item-level tagging is one of them: it has been estimated that the number of tags rose from 1.3 billion in 2005 to 30 billion in 2013, and therefore the amount of data generated (DeRoos, 2013).
Not only volume however, but also variety and velocity are characteristics that had a steep increase in the last decades, making them not manageable anymore from traditional technologies. A new paradigm is therefore necessary, and this paradigm is Big Data (Baharu & Sharma, 2016). Volume, variety and velocity constitute the three basic characteristics of data that can be classified as Big Data (McAfee & Brynjolfsson, 2012; Russom, 2011).
Researchers agree that Big Data can be decisive creating a competitive advantage for companies (Fosso Wamba et al., 2015). However, this is possible only developing a precise data strategy (DalleMule & Davenport, 2017; T. H. Davenport & Bean, 2018;
12
Stefan Biesdorf, 2013). Companies, therefore, do not have only to invest on, but also follow closely Big Data projects, tailoring a detailed strategy that includes every area of the business.
Among these areas, there is one that is recognized to be of great relevance, but whose research is still not as developed as it would deserve: Performance Measurement and Management (Ask et al., 2016; Jayakrishnan et al., 2018; Rikhardsson & Yigitbasioglu, 2018). The importance of this topic has been recognized years ago; in fact, already in 2012 (Schläfke et al., 2012) appeared the first literature-base analyses directly addressing it. Anyway, in the following years, few researches have been conducted, and with only little focus on practical case studies. This led other academics trying to raise the interest about it with a dedicated “Call for action” (Ask et al., 2016). In the recent past, more exploratory case studies are emerging, validating implementation models and frameworks (Raffoni et al., 2017; Vallurupalli & Bose, 2018; Visani, 2017).
But why Performance Measurement and Management, and in general Management Control and controllers’ activities, is considered to be so affected from Big Data and Business Analytics revolution? It has been pointed out that they can bring data and rigor in areas traditionally more dominated by intuition (McAfee & Brynjolfsson, 2012). At the same time, many researchers argues that there is a gap between theory and practice in accounting research (Merchant, 2012). Nielsen, 2017 suggests exploiting Business Analytics to start developing theories in this field that can finally be more fact-based, and therefore more easily implementable in real scenarios. Analytical Performance Management (APM) is an approach to business management enabling Business Performance Analytics (BPA), that in turn consists of models supporting performance monitoring and management, that help understanding business dynamics and strategies through consisting in exploit analytics. These models can support and enhance Performance Measurement and Management (PMM), for instance being able to quantify relationships among financial and non-financial performance indicators (T. H. Davenport, 2008), making therefore more powerful dashboards system such as the popular Balance Scorecard (BSC) (R. S. Kaplan & Norton, 1992). Therefore, Big Data and Business Analytics do not only have general ROI benefits for companies (Accenture, 2013), but also specific ones related to the field of accounting and control.
13
Fully embrace an analytics culture is necessary to achieve effective implementation of Big Data and Business Analytics systems across the company, but it involves a relevant mindset shift (DalleMule & Davenport, 2017; T. Davenport, 2017; T. H. Davenport & Bean, 2018). It implies therefore several challenges of different nature to be overcome. Different studies focused on identifying them, in order to support companies during the innovation process. They have been classified, for instance, as: managing data quality, using analytics for improved decision making, creating a Big Data and analytics strategy, availability of data, and building data skills in the organization (Vidgen et al., 2017); leadership, talent management, technology, decision making, company culture (McAfee & Brynjolfsson, 2012); related to Big Data characteristics, that are volume, variety and velocity (Ask et al., 2016).
From the information presented, it is possible to understand that Business Performance Analytics is an hot topic among researchers and practitioners, that can certainly bring significant benefits to companies. Controllers’ activities and in particular Performance Measurement and Management is one of the areas where advantages are more evident; nevertheless, still minor focus has been put on it, and in particular few practical cases have been investigated. The purpose of this research is therefore to contribute closing this gap, analyzing how different companies have implemented Business Analytics in Finance function, drawing an overall picture, and then drafting general conclusions about best practices. A theoretical framework will be firstly designed through existing literature and practitioners suggestions; then, it will be detailed and enriched through several exploratory case studies.
Structure of the thesis
After a brief Introduction, necessary to let the reader understand general and specific characteristics of the topic addressed by this Master Thesis effort, the third chapter reviews existing literature, addressing one by one the key components of a BPA system as identified by Silvi & Visani, 2016. They are Performance Measurement and Management System, IT infrastructure and technology, Business Analytics and Big Data. Then, in the same chapter, advantages and challenges of this paradigm are presented; finally, the Literature Review chapter ends summarizing findings, explicating research questions and expectations. The third chapter describes the Methodology followed to
14
answer research questions, divided in two macro-phases: the development of a theoretical framework and then exploratory case studies to understand in detail how its blocks and links work in a real scenario. Between them, it has been conducted a preliminary framework validation phase, interviewing academics and practitioners about its meaningfulness and clearness.
Then, it is firstly developed the BPA framework and described its components. Secondly, case studies are presented one by one. Concluded this phase, it is possible to discuss results and how case studies enrich the first version of the framework. Finally, conclusions are drafted, and limitations and suggestions for future research are presented.
15
3. LITERATURE REVIEW
In the Literature Review chapter is firstly presented the methodology followed to select relevant research papers to be included in the research. Then each topic identified as pertinent to the research scope is analyzed. Finally, findings are summarized, as a preliminary step to research questions formulation in chapter 4.
Methodology
The Literature Review has been developed following a structured process. The main databases used have been Scopus and Web of Science (WOS). Scopus, on its own website, claims to be “the world’s largest abstract and citation database of peer-reviewed literature, including scientific journals, books and conference proceedings”. It gives four types of quality measures for each title, that are h-Index, CiteScore, SCImago Journal Rank and Source Normalized Impact per Paper. On the other hand, Web of Science advertises that “you can access an unrivalled breadth of world-class research literature linked to a rigorously selected core of journals and uniquely discover new information through meticulously captured metadata and citation connections”. They are both considered trustable, comprehensive and provide useful tools for citation analysis; however, they complement each other, as neither resource is all inclusive (Burnham, 2006).
Keywords used have been first strictly focused on the topic, to be able to have an overview. Therefore, “Big Data” AND “Performance measurement”; “Big Data” AND “Performance Management”; “Business Analytics” AND “Performance measurement”; “Big Data” AND “Performance management”. After this first step, it was clear the nomenclature commonly used in the specific research field. A second round of research included therefore the keywords “Analytical Performance Management”, “Business Performance Analytics” and “Performance Management Analytics”. At this point, also paradigm key components were known, and it was therefore possible to deepen the research in each of them: IT technology and systems, Performance Measurement and Management, Business Analytics and Big Data (Silvi & Visani, 2016). Priority was given to documents presenting strict relationship with the core of the research. However, also others only indirectly related were analyzed to grasp possible different perspectives.
16
Articles and reports drafted from renowned consulting companies were included in the literature review, both searching on their website and following citations present in other papers. Another magazine from which many articles have been read and analyzed is the Harvard Business Review (HBR), where T.H. Davenport, one of the most relevant authorities in the field of Big Data and Business Analytics, published many of his articles. There has also been the possibility to contact directly one of the main contributors to the APM field, Riccardo Silvi, who suggested key papers to be analyzed to fully comprehend all the issues regarding the subject. Secondary papers were selected to select the appropriate research approach, composing therefore a database of 114 documents.
Introduction on Business Performance Analytics (BPA)
This chapter summarizes findings in previous research regarding the application of Big Data Analytics (BDA) in Performance Measurement and Management Systems (PMMSs), and related relevant areas. The merging of these two areas is named Business Performance Analytics (BPA). It consist of models supporting performance monitoring and management, that help understanding business dynamics and strategies through (Silvi & Visani, 2016). It has four key components:• Information Systems (IS) and Information Technology (IT); • Big Data;
• Analytical tools and methods, named Business Analytics; • PMMS.
17
The approach to business management that exploits BPA is called Analytical Performance Management (APM) (Silvi & Visani, 2016).
First component: Performance Measurement and
Management Systems (PMMS)
It is relevant to the purpose of the research to provide an insight on what is a background of the core topic. In fact, BPA is an improvement to controllers’ activities and an enhancement of management accounting. In particular, it is the missing link between complex PMMS and their effective implementation (Silvi et al., 2010).
PMMS is enabled by Information Systems (IS) and Technology (IT) (Ferreira & Otley, 2009; Otley, 1999). IS and IT are used to organize accounting information and other control information (Ferreira & Otley, 2009); an example are ERP systems that, even though have not been developed with this specific purpose and were initially considered a fad, are interdependent with PMMS and management control systems in general (Chapman, 2005). IS and IT can make organizations more complex, and allow their description through accounting representations; this relationship, however, is complex and still not clear in all its aspects (Dechow et al., 2006). What has been long noted is that accounting cannot be practiced without IT (Dechow et al., 2006).
A Performance Measurement and Management System can be defined as a multi-dimensional set of metrics used to quantify both efficiency and effectiveness of actions, planning and manage the future of a business (Bourne et al., 2003; Neely et al., 1995). PMMS history can be tracked back to the 40s and 50s. At that time Japanese and Western companies had completely different strategies and production systems, focused respectively on efficiency and innovation, and therefore needed different PMMS (Nudurupati et al., 2011). After criticism was moved towards U.S. managers because of their short-term view (Hayes & Abernathy, 1980), in the 80s the potential of Japanese techniques was recognized, and more complex PMMS including more dimensions (such as time, cost, quality, flexibility) were developed (Nudurupati et al., 2011). Later in the 80s and in the 90s also non-financial measures started to be considered fundamental for comprehensiveness reasons, and new frameworks were developed to include them, such as the BSC (R. S. Kaplan & Norton, 1992). PMMS is a topic still under fast development,
18
that must adapt to trends such as multi-cultural supply chains and networks, servitization and digitalization (Nudurupati et al., 2011) and of course to Big Data (Silvi et al., 2010). The lifecycle of a PMMS includes three phases (Nudurupati et al., 2011):
• Design: BSC (R. Kaplan & Norton, 2001; R. S. Kaplan & Norton, 1992), Performance Prism (Neely et al., 2002) and the Integrated Performance Measurement Systems (Bititci et al., 1997; Bititci et al., 1998) are examples of this phase output;
• Implementation, that include four main tasks: data creation, data collection data analysis and information distribution (Bourne et al., 2000);
• Use and update, with the former that is often considered cause of early failure of PMMS (Bititci et al., 2002) and the latter that is effectuated consistently with strategy updates, frequently needed in today’s competitive environment (Bourne et al., 2000).
When developing a PMMS project and therefore going through these steps, it is necessary to face five main challenges, that together form a framework (Otley, 1999). They regard: 1) Identification of company’s Critical Success Factors (CSFs) and decision about
how to evaluate them;
2) Identification of company strategies, how to implement them and how to measure their performance;
3) Identification of the performance level necessary (target) in the two previous areas; 4) Assignment of rewards for managers when achieving the targets;
5) Decision upon which information flows are necessary to enable lesson learnt process.
This framework evolved in the following years in different ways, increasing its complexity. For example, Ferreira & Otley (2009) increased the number of steps up to 12. Anyway, the core is still the same. Frameworks presented in following dedicated sections, describing APM and BPA lifecycle, present similar phases.
A well-structured and adequately configurated PMMS is necessary to exploit data value and the techniques to analyze them (Silvi & Visani, 2016). It is therefore necessary for companies to employ dashboards for strategic control, directional control systems (e.g.
19
budget, variance analysis) and finally analytical systems for results analysis such as Total Cost of Ownership (TCO) or Activity Based Costing (ABC) (Silvi & Visani, 2016). All of these areas are recognized to be impacted from Big Data paradigm (Silvi et al., 2010; Silvi & Visani, 2016; Warren et al., 2015), but the few research present focuses on dashboards and BSC in particular (Appelbaum et al., 2017; Nielsen, 2017) or on analytical systems (Nielsen, 2017; Visani et al., 2016). No studies have been conducted on directional systems yet.
Second component: Information Technology (IT)
infrastructure
IT and Information Systems (IS) evolved rapidly during the last decades, supporting increasing complexity levels of Business Intelligence and Analytics (BI&A). In particular, it is possible to classify three of them (Chen et al., 2012)
The first level can support structured data, usually stored in Relational Database Management Systems (RDBMS). A complete BI system should own 13 capabilities, classified in Integration, Information Delivery and Analysis capabilities (Hagerty et al., 2011). BI&A 1.0 can support reporting, dashboards, ad hoc query, search-based BI, OLAP, interactive visualization, scorecards, predictive modeling and data mining (H. Chen et al., 2012).
The second level, corresponding to BI&A 2.0, was born after the necessity of analyzing new type of unstructured data from the web. Usually, BI&A 1.0 are already integrated into commercial enterprise IT systems, while these new tools are not. They require to include mature and scalable techniques in text mining, web mining, social network analysis, and spatial temporal analysis with existing BI&A 1.0 RDBMS (H. Chen et al., 2012).
The third and last level, BI&A 3.0, is mostly related with smartphones and Internet of Things (IoT), that make possible to collect a much higher volume and variety of data. Not integrated solutions in enterprise systems are present yet, so that this is a great opportunity for further research both for academics and practitioners (H. Chen et al., 2012).
While RDBMS allow to manage structured data and implement BI&A 1.0, the technology that is mostly implemented to deal with Big Data and advanced BA is called NoSQL –
20
Not only SQL or, more recently, NewSQL. The former collects data without following the traditional relational scheme, allowing to manipulate more easily big amounts of unstructured data of different type. The latter uses a relational system, but provides scalability performances comparable to those of NoSQL systems (Osservatorio Big Data Analytics & Business Intelligence, 2017).
While many companies are now adopting proprietary systems (Osservatorio Big Data Analytics & Business Intelligence, 2017), a great input to research and development in this field as been given by open source systems. The most popular one is the Hadoop framework, together with its key component MapReduce (Baharu & Sharma, 2016; Chen et al., 2012; Zikopoulos et al., 2011). Hadoop is a “Java-based framework that supports data-intensive distributed applications, enabling applications to work with thousands of processor nodes and petabytes of data.” (Stapleton, 2011). Its first key component is the Hadoop Distributed File System (HDFS), that is the concept of breaking down each cluster of data into smaller pieces called blocks, in order to more easily execute functions (Zikopoulos et al., 2011). The second one is MapReduce, a programming paradigm that allows for massive scalability across huge numbers of servers in a Hadoop cluster; the map task transforms data in set of tuples (key/value pairs), and then reduce allows to combine them in smaller sets (Zikopoulos et al., 2011).
Overall, the major challenge in Big Data is storage capacity, and it can be overcome through HDFS, while analyses can be carried out by MapReduce paradigm, that can process data across different clusters in parallel manner (Baharu & Sharma, 2016). In general, IT investments that companies face can be categorized as (Osservatorio Big Data Analytics & Business Intelligence, 2017):
• Enabling infrastructures, including computational power, servers and storage facilities;
• Software, including databases, data acquisition and elaboration tools, data visualization and advanced data analytics platforms.
Software examples have been described before, when talking about RDBMS, NoSQL and NewSQL. On the other hand, considering infrastructures, one of the most important choices is about data integration level, that can be classified as follows (Osservatorio Big Data Analytics & Business Intelligence, 2017):
21
• Silos, that represents the traditional approach, where every function collects and stores its own data;
• Data Warehouse, that collects data, structured following relational schemes, coming from the whole organization and also external sources;
• Data Lake, that stores data in their native format and allows therefore integration of high quantity of data of every format and coming from every source.
• Integrated model, when the company owns both a Data Warehouse and a Data Lake, each one used depending on specific needs.
Industries leading in in investments are Banking (28%), Manufacturing (24%) and Telco and Media (14%). Investments growth, on the other hand, is higher than 25% in the Insurance, Banking and the Large Organized Distribution markets (Osservatorio Big Data Analytics & Business Intelligence, 2017).
Third component: Big Data
Research trendsAmong BPA components, Big Data is certainly the one on which researchers and practitioners are more talking about right now, and at the same time the most recent. For this reason, it is interesting to investigate research trends.
To have an overview about Big Data research, it is useful to analyze data coming from websites aggregating articles, books and other scientific documents from various journals and publishers. Scopus is one of these websites and enjoys a good reputation in terms of quantity and quality of documents stored, as mentioned also in the Literature Review Methodology chapter. The following graph shows the trend of documents including the keywords “Big Data”, published during the years. It has been arbitrary chosen as starting year 2002, since before this date no trend is present.
22
Graph 3-1, "Big Data" keyword search trend in Scopus database
Graph 3-1 confirms what written in the Introduction chapter. Research about “Big Data” was very slow until 2011-12, when some key publications raised the interest in the whole scientific community. The peak has been reached in the last available year, 2017, with 12,334 documents available on Scopus. Up to date (20/08/18), in 2018 have been uploaded 9,109 documents, leading to think, considering a linear trend, that the amount at the end of the year will be similar. This also suggests that the interest in the topic may have reached a saturation limit, since from 2016 to 2018 the increase rate has decreased, compared to previous years. Another valuable analysis can be performed looking at documents distribution by subject, in the same years.
23
Graph 3-2 shows that most of the research focuses on Big Data technical aspects. In fact, almost half of the documents (41,7%) is related to “Computer Science” subject area. Relevant shares belong also to other technical subjects such as “Engineering” (14,5%) and “Mathematics” (9,8%). This research is located in “Business, Management and Accounting” area. Numbers (only 3,1% of the documents regarding it) do not reflect the importance recognized to these topics from different studies, mentioned in the Introduction section and that will be further analyzed in the following ones.
It is also possible to notice that, even increasing the analysis focus on a more recent period (2016-20, considering also papers which have been approved but not yet published), there are not considerable shifts in distribution among subject areas.
Graph 3-3, Subject areas of results from "Big Data" keyword search in Scopus database, 2016-20 period
Actually, referring to Graph 3-3, “Business, Management and Accounting” area is even less relevant than in the previous case.
It is also possible to narrow down the analysis, considering only documents more strictly related to this research’s topic. To do so, the previous analyses have been repeated with different keywords. This second search on Scopus used the keywords “Big Data” AND “performance management”.
24
Graph 3-4, "Big Data" AND "Performance management" keywords search trend in Scopus database
Before 2013 no document was present on the database. Even in the following years, however, the number of publications has not reached significant volumes, especially if compared with the previous, broader, search.
Graph 3-5, Subject areas of results from "Big Data" AND "Performance management" keywords search in Scopus database
The analysis by subject in Graph 3-5 shows that “Business, Management and Accounting” topic is, as expected, more relevant (7,6%) than before. Still, the share is low.
25
Graph 3-6, Subject areas of results from "Big Data" AND "Performance management" keywords search in Scopus database, 2016-18 period
For the sake of consistency, Graph 3-6 shows the analysis by subject area repeated considering only the most recent documents (2016-18, no publication approved for 2019-20 yet). Conclusions are the same. There is only a slight decrease regarding “Business, Management and Accounting” subject area.
The analysis just presented does not include all documents published. For example, the only language considered is English. However, it is sufficiently comprehensive to represent and explain the worldwide research community interests. It shows that, despite the importance recognized to it, Big Data in Performance Measurement systems, ad therefore BPA, is not yet given enough attention and focus. This grants the author an opportunity to address a gap in existing literature.
Introduction
Big Data is the name used to call a new wave of data, that differentiates itself from the previous generation in terms of volume, variety and velocity (McAfee & Brynjolfsson, 2012). These differences are substantial and change the way how data should be managed and analyzed to effectively bring value to companies. Data, in fact, are only partially structured as it happened in the past; it is estimated that the highest volume is composed by unstructured data, such as videos (Gandomi & Haider, 2015). Text, audio, video and social media analytics are some of the methodologies now necessary to successfully exploit data available to companies (Gandomi & Haider, 2015). This exploitation can
26
bring substantial advantages to companies: it has been estimated that firms employing data-driven decision making, on average, are 5% more productive and 6% more profitable than competitors (McAfee & Brynjolfsson, 2012). How? The root reason stands in a famous sentence traditionally attributed to Peter Drucker: “You cannot improve what you do not measure”. Big Data, together with Business Analytics, allow not only to collect, but also analyse data from an increased number of sources.
Big Data adoption, however, involves the whole company. It is a change of strategy, and it is therefore not enough to invest in IT technology to fully embrace it. Among others, it is needed a change in leadership, talent management, decision making and finally company culture (McAfee & Brynjolfsson, 2012). As any other strategic innovation, moreover, it requires all investments to be carefully aligned with business strategy and closely followed by the management with convincing engagement (Stefan Biesdorf, 2013).
Another aspect on which it has been put great attention is the need of a new role in organizations, the data scientist, who has not only a solid computer science background, but also soft skills such as communication, needed to effectively deliver the meaning of their analyses to managers (T. H. . Davenport & Patil, 2012), or the ability to ask the right questions and understand the limits of his analysis (McKinney et al., 2017). Accountants understand R&D, engineering, manufacturing unit activities and the marketing and sales function in relation to financial flows and perhaps also to a degree operationally: the accounting mind-set, therefore, provides a ready perspective on what could be asked if an appreciation of the potential of data analytics pre-exists (Bhimani & Willcocks, 2014). Increase in productivity can be achieved only with significant investments in expertise (Prasanna Tambe, 2014). The relevance of data scientist role tend to decrease the believe that “data speak by itself”. (Mayer-Schönberger & Cukier, 2013). In general, it is considered necessary also complementary managerial knowledge about what is going on in the real world (Chang et al., 2014). There are studies concluding that even this enrichment of accountants skills is not enough, and that this role is destined to extinction (Frey & Osborne, 2013); this view, anyway, is considered pessimistic from other researchers: Big Data is not a threat, but an opportunity for controllers (Gary Cokins, 2014; Richins et al., 2016). From this second point of view, in fact, not only Finance function, and therefore accountants and controllers, is not going to lose any relevance,
27
but it is actually going to take on the role of CEO’s “Strategic advisor” (Gary Cokins, 2014) and of “analytics leader” (T. H. Davenport & Tay, 2016).
Organizational models must also be defined. Data science will be an independent centralized unit, or decentralized? To what degree? Drivers of choice are not identified yet, but different solutions may be adequate depending on the context (Osservatorio Big Data Analytics & Business Intelligence, 2017).
Definition
It has been introduced what Big Data are, why they are important in today’s world and main challenges that are faced when implementing them in a company. It is now necessary to formally define the concept. It is difficult to find a unique definition of Big Data in literature (Pospiech & Felden, 2012). Each author gives one, focusing on different aspects. Common characteristics included are data volume and variety of data sources. <<“Big Data” refers to enormous amounts of unstructured data produced by high-performance applications falling in a wide and heterogeneous family of application scenarios: from scientific computing applications to social networks, from e-government applications to medical information systems, and so forth >> (Cuzzocrea et al., 2011). This is an example entailing both concepts mentioned before. Authors highlight both the high volume of data (“enormous amounts of unstructured data”) and then list some of the main sources from where they are generated.
Other definitions focus more on technological aspects of Big Data, and on the hardware necessary to handle and effectively analyze them. In an exhaustive report from McKinsey & Company, it is possible to find the following definition:
<<“Big Data” refers to datasets whose size is beyond the ability of typical database software tools to capture, store, manage, and analyze>> (Manyika et al., 2011).
This definition identifies four operations - capture, store, manage, analyze – that is not possible to perform with typical present technology, constituted by RDBMS and related tools.
Another interesting definition, presented below, is based on the same concept but gives an historical perspective.
28
<<Big Data should be defined at any point in time as data whose size forces us to look beyond the tried-and- true methods that are prevalent at that time>> (Jacobs, 2009). Big Data, therefore, are not only those that nowadays require overcoming relational databases technology. In the 1990s, for example, any data for which Microsoft Excel was not enough, and hence requiring Unix workstations, could have been considered Big Data (Jacobs, 2009).
Boyd & Crawford, 2012 consider not only the technological and scholarly natures of Big Data phenomenon, but also the cultural one:
<< We define Big Data as a cultural, technological, and scholarly phenomenon that rests on the interplay of:
1) Technology: maximizing computation power and algorithmic accuracy to gather, analyze, link, and compare large data sets.
2) Analysis: drawing on large data sets to identify patterns in order to make economic, social, technical, and legal claims.
3) Mythology: the widespread belief that large data sets offer a higher form of intelligence and knowledge that can generate insights that were previously impossible, with the aura of truth, objectivity, and accuracy.>> (Boyd & Crawford, 2012)
These definitions show how different Big Data definitions can be, depending on the perspective adopted. However, for the purpose of this research, the most useful and comprehensive one has been developed by Fosso Wamba et al. (2015), who conducted a systematic literature review with the goal, among others, to summarize previous ones: <<We define “Big Data’ as a holistic approach to manage, process and analyze 5 Vs (i.e., volume, variety, velocity, veracity and value) in order to create actionable insights for sustained value delivery, measuring performance and establish competitive advantages>> (Fosso Wamba et al., 2015)
It is important to highlight as also this definition, integrating many others considered by the authors, considers “measuring performances” as one of the key value drivers of Big Data. Another topic included is Big Data “Vs”. They are the characteristics on which this new paradigm differs from the traditional one. Already in 2001 (Laney, 2001) they have
29
been identified as critical parameters, causing difficulties in data storage, management and analysis.
Characteristics
An important classification of Big Data is based on their different formats and sources, that can be classified from a general point of view according to two dimensions (Silvi & Visani, 2016):
• Structured vs Unstructured: while the firsts can be stored in traditional RDBMS, the seconds need specific technologies; typical examples are ERP data vs video; • External vs Internal: depending whether their source is inside or outside the
company; examples can be tweets, Facebook posts vs costs, customers comments. These two classifications lead to four categories, as clarified by Table 3-1, adapted from Tavola 8 from Silvi & Visani, 2016. Examples are provided in each cell.
Format Structured Unstructured Sou rc e Internal > Market researches; > Sales data;
> Process control metrics.
> Internal emails; > Customers comments; > Employees analyses. External > Tweets numbers; > TripAdvisor ratings;
> Location and time of tweets.
> Comments on online forums; > Video reviews;
> Images on Pinterest; > Surveillance videos.
Table 3-1, Big Data classification in terms of Source and Format
Vs of Big Data
The “Vs” definition is very common in the terminology used among researchers, and it broadened along time, with the advent and diffusion of Big Data, about ten years after that first publication (G. Gupta & Gupta, 2015; Gandomi & Haider, 2015; McAfee & Brynjolfsson, 2012; Russom, 2011).
30 Volume
This concept has already been mentioned: it refers to the magnitude of data. It is often quoted the example of Wal-Mart, which collects every hour 2.5 petabytes of data from its customers transactions (Manyika et al., 2011; McAfee & Brynjolfsson, 2012). Facebook processes up to one million pictures per second (Beaver et al., 2010). Moreover, in the 2010s Web 3.0 is emerging, mobile and sensor-based, promising to further increase the number of data sources and therefore overall data amount (H. Chen et al., 2012). Nevertheless, it is difficult to define a volume threshold above which data become Big Data (Russom, 2011). It depends also on time and type of data: for current storage capacities could be “big” a quantity that in a few years becomes actually “small”. Moreover, the same volume could be more or less difficult depending on the type of data, e.g. video or text (Gandomi & Haider, 2015). It has been argued that Big Data can bring great advantages and benefits to companies, since it is possible to know more about them and therefore improve performances and decision making (McAfee & Brynjolfsson, 2012). However, too many data could cause an overload of very complex information. In this scenario, information specialists could seek problems to which they can find a solution, instead of focusing real businesses problems (Bawden & Robinson, 2009). To avoid this kind of issues, it is necessary for data scientists to have a deep knowledge of the business they are working for, but it is difficult considering the background they are expected to have. According to T. H. . Davenport & Patil (2012), in fact, are required excellent skills in coding, communication and data visualization. Business and management come after these, but they are still necessary (Chang et al., 2014).
Variety
It is not recent for companies the opportunity to collect a great variety of data, thinking for example about social media and RFID tags, but it is only recently that companies want to exploit it (Gandomi & Haider, 2015; Russom, 2011). This variety is a continuum that extends from fully structured to unstructured data, passing by a great variety of semi-structured ones. Structured data are those present in relational databases, tables with columns and rows; semi-structured data are more difficult to define, but an example can be the XML format, that must be “dabbled” a bit, but then is machine-readable; unstructured data include videos, text, audios (Gandomi & Haider, 2015; Russom, 2011).
31
A first challenge caused by high variety is that different types of data require different types of visualization and representation; the best choice depends also on the decision maker, who best know what is necessary to highlight, and is therefore necessary to involve (Ask et al., 2016). Secondly, different visualization methods could lead to attention fragmentation in decision makers (Ask et al., 2016).
Velocity
Nowadays, it is common to collect real time data. Think about sensors on manufacturing machines, or security camera on the streets (Russom, 2011). The real challenge is not about quickly generating data, but about verifying, processing, storing, distributing, gleaning for insights, monitoring, updating and maintaining them with equal speed to really create value and therefore achieving competitive advantage (G. Gupta & Gupta, 2015). For example, a group of researchers from MIT tracked how many people were shopping at Macy’s on Black Friday thanks to the GPS in their smartphones (McAfee & Brynjolfsson, 2012). Traditional data management system cannot be employed to perform this kind of tasks. Big Data technologies are needed to “create real-time intelligence from high volumes of ‘perishable’ data” (Gandomi & Haider, 2015). To achieve this goal, however, drawback must be considered and avoided. In fact, these new technology lead to integrate analytics in transactional data, and therefore “black-boxing” their functionalities and neglect their strategic and tactical nature (Ask et al., 2016).
Four levels of data analytics can be identified according to their velocity (Osservatorio Big Data Analytics & Business Intelligence, 2017):
• Batch, the system elaborates data collected periodically. An example is to elaborate during the night data collected during the day;
• Near Real Time, when data collected are elaborated by the system with intervals of hours or minutes;
• Real Time, when the system elaborates data as they are collected, and therefore they can be analyzed and consulted every time when needed;
• Streaming, when the system elaborates and produces analysis continuously during time.