UNIVERSITÀ DEGLI STUDI DI SASSARI SCUOLA DI DOTTORATO IN
SCIENZE VETERINARIE
INDIRIZZO
: Patologia e Clinica Animale (XXVII Ciclo)Radiographic and ultrasonographic examinations of the
horse’s stifle, in presence of flattening of the lateral trochlear
ridge and effusion of articular compartments:
The effect of the X-ray tube positioning in the detection of
flattening in the lateromedial view variations and effect of
agonistic effort in highlighting subtle ultrasonographic
findings.
Docente Guida
Prof. Giovanni Mario Careddu Correlatore Prof.ssa Valeria Busoni
(Università di Liegi) Direttore
Prof. Sergio Ledda Tesi di Dottorato Dott. Pablo Galilea A.
Acknowledgements
First of all I would like to thank to the people who made my participation in such studies possible in the beginning, Prof. Valeria Busoni, Prof. Giovanni Mario Careddu, Prof. Eraldo Sanna Passino and Dr. Francesca Cubeddu.
Secondly, I would like to sincerely thank all the collaboration, support and help that Dr. Nicolò Columbano, not only in his will in finding our local patients, for his teachings in surgery and farm animal medicine, surgery and anaesthesia, but for also for his continuous crusade in trying to make me understand the Italian culture, since the beginning of my arrival in Sardinia. Along with him, Dr. Valentino Melosu, Dr. Roberta Deiana, Dr. Elisa Pintore, Dr. Sabrina Caggiu, Francesco Gaddia and Rita Fenu who had been there always supporting in every possible sense.
When someone decides to leave its own duties, dear family and friends (therefore a life left apart) for the hope of achieving a new grain of knowledge in the beach of science, any support, any smile and any hand given is of extreme value for that foreign individual that has his life split between personal priorities. For this reason, and not only to be correct with everyone, but to be sincere in the expression of my feelings I warmly appreciate every student that placed a face of interest (especially when there was no clue of what I was trying to say), every colleague that corrected my wrong Italian and also those that shared their knowledge, and of course every person who in this road became a friend.
It would not be possible complete this acknowledgements without appreciating enormously all the teachings from the “Service d’Immagerie” from the “Université de Liège”; Prof. Valeria Busoni, Dr. Géraldine Bolen, Dr. Anne-Laure Etienne, Dr. Laurence Evrard and Dr. Annalisa Liotta, all the teachings in the “CIRALE” from the “École National Vétérinaire d’Alfort”, given by Prof. Jean-Marie Denoix, Prof. Fabrice Audigié, Dr. Virginie Coudry, Dr. Sandrine Jacquet, Dr. Lelia Bertoni, for the continuous support from part of Prof. Denis Verwilghen, even not having the opportunity to visit him, to Prof. Bernd Driessen and Prof. Laura Zarucco for their continuous support, Dr. Christopher Stockwell and his team for his training in equine surgery and to Prof. Giovanni Sotgiu that analysed and guided me in the statistical analysis of this work.
Also I would like to thank the Sardinian horse owners, “Sa Sartiglia” organization, Dr. Michele Pazzola and every horse owner and trainer that placed their own horses to our disposition in order to achieve the studies presented in this doctoral thesis.
And finally the Università degli Studi di Sassari for allowing scholarships for extra-communitarian professionals who still have the will to raise their bar of knowledge.
Index Chapter Page Index Abstract 2 Riassunto 3 1 Introduction 5
1.1 • Anatomy of the femur 6
1.2 • Meniscal anatomy, structure and role 7
1.3 • Osteochondrosis 8
1.4 • Osteoarthritis 10
1.5 • X-Ray Imaging of the stifle area 12 1.6 • Ultrasonographic imaging of the medial meniscus 13
2 Objectives and hypothesis 13
3 Study I: “Influence of the variations in the stifle lateromedial projection
in the detection of flattening in the femoral lateral trochlear ridge of the distal femoral epiphysis”
15
3.1 • Material and methods 15
3.1.1 o Animals 15
3.1.2 o Equipment 15
3.1.3 o Measurements and data 15
3.1.4 o Interpretation of the images 20
3.1.5 o Statistical analysis 20
3.2 • Results 21
3.3 • Discussion 34
4 Study II: “Ultrasonographic screening in the stifle area: Influence
between structural abnormalities and recess distention”
37
4.1 • Material and methods 37
4.1.1 o Animals 37
4.1.2 o Equipment 37
4.1.3 o Acquisition of images, measurements and data 38 4.1.4 o Interpretation of the images 38
4.1.5 o Statistical analysis 39
4.2 • Results 40
4.3 • Discussion 48
4.4 • Conclusion 50
5 Study III: “Comparison between Sardinian horses and sBs candidate
stallions in the finding of flattening in the femoral lateral trochlear ridge of the distal femoral epiphysis”.
51
5.1 • Material and methods 51
5.1.1 o Animals 51
5.1.2 o Equipment 51
5.1.3 o Interpretation of the images 52
5.1.4 o Statistical analysis 52
5.2 • Results 53
5.3 • Discussion 55
5.4 • Conclusion 56
Abstract
Flattening of the lateral trochlear ridge of the femur is a sign of lesser degree of osteochondrosis in the horse. The whole area of the stifle can be prone to image deformation, particularly, for the difficulty of achieving a correct lateromedial projection in which medial and lateral condyles of the femur are superimposed. No comparative study of the different incidences, considered as lateromedial of the stifle area has been clearly studied to demonstrate the effectiveness in the detection of such sign. The deviation of these incorrect projections is translated in an apparent separationof the condyles either in the Y or X axis.
Different views considered as lateromedial were examined and divided in groups. Using a method based in the Pythagorean Theorem, the apparent distance between lateral and medial femoral condyles borders was calculated and then proportionally corrected to the diaphyseal thickness. Five categories for each axis were created and compared. Results show that radiographs with an X-Ray tube positioning within the ±5% from an exact lateromedial view in the X Axis, are statistically more effective to reveal flattenings (p<0.05).
This study shows that a correct X-Axis positioning for the lateromedial view is essential for the correct visualization of lateral trochlear ridge flattenings.
Synovial effusion is a sign of synovitis and even though it can be accompanied by pain, in sound horses can be present also. Measurements were carried on the medial femorotibial recess and lateral femoropatellar recess of sound horses used in competition to see if the ultrasound scan could reveal an influence of the size of these recesses in presence or absence of subtle lesions. Two different gallop activities were compared. In racetrack gallop flat racers, the side with most biomechanical stress (inner circle) showed to have larger measurements in the presence of subtle lesions (p<0.05) for the right lateral femoropatellar recess.
This study shows that even subtle lesions that do not generate evident gait abnormalities can influence adversely the synovial compartment in which they are withheld.
When comparing two isolated populations of horses, sBs and Sardinian horses, no statistical differences were found between the presence or absence of lateral trochlear ridge flattenings in the present study (p>0.05).
This study shows that different populations of horses have no significant differences in the probability of finding flattening in the lateral trochlear ridge of the femur.
Riassunto.
L’indagine radiografica del ginocchio del cavallo si basa prevalentemente sulla sua proiezione latero-mediale nella quale il raggio incidente deve essere ortogonale al piano parasagittale del femore, così che i bordi cranio-distali dei due condili femorali appaiano nel radiogramma ben sovrapposti fra loro.
L’ottenimento di una così precisa proiezione è di difficile realizzazione a causa delle peculiarità della regione del ginocchio, caratterizzata dalla sua forma troncoconica e dalla stretta vicinanza all’addome, che ostacolano un posizionamento della cassetta radiografica che sia ben dentro il cavo inguinale ed allo stesso tempo perfettamente perpendicolare al raggio incidente.
Per queste ragioni, molto spesso le radiografie ottenute presentano un certo grado di obliquità, la quale viene stimata proprio in base al grado di mancata sovrapposizione dei bordi condilari. L’entità di questa discrepanza rispetto alla proiezione ortogonale, viene finora espressa in termini di semplice distanza in millimetri tra le due immagini dei due bordi condilari. Un tale metodo di valutazione trascura inevitabilmente le differenze che possono esserci tra soggetti di diversa mole, manca di precisione ed oggettività e può quindi inficiare la valutazione di segni radiografici di determinate patologie.
Fra queste, l’appiattimento della cresta trocleare laterale del femore, noto convenzionalmente come “flattening”, è nel cavallo un segno di Osteo Condrite Dissecante (OCD) di grado minore, la cui evidenziazione radiografica non è sempre facile e richiede a volte la ripetizione dell’esame radiografico. Una seppur minima obliquità del raggio incidente infatti, si traduce sul radiogramma in una mancata sovrapposizione dei due condili femorali, sia nell’asse X che nell’asse Y, alterando tra l’altro l’entità e la facilità di evidenziazione del flattening sopracitato. Nessuno studio comparativo dei diversi gradi di incidenza in proiezione latero-mediale del ginocchio del cavallo è stato finora effettuato per valutare il grado di efficacia/inefficacia nella rilevazione di questo segno radiografico. A tale scopo, ed a costituire il primo studio della presente tesi, un significativo ed elevato numero di radiografie in latero-mediale di ginocchio di cavalli sono state effettuate e poi classificate e divise in gruppi, in base al grado di obliquità rispetto alla proiezione ortogonale.
Il grado di obliquità è stato valutato misurando la distanza tra i centri di ciascun condilo ed è stato reso proporzionale rapportandolo allo spessore diafisario dello stesso femore sullo stesso radiogramma.
Sia per l’asse X che per l’asse Y sono state create e confrontate cinque categorie di obliquità, allo scopo di individuare quale fra queste è più sensibile all’evidenziazione del frattening. I risultati hanno verificato che il posizionamento del tubo radiogeno che devia entro un range massimo del 5%
latero-medialmente il raggio incidente sull’Asse X, è statisticamente più efficace nel rivelare i flattening (p <0.05). Questo metodo ha dimostrato che il corretto posizionamento sull’asse X per la proiezione latero-mediale è essenziale per la corretta visualizzazione del flattening della cresta trocleare.
Per il secondo studio della tesi sono stati effettuati numerosi esami ultrasonografici di ginocchia di cavalli, focalizzati alla valutazione di eventuale versamento sinoviale.
Il versamento sinoviale, detto anche effusione, è un segno di sinovite nella quale la sintomatologia algica può essere presente ma può anche non manifestarsi affatto. In altri termini, in molti cavalli durante la loro attività agonistica l’effusione articolare al ginocchio può essere presente senza indurre alcuna sintomatologia clinica.
Durante la stagione agonistica, mediante ecografia dell’articolazione femoro-rotulea di cavalli asintomatici, sono stati misurati i volumi dei recessi femoro-tibiale mediale e laterale.
Tutto ciò, per valutare l’efficacia dell’ecografia nel correlare la variazione delle dimensioni dei recessi in presenza/assenza di lesioni subcliniche e dell’influenza dell’attività agonistica. Sono state confrontate due attività differenti di galoppo. Nei cavalli utilizzati nelle corse piane la distensione del recesso femoro-rotuleo laterale dell’arto interno al percorso di gara (p <0,05).
Questo studio ha dimostrato che anche le lesioni sub-cliniche, quindi asintomatiche, possono influenzare negativamente la capsula articolare.
In un terzo studio, il confronto tra due popolazioni eterogenee di cavalli, il cavallo da sella Belga ed il cavallo sardo rappresentato prevalentemente dall’Anglo-Arabo, non ha evidenziato alcuna differenza statisticamente significativa riguardo la prevalenza di flattening della cresta trocleare (p> 0,05). Lo studio ha dimostrato che differenti popolazioni equine hanno la stessa prevalenza di flattening del margine trocleare laterale e che questo segno radiografico non è quindi correlabile a strategie di selezione di razza ma costituisce piuttosto una caratteristica di specie.
1. Introduction
The stifle area is one of the complex articulations of the horse and it is the subject in which the studies presented in this thesis are carried on. The most commonly used imaging methods to scrutinize this area used in equine medicine are radiography and ultrasound.
This thesis is divided in three different studies, one concerning the lateral trochlear ridge flattening in the distal epiphysis of the femur and its prevalence as a radiological sign in different incidences within the lateromedial view in order to correlate the abnormalities in shape and/or osseous radiological density found in this area of the population examined to the radiographic incidence and the presence or absence of femoral trochlear flattening signs. Also, an ultrasound screening of the medial femorotibial and lateral femoropatellar recesses before and after competition in Sardinian gallop horses. And finally a comparison between two groups of skeletally mature Sardinian and sBs stallion candidates, regarding the presence of flattening in the lateromedial view of the stifle area. Shape variations of the femoral trochlea and femoral condyles have been associated with early stages of osteochondrosis (Butler et al., 2008). Magnetic resonance, which would clarify the essence of these images in this region, is not routine, but some in vivo experiences have been recorded in closed 1.5 tesla magnets (Carter, 2011) and open field 0.25 tesla rotating magnets (McKnight, 2012), and ex-vivo studies have been performed since a couple of decades (Holcombe et al., 1995). By the contrary, in human medicine, this technique is widely used for meniscal disease (Bhattacharyya et al., 2003; Costa et al., 2004; De Smet et al., 1994; Helms, 2002; Jerosch et al., 1996; Lerer et al., 2004; Meister et al., 2004; Zanetti et al., 2003). Radiographic examination is routinely used for the examination of the bony structures of this region in horses. Due to specific biomechanical loads and early stages of the bone and articular surface development, the lateral ridge of the femoral trochlea and the medial femoral condyle are prone to develop osteochondral fragmentation of the articular surface (AS-OCF) in all of its degrees (with or without fragment) and juvenile subchondral cyst-like lesions (JSBC) respectively (Denoix et al., 2013).
The trochlear ridge flattening is considered a lesser degree of juvenile osteoarticular anomaly (Butler et al., 2008), and the flattening of the femoral condyles could be considered predisposing factors to a femorotibial pathology. Unfortunately, and due to the technique’s limits, the osseous morphology in bidimensional images in a radiological examination depends in the x-beam incidence. This is due to the fact that two-dimensional images are acquired from a three-dimensional object, one of the main limitations of x-ray interpretation; therefore an oblique positioning of the cassette concerning the scrutinized area generates a distortion and leads to a poor diagnostic quality image (Thrall, 2013).
On the other hand, synovitis is a clinical sign, subtle in some cases which can be evaluated through ultrasound imaging, and an early sign (common to disease), that can or cannot share a role with articular pain (Barrett and Frisbie, 2015).
To approach the reader with the basic anatomy of the stifle area, a brief description is added in the introduction with the structures of interest for the present thesis.
1.1. Anatomy of the Femur
The horse’s femur is relatively short and wide. Its body presents clearly three faces, in which the caudal is long and flattened and shows in the proximal third and in the external side a round imprint for insertions; at the same level, but neighbouring with the medial margin, a weak crest, and distally a rough surfaces in which is projected, obliquely in lateral direction, the deep vascular incision for the femoral artery. The cranial margin is thick. The lateral margin origins from the third trochanter, very robust and slightly curved cranially, and finishes distally in a wide and deep supracondylar fossa in which the lateral margin is formed of a lateral supracondylar tuberosity, in shape of a strong crest. The medial margin, less pronounced, origins in the small trochanter and presents in its middle part a longitudinal roughness for the insertion of the pectineus muscle, and near it, the principal nutritional foramen; slightly distally, the femoral artery sulcus and, with a ridge the medial supracondylar tuberosity which has the shape of a crest. The proximal extremity, the articular head is held by a short neck barely noticeable and its cranio-caudal curvature is more pronounced than the transverse one. The ligamentous fossa is deep and rough; the trochanter, voluminous and prominent presents a summit, a convexity and a distinct ridge. The small trochanter is stretched, rough with the shape of a strong ridge, flattened in cranio-caudal sense. The intercondylar fossa is deep. The
popliteus muscle fossa and the fossa of the extensor are well-marked, and particularly, the
extensor’s fossa is wide and deep. The trochlea is stretched in vertical sense, its ridges are not equal, medial ridge is more proximal and ending in a big and prominent tubercule (Barone, 1980).
Next to the distal extremity, the lateral margin ends with a supracondylar tuberosity with a crested shape that constitutes the lateral border for a supracondylar fossa, which is characteristically deep and marked in equines (Barone, 1980).
The distal extremity, which is of particular interest for this study, is transversally flattened in domestic mammals, especially in ungulates. It presents two articular surfaces, composed by two condyles caudally and a trochlea cranially. The condyles, one medial (condylus medialis) and the other lateral (condylus latreralis) are asymmetric, being thicker the lateral one. Each condyle represents an ovoid segment that in vivo makes contact with the tibial plateau with the interposition of the fibrocartilagenous meniscus. Each condyle is topped in its external face by ligament insertion
deep depression, or intercondylar fossa (Fossa intercondylaris), limited in its most proximal portion by the transversal line (Linea intercondylaris) that runs from one condyle to the other and that separates the popliteal surface. The bottom of this fossa presents ligament attachment sites in which the most accentuated is the one found cranially. The lateral condyle presents in its lateral border, one or two depressions. The smallest is caudal and corresponds to the insertion of the popliteal muscle (Fossa m. poplitei). The other one is placed more cranial, corresponds to the insertion of the extensor muscle (Fossa extensoria) (Barone, 1980).
The femoral trochlea (Trochlea ossisfemoris) is placed cranially and takes contact with the patella. It’s a large pulley formed by a central groove and two uneven ridges. The medial ridge is notoriously higher with a strong tubercule (Tuberculum trocleae ossis femoris) which helps the stability of the pelvic limb (Barone, 1980).
During embryonic development, the femorotibial joint has a similar timeline to stage-matched human embryos. Articular chondrocytes descend from a distinct cohort of progenitor cells located in the embryonic interzone, which is formed in a window of time, probably between days 30 and 50 (Jenner et al., 2014).
1.2. Meniscal Anatomy, structure and role
For each stifle there is a lateral and medial meniscus. They are found within the femorotibial articular capsule, between the femoral and tibial condyles, each on one side, lateral and medial. They correspond to a pair of fibrocartilageneous discs with a semi-lunar shape (Barone, 1981). These C-shaped structures, are delimited by an eccentric border (abaxial) thick and regularly convex, and a concentric border which is thin, concave and incised by the tibial spine. They are constituted by a body and a cranial and caudal horn. They are attached the tibial cranial and caudal intercondylar areas by three short ligaments (tibial cranial and caudal ligaments of the meniscus). Caudally, the lateral meniscus is reattached by the menisco-femoral ligament. The medial meniscus is strongly attached to the deep portion of the medial collateral ligament of the femoro-tibial articulation. The lateral meniscus is separated by the collateral ligament by the popliteal proximal tendon (Barone, 1981; Kummer, 1987; Rantanen and McKinnon, 1998; Renstrom and Johnson, 1990).
Meniscal nutrition occurs through the collateral arteries of the stifle, arriving only to the peripheral attachments (one-third of the meniscus) and articular capsule, whereas deeper portions of the meniscus are nourished by diffusion (Barone, 1981; Day et al., 1985; Rantanen and McKinnon, 1998; Renstrom and Johnson, 1990), except in the foetus where the nutrition is completely haematogenous (Day et al., 1985).
In human based studies it was concluded that femorotibial menisci help the distribution of charges through the articulation by rising the articular contact surface, they prevent degeneration by equalling the charge in weight bearing cartilages, modulate the forces of weight bearing in different situations in which the articulation is bearing weight, also their viscoelastic properties allow a distribution of the pressure by rising the contact surface at higher charges (lowering the pressure) and could have a function also in ameliorating the articular lubrication (DeHaven and Arnoczky, 1994). Innervation of the meniscus is found only in the attachment areas whereas, the body of the meniscus is poorly innervated (Day et al., 1985). In horses, the menisci seem to contribute the craniocaudal and rotatory stability of the articulation (Denoix, 1991). Medial menisci are more frequently affected than lateral menisci at the examination in ultrasonography (Busoni and Audigie, 2013; Denoix, 1994; Denoix, 1996).
1.3. Osteochondrosis
Osteochondrosis (OC), osteochondrosis dissecans (OCD) and osteochondritis dissecans (OCD), and dyschondroplasia (DCP) are terms that, depending on the author, could be considered as synonyms
(Thompson, 2007) even if it can be misleading. Other authors differentiate them as diverse stages for the same initial condition (Jeffcott, 1996; McIlwraith, 2013). Taking in account the primary lesion of osteochondrosis, the term dyschondroplasia is more appropriate (De Busscher et al., 2006; Henson et al., 1997; Jeffcott, 1996; Thompson, 2007), other authors prefer a different terminology according to the type of presentation, under this prism, osteochondrosis dissecans is the term used where there is cartilage and subchondral damage and osteochondritis dissecans, is where there is inflammation clearly present as well as other articular damage (Jeffcott, 1996; McIlwraith, 2013). It is well accepted in literature to be a multifactorial disease, and most likely involves a trauma or biomechanical factor. The biomechanical factor is deduced as there is a clear anatomical predilection for lesion sites, on cartilage that has been weakened by nutritional (such as copper deficit) or hormonal imbalances, vascular disruption or genetic factors (Denoix et al., 2013; Thompson, 2007; Van Weeren and Denoix, 2013; Van Weeren and Jeffcott, 2013; Van Weeren et al., 2003). Furthermore, Denoix et al. suggest a broader term Juvenile osteochondral conditions (JOCC) for those developmental disorders that are related to immature joints or growth plates, as it is a group of conditions with common mechanisms affecting the growing skeleton and specially the endochondral ossification zones, this therefore, includes not only osteochondrosis, but also cuboidal bone disease and various forms of failure of the immature skeleton such as osteochondral collapse or avulsion fracture at insertion sites. Subsequently, and depending on the anatomy, biomechanical load, articular range of motion of the site concerned and the local pressure distribution in the articular surface, this phenomenon can derive in different specific conditions, such as; the
is result of compression in full extension or flexion of an articulation on sharp periarticular margins,
Juvenile subchondral bone cyst-like lesions (JSBC), which could be result of compression (collapse
and subsequent lysis) in places where the articular surface undergoes maximal pressure and/or show failure of endochondral ossification, and Osteochondral fragmentation resulting from ligament
avulsion (LA-OCF), which occurs in entheses when there is a separation of an osteochondral
fragment or in an avulsion of growth cartilage by biomechanical factors (Denoix et al., 2013). Both, AS-OCF and JSBC, are of particular interest in the present study. Most of these lesions involve the epiphesial and metaphyseal complexes of the extremities of the long bones, or the ossifying small bones (Denoix et al., 2013). An even broader term is developmental orthopaedic disease (DOD), which was created in 1986 and a symposium was held by the American Quarter Horse Association and just gathers a vast number of skeletal problems associated with growth and development in foals, including osteochondrosis (in every form), subchondral cystic lesions, physeal dysplasia (physitis), angular limb and flexural deformities, cuboidal bone malformations and wobbler disease (Jeffcott, 1996).
Osteochondrosis is a common and important disease of pigs, horses and large breeds of dogs, but also occurs in cattle, sheep and farmed deer (Thompson, 2007). It is thought that rapid growing subjects are more prone to it. It is characterized by multifocal abnormalities in endochondral ossification involving articular-epiphyseal cartilage complexes and growth plates. It is suggested a common pathogenesis, most likely involving ischemic damage to the growing cartilage, which on the contrary of adult subjects’ cartilage, it depends on blood vessels for its nutrition (Olstad et al., 2007; Thompson, 2007). The process in which blood vessels which feed growing cartilage are gradually replaced by hyaline cartilage in the articular lumens in which they are held is called chondrification. An ischemic insult, leads to necrosis, delayed endochondral ossification, and extension of necrotic cartilage into the subchondral bone. This necrotic cartilage in the articular-epiphyseal cartilage complex induces localized failure of endochondral ossification or becomes invaded by blood vessels from epiphyseal bone, and extends into the subchondral bone as ossification continues in the adjacent, unaffected areas of cartilage. If the lesion is small enough, it will undergo through a spontaneous healing process, by the contrary if it is large enough, clefts form in the deep layers of necrotic cartilage, presumably for biomechanical reasons. This cleft may cause extensive underrunning of the articular cartilage and eventually join with the articular surface creating a flap, which can stay attached or separated, forming a loose body. These loose bodies may survive and enlarge within the joint space, feeding by synovial fluid and even undergo endochondral ossification. Some become attached to the synovial membrane and usually at advanced stage, there are also present inflammatory changes in the synovial fluid and is often referred as osteochondritis
Epidemiologically, osteochondrosis is present in horse population in ranges from 10-25% across different breeds (Jeffcott, 1996) and it is considered the most important entity within the developmental orthopaedic disease complex (McIlwraith, 2013).The appropriateness of conservative versus surgical treatment of osteochondrosis depends both, in location of the lesion and the type of lesion. For the femoropatellar joint, which is subject of this study, it can respond to conservative treatment if the lesions are not fragmented on radiographs and 2 cm or less in length while subchondral cystic lesions of the medial femoral condyle is worth to try intralesional triamcinolone acetate injection, although if unresponsive, surgical curettage with or without mesenchymal stem cell therapy is appropriate (McIlwraith, 2013).
Flattening of the bone contour at certain predilection sites is commonly interpreted as OC but the relationship between flattening and osteochondrotic fragments has not been proven (Butler et al., 2008).
1.4. Osteoarthritis
It is considered as a group of disorders characterized by a common end-stage: progressive deterioration of the articular cartilage accompanied by changes in the bone and soft tissues of the articulation (McIlwraith, 2005). It is related to the cause of 60% of lameness in the horse according to an U.S. survey (Caron and Genovese, 2003).
The process does not affect uniquely the articular cartilage, but the entire articulation: subchondral bone, ligaments, capsule, synovial membrane, and periarticular tissues.
Synovitis (inflammation of the synovial membrane) is always present in all osteoarthritis entities in the horse (McIlwraith, 2005; Trumble et al., 2001) and it is an important factor generating pain through joint effusion, swelling, and/or fibrosis that will activate mechanoreceptors in the joint capsule, and through direct chemical stimulation of nociceptors (Van Weeren, 2015).
Synovial fluid originates from blood plasma, it is macroscopically yellowish and due to the viscosity given by hyaluronic acid, has very different rheological properties. It has a limited cellular component (<500 cells/mm3), mainly lymphocytes and other bone marrow derived mononuclear cells including macrophages (Van Weeren, 2015). This filtered product derived from the bloodstream which seems to be driven by hydrostatic and osmotic pressures’ differences between plasma and synovial fluid, allows it not only an efficient supply of nutrients, but also a removal of waste products from the avascular structures present in joints (Toddhunter, 1996). Moreover, hydrostatic pressure differences largely dependent on joint angle, therefore, locomotion plays an important role. In a study conducted in rabbits, intraarticular pressure varied from -2 to -6 cm H2O
(subatmospheric) (Knox et al., 1988). This aids plasma filtration towards the articulation, although it depends on the joint position (Van Weeren, 2015).
Joint effusion, where the synovial fluid is markedly increased, can be associated with histopathologic changes, but without other clinical signs, including lameness (Brink et al., 2010). Particularly in the stifle area, there are three synovial compartments: femoropatellar, medial femorotibial and lateral femorotibial. A cadaveric study in horses showed that when injecting femoropatellar joint, the communication was 60% towards the medial femorotibial joint and 3% towards the lateral femorotibial. When injecting the medial femorotibial joint, 80% of the cases communicated with the femoropatellar joint and none with the lateral femorotibial. Finally, when injecting the lateral femorotibial joint, 1% communicated with the femoropatellar joint and none with the medial femorotibial joint. No specimen communicated between the three synovial compartments (Vacek et al., 1992). In a practical way, it is assumed that the articulations do not communicate (Barrett and Frisbie, 2015; Reeves et al., 1991).
1.5. X-Ray Imaging of the Stifle Area
In this study, the view that was evaluated was the Lateromedial in standing position, although for the complete evaluation of the area, oblique views (Caudal 60° lateral-craniomedial oblique and Cranioproximal-craniodistal oblique) and caudocranial are necessary (Butler et al., 2008).
Although lateral and medial trochlear ridges are similar on size at birth, after the second month of life the medial ridge becomes more prominent than the lateral ridge. Also, their contour is irregular due to subchondral ossification, situation that can extend up to the fifth month of life. The
Femoropatellar Lateral Femorotibial Medial Femorotibial 60% 80% 1% 3%
Image 1: Communication between the femoropatellar and medial and lateral femoro tibial joints in horses (Vacek et al., 1992).
apophyseal-metaphyseal physis is seen on lateromedial views as an oblique lucent line of irregular width, and it closes within 9 and 12 months of age, whereas the proximal tibial physis (epiphyseal-metaphysealphysis) between 24 and 30 months of age (Butler et al., 2008) this information will be important in order to estimate the maturity of the subjects in the present study.
Flattenings of the lateral trochlear ridge are often found in a caudal 60° lateral-craniomedial oblique view and are found usually in its middle third and vary on degree of extension up to two thirds of the ridge, with or without subchondral radiolucent defects and sclerotic margins (Butler et al., 2008). With the purpose of objectivising the clinical observation, ratios are used in some occasions in radiology, especially in places where it is difficult to non-invasively place an object to use as reference in order to correct a measurement, as could be done in anatomical areas that allow such procedure. In such cases, establishing a constant anatomical structure as reference, distances in the same radiograph allows measurements to be corrected proportionally to the referent size. Ratios have been previously used in studies defining the vertebral canal width, and the ratio with the body of the measured vertebra (Hahn et al., 2008).
1.6. Ultrasonographic imaging of the medial meniscus:
The medial meniscus of the horse presents a homogeneous architecture and echogenicity, in a triangular cut, the shape is triangular, whereas the lateral meniscus is trapezoidal. Anomalies in this zone can be detected through the visualization of changes in shape, echogenicity, position, including its own ligaments and distension of femoral recesses that communicate directly with the mentioned structure. Changes in echogenicity, size, shape and position of the meniscus are considered as signs of meniscal tears, calcifications, collapse and prolapse (Denoix, 1994; McIlwraith and Trotter, 1996).
Hypoechogenic lesions were interpreted as interruption of fibres, collapse, oedema, fibroplasia or necrosis (Denoix, 1996; Denoix et al., 2002; Denoix et al., 1996; McIlwraith and Trotter, 1996; Rantanen and McKinnon, 1998), while hyperechogenic images were reported as zones of osseous metaplasia (Denoix, 1996; Denoix et al., 1996). Histologically, hypoecogenic zones in the medial meniscus correspond to architectural changes that could be associated to degeneration or regeneration phenomena (De Busscher, 2007)
2. Objectives and hypothesis
This study is divided in three parts, one which takes in consideration the lateral trochlear ridges in the femoral distal epiphysis, a second one taking in consideration the effusion present during race season in the femorotibial joint and the presence or absence of medial meniscal hypoechoic zones, and the last one as an epidemiological study of the prevalence of flattenings in Sardinian horses, then comparing descriptively this information with the one withheld from the first study on Walloon Belgian Warmblood Studbook (sBs) horses.
In the first study, the objective is to understand if the X-Ray positioning, for the different accepted lateromedial radiographs in an OCD screening service, has an influence in the detection of flattenings in the first two proximal thirds of the lateral ridge of the trochlea of the distal epiphysis of the femur in the horse.
Study I:
“Influence of the variations in the stifle lateromedial projection in the detection of flattenings in the horse”.
The objective of the first study is to understand if the positioning of the X-Ray tube generator within the lateromedial view is altering the diagnosis of the radiological sign of flattening in the lateral trochlear ridge, in the stifle.
Hypothesis: There is an incidence, among the possibilities within the lateromedial view which is more effective in the visualization of flattenings in the lateral trochlear ridge in the horse’s distal femoral epiphysis.
Study II:
“Ultrasonographic screening in the stifle area: Influence between structural abnormalities and recess distention.”
In the second study, the objective is to understand if the effusion is influenced by the presence or absence of findings in the ultrasonographic examination in sound horses.
Hypothesis: There is a larger medial femorotibial or femoropatellar recess measurement within horses with ultrasonographic findings in the stifle area after race.
“Comparison between Sardinian horses and sBs candidate stallions in the finding of flattenings in the femoral lateral trochlear ridge of the distal femoral epiphysis”
Finally, in the third study, the objective is to compare populations of horses (sBs and Sardinian horses) and to describe the Sardinian horse’s population in terms of presence or absence of flattenings in the lateral trochlear ridge.
Hypothesis: There is a higher prevalence of flattenings in the lateral trochlear ridge in a group of Sardinian horses than in horses presented for the sBs expertise.
3. Study I: “Influence of the variations in the stifle lateromedial projection in the detection of flattening in the femoral lateral trochlear ridge of the distal femoral epiphysis”
3.1. Material and Methods
3.1.1. Animals
The population studied consists on horses derived to the Service of Medical Imaging (Service d’Imagerie Médicale) of the University of Liege. For these subjects, lateromedial radiographs were taken in the stifle area, either unilaterally or bilaterally these radiographs were considered in the study if the distance between the lateral and medial femoral condyles did not exceed the 2 cm distance (uncorrected). These horses were presented to the equine clinic of the University of Liege with the motive of consultation of lameness, in whose an upper hind limb origin was suspected after the clinical evaluation, and also candidate stallions presented for the admission to the stud-book sBs (Royal Belgian Sports Horse Society), between the years 2009 and 2011, in which bilateral routine lateromedial views are taken to the stifle area. Radiographs presenting fractures, fragmentation in the lateral ridge of the femoral trochlea, wound suspicion and non-weight bearing limbs were excluded from the study as well as images obtained from trait breeds and young foals. Distance between the plate and the x-ray generator was always the focal point was optimal in the cassette (indicated by the laser guide).
3.1.2. Equipment
An Agfa CR 25.0 indirect radiology unit was used, a 24x30 cm cassette was placed medially to the stifle and the operators were dressed with leaded vest, leaded thyroid protector and, additionally, a leaded pair of gloves to the operator holding the cassette.
Ginkgo CADx® 3.7.0.1465.37 32 bits software was used to perform measurements and analysing the radiographic images.
3.1.3. Measurements and data
In this part of the study, the objective is to classify as objectively as possible the degree of positioning of the X-Ray generator taking as a basis an exact lateromedial projection, therefore, where both femoral condyles are superimposed as even as possible. To achieve this, a new method, in which distance between condyles or intercondylar distance is measured, was designed. All radiographs where orientated equally, with the proximal aspect in the upper side, and the cranial aspect in the left side of the screen (Fig. 1). In these radiograms, which correspond to a Cartesian coordinate system, X=0 is placed in the leftmost side of the image (most cranial position) and X=∞
in the rightmost side of the image (most caudal position). On the other hand, Y=0 is placed in the uppermost side of the image (most proximal position) and Y=∞ in the lowermost side of the image. In each radiograph, two circles of equal diameter were drawn matching, in their lower periphery, with the medial femoral and the lateral femoral condyles’ distal borders respectively. The coordinates of the centres of both circles, expressed in pixels, were recorded and named X and Y for the medial femoral condyle and X’ and Y’ for the lateral femoral condyle (Figs 2 and 3, expressed as Centre (I) for each circle).
Image 2, 3 and 4: Acquisition of the femoral condyles’ coordinates, from left to right, before acquisition, acquiring the lateral condyle coordinates and medial condyle coordinates.
Each circle’s centre has its own coordinates (X and Y). To calculate the distance between both points, it is assumed that the distance between them corresponds to a hypothenuse, in which the cathetuses, correspond to the subtraction between X and X’ coordinates (originating from the medial and lateral condyles respectively), and the subtraction between Y and Y’ coordinates, as the second cathetus (Cathetus Y). To calculate the hypotenuse, Pythagorean Theorem was applied, where its square is equal to the sum of the square of each cathetuses (𝑎𝑎2+ 𝑏𝑏2 = 𝑐𝑐2)
(Figs 4, 5 and 6). This operation gave the absolute distances between lateral and medial condyles (expressed therefore in pixels).
Images 5 and 6: Calculating the distance between the coordinates acquired.
Image 7: Lateromedial radiograph of the stifle with a different X-ray tube position.
Since pixels represent absolute values and correspond to a variable measure of length, the intercondylar distance calculated was expressed as a percentage of the diaphysis’s width. To achieve this, the width of the femoral diaphysis had to be calculated also. The selected place for this measurement was located immediately distal to the supracondylar fossa. A perpendicular line to the cranial margin of the femoral diaphysis was drawn, which gave a new set of X and X’ (giving one cathetus) and also Y and Y’ (giving a second cathetus), permitting to repeat the procedure previously explained through Pythagoras theorem.
Cathetus Y
Cathetus X
Calculated Hypotenuse (Intercondylar Distance)
a
b c
Image 8: Acquisition of the coordinates for the diaphyseal width measurement.
As explained previously, due to the nature of the Cartesian coordinate system in this software, it was possible to estimate if the position of the X-Ray generator was either displaced cranially, caudally, proximally or distal to the “exact” lateromedial projection, where X-X´ and Y-Y´ subtractions equal zero. For this reason, if the resulting value for the subtraction is positive in the X axis, then the X coordinate is located caudal to the X’ coordinate. On the contrary, if the resulting value is negative, then the X coordinate is cranial to the X’ coordinate. On the other hand, in the Y axis’ subtraction, if the resulting value was positive, then the Y coordinate would be distal and the Y’ point would be proximal. If the resulting value was negative, then the Y point would be proximal and the Y’ point would be distal. With this information the type of projection was estimated in 5 different groups, which were proportioned to the diaphysis’s width. The results of this operation were labelled as following: “Too cranial” for negative X-axis values lower than -15%, “Cranial” for negative values from -15% to less than -5%, “Correct” for values from -5% to less than 5%, “Caudal” for values from 5% to less than 15% and finally, “Too Caudal” for values from 15% or more. As for the Y-axis, they were labelled as following: “Too proximal” for negative Y-axis values lower than -15%, “Proximal” for negative values from -15% to less than -5%, “Correct” for values from -5% to less than 5%, “Distal” for values from 5% to less than 15% and finally, “Too Distal” for values from 15% or more.
Lateromedial Projection:
Image 9: Correct lateromedial projection
Correct
X-Axis Variations
Image 10: Too Cranial Image 11: Cranial Image 12: Caudal Image 13: Too Caudal
Y-Axis Variations
Image 14: Too Proximal Image 15: Proximal Image 16: Distal Image 17: Too Distal
3.1.4. Interpretation of the images
Images were carefully analysed and labelled subjectively as “FLAT” in case a flattening of the lateral ridge of the trochlea was found, or “OK” if there was no visible defect on the radiographs. Defects were not defined according to their magnitude, and those considered were in the proximal and middle thirds of the lateral trochlear ridge:
• Optical flattening, therefore a structure’s outline that seems more flat than rounded.
• Sites of sclerosis in the subchondral bone area in the lateral trochlear ridge.
• Radiolucent sites in the lateral trochlear ridge.
3.1.5. Statistical analysis
Normality distribution of the collected variables was explored with the Shapiro-Wilk normality test. Mean with standard deviation (SD) and number with percentage frequency were used to describe quantitative and categorical variables respectively. Chi-square and Fisher Exact test were performed to assess differences of flattening between X and Y axis positioning, right and left side. Logistic regression was carried out to evaluate the association of flattening with positioning. Statistical analysis was carried out using STATA®13 (StataCorp, College Station, TX, USA).
3.2. Results
Does the X-Ray generator position in the combination between X axis possibilities (“Too cranial”, “Cranial”, “Correct”, “Caudal”, “Too caudal”) and Y axis possibilities (“Too proximal”, “Proximal”, “Correct”, “Distal”, “Too distal”)?
Which positioning has the greater incidence in the appearance of flattening? Which positioning has the least incidence in the appearance of flattening?
Positioning Flattening, n (%) X Axis Too Cranial 0/7 (0.0) Cranial 6/40 (15.0) Correct 29/94 (30.9) Caudal 11/66 (29.1) Too Caudal 2/19 (4.2) Y Axis Too Proximal - Proximal 4/20 (8.3) Correct 24/99 (24.2) Distal 17/94 (18.1) Too Distal 3/13 (5.7) Table 1
Table 1 above displays the distribution of flattenings in the stifles analysed according to each type of incidence in the X and Y axis. From a total of 226 stifles examined, for the X-Axis, 7 radiographs qualified as “Too Cranial”, 40 as “Cranial”, 94 as “Correct”, 66 as “Caudal” and 19 as “Too Caudal”. On the other hand, for the Y-Axis, no radiographs qualified as “Too Proximal”, 20 as “Proximal”, 99 as “Correct”, 94 as “Distal” and 13 as “Too Distal”. Observing the findings of
flattenings in the different X-Axis projections, they were not found in the “Too Cranial” projection, 6 times in the “Cranial” projection, 29 times in the “Correct” projection, 11 times in the “Caudal” projection and 2 times in the “Too Caudal” projection. Analysing in the same way for the Y-Axis, 4 flattenings were found in the “Proximal” projection, 24 in the “Correct” projection, 17 in the “Distal” projection and, finally 3 in the “Too Distal” projection. Prevalence was calculated for each projection.
Graph 1
Graph 1 above explains the prevalence for each group in the X-Axis different positions in which the X-Ray tube was placed when taking the radiographs, most of the proportion of flattenings within each group, were found in the views which resembled most a correct lateromedial projection.
0,00 0,05 0,10 0,15 0,20 0,25 0,30 0,35
Too Cranial Cranial Correct Caudal Too Caudal
Prevalence by X-Axis Positioning
Prevalence by X-Axis Positioning
Graph 2
Graph 2 above explains the prevalence for each group in the Y-Axis different positions in which the X-Ray tube was placed when taking the radiographs, most of the proportion of flattenings within each group, were found in the views which resembled most a correct lateromedial projection.
0,00 0,05 0,10 0,15 0,20 0,25 0,30 Too Distal Distal Correct Proximal Too Proximal
Prevalence by Y-Axis positioning
Prevalence by Y-Axis positioning
Positioning Odds Ratio IC 95% p-value X Axis Too Cranial 1 - - Cranial 0.6 0.2 - 1.5 0.298 Correct 2.7 1.4 - 5.1 0.003 Caudal 0.7 0.3 - 1.4 0.292 Too Caudal 0.4 0.1 - 1.9 0.250 Y Axis Too Proximal 1 - - Proximal 0.9 0.3 - 2.9 0.896 Correct 1.4 0.7 - 2.6 0.316 Distal 0.7 0.4 - 1.4 0.344 Too Distal 1.1 0.3 - 4.3 0.861 Table 2
The table above represents an Odds Ratio table for the data described previously; in this case the most statistically significant group (Correct in the X-Axis) shows that there is a chance of 2.7 in 1 (O.R.=2.7) to find a flattening with this projection (p<0.05). The other values above 1 found in the Y-Axis “Correct” (O.R.=1.4) and “Too Distal” (O.R.=1.1), therefore that have a higher possibility to find flattening, are not statistically significant (p>0.05).
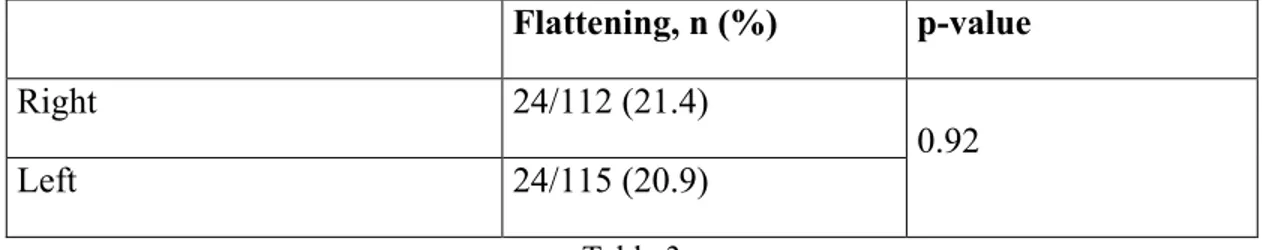
Are there differences between the presence of flatttening between left and right limbs? Flattening, n (%) p-value Right 24/112 (21.4) 0.92 Left 24/115 (20.9) Table 3
Table 3 above shows that the proportion in which flattenings are found retrospectively in this study is similar between right (21.4%) and left (20.9%) hind limbs, with no statistical difference between both sides (p>0.05).
Flattening Odds Ratio [95% Conf. Interval] p-value
Left side 1.0 0.5 - 1.8 0.918
Table 4
Table 4 above represents an Odds Ratio table for the data described previously, in this case there is an equal chance (O.R.=1) to find flattenings in the left side
Right
Positioning Flattening, n (%) p-value
X Axis Too Cranial 0/5 (0.0) 0.58 Cranial 2/19 (10.5) 0.36 Correct 16/44 (36.4) 0.002 Caudal 6/33 (18.2) 0.59 Too Caudal 0/11 (0.0) 0.12 Y Axis Too Proximal - - Proximal 2/9 (22.2) 1.00 Correct 13/45 (28.9) 0.12 Distal 8/51 (15.7) 0.18 Too Distal 1/7 (4.2) 1.00 Table 5
Table 5 above displays the distribution of flattenings in the right hind limb stifles analysed according to each type of incidence in the X and Y axis. From a total of 112 stifles examined, for the X-Axis, 5 radiographs qualified as “Too Cranial”, 19 as “Cranial”, 44 as “Correct”, 33 as “Caudal” and 11 as “Too Caudal”. On the other hand, for the Y-Axis, no radiographs qualified as “Too Proximal”, 9 as “Proximal”, 45 as “Correct”, 51 as “Distal” and 7 as “Too Distal”. Observing the findings of flattenings in the different X-Axis projections, they were not found in the “Too Cranial” projection, 2 times in the “Cranial” projection, 16 times in the “Correct” projection, 6 times in the “Caudal” projection and no flattenings were found in the “Too Caudal” projection. Analysing in the same way for the Y-Axis, 2 flattenings were found in the “Proximal” projection, 13 in the “Correct” projection, 8 in the “Distal” projection and finally 1 in the “Too Distal” projection. Prevalence was calculated for each projection.
Graph 3
Graph 3 above explains the prevalence for each group in the X-Axis different positions for the right stifles, in which the X-Ray tube was placed when taking the radiographs in the right hinds, most of the proportion of flattenings within each group, were found in the views which resembled most a correct lateromedial projection.
0,00 0,05 0,10 0,15 0,20 0,25 0,30 0,35 0,40
Too Cranial Cranial Correct Caudal Too Caudal
Prevalence by X-Axis Positioning (Right
Hind)
Prevalence by X-Axis Positioning (Right Hind)
Graph 4
Graph 4 above explains the prevalence for each group in the Y-Axis different positions for the right stifles, in which the X-Ray tube was placed when taking the radiographs in the right hinds, most of the proportion of flattenings within each group, were found in the views which resembled most a correct lateromedial projection.
0,00 0,10 0,20 0,30 0,40 Too Distal Distal Correct Proximal Too Proximal
Prevalence by Y-Axis Positioning (Right
Hind)
Prevalence by Y-Axis Positioning (Right Hind)
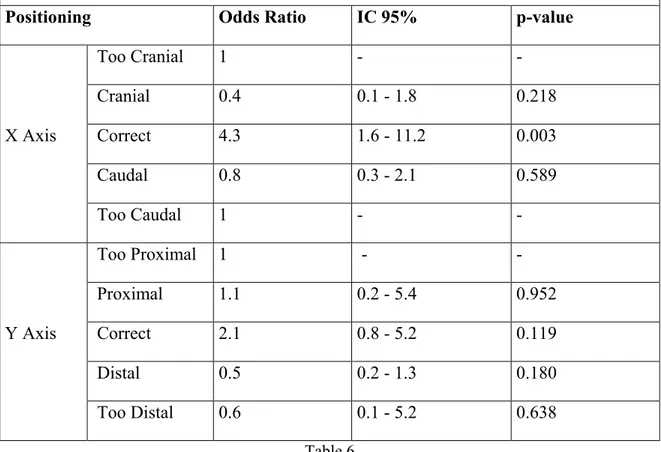
Right side
Positioning Odds Ratio IC 95% p-value
X Axis Too Cranial 1 - - Cranial 0.4 0.1 - 1.8 0.218 Correct 4.3 1.6 - 11.2 0.003 Caudal 0.8 0.3 - 2.1 0.589 Too Caudal 1 - - Y Axis Too Proximal 1 - - Proximal 1.1 0.2 - 5.4 0.952 Correct 2.1 0.8 - 5.2 0.119 Distal 0.5 0.2 - 1.3 0.180 Too Distal 0.6 0.1 - 5.2 0.638 Table 6
Table 6 above represents an Odds Ratio table for the data described previously; in this case the most statistically significant group (“Correct” in the X-Axis) shows that there is a chance of 4.3 in 1 (O.R.=4.3) to find a flattening with this projection (p<0.05) in right hind limbs. The other values above 1 found in the Y-Axis “Correct” (O.R.=2.1) and “Proximal” (O.R.=1.1), therefore that have a higher possibility to find flattening, are not statistically significant (p>0.05).
Left
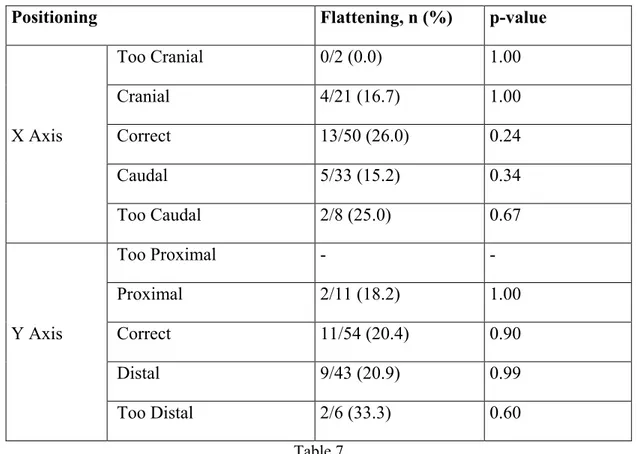
Positioning Flattening, n (%) p-value
X Axis Too Cranial 0/2 (0.0) 1.00 Cranial 4/21 (16.7) 1.00 Correct 13/50 (26.0) 0.24 Caudal 5/33 (15.2) 0.34 Too Caudal 2/8 (25.0) 0.67 Y Axis Too Proximal - - Proximal 2/11 (18.2) 1.00 Correct 11/54 (20.4) 0.90 Distal 9/43 (20.9) 0.99 Too Distal 2/6 (33.3) 0.60 Table 7
Table 7 above displays the distribution of flattenings in the left hind limb stifles analysed according to each type of incidence in the X and Y axis. From a total of 114 stifles examined, for the X-Axis, 2 radiographs qualified as “Too Cranial”, 21 as “Cranial”, 50 as “Correct”, 33 as “Caudal” and 8 as “Too Caudal”. On the other hand, for the Y-Axis, no radiographs qualified as “Too Proximal”, 11 as “Proximal”, 54 as “Correct”, 43 as “Distal” and 6 as “Too Distal”. Observing the findings of flattenings in the different X-Axis projections, they were not found in the “Too Cranial” projection, 4 times in the “Cranial” projection, 13 times in the “Correct” projection, 5 times in the “Caudal” projection and 2 times in the “Too Caudal” projection. Analysing in the same way for the Y-Axis, 2 flattenings were found in the “Proximal” projection, 11 in the “Correct” projection, 9 in the “Distal” projection and finally 2 in the “Too Distal” projection. Prevalence was calculated for each projection.
Graph 5
Graph 5 above explains the prevalence for each group in the X-Axis different positions for the left hinds, in which the X-Ray tube was placed when taking the radiographs in the right hinds, most of the proportion of flattenings within each group, were found in the “Correct” and “Too Caudal” views. 0 0,05 0,1 0,15 0,2 0,25 0,3
Too Cranial Cranial Correct Caudal Too Caudal
Prevalence by X-Axis Positioning (Left Hind)
Prevalence by X-Axis Positioning (Left Hind)
Graph 6
Graph 6 above explains the prevalence for each group in the X-Axis different positions for the left hinds, in which the X-Ray tube was placed when taking the radiographs in the right hinds, most of the proportion of flattenings within each group, were found in the “Too Proximal” and “Too Distal” views. 0 0,05 0,1 0,15 0,2 0,25 0,3 0,35 Too Distal Distal Correct Proximal Too Proximal
Prevalence by Y-Axis Positioning (Left
Hind)
Prevalence by Y-Axis Positioning (Left Hind)
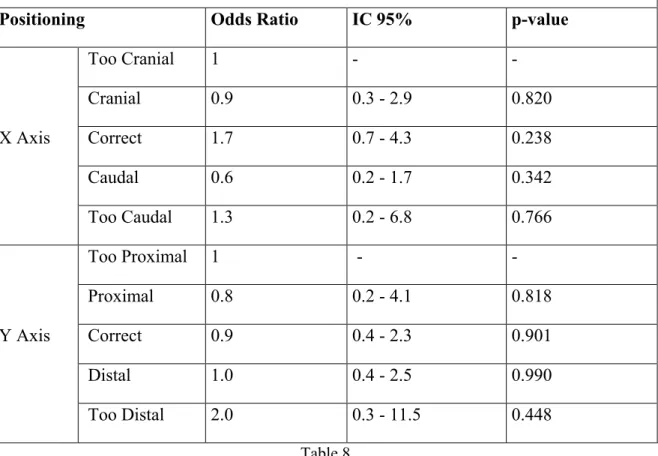
Left side
Positioning Odds Ratio IC 95% p-value
X Axis Too Cranial 1 - - Cranial 0.9 0.3 - 2.9 0.820 Correct 1.7 0.7 - 4.3 0.238 Caudal 0.6 0.2 - 1.7 0.342 Too Caudal 1.3 0.2 - 6.8 0.766 Y Axis Too Proximal 1 - - Proximal 0.8 0.2 - 4.1 0.818 Correct 0.9 0.4 - 2.3 0.901 Distal 1.0 0.4 - 2.5 0.990 Too Distal 2.0 0.3 - 11.5 0.448 Table 8
Table 8 above represents an Odds Ratio table for the data described previously; in this case there are no statistically significant groups. The values above 1 found in the X-Axis “Correct” (O.R.=1.7) and “Too Caudal” (O.R.=1.3), and in the Y-Axis “Too Distal” (O.R.=2.0), therefore that have a higher possibility to find flattening, are not statistically significant (p>0.05).
3.3. Discussion
Due to the cost and time consumed in other available imaging methods (Nuclear Magnetic Resonance, Ultrasound, Computerized Tomography, Scintigraphy), radiographs of the stifle area remain as one of the first choices when the purpose of the study is to screen a large population of horses, even if some of these methods have been proven to be more sensitive (Bourzac et al., 2009). Also, in advantage of a series of ultrasound and magnetic resonance studies, a radiograph, gives in one image a global idea of the whole area.
Moreover, when it is only one projection to choose (in order to consider a screening which would give most information) for this anatomical area and concerning OCD formations in the lateral trochlear ridge, probably the safest and which gives an acceptable degree of information overall, is the lateromedial view of the stifle.
During the elaboration of this study, several difficulties appeared from the initial question proposed: Are flattenings, in some degree, a consequence of the incidence applied when taking the radiograph? To the moment, the interpretation of the images and the degree of positioning of the X-Ray generator in the X-axis and Y-axis was subjective in the many (infinite) degrees that are possible to find between a craniolateral-caudomedial projection and a lateromedial projection, and a craniomedial-caudolateral and lateromedial projection. In this sense, and due to the particular anatomy of the equine stifle, a method in order to objectivise this information was created, dividing it according to the distance corrected to the own diaphysis. This method, although apparently tedious, is in fact simple and practical for these needs.
Theoretically, the incidence would mainly show different portions of the anatomy but, due to the presence of the horses’ abdomen (and behaviour) which does not always allow a positioning of the cassette in a perpendicular disposition to the direction of the x-ray beam, there is, most of the times certain degree of image deformation, as explained in the introduction. Moreover, horses usually do react to tickling sensations (given by the x-ray cassettes) so perfect contact with the medial face of the stifle area is not always possible, generating a magnification of the image in the places where the cassette is farthest from the skin. These situations result in an image that stretches or shrinks partially and could generate the impression of a visual flattening of the surface, although it should be accompanied by a disproportion of the whole image, and not a real limb deformity. It is, therefore possible to elucidate this question by positioning an anatomical piece in different cassette/x-ray tube generator alignment in a future ex-vivo study.
Due to the retrospective nature of this study, it was not possible to revaluate a stifle in different projections when the flattening is detected, but we can be sure that due to the femoral trochlear
documented that positioning of the x-ray beam from far too cranially can give ill-defined images of the lateral trochlear ridge (Butler et al., 2008). This occurs due to the superimposition of the proximal portion of the lateral femoral ridge border and the trochlear groove, situation which is accentuated not only in too cranial views, but also in cranial, proximal and too proximal projections (as defined in this study), giving difficulties to correctly evaluate the presence of flattening in the lateral trochlear ridge. Unfortunately, and possibly due to correction at the time of acquisition of these radiographs, these projections were the less present in the study so statistically were difficult to confirm this hypothesis. It should be noticed that these situations occur also when the horse is clinically sedated, and the hind limbs (in order to give stability) are placed in abduction. Once again, a proper management of the sedation and a correct positioning of the subject’s hind limbs should be thoroughly carried on. To the benefit of those colleagues and technicians who appreciate the exact exposures, this study shows that the correct incidence (therefore with a maximum of 5% corrected to the diaphysis’s width in any sense), is still the most diagnostic to detect flattening sign in the horse stifle, and most specifically, correct in the X-Axis, where there are 2.7 times chances in finding a flattening (p<0.05). Although, and as a personal opinion, even if the Odds Ratio study explains which of the tests is statistically acceptable, it is not possible, due to the limited size of the sample (N=226), and specially, because of its uneven distribution, to agree that every deviation of the lateromedial view is invalid, but the author believes that deviations that do not share an anatomical superposition with the trochlear groove; “Correct” in both axes (X-Axis and Y-Axis), “Distal” and “Caudal” projections, or their combinations should be considered as diagnostically more acceptable than those which suffer of overlapping between the lateral ridge and the femoral groove (cranial, too cranial, proximal, too proximal or a combination of those).
Although the prevalence in the descriptive analysis was higher in the “Too Distal” incidence in the Y-Axis positioning of the left limb, it is probably related to the low number of radiographs made in this projection and the coincidence that flattenings were prevalent.
It is possible that a higher number of cases, especially in the least frequent views (too cranial/too caudal/too proximal/too distal) would allow a further clarification for these inquiries, but as they are aesthetically unacceptable, mainly because they look less like a lateromedial view, it is unlikely to have them in a retrospective study.
3.4. Conclusion
A strict lateromedial projection has significantly more chances to detect flattening in the lateral trochlear ridge of the horse’s distal femoral epiphysis.
Further screening with a larger number of views near the limits (too caudal, too cranial, too proximal, too distal) could statistically confirm the results obtained with the descriptive analysis.
4. Study II
Ultrasonographic screening in the stifle area: Influence between structural abnormalities and recess distention.
4.1. Material and Methods 4.1.1. Animals
The population studied consists on horses derived to the Veterinary Didactic Hospital (Ospedale Didattico Veterinario), from the department of veterinary medicine of the University of Sassari through the years 2012 to 2014. Two groups were studied; one corresponding to horses used for the local traditional festivity “Sartiglia” and the other of flat race horses. No hair clipping was possible, but the area was intensively washed, then poured with ethylic alcohol and the probe was covered with ultrasonographic gel. A standardized screening was formulated in which the Order for the structures screening was the following:
• Left hind limb: Medial Trochlear Ridge, Intermediate Patellar Ligament, Lateral Trochlear Ridge, Lateral Femoropatellar Recess, Medial Femorotibial recess, Medial Meniscus, Lateral Meniscus.
• Right hind limb: Medial Trochlear Ridge, Intermediate Patellar Ligament, Lateral Trochlear Ridge, Lateral Femoropatellar Recess, Medial Femorotibial recess, Medial Meniscus, Lateral Meniscus.
Horses that participated in the “Sartiglia” competition were screened once, whereas gallop flat race horses were screened before and after each race, and followed through their competition. If a horse was retired due to injuries, the subject was removed from the study. Horses with osteochondral fragmentation were also excluded from the study. Illegible images due to poor contact in horses with abundant winter coat were excluded.
4.1.2. Equipment
An Esaote MyLab One with a linear multifocal 6.5-12 mHz probe (Model: SL3323) was used. Frecquency was set at 10 mHz and ethilic alcohol and water based ultrasonographic gel were applied to the scanned area. No clipping was permitted by owner’s decision.
Esaote® Mylab Desk® 8.0 (build 9.0.209.0), software was used to perform measurements and analysing the ultrasonographic images.
4.1.3. Acquisition of images, measurements and data
Each recess was measured from the most superficial to the most internal aspect, after each image was taken with the ultrasound machine doing as less pressure to the skin as possible. Data was written and an Excel® table was compiled.
Image 18: Medial femorotibial recess Image 19: Medial femorotibial recess with echogenic images in the interior
Image 20: Lateral femoropatellar recess Image 21: Larger lateral femoropatellar recess
4.1.4. Interpretation of the images
Images were carefully analysed and labelled subjectively for each structure studied:
• Intermediate patellar ligament: It was transversally scanned from its proximal to its distal attachment. Variations such as enlargement associated with anechogenic zones were noted. • Lateral trochlear ridge: It was transversally scanned through its surface; any variations in
shape were noted.
• Lateral femoropatellar recess: It was scanned with the probe in a sagittal plane of the limb, with the minimal pressure against the skin that allowed the visualization of it, distance between its abaxial and axial margins was noted and also presence or absence of fibrin. • Medial femorotibial recess: It was scanned with the probe aligned in a longitudinal plane of
the limb, with the minimal pressure against the skin that allowed the visualization of it, distance between its abaxial and axial margins was noted and also presence or absence of fibrin.
• Medial meniscus: It was scanned with the probe aligned in the longitudinal plane of the limb; changes in echogenicity or changes in shape were noted.
• Lateral meniscus: It was scanned with the probe aligned in the longitudinal plane of the limb; changes in echogenicity or changes in shape were noted.
4.1.5. Statistical analysis
Normality distribution of the collected variables was explored with the Shapiro-Wilk normality test. Mean with standard deviation (SD) and number with percentage frequency were used to describe quantitative and categorical variables respectively. Statistical differences of lateral and medial femoropatellar recess distension between horses with and without trochlear ridge irregularity were evaluated performing the Student T test. Statistical analysis was carried out using STATA®13 (StataCorp, College Station, TX, USA).
4.2. Results
Do subjects with irregularities in the femoral trochlea present a statistically significant distention when scanned after the race?
With Trochlear Ridge Irregularity Without Trochlear Ridge Irregularity p-value Anatomic Area Left Hind Limb
Lateral Femoropatellar Recess
Distention (cm), mean (SD) 0.41 (0.19) 0.40 (0.14) 0.88 Medial Femorotibial Recess
Distention (cm), mean (SD) 0.73 (0.27) 0.78 (0.28) 0.69
Anatomic Area Right Hind Limb
Lateral Femoropatellar Recess
Distention (cm), mean (SD) 0.46 (0.22) 0.20 (0.21) 0.03 Medial Femorotibial Recess
Distention (cm), mean (SD) 0.72 (0.31) 0.56 (0.29) 0.25
Table 9
Table 9 above a comparison is made between distention (and standard deviation of the distention value) measurements in subjects with trochlear ridge irregularity and subjects without trochlear ridge irregularities, in limbs, right and left for horses before and after the gallop race. Analysing the left hind limb, the differences in distention between the horses with trochlear ridge irregularity in the lateral femoropatellar recess (0.41±0.19 cm versus 0.40±0.14 cm) and medial femorotibial recesses(0.46±0.22 cm and 0.20±0.21 cm) are minimal, and without statistical significance (p>0.05). On the contrary, for the right hind limb group, there is a significant (p<0.05) difference between the mean values, being larger in those subjects with trochlear ridge irregularity (0.46±0.22 cm) compared with those without trochlear ridge irregularity (0.20±0.21 cm).